Article

Fireground Recognition and Spatio-Temporal Scalability Research Based on ICESat-2/ATLAS Vertical Structure Parameters

1
Fangshan County Forestry Bureau/Fangshan County State-owned Hubao Forest Farm, Lvliang 033100, China
2
College of Forestry, Southwest Forestry University, Kunming 650224, China
3
Yunnan Provincial Surveying and Mapping Archives/Yunnan Provincial Basic Geographic Information Center, Kunming 650224, China
*
Authors to whom correspondence should be addressed.
Forests 2024, 15(9), 1597; https://doi.org/10.3390/f15091597
Submission received: 1 August 2024 / Revised: 1 September 2024 / Accepted: 5 September 2024 / Published: 11 September 2024

Abstract

:
In the ecological context of global climate change, ensuring the stable carbon sequestration capacity of forest ecosystems, which is among the most important components of terrestrial ecosystems, is crucial. Forest fires are disasters that often burn vegetation and damage forest ecosystems. Accurate recognition of firegrounds is essential to analyze global carbon emissions and carbon flux, as well as to discover the contribution of climate change to the succession of forest ecosystems. The common recognition of firegrounds relies on remote sensing data, such as optical data, which have difficulty describing the characteristics of vertical structural damage to post-fire vegetation, whereas airborne LiDAR is incapable of large-scale observations and has high costs. The new generation of satellite-based photon counting radar ICESat-2/ATLAS (Advanced Topographic Laser Altimeter System, ATLAS) data has the advantages of large-scale observations and low cost. The ATLAS data were used in this study to extract three significant parameters, namely general, canopy, and topographical parameters, to construct a recognition index system for firegrounds based on vertical structure parameters, such as the essential canopy, based on machine learning of the random forest (RF) and extreme gradient boosting (XGBoost) classifiers. Furthermore, the spatio-temporal parameters are more accurate, and widespread use scalability was explored. The results show that the canopy type contributed 79% and 69% of the RF and XGBoost classifiers, respectively, which indicates the feasibility of using ICESat-2/ATLAS vertical structure parameters to identify firegrounds. The overall accuracy of the XGBoost classifier was slightly greater than that of the RF classifier according to 10-fold cross-validation, and all the evaluation metrics were greater than 0.8 after the independent sample test under different spatial and temporal conditions, implying the potential of ICESat-2/ATLAS for accurate fireground recognition. This study demonstrates the feasibility of ATLAS vertical structure parameters in identifying firegrounds and provides a novel and effective way to recognize firegrounds based on different spatial–temporal vertical structure information. This research reveals the feasibility of accurately identifying fireground based on parameters of ATLAS vertical structure by systematic analysis and comparison. It is also of practical significance for economical and effective precise recognition of large-scale firegrounds and contributes guidance for forest ecological restoration.

1. Introduction

Since forest fires are unpredictable, devastating, and difficult to extinguish, efforts to manage and suppress them are increasing worldwide. Global warming and extreme weather events have become more common in recent years and occur frequently worldwide, causing significant economic losses and human casualties. Fire factors are a main regulator of forest development and succession as well as the major disruptor of the Earth’s ecosystem. Fires can increase the geochemical cycling of soil microorganisms in the ecological environment, impact the dynamic processes of plant communities and biomass in the long run, and affect landscape patterns and the geographic distribution of ecosystem productivity [1,2]. Since remote sensing technology is objective, efficient, macroscopic, and quick, it has been widely employed in early warning, monitoring, and damage assessment of forest fires [3,4]. However, owing to the limitations of satellite sensor spectral channels, spatial resolution, and observation time, providing multispectral or hyperspectral images of single-tree damage information at fire sites, let alone describing detailed images of post-disaster vegetation vertical structure damage in a timely manner, is difficult.
The current state of remote sensing data can be classified into two types according to observation mechanics: classic remote sensing data and new generation remote sensing data. Examples of classic remote sensing data include NOAA (National Oceanic and Atmospheric Administration), MODIS (Moderate-Resolution Imaging Spectroradiometer), Landsat, and FY … meteorological satellite data [5,6]. Scholars have worked hard to improve the accuracy of NOAA/AVHRR fire point recognition with the bright temperature threshold method [7], bright temperature combined with the normalized vegetation index method [8], and the contextual fire point recognition method [9] being the most widely used methods. Each of the three methods has advantages and downsides, and the most commonly used methods are combinations of several methods [2,4]. Many algorithms for fire point extraction using MODIS data with high temporal resolution have been developed, including the following: the fire point recognition method, which is based on absolute thermal radiation bright temperature; the improved adaptive fire point monitoring algorithm, which uses histograms to obtain fire point thresholds automatically; three-channel enhancement combined with the smoke feature recognition algorithm; and the complementary color method [10,11]. Additionally, a contextual fire point recognition method has been proposed to distinguish bright temperatures between MODIS fireground objects and background objects, but it is prone to errors in some high-reflectivity situations [4,12]. Landsat satellite data are more advantageous for monitoring forest fires than NOAA and MODIS data because of their higher geographical resolution. Principal component analysis, single-band density segmentation, vegetation index multitemporal threshold extraction, supervised and unsupervised classification, and spectral analysis are the primary techniques for recognizing fire trails from Landsat data. Surface anomaly thermal recognition for the FY meteorological satellite works better than that of NOAA and Landsat data [13,14,15].
The mid-wave infrared spectrum can be used to identify the location of the fire and the overfire area via the theory that the brightness temperature of the ignition image element is significantly higher than that of the non-ignition image element. This principle is applicable to the new generation of remote sensing data of the GF-12 image data, where only simple enhancement processing is required to distinguish the smoke and fire areas well from the fire traces [3,16]. Chaoshu Liu et al. [17] fitted the adaptive threshold monitoring technique and identified the fire points with more than 80% accuracy as HMS-4 data. Li et al. extracted fire traces from the novel red edge band of HSPA-6 via the most common likelihood method and acquired very precise results [18]. The main night-light remote sensing satellites currently in use are DMSP/OLS, NPP/VIIRS, and Luojia-1. These satellites provide data for night-acquired night-light remote sensing. Some researchers have conducted exploratory research on DMSP in the direction of forest fire detection to address the deficiency in nighttime forest fire monitoring [19,20,21].
LiDAR (light detection and ranging) is one of the most efficient ways to acquire the vertical structure of forest communities. It has been used to map the spatial distribution of burned regions and different types of combustible forest material [17]. The distance between the sensor and the target can be determined via the laser time difference. By logging and measuring the time gap between the transmitted and received energy, the three-dimensional structure of the forest ecosystem can be acquired. LiDAR can, therefore, be used to track changes in forest structures caused by fires [22,23,24,25]. To map the region of forest fire burns, Wang et al. [26] used airborne LiDAR to detect height variations in Artemisia spp. before and after a fire and, utilizing height thresholds, the entire region was divided into three burn classes. Montealegre et al. used logistic regression methods to categorize fire regions in Spanish forests based on postfire airborne LiDAR data [27]. Other studies, such as Garcia et al.’s, used pre- and postfire aerial LiDAR data along with Landsat satellite data to accurately map burned areas and estimate the amount of biomass consumed by fires [28]. Although airborne LiDAR data can accurately and precisely offer detailed information on vegetation structure, they are restricted by large area-scale applications and inexpensive data capture. The Ice, Cloud, and Land Elevation (ICESat) series of satellites launched by NASA is the most common satellite-based LiDAR for regional-scale forest resource monitoring. The spot diameter of the ICESat-1/GLAS (Geoscience Laser Altimeter System, GLAS) full waveform data is approximately 70 m, which can be used to perform global vegetation canopy height measurements [29,30,31]. In contrast to GLAS, ICESat-2, launched in 2018, is equipped with an ATLAS (Advanced Topographic Laser Altimeter System) photon counting sensor. With a spot diameter of approximately 17 m and a spot resolution of approximately 0.7 m, the high-density photon signal can map the vertical structure information in the forest ecosystem more clearly [32,33]. After ATLAS data were used to map firegrounds and compare their capabilities, Meng Liu et al. [34] determined that apparent surface reflectance and canopy photon number are the most crucial factors in mapping firegrounds. However, spatio-temporal scalability still needs to be investigated and validated, and more exploration is needed regarding the extension and application of the model.
The main objectives of this study are as follows: (1) To build a fire recognition parameter system based on ATLAS data by extracting three major categories of parameters via relatively new ICESat-2/ATLAS data and to determine whether vertical structure information such as the canopy is an important parameter; (2) to construct a fire recognition classifier based on the ATLAS parameter system and to compare and analyze the recognition effects of multiple classifiers via multiple evaluation indices; and (3) to test the classifier’s scalability across time and space via fire data from multiple regions at various times and to conduct a comparative analysis to discuss its extension and application.

2. Materials and Methods
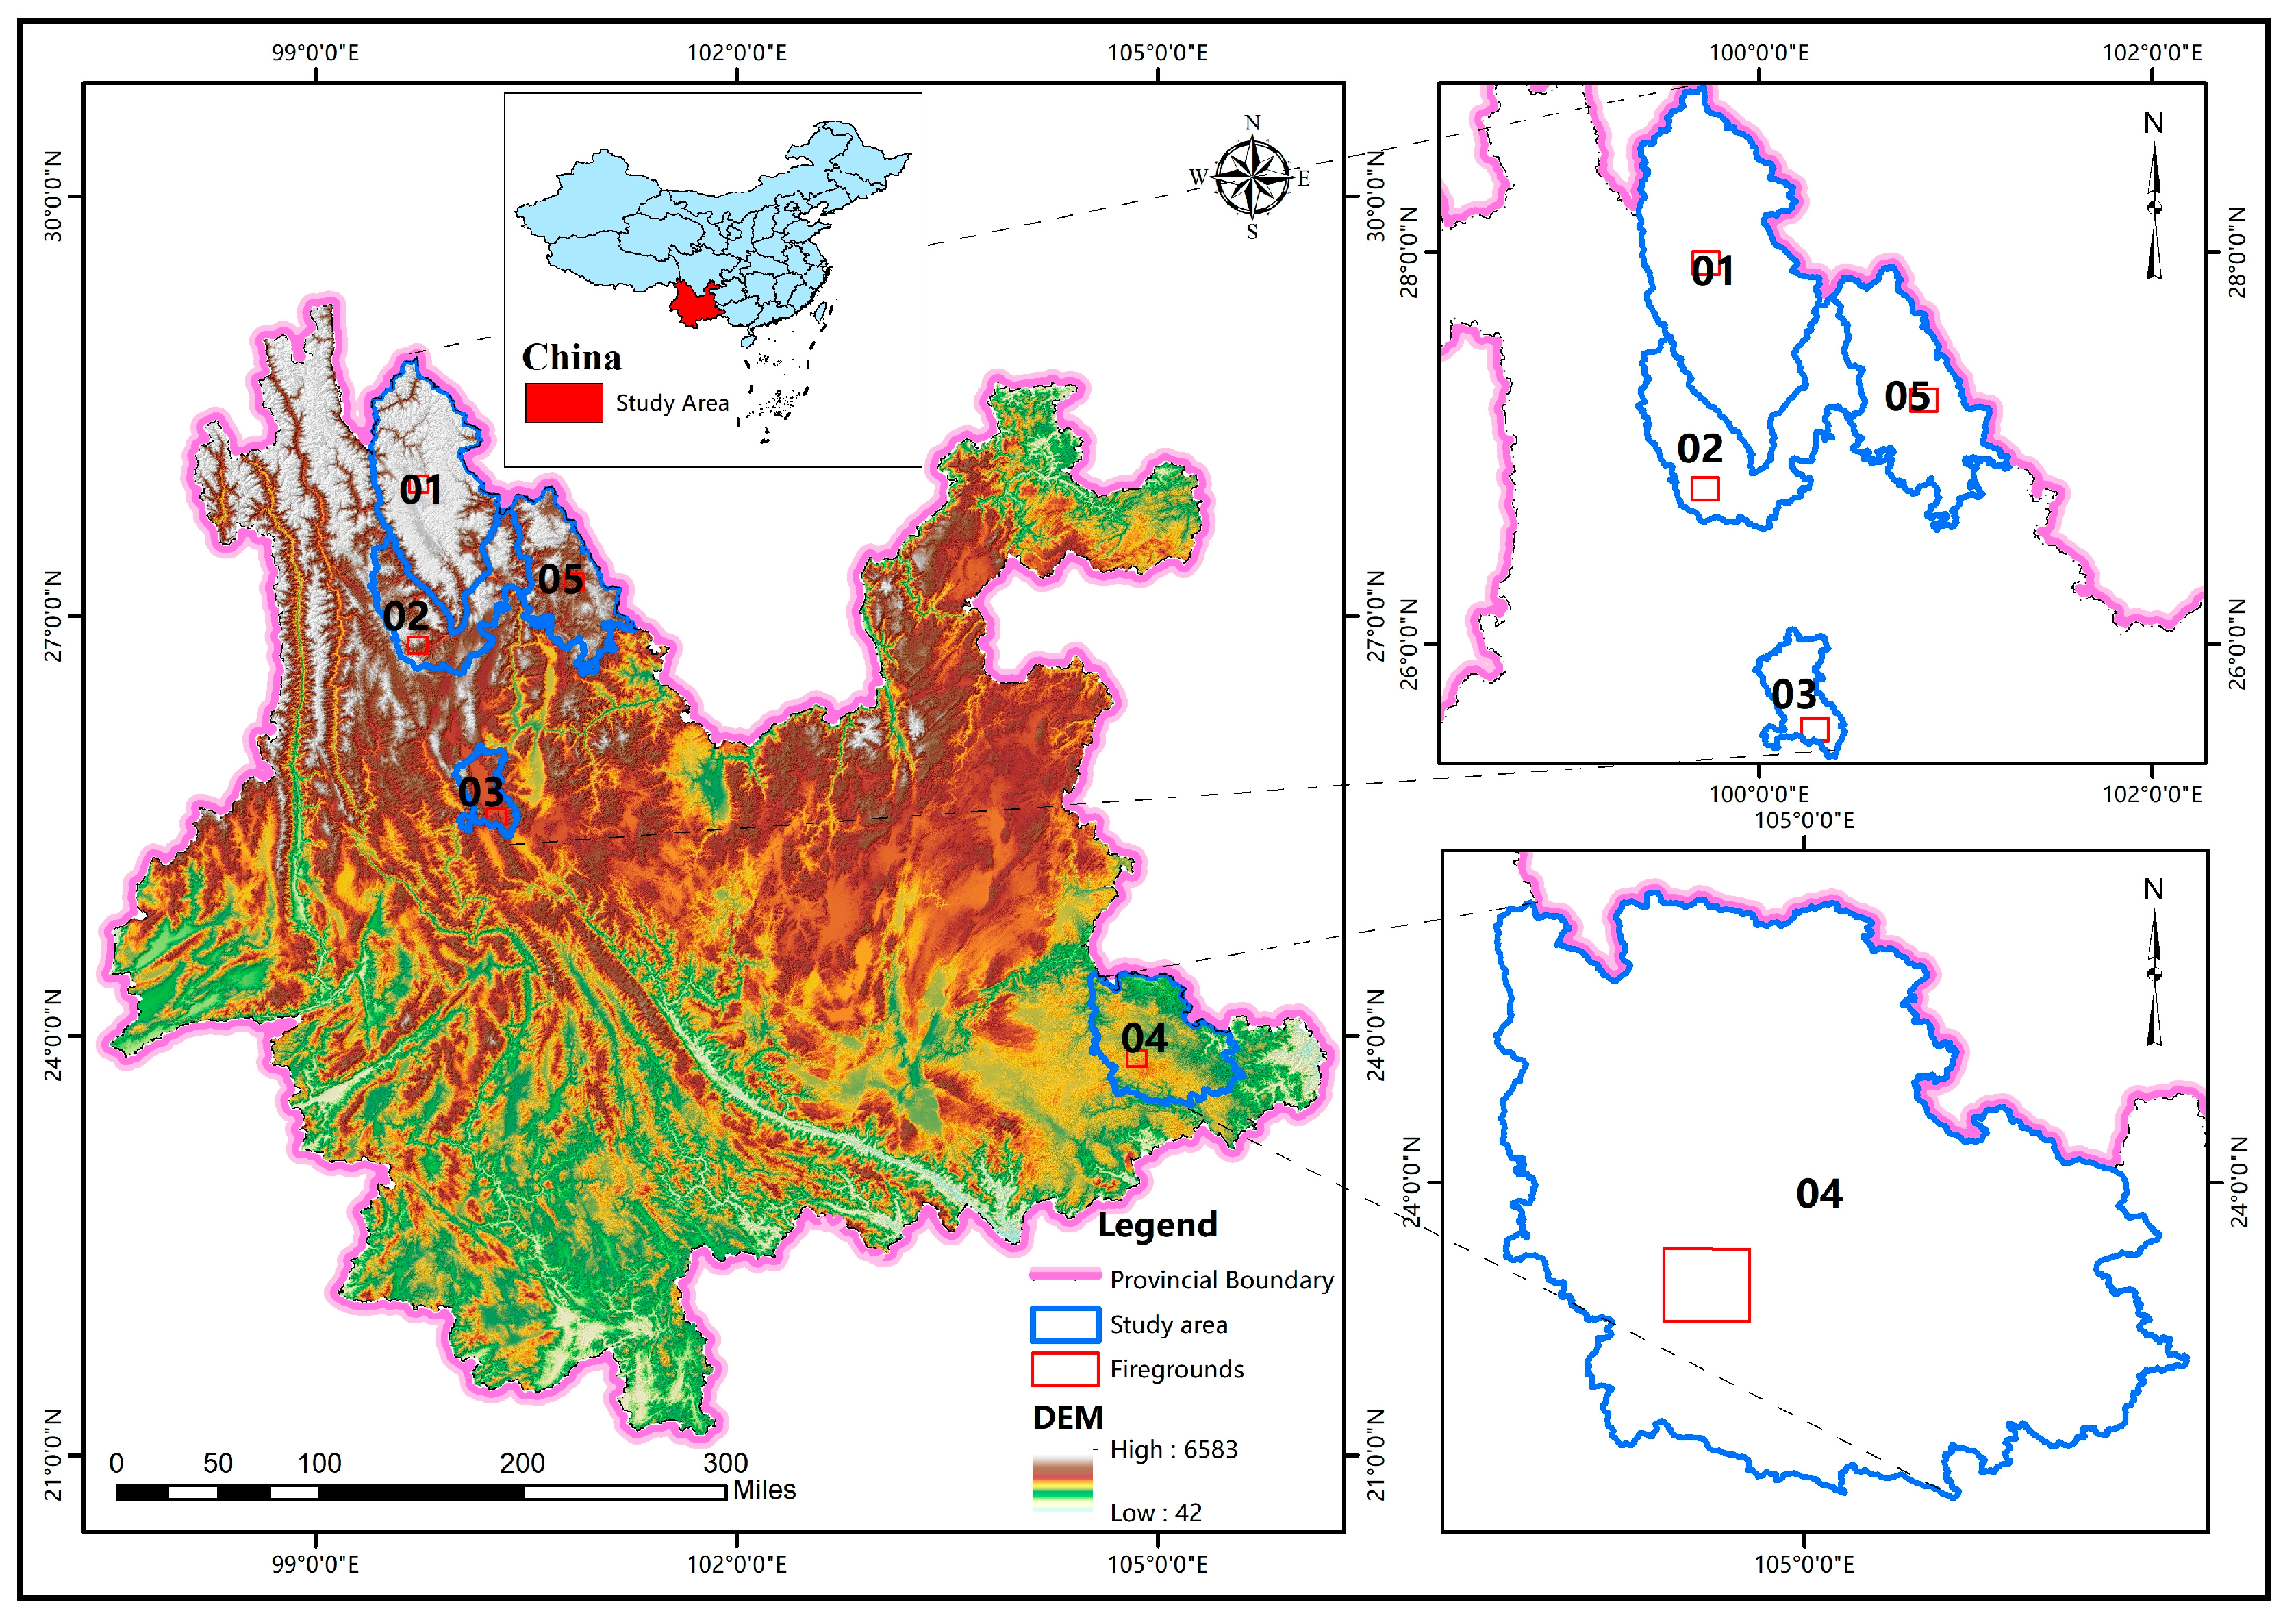
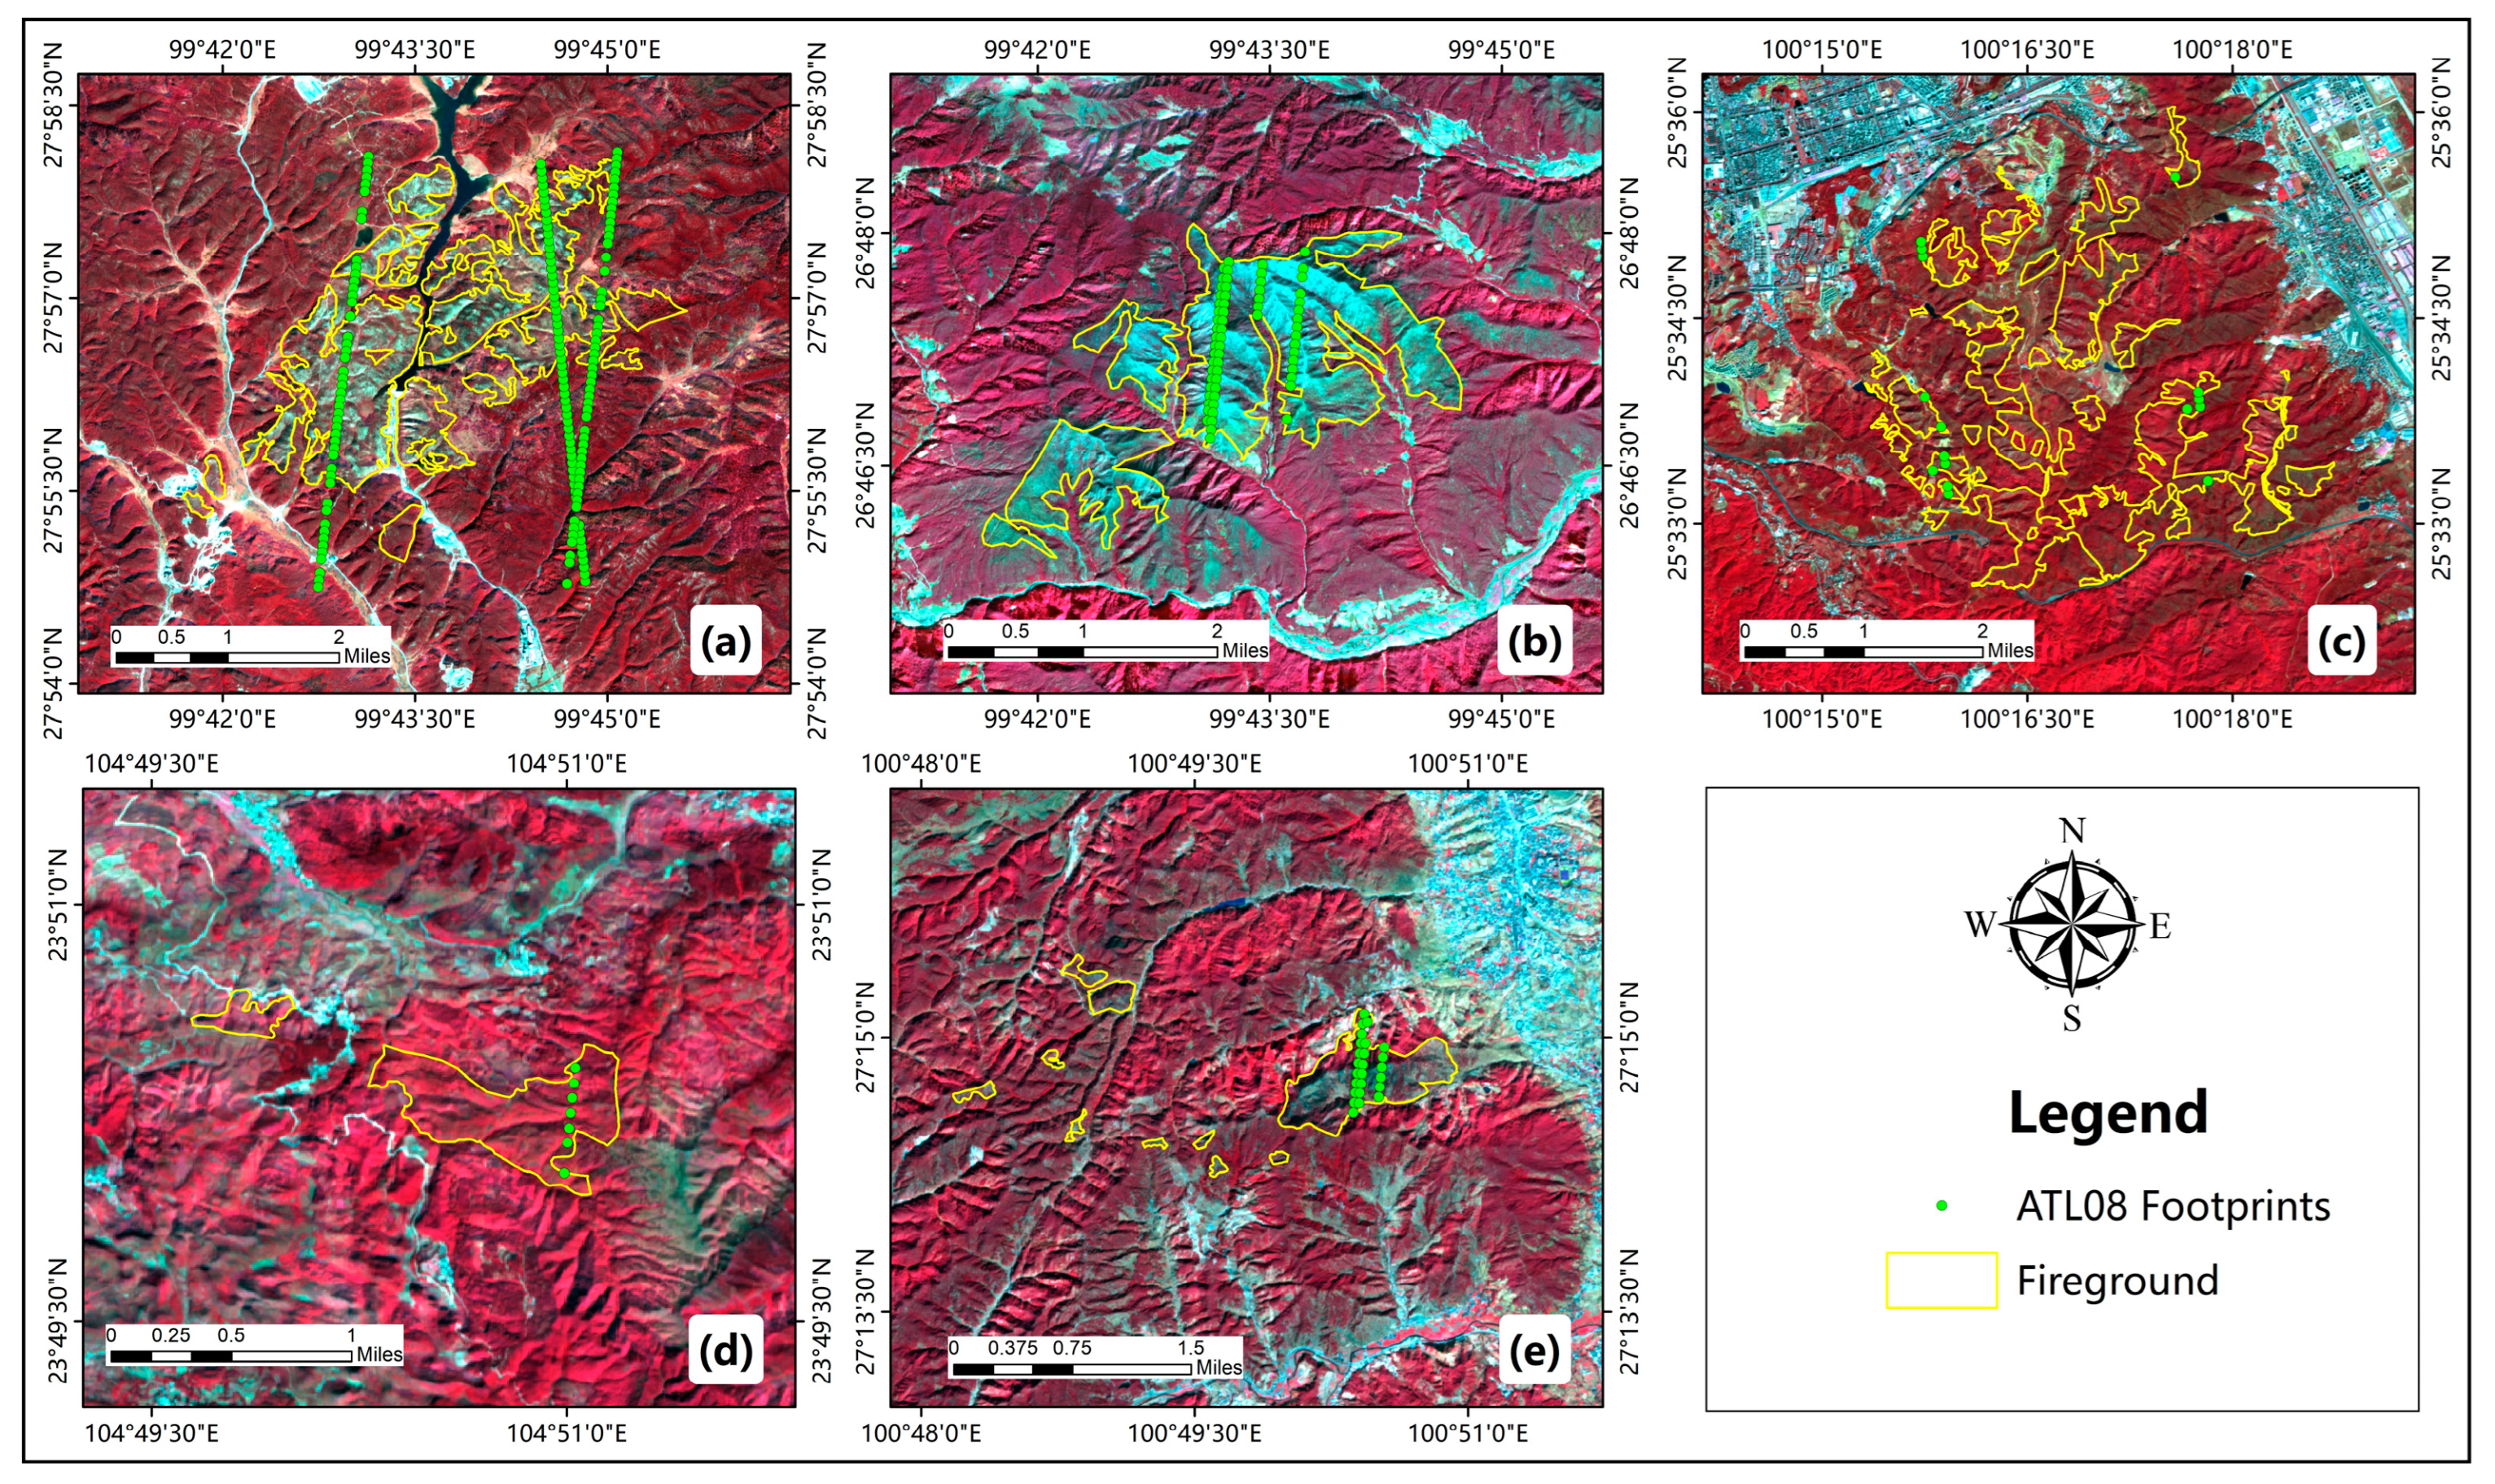
2.1. Study Area

Yunnan Province, China, is a rich biodiversity region with high forest cover and carbon sequestration capacity, making the security of the forest ecosystem even more critical. A series of datasets were collected in this study, including the 2020 forest inventory of Yunnan Province and all plots with burned forest areas that still cannot reach the level of thinning forestland at the site three years after fire, i.e., the vegetation depression and cover cannot reach 20%, which were categorized and summarized into five counties with the most burned areas since 2014: Area01 Shangri-La city, Area02 Lijiang Naxi Autonomous County, Area03 Dali city, Area04 Guangnan County, and Area05 Ninglang Yi Autonomous County. The five counties are located in the northwestern and southeastern parts of Yunnan Province, with a general trend of north–south penetration, with the study area being at different altitudes and latitudes as much as possible. Moreover, to ensure that the ICESat-2/ATLAS track penetrates as much as possible into the fires to provide more effective photon signals for the study, five typical fires with the largest fire areas among the five counties were selected for spatial and temporal scalability, and the spatial distributions of the five firegrounds are shown in Figure 1.

2.2. Data

2.2.1. ICESat-2 Data Products

ICESat-2 satellite orbits are three pairs of 6 beams, and because the laser emitter frequency is 10 kHz, photon point cloud data can be obtained with a diameter of approximately 17 m and a spot spacing of 0.7 m along the orbit [35]. The vertical spacing of the three pairs of orbits is approximately 3 km, and the vertical spacing of the strong and weak beams in each pair is approximately 90 m, with a re-entry period of 91 days [36]. Since the launch of the ICESat-2 satellite in 2018, five versions of data iterations have been passed. The official NASA public ICESat-2 data product descriptions state that there are 21 data products for ICESat-2 satellites, which can be categorized into three major categories, with data products named ATL01-ATL21 [37,38]. All the data products are stored in the version 5 hierarchical data format (HDF5), and the study uses the version 5 tertiary data product, the ATL08 data product (Land and Vegetation Height), which can be downloaded from https://nsidc.org/data/atl08 (accessed on 25 May 2022).
The ATL08 data product is the ATL03 product after partition segment processing, which uses the differential, regressive, and Gaussian adaptive nearest neighbor [32] (DRAGANN) algorithm to complete the removal of photon point cloud noise and then uses the progressive photon classification algorithm to slowly densify the ground photons to complete the classification of photon point clouds and finally classify the photon point clouds into noise or unclassified, ground, canopy, and top of canopy photons.
The parameters in the ATL08 product used in this study can be divided into three main categories: the first category is the total parameters, including apparent reflectance, elevation, latitude and longitude information, and the number of photons in the zone; the second category is the vertical structure of the canopy parameters, including canopy openness, canopy height, canopy photon number, and canopy height; and the third category is the terrain parameters, including ground photon number, topographic slope, and ground photon rate in the zone. Detailed information for each parameter is shown in Table 1.

2.2.2. Sentinel-2 MSI

Sentinel data have been widely used to identify firegrounds. Normalized burn ratio (NBR) data extracted from Sentinel-2 data were used to assist ATLAS in comparing the identification results with fireground data. This study uses the Google Earth Engine (GEE) (https://developers.google.cn/earth-engine/ (accessed on 25 May 2022)) platform to perform pixel-level decloaking operations on Sentinel-2 multispectral instrument (MSI) data and Level-2A remote sensing image data from five regions via the pixel-mean synthesis method of long time series to obtain typical fireground data in five regions. The Sentinel-2 MSI composite images were obtained for five areas [5]. Five bands, the blue-green–red–near-infrared band and the SWIR band (B2, B3, B4, B8, and B11) (Table 2) [39], were used for the study.

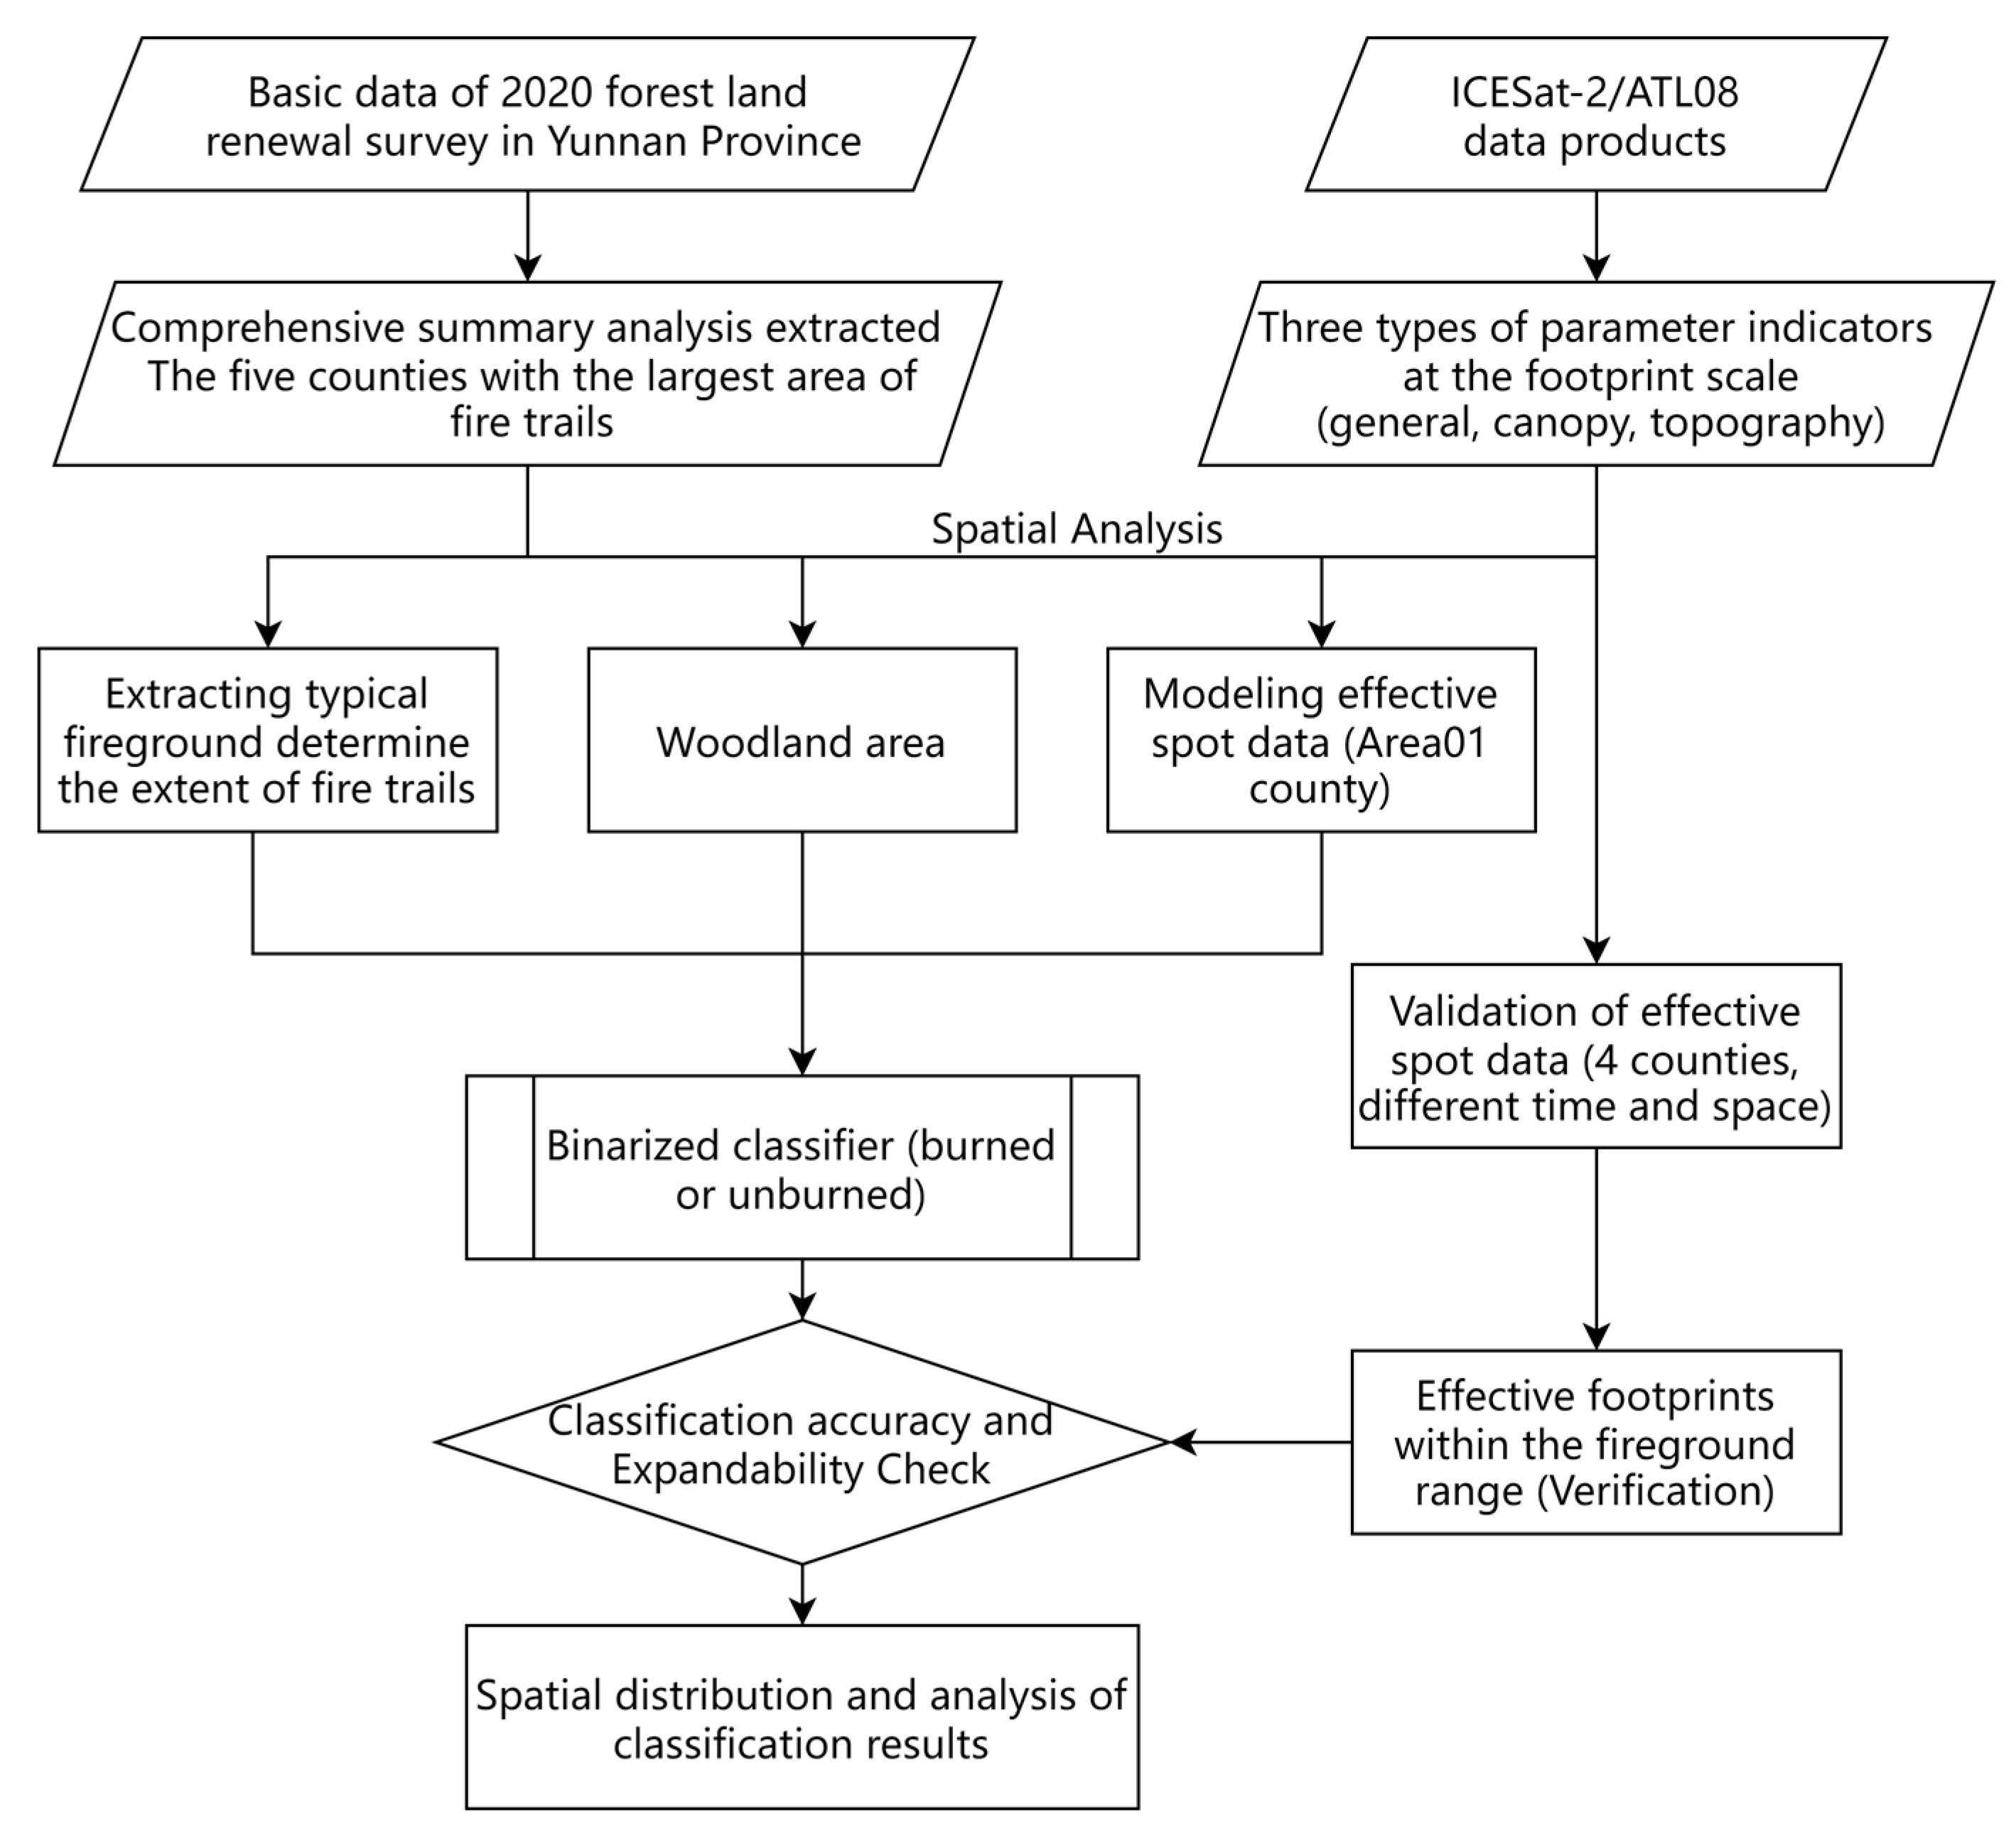
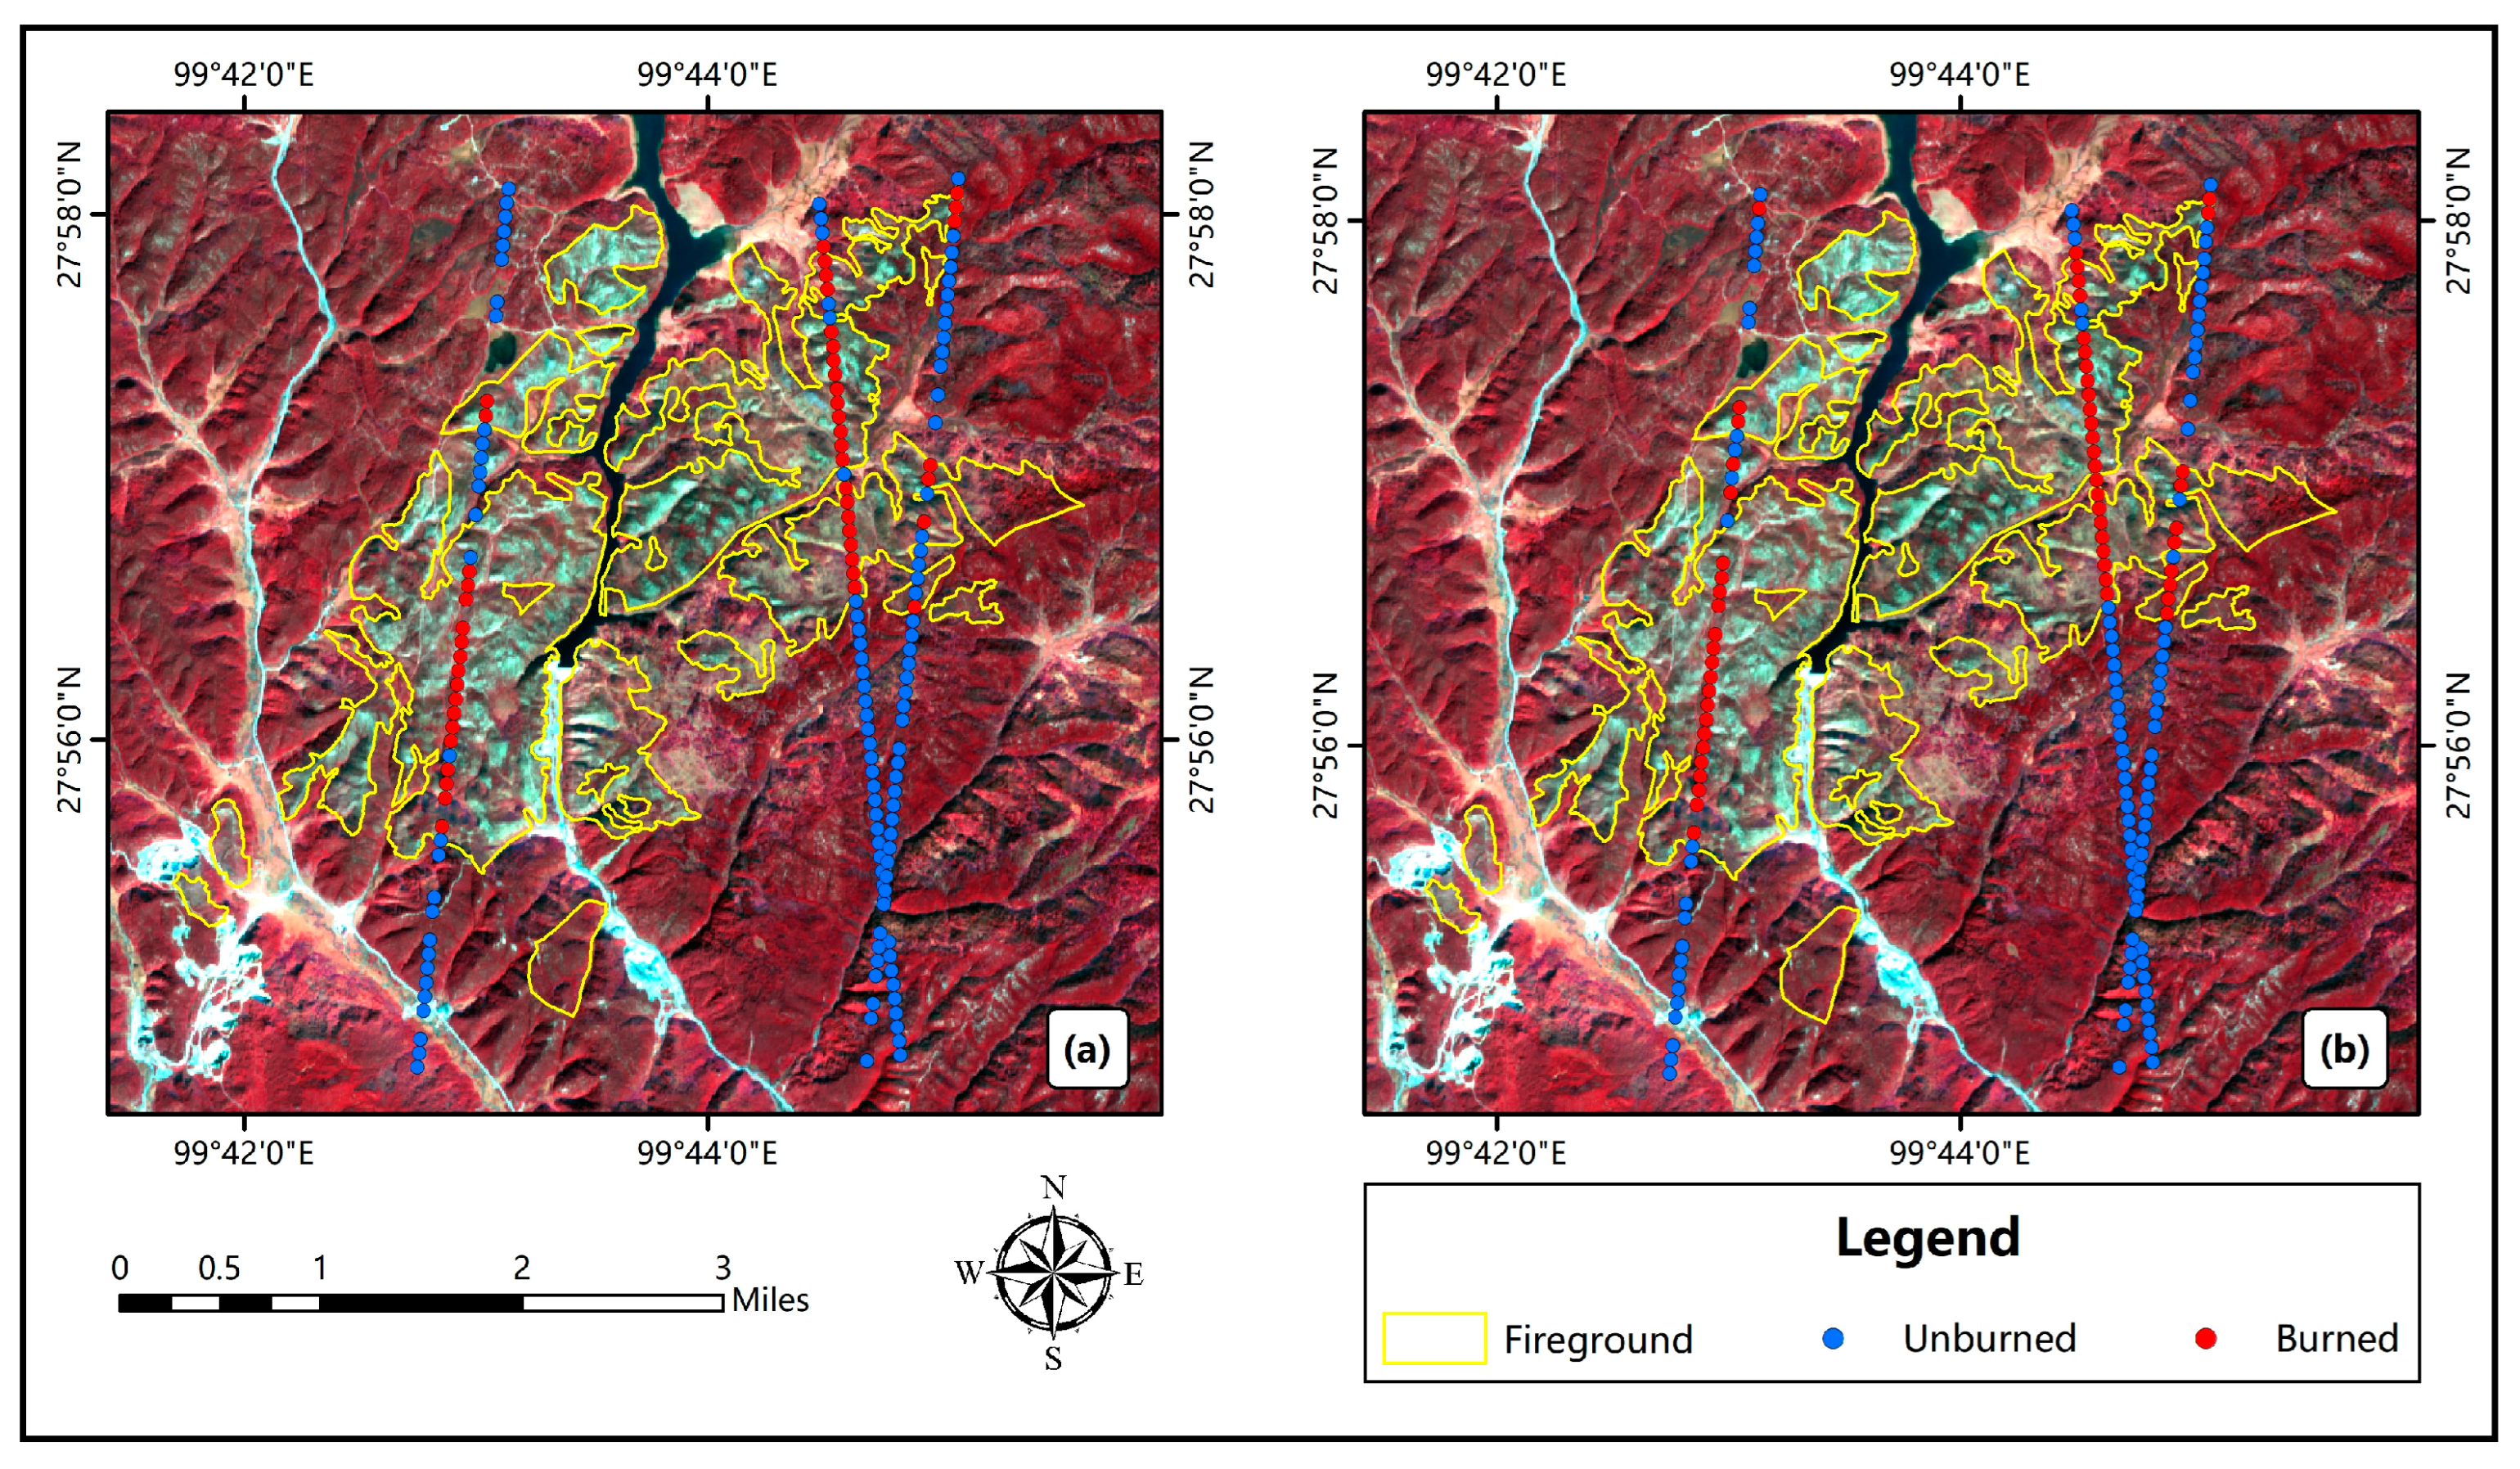
2.3. Determine the Burned in Woodland Based on ATLAS Photon Spots

The study identified three main steps to determine the ability of each type of ATLAS parameter, especially the canopy parameters of the vertical structure, to identify the fire site after a forest fire burns. The first step needed to determine the exact extent of forestland was to remove the perturbation of nonforest land to build the classifier later and improve its accuracy. The study area was subsequently determined on the basis of the forestland database data. The second step involves extracting three types of parameter indicators from ATL08 data via comprehensive analysis and establishing a parameter system for fire land recognition on the basis of ATLAS data. The third step is to use the RF and XGBoost algorithms to build a binarized classifier based on the ATLAS fire recognition parameter system and verify the expanded recognition accuracy under different time and space constraints. The research roadmap is shown in Figure 2.
(1) In this study, the woodland extent was extracted on the basis of data from the 2020 forest inventory of Yunnan Province, and to prove the validity of the results, the extracted woodland extent was compared with Google Earth images, and a small number of unreasonable areas were corrected. The corrected woodland and nonwoodland extents are shown in Figure 3. The corrected woodland extent is more consistent with the actual status, and the ATLAS spot within the woodland extent was finally selected as the research object.
(2) After overlaying the corrected forest extent with the ATLAS footprints for analysis, the area with the largest overfire area within Shangri-La City with the largest area of fire traces was used as the modeling data for the classifier. The time of the forest fire in Shangri-La City was in 2014, and the ATLAS spot footprints of this area were superimposed with the fire traces, as shown in Figure 4a. Since the laser intensity of the strong beam is approximately seven times greater than that of the weak beam, the data of the strong beam in the ATLAS track were selected as the base data for fire site recognition in this study after comparison testing. After the final superposition analysis, 159 spot sample data points were used to build the classifier, among which 53 spot footprint samples were burned and 106 spot footprint samples were not burned; the spatial distribution is shown in Figure 4b. Three parameter indicators (overall, canopy, and topography) at the footprint scale were extracted according to the corresponding footprint samples. A parameter system for fire recognition based on ATLAS data was constructed.
(3) All the indicators extracted from the ATLAS footprints were used to construct a binarized classifier on the basis of the ATLAS firefield recognition parameter system via the RF and XGBoost algorithms. Figure 5a depicts the 159 Area01 Shangri-La City samples used to construct the classifier. Moreover, to explore the spatial and temporal scalability of identifying firegrounds on the basis of ATLAS parameters, this study determined that the number of footprints within firegrounds in the remaining four study areas remained constant, i.e., Area02: Lijiang Naxi Autonomous County; Area03: Dali city; Area04: Guangnan County; and Area05: Ninglang Yi Autonomous County. The numbers of footprints on firegrounds in Area02 Lijiang Naxi Autonomous County, Area03 Dali City, Area04 Guangnan County, and Area05 Ninglang Yi Autonomous County were 64, 16, 7, and 25, respectively. The spatial distribution diagram is shown in Figure 5b–e.

2.4. ATLAS Fireground Recognition Classifier Construction

2.4.1. RF Algorithm Classifier

The random forest algorithm obtains a sampling set containing n training samples by n random samples in the provided n sample dataset and then builds a decision tree based on each sampling set for training; at the node of the decision tree, a subset containing i attributes is first randomly selected from the set of attributes of the node, and then the optimal one is selected from this subset for division. In this case, after the random forest is constructed, the test set is entered into all decision trees for classification or regression output; in the case of classification, the decision category is output in the form of voting, and in the case of regression, the mean value of each decision tree output is used as the final prediction result [40,41].
This study uses 159 valid plots in Area01 for classifier construction. After random disorder processing, the dataset is partitioned into training and validation datasets at 7:3, with 111 training and 48 validation datasets. Moreover, the training datasets are divided into 10 mutually exclusive subsets of similar size for cross-validation via the 10-fold cross-validation method, which can avoid the overfitting problem caused by unreasonable dataset division [42]. The parameters of the random forest algorithm classifier used in this study are the default setting.

2.4.2. XGBoost Algorithm Classifier

The traditional gradient boosting decision trees (GBDT) model is a weighted regression model, which has advantages over linear regression (LR) in that it does not require normalization of features and can select its features to accommodate a variety of loss functions (squared mean, classification loss, etc.) [11]. The disadvantages are also obvious. Boosting is a serial process that cannot be parallelized, has high computational complexity, and is unsuitable for high-dimensional sparse features. XGBoost differs from GBDT in that it only utilizes the information of the first-order derivatives, whereas XGBoost performs a second-order Taylor expansion of the loss function and adds a regular term to the objective function to measure the complexity of the objective function and the model to prevent overfitting [25,43].
Although the overfitting problem has been solved in the XGBoost algorithm, considering the classifier’s scalability in different times and spaces and the need for more stable and reliable classifier results, both the test set and the validation set are selected according to the splitting ratio of the random forest algorithm classifier, which also facilitates the comparability of the results. The parameters of the XGBoost algorithm classifier used in this study are default settings.

2.4.3. Accuracy Assessment Criteria

To verify the ability of the vertical structure information in ATLAS spot for fireground recognition and further discuss the scalability of this result under different spatial and temporal conditions, the accuracy, precision, recall, and F1-measure (the summed average of precision and recall) were selected as classifiers in the classifier construction stage [34,43,44]. The error rate is added to the four evaluation metrics used in the classifier construction stage to evaluate the accuracy for the different spatio-temporal scalability validation stages and facilitate a comparative analysis of the results. Each of the indicators are calculated as follows:
A C C = T P + T N T P + T N + F P + F N
R = T P T P + F N
P = T P T P + F P
F 1 = 2 P R P + R
E = F P + F N T P + T N + F P + F N = 1 A C C
Note: ACC is the accuracy rate; R is the recall rate; P is the precision rate; F1 is the summed average of the precision and recall rates; and E is the false positive rate. TP (true positive); FP (false positive); TN (true negative); FN (false negative).

3. Results

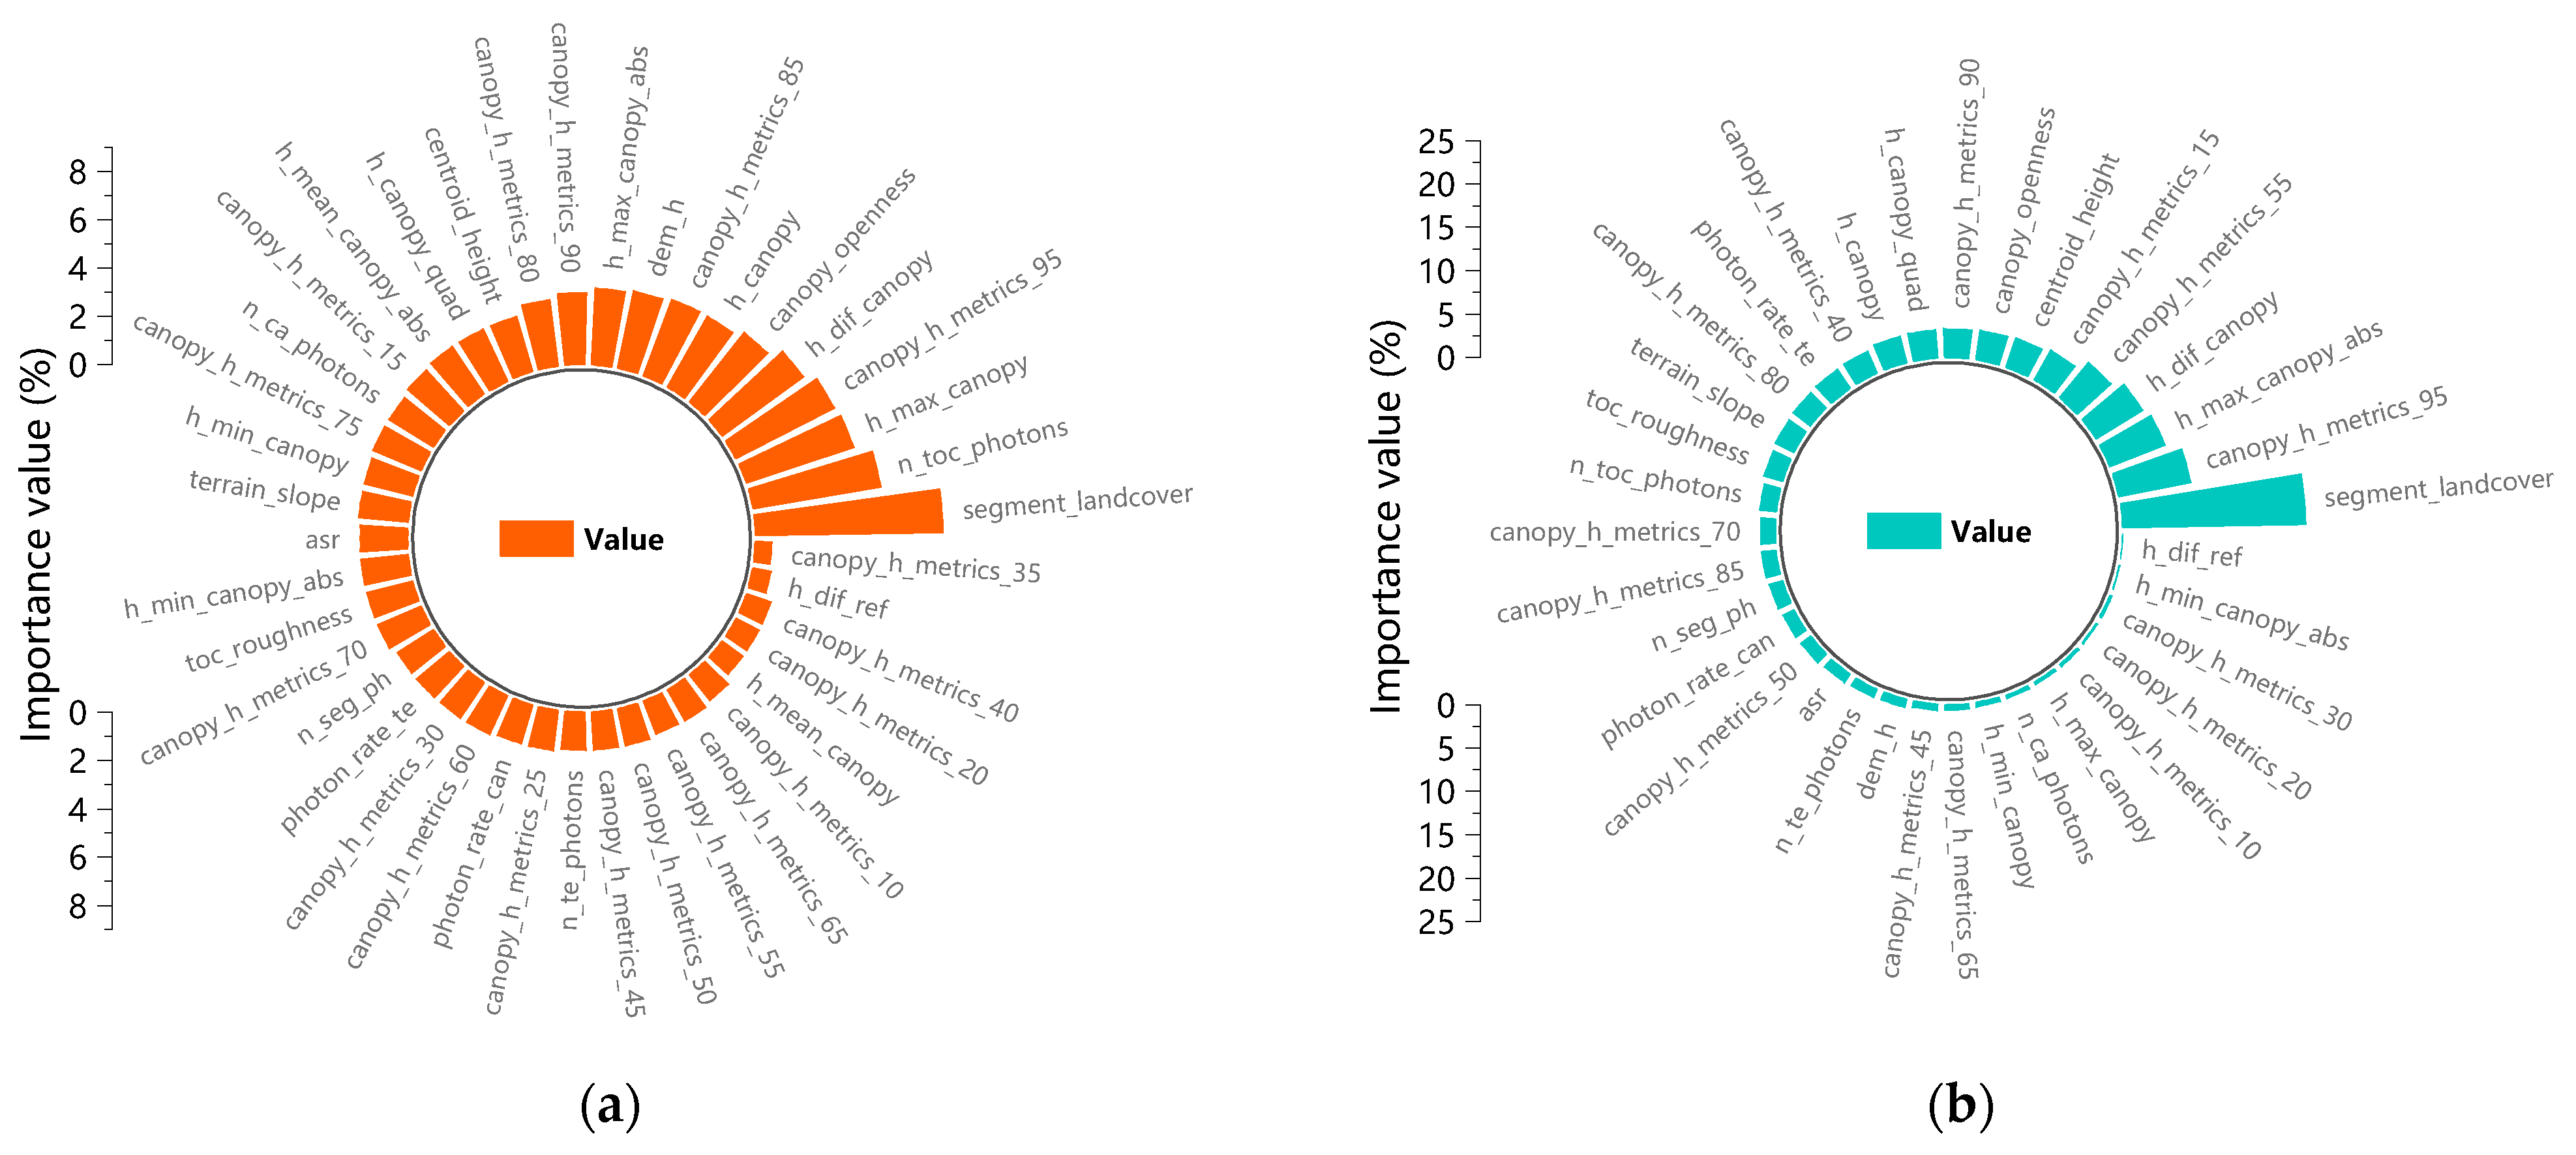
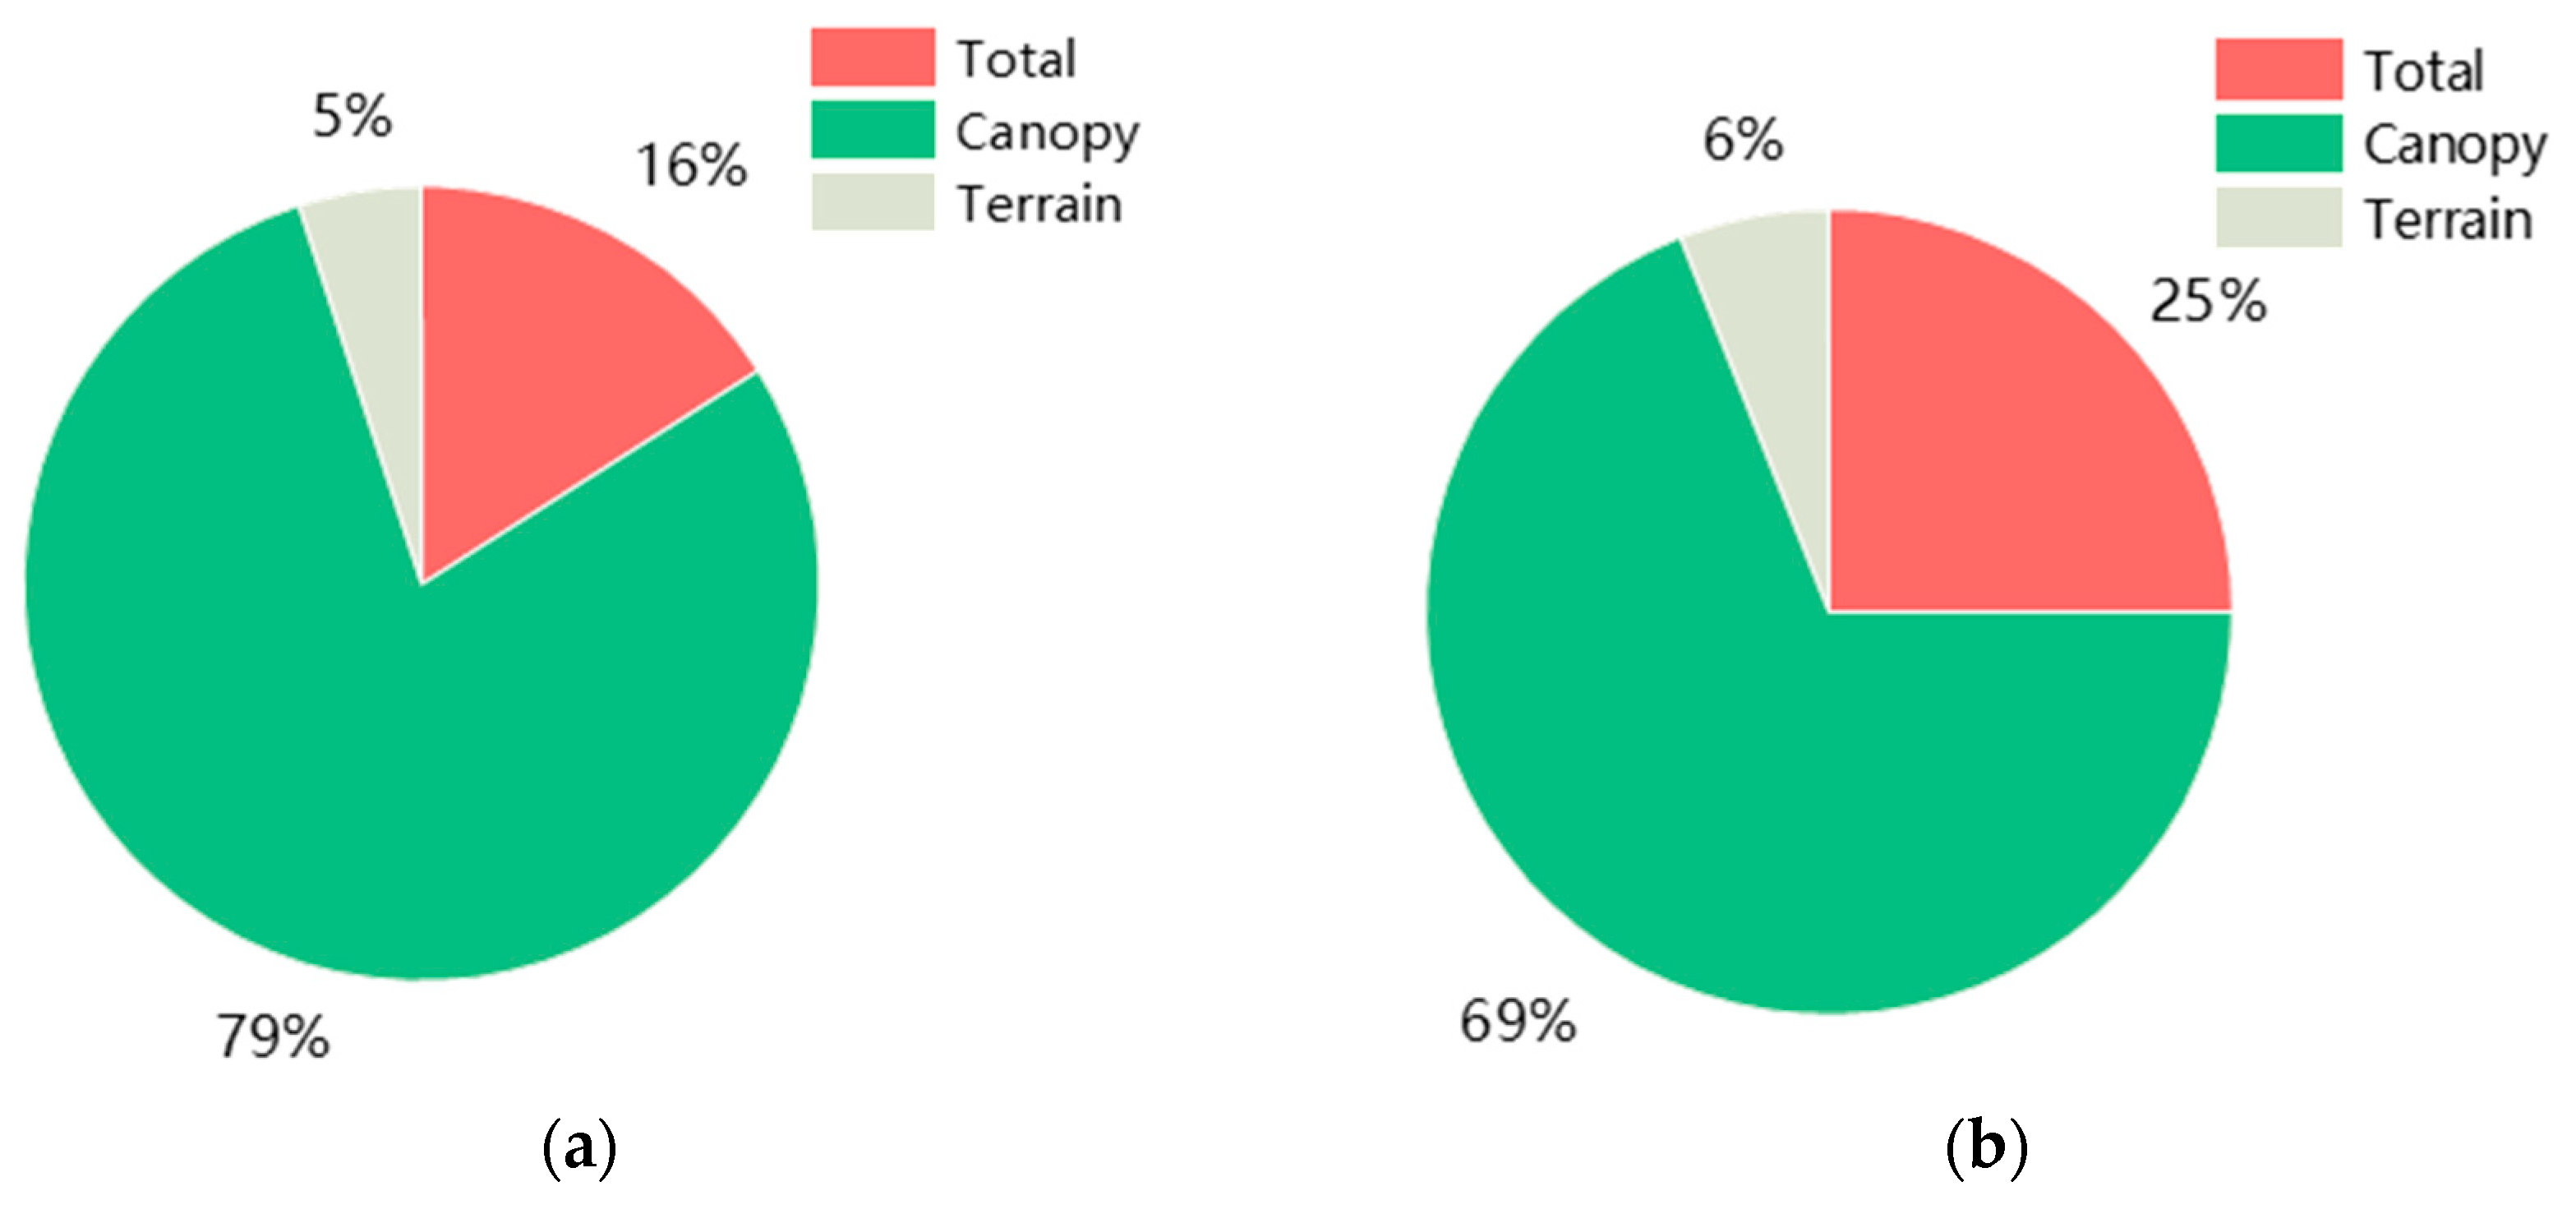
3.1. Analysis of the Contribution of ATLAS Parameters

To investigate the capability of ATLAS vertical structure parameters in fireground recognition, three major classes of parameters in ATLAS were extracted, two fireground recognition classifiers were constructed using the RF algorithm and XGBoost algorithm, and the contribution rates of ATLAS parameters in each classifier are shown in Figure 6. Figure 6a shows that all the parameters in the RF algorithm-based classifier have contribution rates, with segment_landcover having the highest contribution rate at 7.8% and canopy_h_metrics_35 having the lowest contribution rate at 0.7%. Figure 6b shows that the contribution rate of each parameter is enhanced in the classifier via the XGBoost algorithm, whereas six parameters with no contribution rate are removed. The highest contribution rate was 21.2% for segment_landcover, and the lowest contribution rate was 0.1% for h_dif_ref. The landcover type parameter segment_landcover had the largest contribution rate in both classifiers, and this parameter was updated from the MODIS landcover values derived from the 2014 MODIS product to the 2019 Copernicus landcover data values in the version 5 data product to improve the timeliness.
Moreover, the change in the canopy scale of forest trees before and after the occurrence of forest fires was large, as shown in Figure 7. The contribution of the parameters of the canopy type in the RF classifier is 79%, the parameters of the overall type are 16%, and the topography type is 5%. In the XGBoost classifier, the contribution of the parameters of the canopy type is 69%, the parameters of the overall type are 25%, and the terrain type is 6%. The parameter contribution of topography type was low in both classifiers, mainly because there was no significant change in topography before and after the occurrence of forest fires. Both classifiers revealed that each parameter under the canopy type in the vertical structure had a high contribution rate to fire recognition, which showed the same pattern as the change in the canopy before and after the occurrence of forest fires and demonstrated the feasibility of selecting the ATLAS vertical structure parameters for fire recognition.

3.2. Analysis of Recognition Capabilities of ATLAS

To compare and analyze the capability of the vertical structure information obtained by the ATLAS strong beam in fire recognition, two classifiers based on the RF and XGBoost algorithms were constructed in this study via 159 footprint data points from Shangri-La City, which has the largest fire area. The accuracy and recall rate of the training dataset of the two classifiers are both 1.000, which shows that the two classifiers have good effects on fireground recognition. Moreover, the overall recognition accuracy of the XGBoost classifier is slightly better than that of the RF classifier after the 10-fold cross-validation method is used. When tested by independent validating samples, the RF classifier achieved an accuracy of 0.833, a recall of 0.833, a precision of 0.844, and an F1-measure of 0.821, with all evaluation metrics exceeding 0.8. The XGBoost classifier achieved an accuracy of 0.812, a recall of 0.812, a precision of 0.832, and an F1-measure of 0.819 when testing used independent test samples, with all evaluation metrics also exceeding 0.8. Both classifiers demonstrate the feasibility of constructed fireground recognition based on parameters such as ATLAS vertical structure. Detailed statistical information is shown in Table 3.
Figure 8 shows the fire distribution of Area01 Shangri-La City using the two classifiers constructed. Combining Figure 4 and Figure 8, it can be seen that both classifiers have good results for Area01 Shangri-La city fire recognition, and the spatial distribution is basically consistent with the actual fire distribution, which can identify and show the spatial distribution range of Shangri-La city fires more clearly. However, the study revealed that the misclassified spots were located in gully areas with complex topographies, the degree of fire was low, and the topography had some influence on the photon signal detection of ATLAS spots. This led to the misclassification of this part of the footprints.

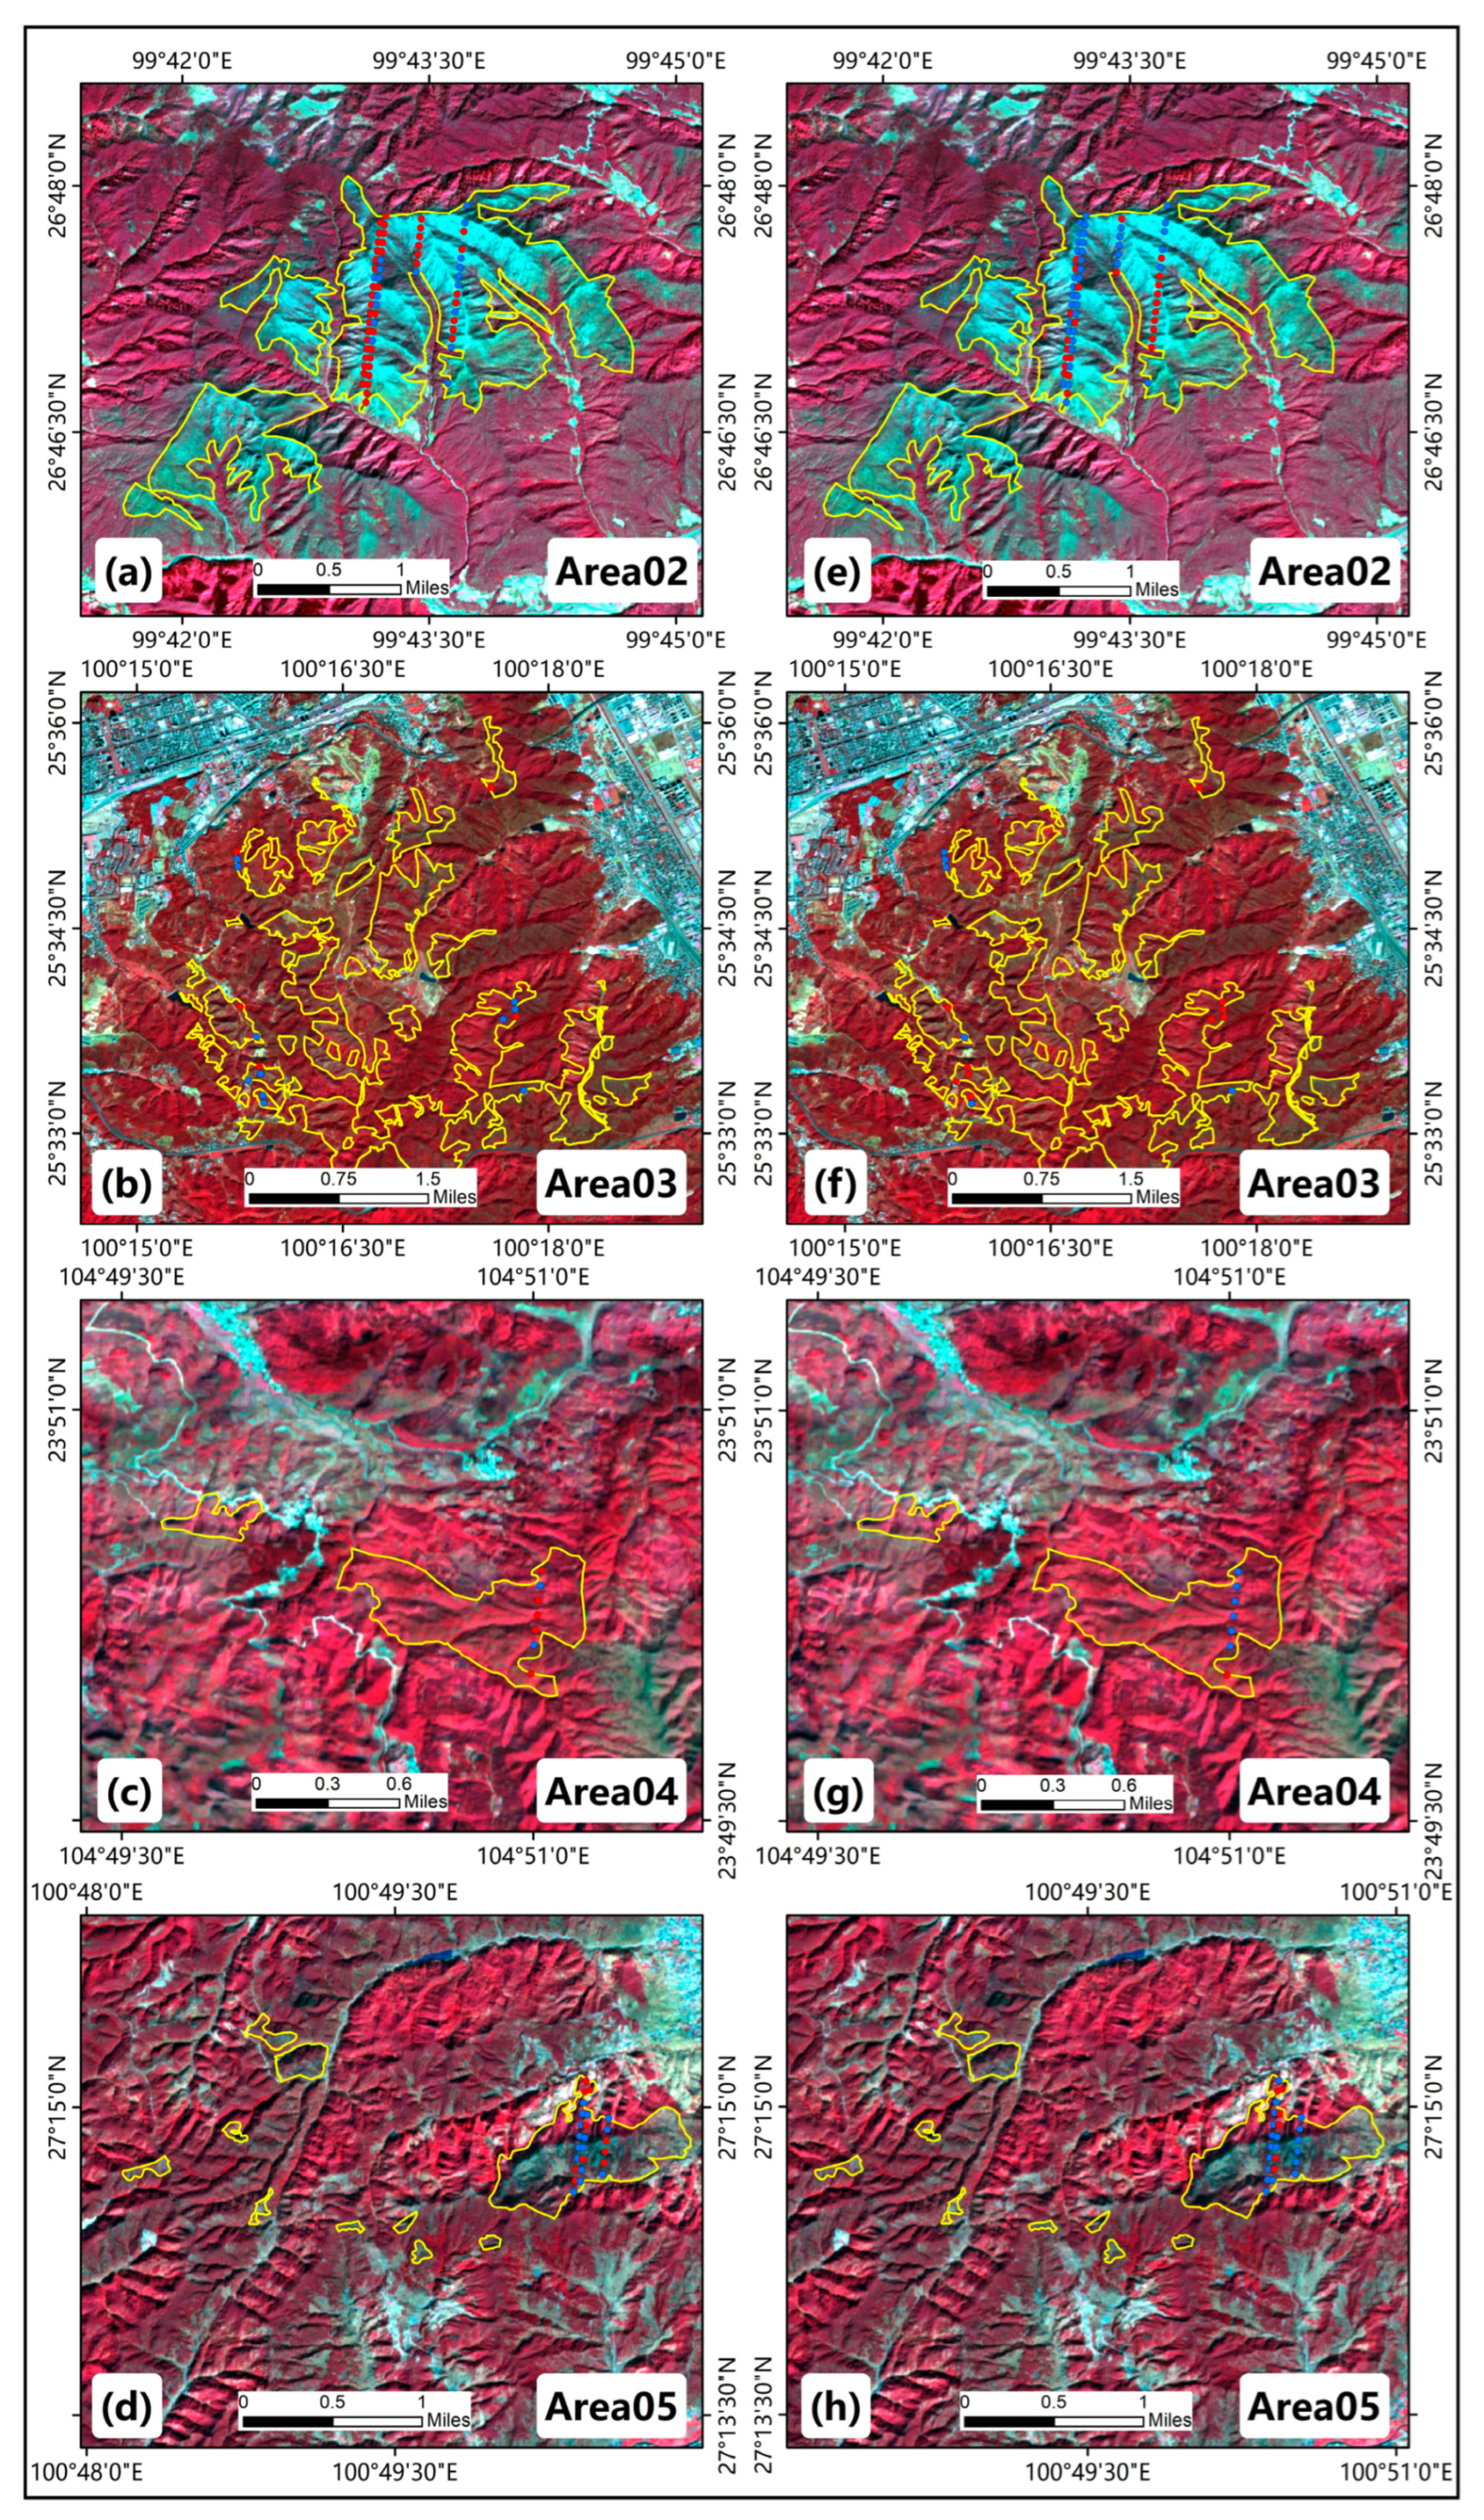
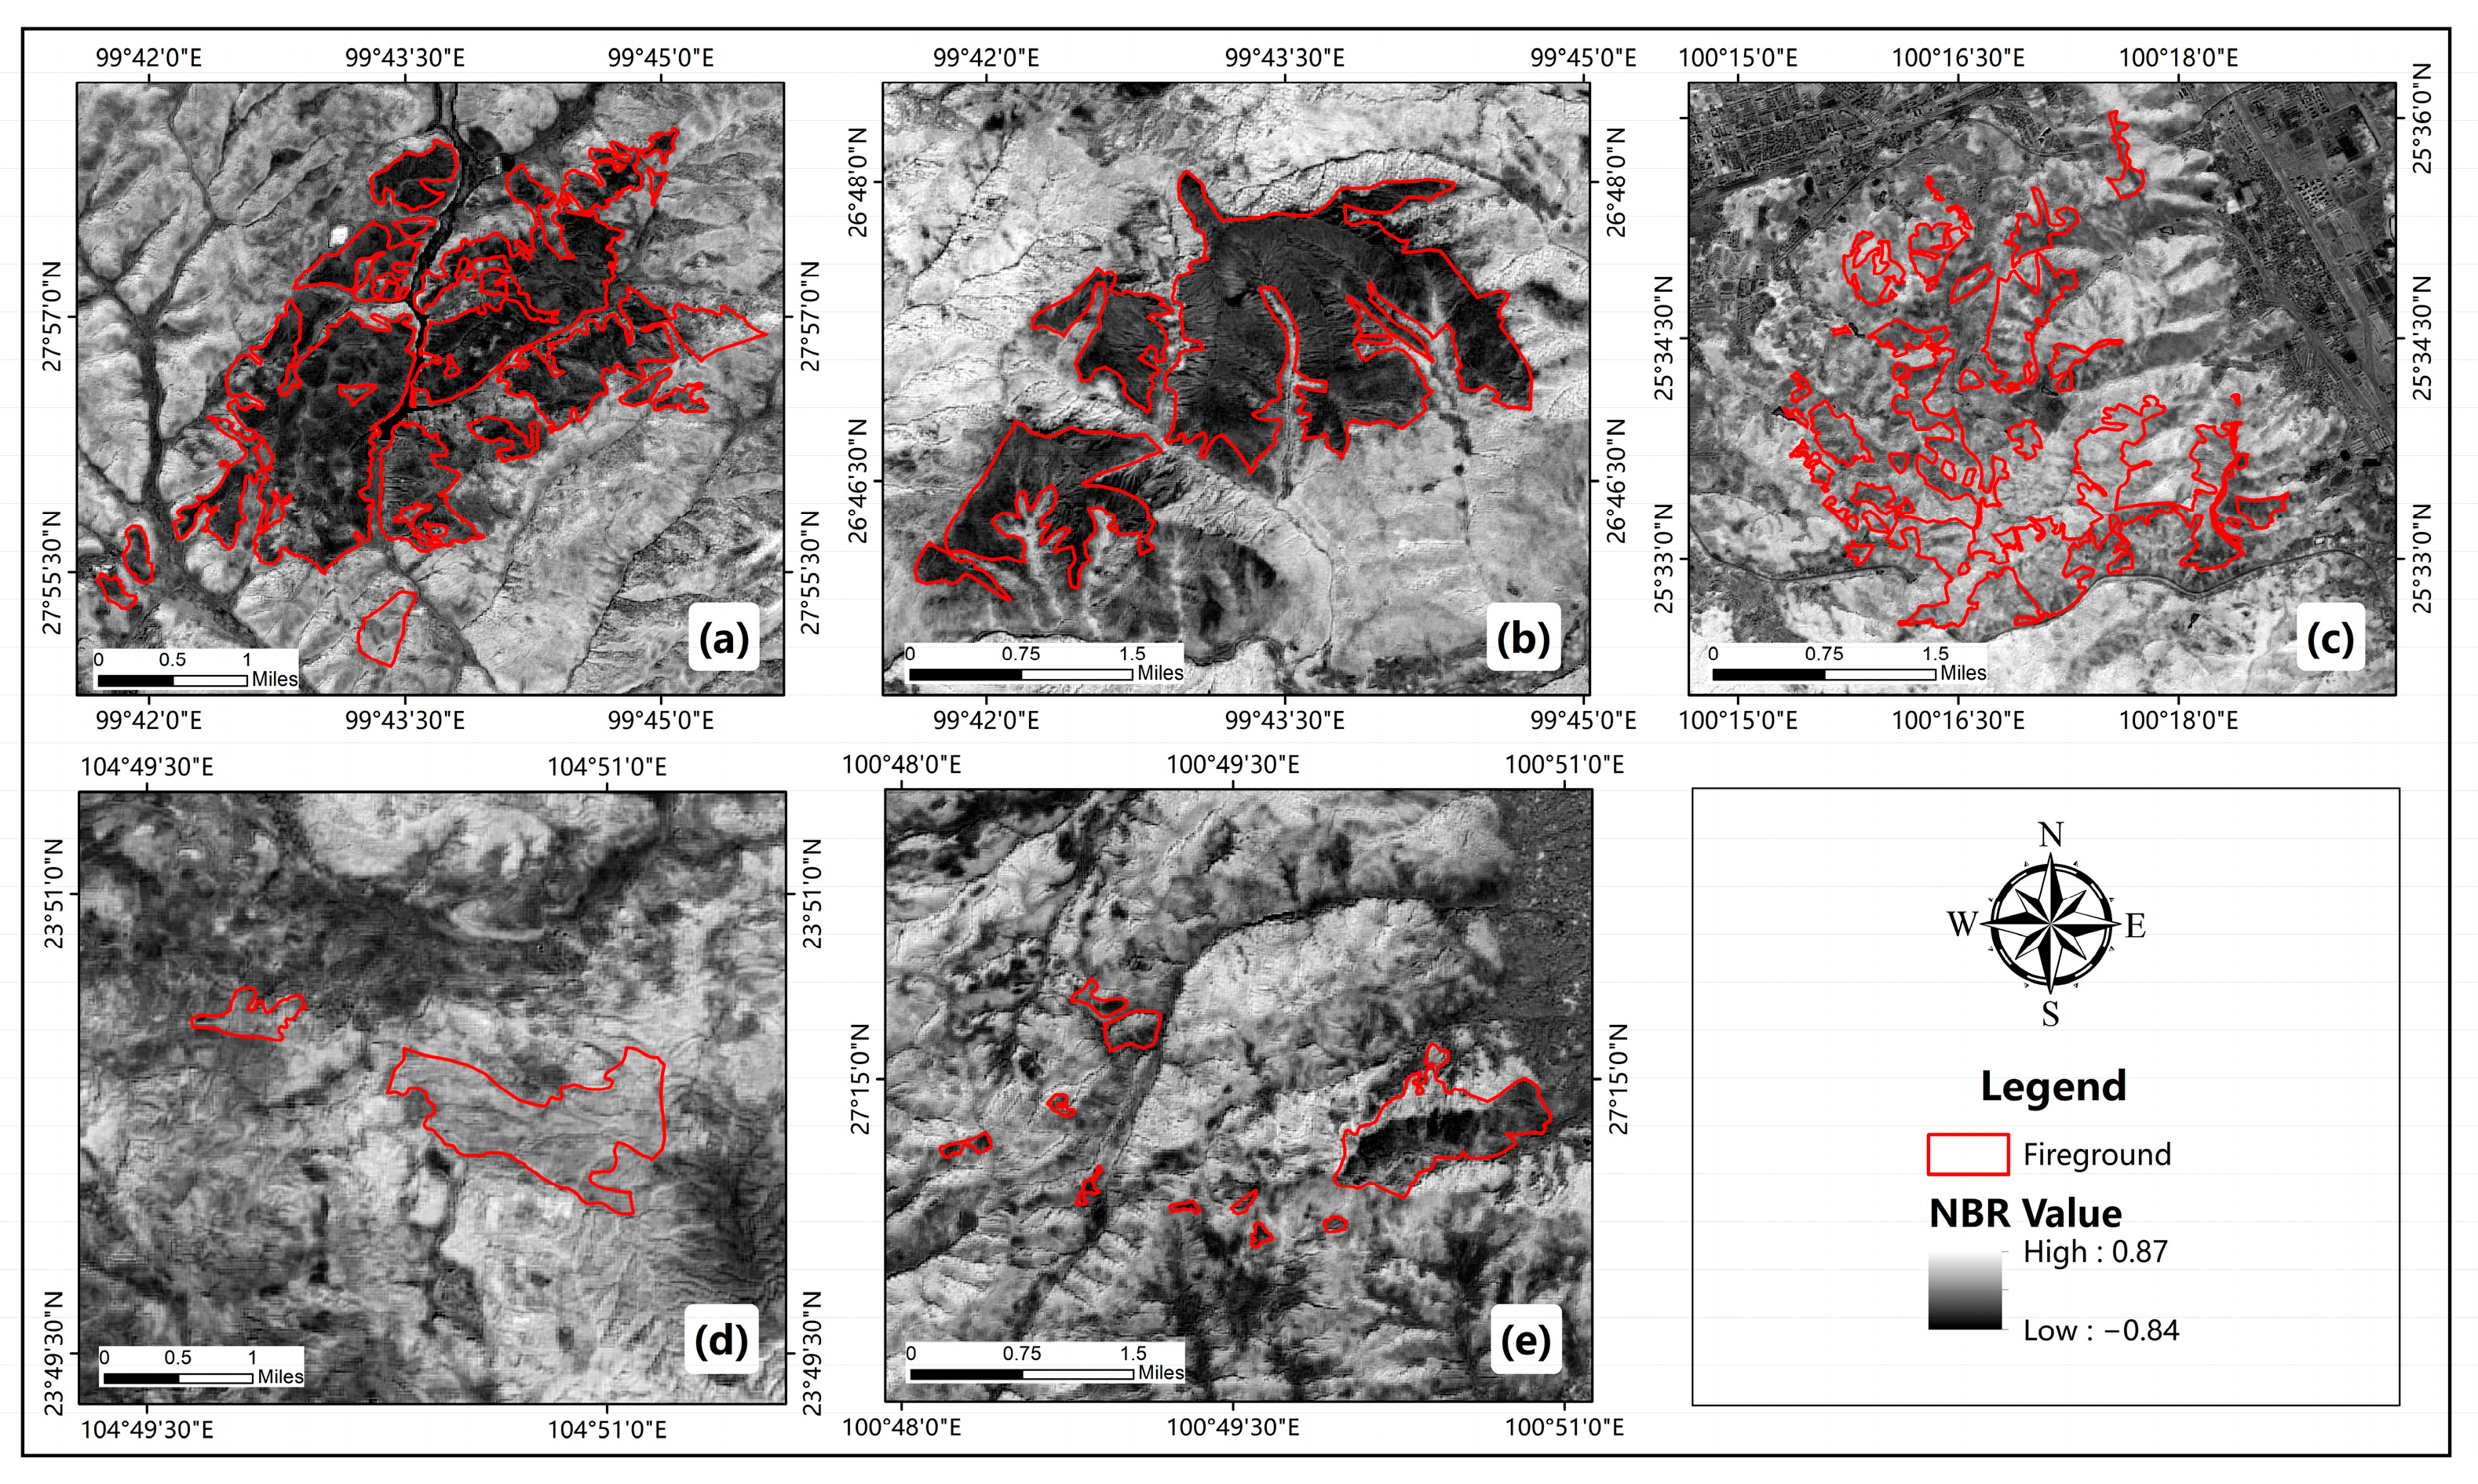
3.3. Analysis of the Spatial and Temporal Scalability of ATLAS Recognition of Firegrounds

In this study, typical firegrounds with the largest areas in four different counties were selected for spatio-temporal scalability validation. Table 4 shows that the RF classifier based on the vertical structure parameters of ATLAS is generally better than the XGBoot classifier for different types of spatio-temporal fire recognition. Moreover, the two classifiers are complementary in terms of different types of spatio-temporal fire recognition; for example, the RF classifier is better in Area02, the XGBoost classifier is relatively worse in Area02, and Areas03 to 05 also show the same pattern. The two classifiers alternately complement each other to improve the spatio-temporal scalability in later studies.
A comparison of the false color sentinel images of Area02 to Area05 in Figure 9 reveals that the fires selected for the study belong to different burn levels in different times and spaces, and the burn levels of all the fires from high to low according to the visual analysis of the false color images are as follows: Area02 > Area05 > Area03 > Area04. Combined with the fire recognition accuracy statistics of different times and spaces in Table 4, the spatial diagram of the ATLAS footprint fire classification in Figure 9 shows the following pattern: the RF classifier outperforms the XGBoost classifier for fires with sufficient ATLAS footprints in areas with severe fire severity. The combination of the two classifiers can be used for areas with moderate fire severity. The XGBoost classifier is significantly better than the RF classifier for areas with lighter burn levels. On the basis of the above results, different algorithmic classifiers can be selected for the optimal recognition of regions with different fire burn levels. Table 4, combined with the overall spatial distributions of different fires in Figure 1, shows that the Area04 fire is the farthest apart in spatial location relative to the other fires, and the recognition accuracy of the RF classifier is 0.714 and that of the XGBoost classifier is 0.143, indicating that the RF classifier constructed on the basis of the vertical structure parameters of ATLAS is better than the XGBoost classifier.

4. Discussion

4.1. Effect of Different Burn Levels on Classification Accuracy

The NBR is a remote sensing index that replaces the red band in the normalized difference vegetation index (NDVI) equation with the shortwave infrared band [45]. The theoretical value of the NBR index ranges from 1 to −1 and is negatively correlated with the intensity of forest fires. Figure 10 shows the overlapping diagram of the NBR indices extracted from fireground imagery and Sentinel-2 imagery at different times and spaces. Combined with Figure 8, both Area02 and Area01 have the same burn level, Area05 has a relatively lower burn level, and Areas03 and Area04 have the lowest burn level. A comparison of the data in Table 4 reveals that the higher the burn level is, the higher the accuracy of the recognition classifier constructed in this study is, and vice versa. In summary, the different degrees of burn damage influence the recognition accuracy of the fire recognition classifier constructed on the basis of the ATLAS parameter system. However, the RF classifier is affected to a lesser extent than the XGBoost classifier, indicating that the recognition effect of the RF classifier is more stable.

4.2. Limitations and Prospects

Table 4 and Figure 9 show that the high classification accuracy reveals the feasibility of using the ATL08 indicator to map the burned area along the track. However, there are several limitations. First, because of the random nature and uncontrollable timing of forest fires, there is inevitably some time lag between the fire data and the acquired ICESat-2/ATLAS data. The re-entry period of ICESat-2 is 91 days, and some forest recovery after the fire will reduce the difference between burned and unburned forests, thus creating more challenges for postburn fire classification. Furthermore, postfire site clearance logging can harm forest structure. This leads to some differences between the vertical structure information obtained by ATLAS and the actual situation on site, which is one of the factors contributing to the low accuracy of different types of temporal and spatial fire recognition. The numbers of footprints within the firegrounds of the four areas identified for different spatio-temporal validations in the study were 64, 16, 7, and 25. The plots and spatial distributions reveal that the number of footprints within the fireground is insufficient. Moreover, the ATL08 data product selected for the study was processed at a distance of 100 m for zonal segments, resulting in fewer footprints within the fireground, making the spatio-temporal scalability less detailed and perfect.
This study used the RF and XGBoost algorithms in machine learning algorithms to construct a classification system for recognizing firegrounds with several classes of parameters in ATLAS data. However, the recognition accuracy for firegrounds with low burn levels in different times and spaces needs further improvement. Concerning the use of deep learning algorithms in other studies to improve classification recognition accuracy, the black box model, the requirement for training data, and the adjustment of many hyperparameters limit in-depth research in terms of theory and interpretable analysis, etc. [46], and, most importantly, limit its promotion in small sample data application scenarios [47]. In addition, owing to the small number of ATLAS footprints within the fireground, our classification system cannot meet the need for large sample sizes in deep learning. It is suggested that more prospective forest recognition algorithms be considered. Future forests first use convolutional neural networks (CNNs) to extract depth features and then use random forest (RF) [48] as the model structure of the classifier, which is called deep forest (DF) [49]. A study constructed target classification for synthetic aperture radar (SAR) data using the deep forest algorithm, and the results indicate that both the deep forest model and its optimized version achieved satisfactory outcomes in target classification [50]. Deep forest models have also been applied in crop health monitoring, with studies showing their use in identifying and classifying leaf diseases in maize plants. The classification accuracy showed significant improvement over existing manual classification methods and other less accurate techniques [51]. Overall, the optimized DF algorithm can be considered for future implementation as a non-neural network deep learning method for small sample data. Using the optimized DF algorithm generally enables the deep learning of non-neural networks for small sample data.

5. Conclusions

This study is based on satellite-based photon counting radar ICESat-2/ATLAS data, which use parameters of overall and vertical structure and topography, for fire recognition in five regions in different spatial and temporal locations in Yunnan Province, China. The classifier algorithms used in the study include RF and XGBoost, both of which yield good results. Finally, the two classifiers’ feasibility in spatio-temporal extensibility was analyzed and compared.
(1)
The parameter segment_landcover contributed the most to both the RF and XGBoost classifiers, with values of 7.8% and 21.2%, respectively, in the satellite-based photon-counting radar ATLAS data. The parameters associated with the canopy type, such as the canopy photon count, canopy openness, 95% quantile canopy height, etc., had relatively high contribution rates in both classifiers. The contributions of the parameters associated with the topography and overall type were relatively low. The use of ICESat-2/ATLAS vertical structure parameters to identify firegrounds has some feasibility.
(2)
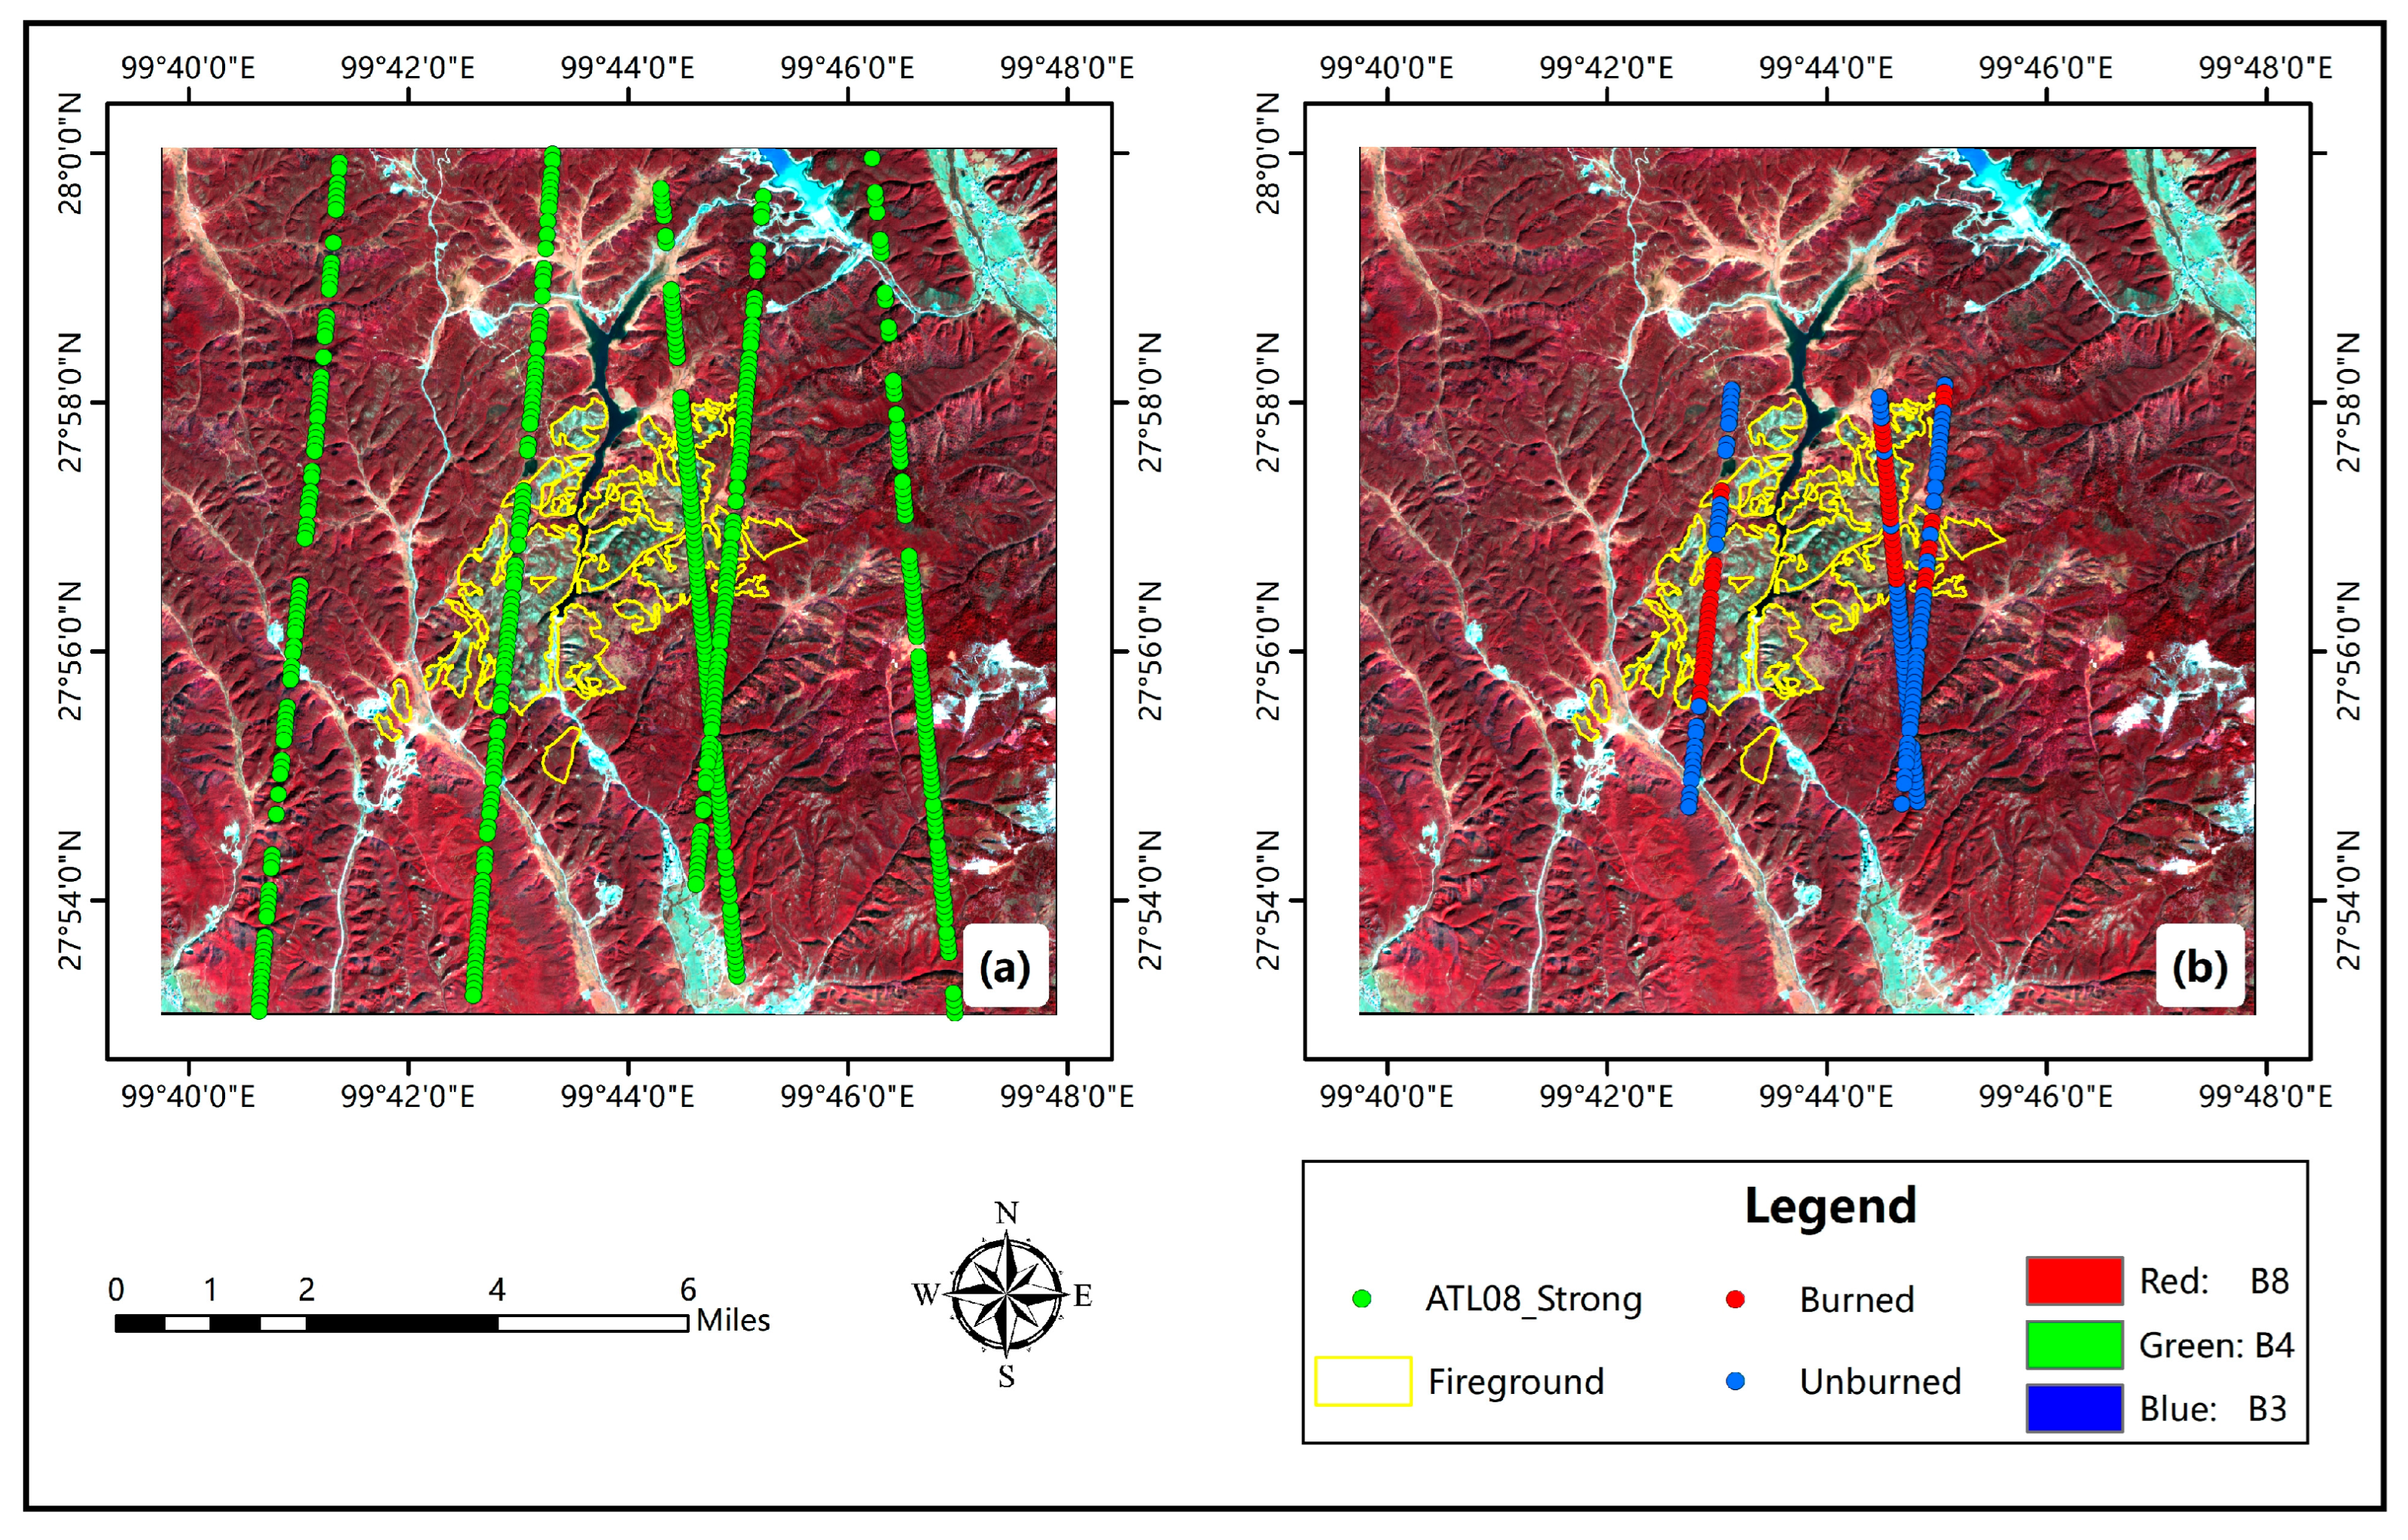
The overall recognition accuracy of the XGBoost classifier, which is based on the vertical structure parameters of ATLAS in Shangri-La City via the 10-fold cross-validation method, is slightly better than that of the RF classifier. Both classifiers showed better potential with all evaluation metrics greater than 0.8 when tested with independent test samples, and both classifiers can be used for fire recognition with better results. The misclassified spots are mainly concentrated in gully areas with complex terrain, and the terrain may have some influence on the photon counting radar.
(3)
The RF classifier based on ATLAS vertical structure parameters is generally better than the XGBoost classifier for different spatial and temporal firegrounds, and the recognition effect is more stable and excellent. For areas with moderate fire severity, a combination of both classifiers can be used to complement each other for better recognition. The XGBoost classifier significantly outperforms the RF classifier for lighter areas.

Author Contributions

Conceptualization, X.W. and J.Y.; writing—original draft preparation, G.C.; writing—review and editing, G.C., X.W. and J.Y.; visualization, G.C.; supervision, X.W.; project administration, J.Y.; funding acquisition, X.W. and J.Y. All authors have read and agreed to the published version of the manuscript.

Funding

This research was funded by the National Natural Science Foundation of China (32360392, 42061074) and the Yunnan Province Reserve Talent Program for Young and Middle-aged Academic and Technical Leaders (202205AC160014, 202405AD350057), the Natural Science Foundation of Yunnan Province of China (202101AT070052, 202301BD070001-245), and the Top Discipline Project of Forestry at Southwest Forestry University (523003).

Data Availability Statement

The data presented in this study are available on request from the corresponding author.

Conflicts of Interest

The authors declare no conflicts of interest.

References

  1. Li, M.; Wang, B.; Fan, W.; Zhao, D. Simulation of forest net primary production and the effects of fire disturbance in Northeast China. Chin. J. Plant Ecol. 2015, 39, 322–332. [Google Scholar]
  2. Liu, Z.; Chang, Y.; He, H.; Chen, H. Long-term effects of fire suppression policy on forest landscape, fuels dynamics, and fire risks in Great Xing’an Mountains. Chin. J. Ecol. 2009, 28, 70–79. [Google Scholar]
  3. Li, Z.; Qing, X.L.; Gao, Z.; Deng, G.; Yi, L.; Sun, G.; Zu, X. Analysision monitoring burning status of forest fire using GF-4 satellite images. Spacecr. Eng. 2016, 25, 201–205. [Google Scholar]
  4. Qing, X.L.; Li, X.; Liu, S.; Liu, Q.; Li, Z. Forest fire early warning and monitoring techniques using satellite remote sensing in China. J. Remote Sens. 2020, 24, 511–520. [Google Scholar]
  5. Yang, Y.S. Forest Fire Recognition and Vegetation Restoration Evaluation Based on Google Earth Engine. Ph.D. Thesis, Beijing Forestry University, Beijing, China, 2020. [Google Scholar]
  6. Li, W.; Niu, Z.; Shang, R.; Qin, Y.; Wang, L.; Chen, H. High-resolution mapping of forest canopy height using machine learning by coupling ICESat-2 LiDAR with Sentinel-1, Sentinel-2 and Landsat-8 data. Int. J. Appl. Earth Obs. Geoinf. 2020, 92, 102163. [Google Scholar] [CrossRef]
  7. Flasse, S.; Ceccato, P. A contextual algorithm for AVHRR fire detection. Int. J. Remote Sens. 1996, 17, 419–424. [Google Scholar] [CrossRef]
  8. Kudoh, J.-I. Forest fire detection in Far East Region of Russia with NOAA-15 in 1998. In Proceedings of the IEEE 1999 International Geoscience and Remote Sensing Symposium, IGARSS’99 (Cat. No. 99CH36293), Hamburg, Germany, 28 June–2 July 1999; pp. 182–184. [Google Scholar]
  9. Nakayama, M.; Maki, M.; Elvidge, C.; Liew, S. Contextual algorithm adapted for NOAA-AVHRR fire detection in Indonesia. Int. J. Remote Sens. 1999, 20, 3415–3421. [Google Scholar] [CrossRef]
  10. Giglio, L.; Descloitres, J.; Justice, C.O.; Kaufman, Y.J. An enhanced contextual fire detection algorithm for MODIS. Remote Sens. Environ. 2003, 87, 273–282. [Google Scholar] [CrossRef]
  11. Sharma, S.K.; Aryal, J.; Rajabifard, A. Remote Sensing and Meteorological Data Fusion in Predicting Bushfire Severity: A Case Study from Victoria, Australia. Remote Sens. 2022, 14, 1645. [Google Scholar] [CrossRef]
  12. Pang, Y.; Jia, W.; Qing, X.; Si, L.; Liang, X.; Lin, X.; Li, Z. Forest fire monitoring using airborne optical full spectrum remote sensing data. J. Remote Sens. 2020, 24, 1280–1292. [Google Scholar] [CrossRef]
  13. Röder, A.; Hill, J.; Duguy, B.; Alloza, J.A.; Vallejo, R. Using long time series of Landsat data to monitor fire events and post-fire dynamics and identify driving factors. A case study in the Ayora region (eastern Spain). Remote Sens. Environ. 2008, 112, 259–273. [Google Scholar] [CrossRef]
  14. Quintano, C.; Fernandez-Manso, A.; Roberts, D.A. Burn severity mapping from Landsat MESMA fraction images and Land Surface Temperature. Remote Sens. Environ. 2017, 190, 83–95. [Google Scholar] [CrossRef]
  15. Kato, A.; Moskal, L.M.; Batchelor, J.L.; Thau, D.; Hudak, A.T. Relationships between Satellite-Based Spectral Burned Ratios and Terrestrial Laser Scanning. Forests 2019, 10, 444. [Google Scholar] [CrossRef]
  16. Yue, C.; Ciais, P.; Cadule, P.; Thonicke, K.; van Leeuwen, T.T. Modelling the role of fires in the terrestrial carbon balance by incorporating SPITFIRE into the global vegetation model ORCHIDEE—Part 2: Carbon emissions and the role of fires in the global carbon balance. Geosci. Model Dev. 2015, 8, 1321–1338. [Google Scholar] [CrossRef]
  17. Liu, s.; Li, X.; Qing, X.; Sun, G.; Liu, Q. Adaptive threshold method for active fire identification based on GF-4 PMI data. Natl. Remote Sens. Bull. 2020, 24, 215–225. [Google Scholar] [CrossRef]
  18. Lin, X.; Qing, X.L.; Liu, Q.; Liu, S. Application of GF-6 Wide Data in Identification of Forest Fire Traces—A Case Study of Hanma Nature Reserve in Daxing’ an Mountains, Inner Mongolia. Satell. Appl. 2019, 01, 41–44. [Google Scholar]
  19. Pang, Y.; Li, Z.; Ju, H.; Lu, H.; Jia, W.; Si, L.; Guo, Y.; Liu, Q.; Li, S.; Liu, L.; et al. LiCHy: The CAF’s LiDAR, CCD and Hyperspectral Integrated Airborne Observation System. Remote Sens. 2016, 8, 398. [Google Scholar] [CrossRef]
  20. Veraverbeke, S.; Dennison, P.; Gitas, I.; Hulley, G.; Kalashnikova, O.; Katagis, T.; Kuai, L.; Meng, R.; Roberts, D.; Stavros, N. Hyperspectral remote sensing of fire: State-of-the-art and future perspectives. Remote Sens. Environ. 2018, 216, 105–121. [Google Scholar] [CrossRef]
  21. Krishna Moorthy, S.M.; Bao, Y.; Calders, K.; Schnitzer, S.A.; Verbeeck, H. Semi-automatic extraction of liana stems from terrestrial LiDAR point clouds of tropical rainforests. ISPRS J. Photogramm. Remote Sens. 2019, 154, 114–126. [Google Scholar] [CrossRef] [PubMed]
  22. González-Olabarria, J.-R.; Rodríguez, F.; Fernández-Landa, A.; Mola-Yudego, B. Mapping fire risk in the Model Forest of Urbión (Spain) based on airborne LiDAR measurements. For. Ecol. Manag. 2012, 282, 149–156. [Google Scholar] [CrossRef]
  23. Alonzo, M.; Morton, D.C.; Cook, B.D.; Andersen, H.-E.; Babcock, C.; Pattison, R. Patterns of canopy and surface layer consumption in a boreal forest fire from repeat airborne lidar. Environ. Res. Lett. 2017, 12, 065004. [Google Scholar] [CrossRef]
  24. Oliveira, C.P.d.; Ferreira, R.L.C.; da Silva, J.A.A.; Lima, R.B.d.; Silva, E.A.; Silva, A.F.d.; Lucena, J.D.S.d.; dos Santos, N.A.T.; Lopes, I.J.C.; Pessoa, M.M.d.L.; et al. Modeling and Spatialization of Biomass and Carbon Stock Using LiDAR Metrics in Tropical Dry Forest, Brazil. Forests 2021, 12, 473. [Google Scholar] [CrossRef]
  25. Chen, M.; Qiu, X.; Zeng, W.; Peng, D. Combining Sample Plot Stratification and Machine Learning Algorithms to Improve Forest Aboveground Carbon Density Estimation in Northeast China Using Airborne LiDAR Data. Remote Sens. 2022, 14, 1477. [Google Scholar] [CrossRef]
  26. Wang, C.; Glenn, N.F. Estimation of fire severity using pre-and post-fire LiDAR data in sagebrush steppe rangelands. Int. J. Wildland Fire 2009, 18, 848–856. [Google Scholar] [CrossRef]
  27. Montealegre, A.L.; Lamelas, M.T.; Tanase, M.A.; De la Riva, J. Forest fire severity assessment using ALS data in a Mediterranean environment. Remote Sens. 2014, 6, 4240–4265. [Google Scholar] [CrossRef]
  28. Garcia, M.; Saatchi, S.; Casas, A.; Koltunov, A.; Ustin, S.; Ramirez, C.; Garcia-Gutierrez, J.; Balzter, H. Quantifying biomass consumption and carbon release from the California Rim fire by integrating airborne LiDAR and Landsat OLI data. J. Geophys. Res. Biogeosci. 2017, 122, 340–353. [Google Scholar] [CrossRef] [PubMed]
  29. Huang, X.; Xie, H.; Liang, T.; Yi, D. Estimating vertical error of SRTM and map-based DEMs using ICESat altimetry data in the eastern Tibetan Plateau. Int. J. Remote Sens. 2011, 32, 5177–5196. [Google Scholar] [CrossRef]
  30. García, M.; Popescu, S.; Riaño, D.; Zhao, K.; Neuenschwander, A.; Agca, M.; Chuvieco, E. Characterization of canopy fuels using ICESat/GLAS data. Remote Sens. Environ. 2012, 123, 81–89. [Google Scholar] [CrossRef]
  31. Liu, M.-S.; Xing, Y.-Q.; Wu, H.-B.; You, H.-T. Study on Mean Forest Canopy Height Estimation Based on ICESat-GLAS Waveforms. For. Res. 2014, 27, 309–315. [Google Scholar]
  32. Neuenschwander, A.; Pitts, K. The ATL08 land and vegetation product for the ICESat-2 Mission. Remote Sens. Environ. 2019, 221, 247–259. [Google Scholar]
  33. Popescu, S.C.; Zhou, T.; Nelson, R.; Neuenschwande, A.; Sheridan, R.; Narine, L.; Walsh, K.M. Photon counting LiDAR: An adaptive ground and canopy height retrieval algorithm for ICESat-2 data. Remote Sens. Environ. 2018, 208, 154–170. [Google Scholar] [CrossRef]
  34. Liu, M.; Popescu, S.; Malambo, L. Feasibility of Burned Area Mapping Based on ICESAT−2 Photon Counting Data. Remote Sens. 2019, 12, 24. [Google Scholar] [CrossRef]
  35. Silva, C.A.; Duncanson, L.; Hancock, S.; Neuenschwander, A.; Thomas, N.; Hofton, M.; Fatoyinbo, L.; Simard, M.; Marshak, C.Z.; Armston, J.; et al. Fusing simulated GEDI, ICESat-2 and NISAR data for regional aboveground biomass mapping. Remote Sens. Environ. 2021, 253, 112234. [Google Scholar] [CrossRef]
  36. Magruder, L.; Neumann, T.; Kurtz, N. ICESat-2 Early Mission Synopsis and Observatory Performance. Earth Space Sci. 2021, 8, e2020EA001555. [Google Scholar] [CrossRef] [PubMed]
  37. Babbel, B.J.; Parrish, C.E.; Magruder, L.A. ICESat-2 Elevation Retrievals in Support of Satellite-Derived Bathymetry for Global Science Applications. Geophys. Res. Lett. 2021, 48, e2020GL090629. [Google Scholar] [CrossRef]
  38. Zhang, J.; Tian, J.; Li, X.; Wang, L.; Chen, B.; Gong, H.; Ni, R.; Zhou, B.; Yang, C. Leaf area index retrieval with ICESat-2 photon counting LiDAR. Int. J. Appl. Earth Obs. Geoinf. 2021, 103, 102488. [Google Scholar] [CrossRef]
  39. Wu, Z.; Li, M.; Wang, B.; Tian, Y.; Quan, Y.; Liu, J. Analysis of Factors Related to Forest Fires in Different Forest Ecosystems in China. Forests 2022, 13, 1021. [Google Scholar] [CrossRef]
  40. Breiman, L. Random forests. Mach. Learn. 2001, 45, 5–32. [Google Scholar] [CrossRef]
  41. Mitchell, T.M. Machine Learning; McGraw-hill: New York, NY, USA, 2003; Available online: https://www.cin.ufpe.br/~cavmj/Machine%20-%20Learning%20-%20Tom%20Mitchell.pdf (accessed on 25 May 2022).
  42. Pedregosa, F.; Varoquaux, G.; Gramfort, A.; Michel, V.; Thirion, B.; Grisel, O.; Blondel, M.; Prettenhofer, P.; Weiss, R.; Dubourg, V. Scikit-learn: Machine learning in Python. J. Mach. Learn. Res. 2011, 12, 2825–2830. [Google Scholar]
  43. Jafarzadeh, H.; Mahdianpari, M.; Gill, E.; Mohammadimanesh, F.; Homayouni, S. Bagging and Boosting Ensemble Classifiers for Classification of Multispectral, Hyperspectral and PolSAR Data: A Comparative Evaluation. Remote Sens. 2021, 13, 4405. [Google Scholar] [CrossRef]
  44. Jia, W.; Coops, N.C.; Tortini, R.; Pang, Y.; Black, T.A. Remote sensing of variation of light use efficiency in two age classes of Douglas-fir. Remote Sens. Environ. 2018, 219, 284–297. [Google Scholar] [CrossRef]
  45. García, M.L.; Caselles, V. Mapping burns and natural reforestation using Thematic Mapper data. Geocarto Int. 1991, 6, 31–37. [Google Scholar] [CrossRef]
  46. Narine, L.L.; Popescu, S.C.; Malambo, L. Synergy of ICESat-2 and Landsat for Mapping Forest Aboveground Biomass with Deep Learning. Remote Sens. 2019, 11, 1503. [Google Scholar] [CrossRef]
  47. Zhou, X.; Zhou, W.; Li, F.; Shao, Z.; Fu, X. Vegetation Type Classification Based on 3D Convolutional Neural Network Model: A Case Study of Baishuijiang National Nature Reserve. Forests 2022, 13, 906. [Google Scholar] [CrossRef]
  48. Hinton, G.; Deng, L.; Yu, D.; Dahl, G.E.; Mohamed, A.-R.; Jaitly, N.; Senior, A.; Vanhoucke, V.; Nguyen, P.; Sainath, T.N. Deep neural networks for acoustic modeling in speech recognition: The shared views of four research groups. IEEE Signal Process. Mag. 2012, 29, 82–97. [Google Scholar] [CrossRef]
  49. Zhou, Z.-H.; Feng, J. Deep forest. Natl. Sci. Rev. 2019, 6, 74–86. [Google Scholar] [CrossRef]
  50. Zhang, J.; Song, H.; Zhou, B. SAR Target Classification Based on Deep Forest Model. Remote Sens. 2020, 12, 128. [Google Scholar] [CrossRef]
  51. Arora, J.; Agrawal, U. Classification of Maize leaf diseases from healthy leaves using Deep Forest. J. Artif. Intell. Syst. 2020, 2, 14–26. [Google Scholar] [CrossRef]
Figure 1. Locations of the firegrounds.
Forests 15 01597 g001
Figure 2. Study flow chart.
Forests 15 01597 g002
Figure 3. Map of woodland distribution. (a) Area01 Shangri-La City; (b) Area02 Lijiang Naxi Autonomous County; (c) Area03 Dali City; (d) Area04 Guangnan County; (e) Area05 Ninglang Yi Autonomous County.
Forests 15 01597 g003
Figure 4. Schematic diagram of the overlap between the ATLAS footprint and the fire in Shangri-La. (a) ATLAS orbital spot data; (b) ATLAS intersecting with the fireground.
Forests 15 01597 g004
Figure 5. Schematic diagram of ATLAS and fireground overlap. (a) Area01 Shangri-La city; (b) Area02 Lijiang Naxi Autonomous County; (c) Area03 Dali city; (d) Area04 Guangnan County; (e) Area05 Ninglang Yi Autonomous County.
Forests 15 01597 g005
Figure 6. Contributions of ATLAS parameters in classifiers. (a) iRF classifier. (b) XGBoost classifier.
Forests 15 01597 g006
Figure 7. Percent contributions of different types of ATLAS parameters. (a) RF classifier. (b) XGBoost classifier.
Forests 15 01597 g007
Figure 8. Schematic diagram of ATLAS spot classification: (a) RF classifier and (b) XGBoost classifier.
Forests 15 01597 g008
Figure 9. Schematic diagram of different spatio-temporal classifications of ATLAS spots (RF classifier on the (ad), and XGBoost classifier on the (eh)).
Forests 15 01597 g009
Figure 10. Schematic diagram of the overlap between fireground and NBR in different times and spaces. (a) Area1 Shangri-La City; (b) Area02 Lijiang Naxi Autonomous County; (c) Area03 Dali City; (d) Area04 Guangnan County; (e) Area05 Ninglang Yi Autonomous County.
Forests 15 01597 g010
Table 1. Parameters of the advanced laser altimeter system (ICESat-2/ATLAS) used in the paper.
TypeNameDescriptionPath
Totaldem_hReference DEM elevation.*/dem_h
h_dif_refDifference between h_te_median and dem_h.*/h_dif_ref
latitudeLatitude of each received photon.*/lat_ph
longitudeLongitude of each received photon.*/lon_ph
n_seg_phNumber of photons within each land segment.*/n_seg_ph
segment_landcoverReference landcover for segment derived from best global landcover product available.*/segment_landcover
asrApparent surface reflectance*/asr
Canopycanopy_opennessSTD of relative heights for all photons classified as canopy photons within the segment to provide inference of canopy openness.*/canopy/canopy_openness
canopy_h_metricsRelative canopy height metrics calculated at the following percentiles: 10 to 95% interval 5 stpe.*/canopy/canopy_h_metrics
centroid_heightAbsolute height above reference ellipsoid associated with the centroid of all signal photons.*/canopy/centroid_height
h_canopy98% height of all the individual relative canopy heights.*/canopy/h_canopy
h_canopy_quadQuadratic mean canopy height.*/canopy/h_canopy_quad
h_dif_canopyDifference between h_canopy and canopy_h_metrics.*/canopy/h_dif_canopy
h_max_canopyMaximum of individual relative canopy heights within segment.*/canopy/h_max_canopy
h_max_canopy_absMaximum of individual absolute canopy heights within segment.*/canopy/h_max_canopy_abs
h_mean_canopyMean of individual relative canopy heights within segment.*/canopy/h_mean_canopy
h_mean_canopy_absMean of individual absolute canopy heights within segment.*/canopy/h_mean_canopy_abs
h_min_canopyMinimum of individual relative canopy heights within segment.*/canopy/h_min_canopy
h_min_canopy_absMinimum of individual absolute canopy heights within segment.*/canopy/h_min_canopy_abs
n_ca_photonsNumber of canopy photons within the segment.*/canopy/n_ca_photons
n_toc_photonsNumber of top and canopy photons within segment.*/canopy/n_toc_photons
photon_rate_canPhoton rate of canopy photons within each segment.*/canopy/photon_rate_can
toc_roughnessSTD of relative heights of all photons classified as top of canopy within the segment.*/canopy/toc_roughness
Terrainn_te_photonsNumber of classed terrain photons in the segment.*/terrain/n_te_photons
photon_rate_teCalculated photon rate for ground photons within each segment.*/terrain/photon_rate_te
terrain_slopeSlope of terrain within segment.*/terrain/terrain_slope
Note: * represents ATL08/gtx/land segments. The latitude and longitude are only used as a positioning reference and are not involved in classifier construction.
Table 2. Spectral bands of Sentinel-2 MS images used in this study.
Sentinel-2 MSI BandsResolutionCenter WavelengthLower–Upper
B210 m496.6 nm (S2A)/492.1 nm (S2B)0.439–0.535 nm
B310 m560.0 nm (S2A)/559.0 nm (S2B)0.537–0.582 nm
B410 m664.5 nm (S2A)/665.0 nm (S2B)0.646–0.685 nm
B810 m835.1 nm (S2A)/833.0 nm (S2B)0.767–0.908 nm
B1120 m1613.7 nm (S2A)/1610.4 nm (S2B)1.568–1.658 nm
Table 3. ATLAS fireground recognition model classification accuracy summary table.
ModelAccuracyRecallPrecisionF1-Measure
RFTraining sets1.0001.0001.0001.000
Cross-validation sets0.7280.7280.7730.712
Test sets0.8330.8330.8440.821
XGBoostTraining sets1.0001.0001.0001.000
Cross-validation sets0.8300.8300.8670.827
Test sets0.8120.8120.8320.819
Table 4. Summary table of the verification accuracies for different spatio-temporal datasets.
Model and AreaAccuracyRecallPrecisionF1-MeasureError
RFArea20.7190.7191.0000.8360.281
Area30.3130.3131.0000.4760.688
Area40.7140.7141.0000.8330.286
Area50.4000.4001.0000.5710.600
XGBoostArea20.3910.3911.0000.5620.609
Area30.6250.6251.0000.7690.375
Area40.1430.1431.0000.2500.857
Area50.2400.2401.0000.3870.760
Disclaimer/Publisher’s Note: The statements, opinions and data contained in all publications are solely those of the individual author(s) and contributor(s) and not of MDPI and/or the editor(s). MDPI and/or the editor(s) disclaim responsibility for any injury to people or property resulting from any ideas, methods, instructions or products referred to in the content.

