
Reliability Analysis of Normal, Lognormal, and Weibull Distributions on Mechanical Behavior of Wood Scrimber

Abstract
1. Introduction
2. Materials and Methods
2.1. Sampling
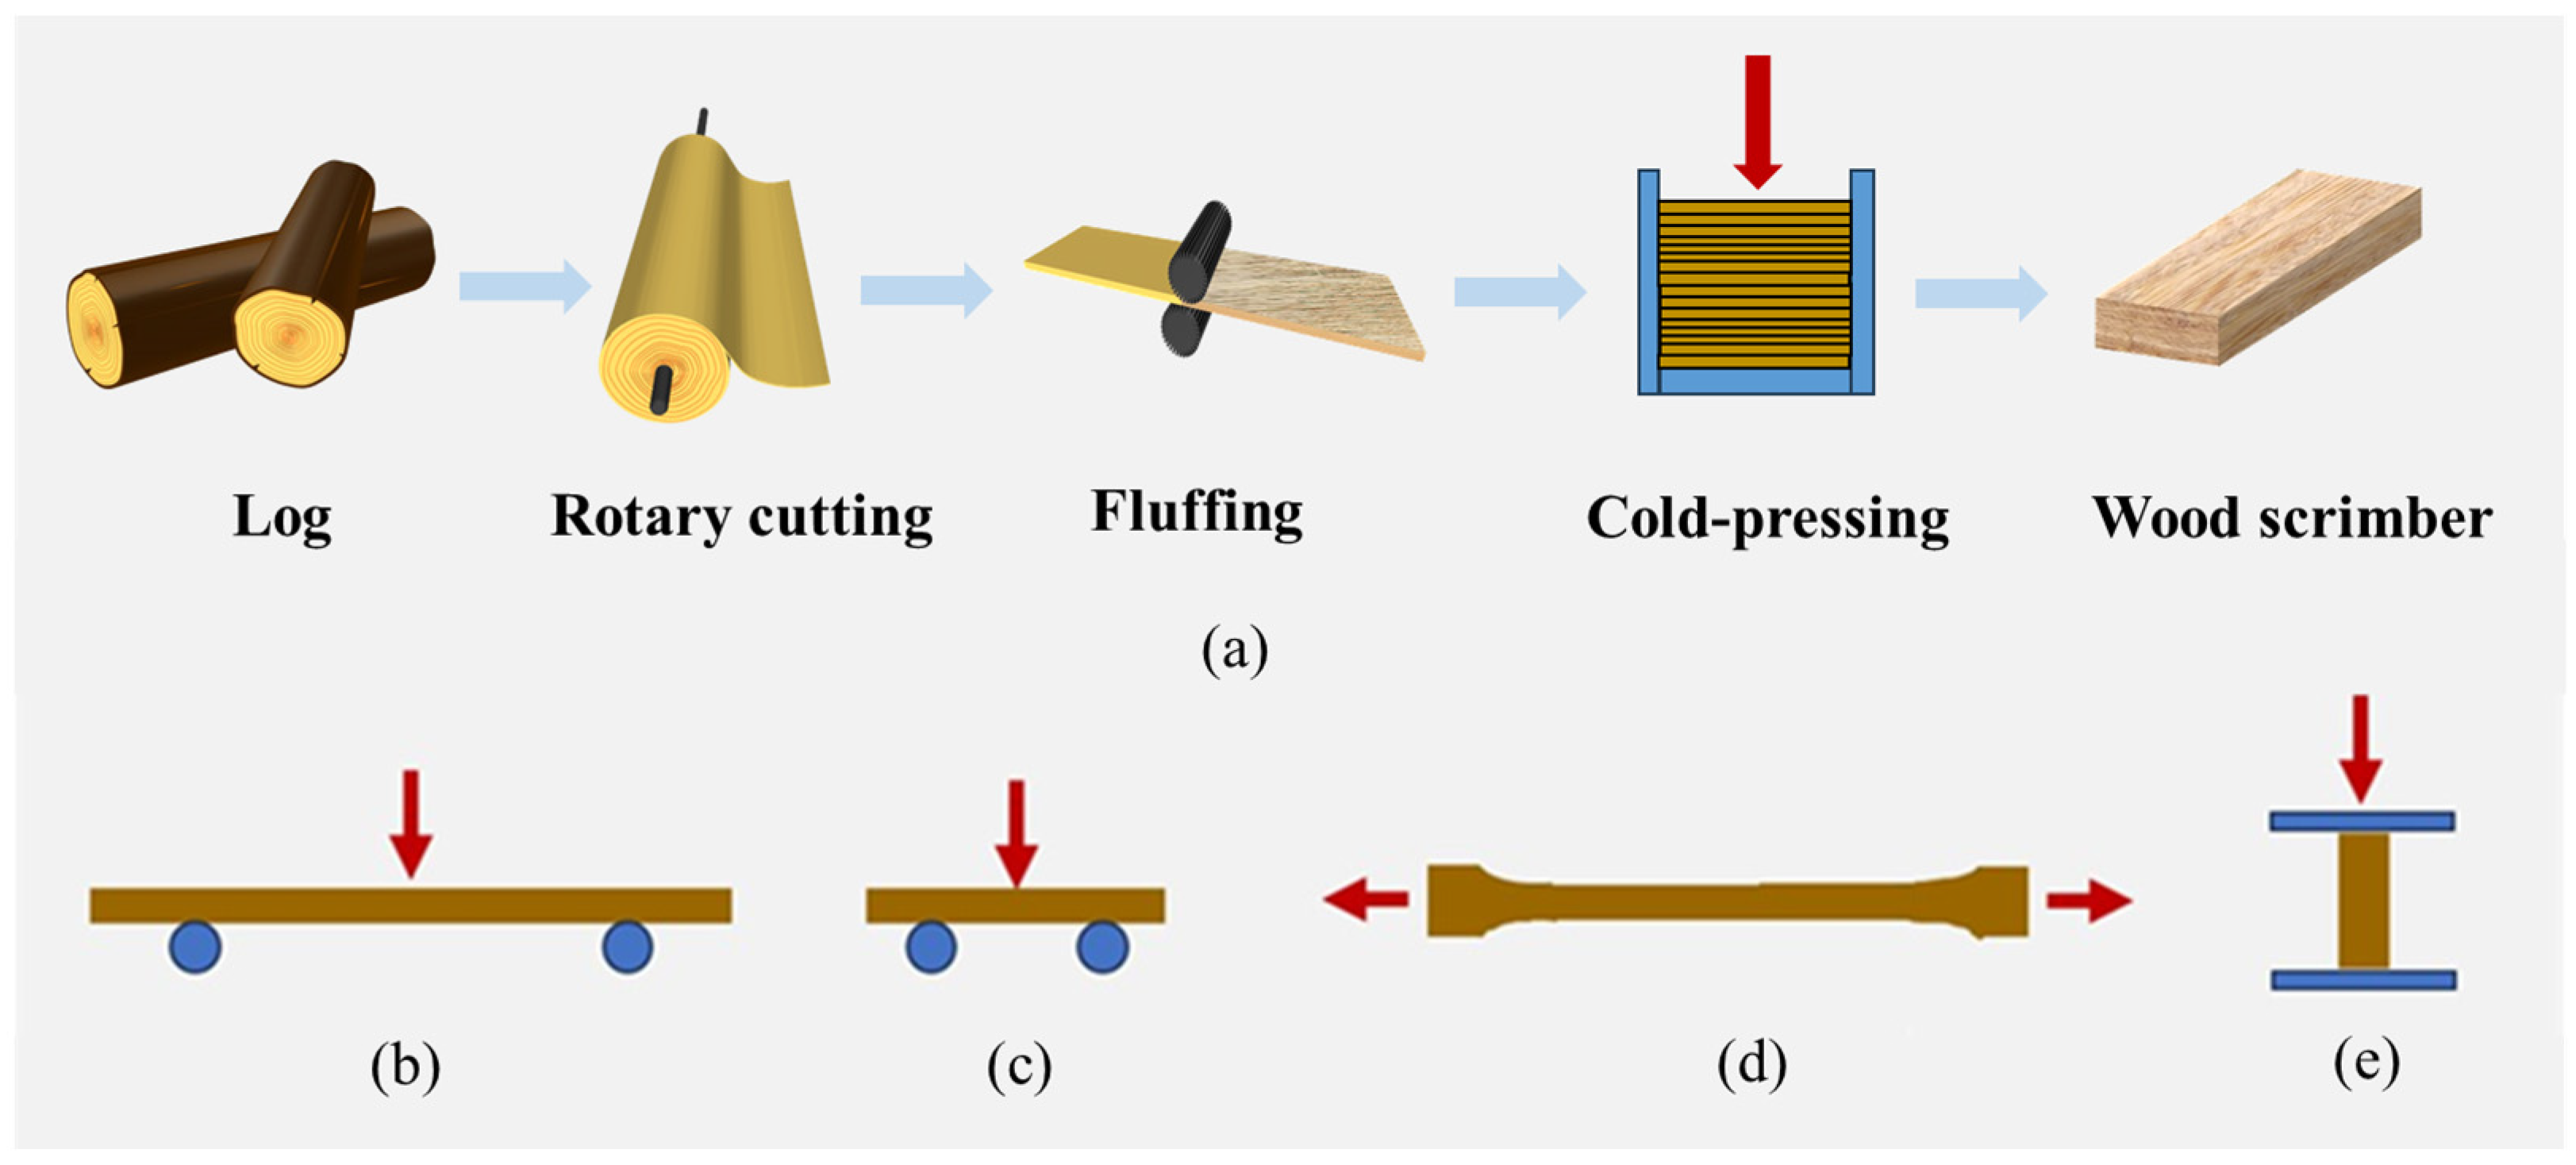
2.2. Methods
2.2.1. Mechanical Characterization
2.2.2. Quantitative Anatomical Characteristics
2.2.3. Distribution Analysis
3. Results and Discussion
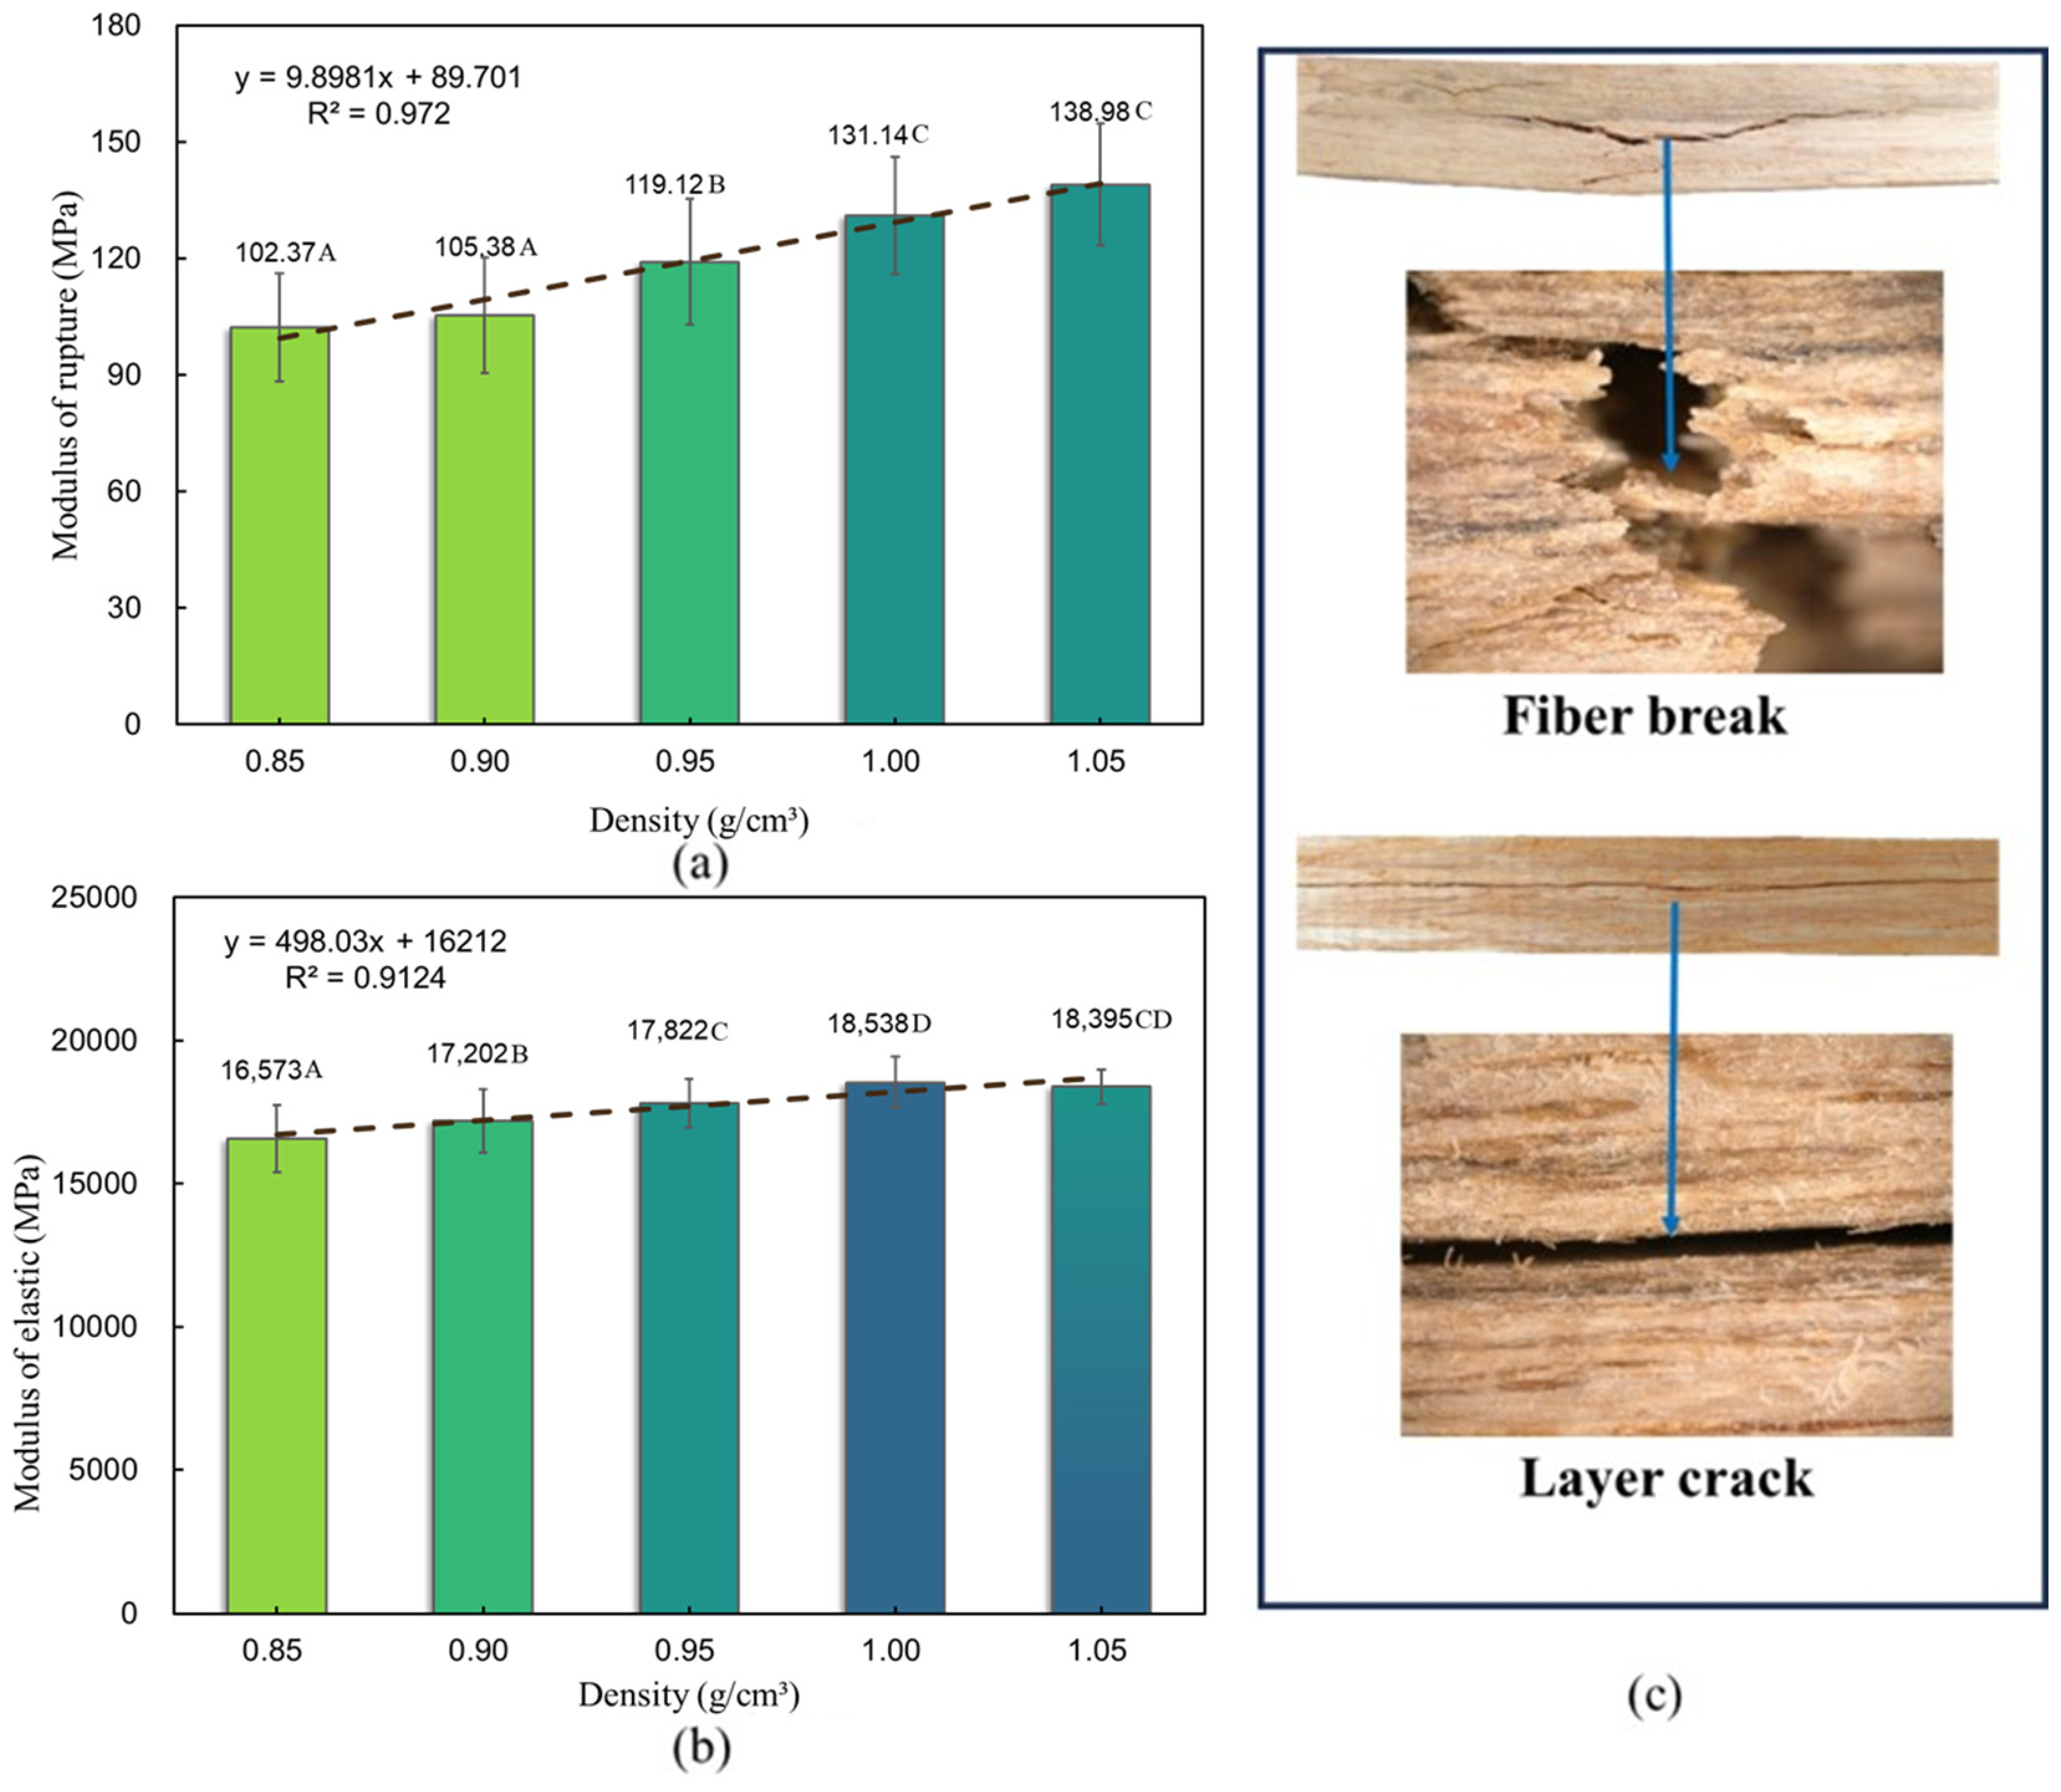
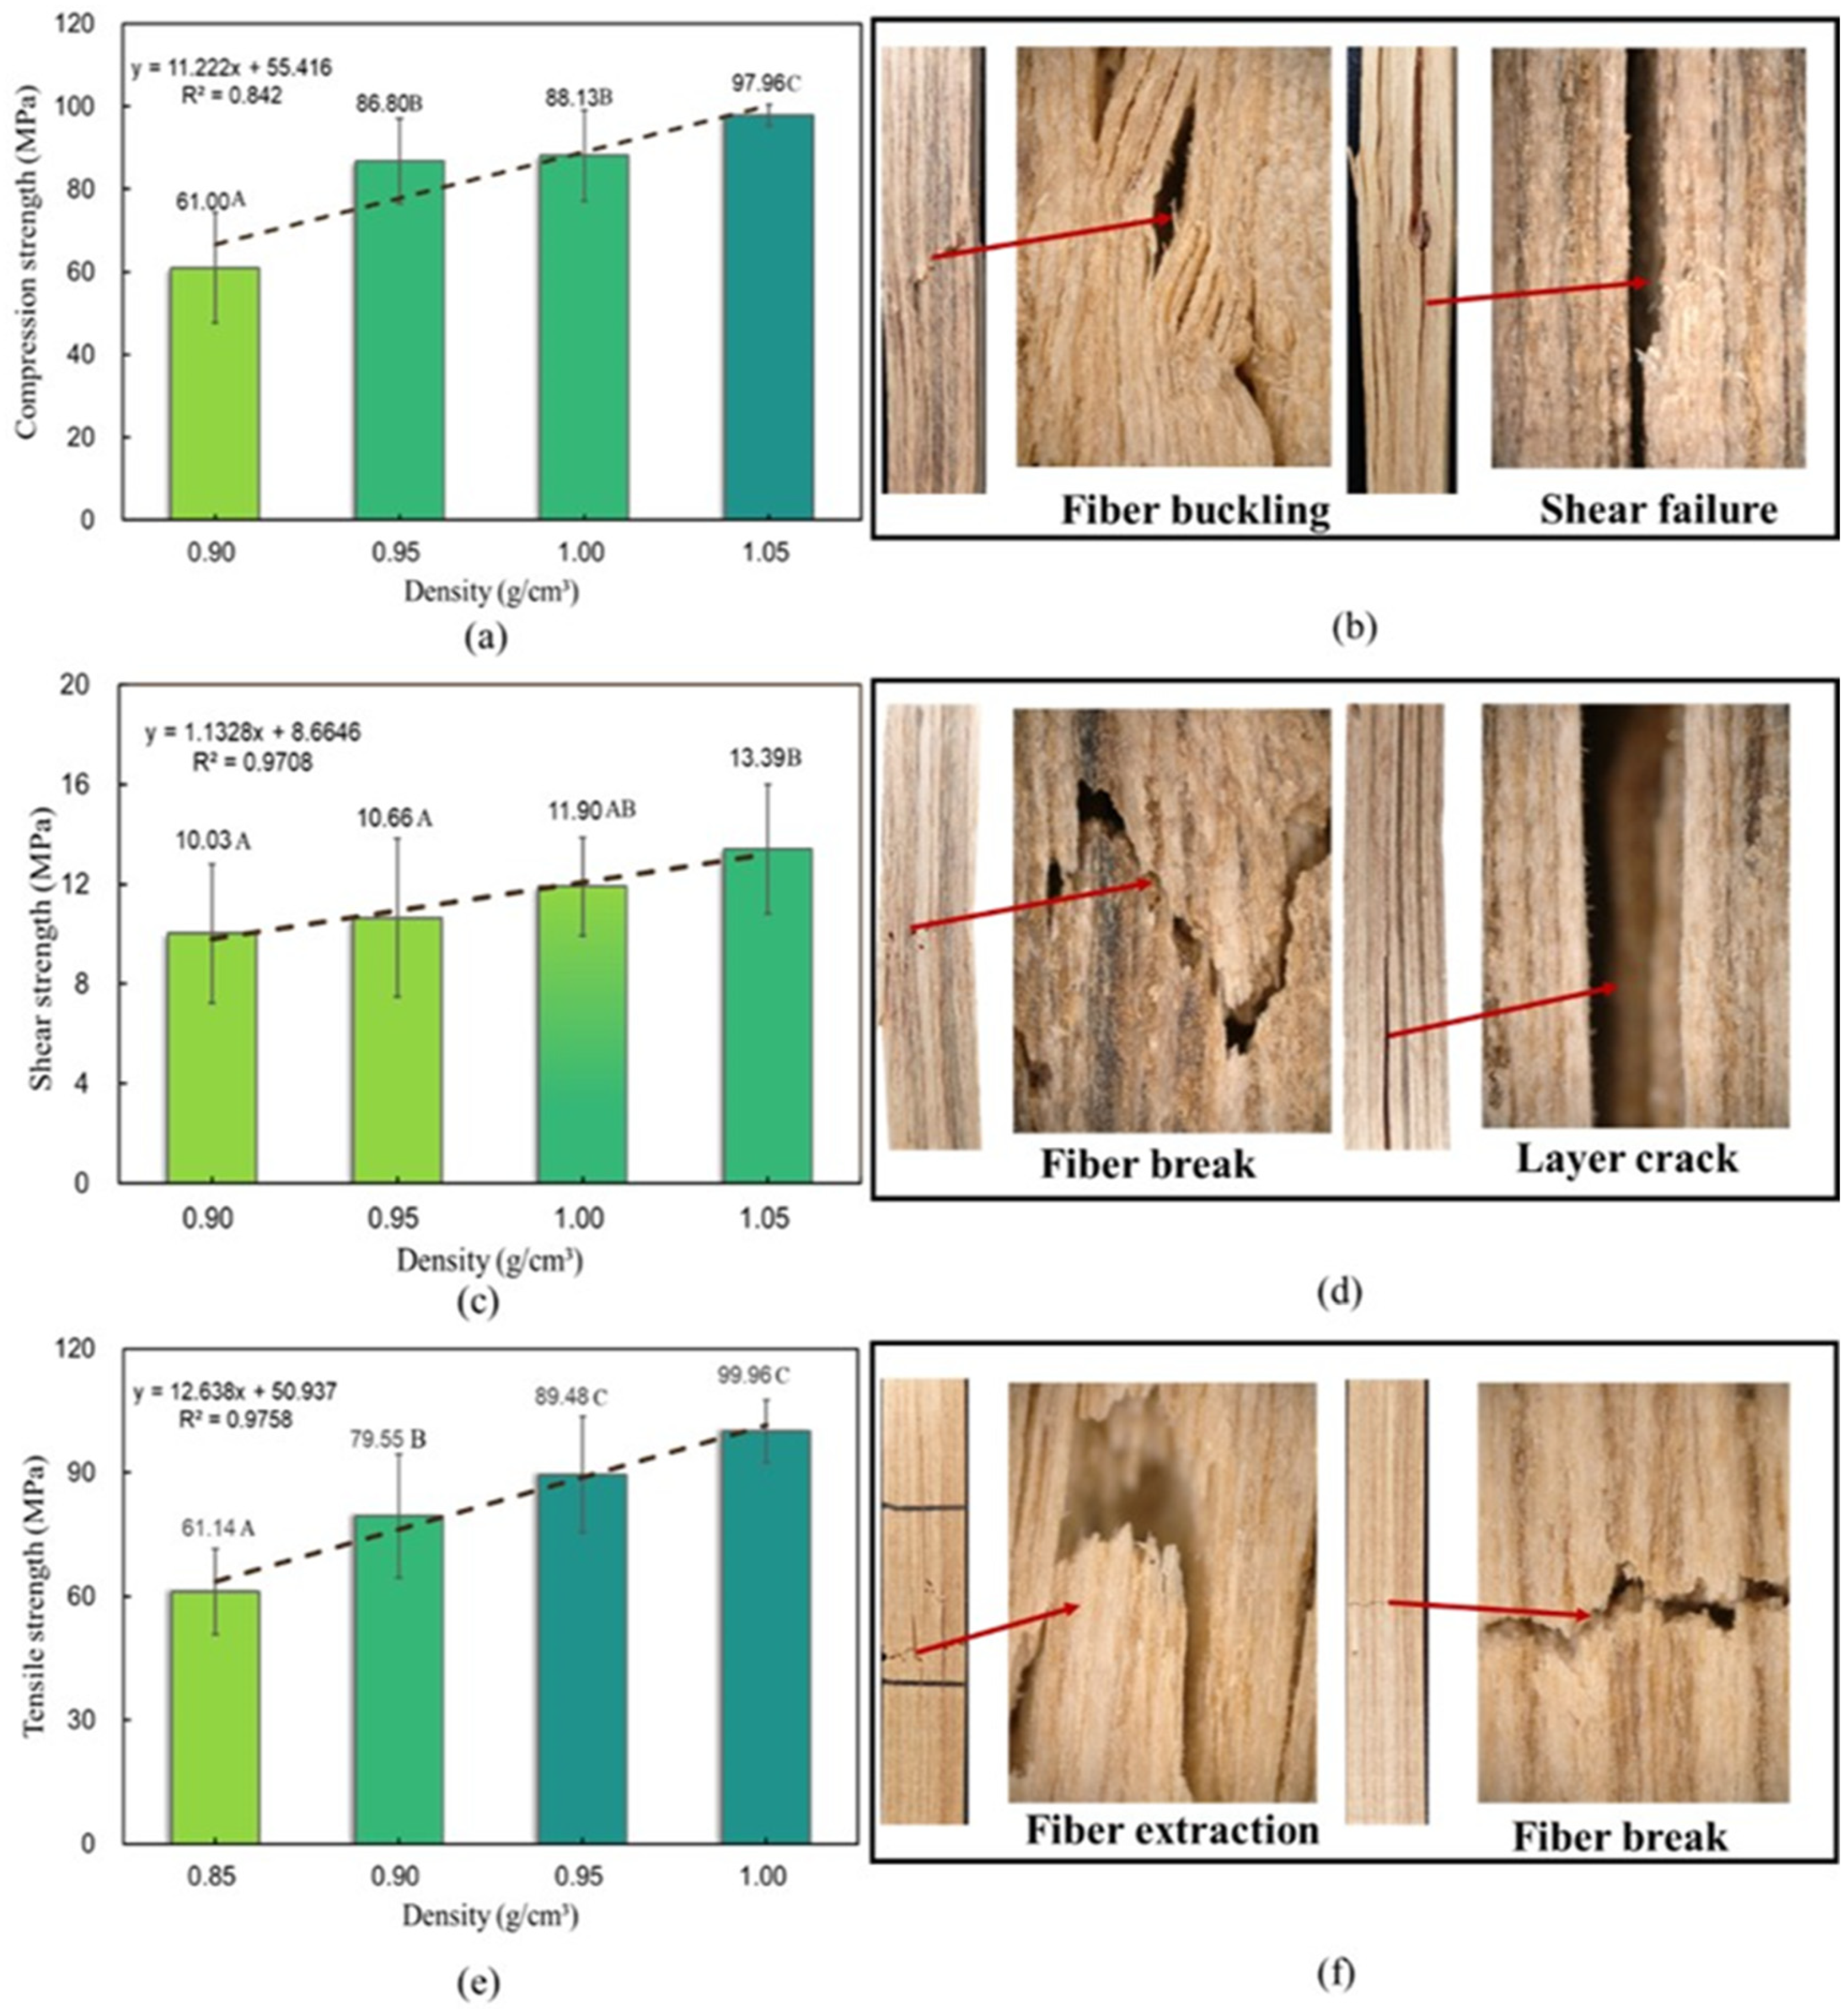
3.1. Mechanical Behavior of Wood Scrimber
3.2. Analysis of Probability Distribution
3.3. Determination of Standard Values
3.4. Analysis of Effect Factors on Mechanical Properties
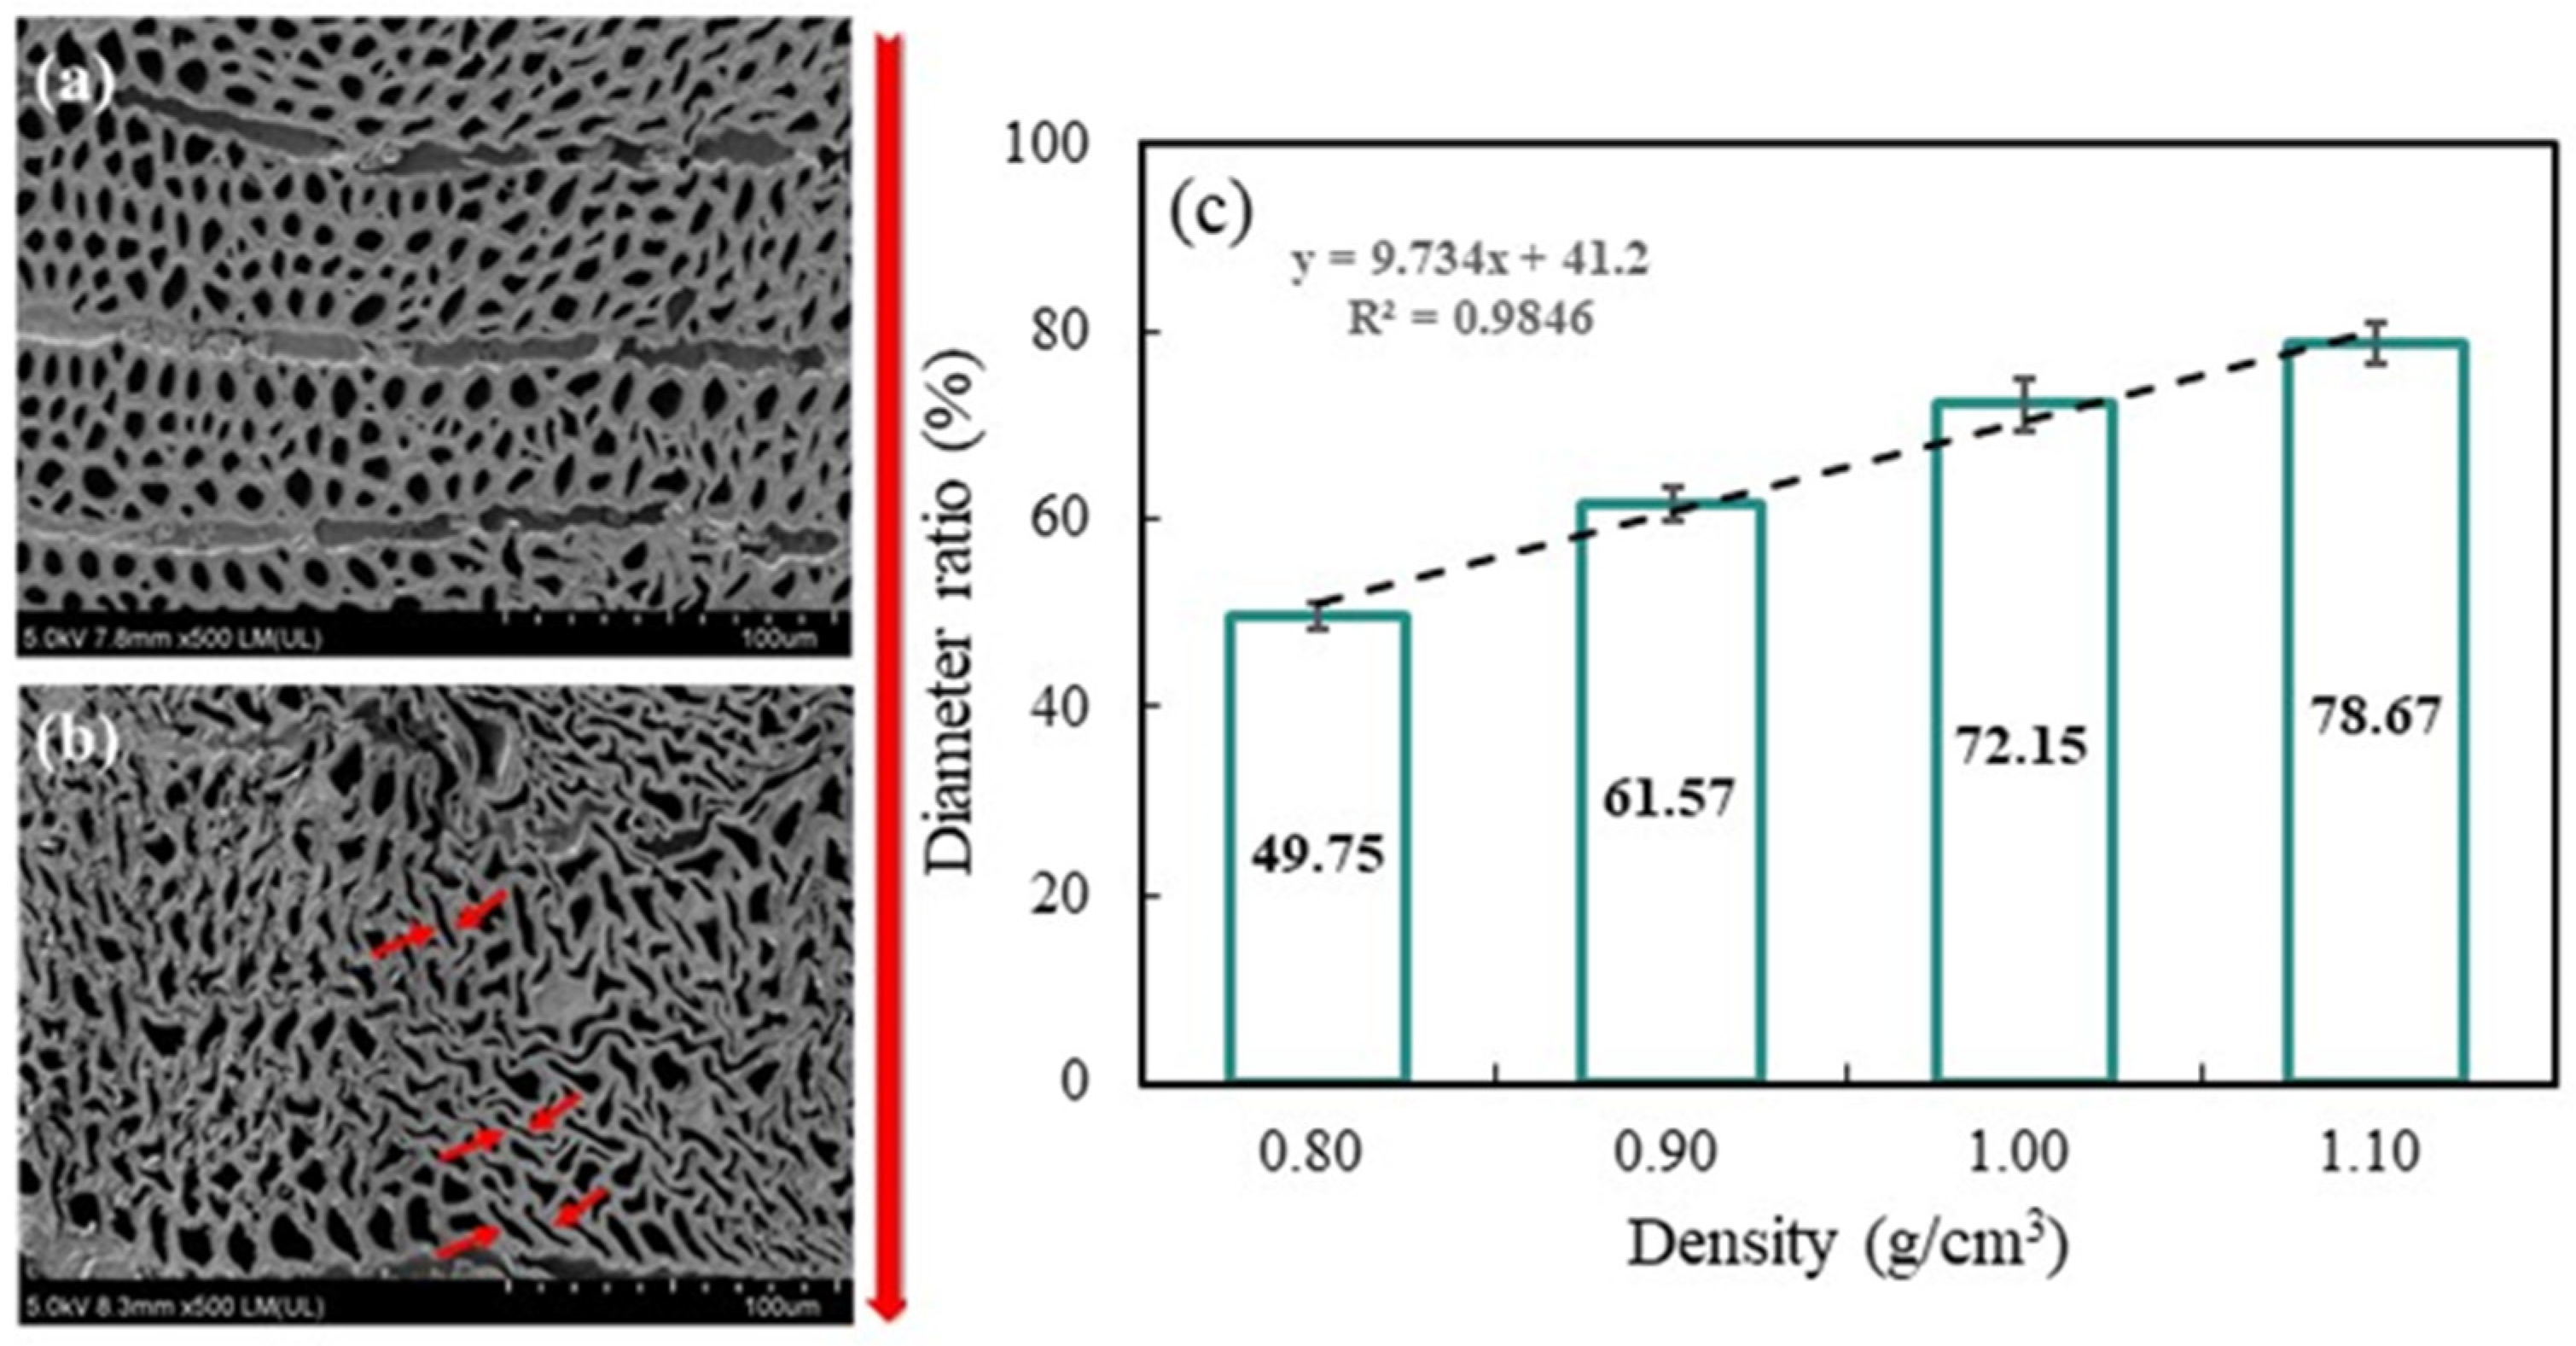
3.5. Micro-Structure Evaluations
4. Conclusions
Author Contributions
Funding
Data Availability Statement
Acknowledgments
Conflicts of Interest
References
- Halibzadeh, F. Data distribution: Normal or abnormal. J. Korean Med. Sci. 2024, 39, e35. [Google Scholar] [CrossRef] [PubMed]
- Limpert, E.; Stahel, W.A.; Abbt, M. Log-normal distributions across the sciences: Keys and clues. BioScience 2001, 51, 341–352. [Google Scholar] [CrossRef]
- ASTM C1239:00; Standard Practice for Reporting Uniaxial Strength Data and Estimating Weibull Distribution Parameters for Advanced Ceramics. ASTM International: West Conshohocken, PA, USA, 2005.
- Wu, D.; Zhou, J.; Li, Y. Distribution of the mechanical strength of solid catalysts. Chem. Eng. Res. Des. 2006, 84, 1152–1157. [Google Scholar] [CrossRef]
- Fan, X.; Case, E.D.; Ren, F.; Shu, Y.; Baumann, M.J. Part I: Porosity dependence of the Weibull modulus for hydroxyapatite and other brittle materials. J. Mech. Behav. Biomed. Mater. 2012, 8, 21–36. [Google Scholar] [CrossRef] [PubMed]
- Naresh, K.; Shankar, K.; Velmurugan, R. Reliability analysis of tensile strengths using Weibull distribution in glass/epoxy and carbon/epoxy composites. Compos. Part B Eng. 2018, 133, 129–144. [Google Scholar] [CrossRef]
- Li, S.; Lai, Y.; Zhang, M.; Zhang, S. Study on elastic modulus and strength distribution of high temperature frozen soil. Chin. J. Rock Mech. Eng. 2007, 26, 4299–4305. [Google Scholar]
- Xiao, G.; Li, X.; Zhong, Y. Bending properties of the structural recombinant bamboo. J. Anhui Agric. Univ. 2017, 44, 60–64. [Google Scholar]
- Xia, Y.; Chang, Y.; Yu, Y. Criterion for ultimate bearing capacity of reinforced concrete slab based on strain energy. J. Guangxi Univ. Sci. Technol. 2021, 32, 85–92. [Google Scholar]
- Zhong, Y.; Jiang, Z.; Ren, H. Reliability analysis of compression strength of dimension lumber of Northeast China Larch. Constr. Build. Mater. 2015, 84, 12–18. [Google Scholar] [CrossRef]
- Wang, Z.; Gu, L.; Gao, Z.; Liu, B. Dynamic testing and probability distribution of elastic modulus of SPF dimension lumbers. Sci. Silvae Sin. 2015, 51, 105–111. [Google Scholar]
- Wang, X.; Peng, X.; Liu, X.; Duan, X.; Xu, W. Study on reliability distribution models of fatigure life on anti-vibration rubber materials. J. Mech. Strength. 2022, 44, 1335–1342. [Google Scholar]
- Sun, H.; Ning, Z.; Wang, G.; Liang, W.; Shen, H.; Sun, J.; Xue, X. Tensile Strength Reliability Analysis of Cu48Zr48Al4 Amorphous Microwires. Metals 2016, 6, 296. [Google Scholar] [CrossRef]
- GB/T 40247; Bamboo Scrimber. Standardization Administration of the People’s Republic of China: Beijing, China, 2021.
- ASTM D4761; Standard Test Methods for Mechanical Properties of Lumber and Wood-Base Structural Material. ASTM International: West Conshohocken, PA, USA, 2009.
- GB/T 50005; Standard for Design of Timber Structures. Standardization Administration of the People’s Republic of China: Beijing, China, 2017.
- ASTM D2915; Standard for Sampling and Data-Analysis for Structural Wood and Wood-Based Products. ASTM International: West Conshohocken, PA, USA, 2017.
- Lin, Q.; Wu, J.; Huang, Y.; Yu, W. Effects of hot-pressing temperature and density on properties of Cupressus funebris scrimber, Chin. J. Wood Sci. Technol. 2021, 35, 51–56. [Google Scholar]
- Li, S.; Sitnikova, E. A Critical Review on the Rationality of Popular Failure Criteria for Composites. Compos. Commun. 2018, 8, 7–13. [Google Scholar] [CrossRef]
- Zhang, Z.; Li, S.; Zhang, J.; Wang, C.; Ba, W.; Wu, H. Effect of ultra-thinning of prepreg on tensile failure behavior of carbon fiber/epoxy resin composites. Acta Mater. Comp. Sin. 2020, 37, 800–807. [Google Scholar]
- Qi, Y.; Wu, J.; Ren, D.; Yu, W.; Zhang, Y. The Development in Manufacture and Application Technology of Bamboo Scrimber. Sci. Silvae Sin. 2023, 59, 159–168. [Google Scholar]
- Zhang, L. Optimization research on shear strength measurement method for fiber reinforced composite materials. Yunnan Chem. Technol. 2024, 51, 101–103. [Google Scholar]
- Liu, Y.; Han, Y.; Ren, Z.; Ren, M. Study on biaxial tensile behavior of ultra-thin-ply carbon fiber reinforced unidirectional composite. Compos. Sci. Technol. 2024, 251, 110544. [Google Scholar] [CrossRef]
- Zhu, D.; Zhuang, H.; Yang, T.; Guo, S. Effect of Resins on the Alkali Resistance and Interfacial Bonding Properties of Bamboo Fibers. J. Buil. Mater. 2024. Available online: https://link.cnki.net/urlid/31.1764.TU.20240404.2206.002 (accessed on 20 August 2024).


| Mechanical Parameters | Density (g/cm3) | Mean Value (MPa) | Standard Deviation (MPa) | Coefficient of Variance (%) | Standard Value of Parameter (MPa) | Standard Value of Nonparameter (MPa) |
|---|---|---|---|---|---|---|
| MOR | 0.85–1.05 | 116.34 | 18.71 | 16.08 | 83.74 | 83.08 |
| MOE | 0.85–1.05 | 17,661.88 | 1129 | 6.39 | 15,694.03 | 15,327.56 |
| CS | 0.85–1.05 | 75.63 | 19.11 | 25.27 | 40.72 | 45.17 |
| TS | 0.85–1.05 | 100.79 | 24.40 | 24.20 | 52.71 | 52.74 |
| SS | 0.85–1.05 | 14.68 | 2.80 | 19.04 | 5.78 | 6.55 |
| Parameters | Distribution | K-S Test | Decision at Level (0.05) | D0.05 |
|---|---|---|---|---|
| Normal | 0.0554 | Can’t reject Normal | ||
| MOR | Lognormal | 0.0810 | Can’t reject Lognormal | 0.1182 |
| Weibull | 0.0763 | Can’t reject Weibull | ||
| Normal | 0.0638 | Can’t reject Normal | ||
| MOE | Lognormal | 0.0765 | Can’t reject Lognormal | 0.1191 |
| Weibull | 0.0693 | Can’t reject Weibull | ||
| Normal | 0.1771 | Can’t reject Normal | ||
| CS | Lognormal | 0.1853 | Can’t reject Lognormal | 0.2024 |
| Weibull | 0.1575 | Can’t reject Weibull | ||
| Normal | 0.0746 | Can’t reject Normal | ||
| TS | Lognormal | 0.1045 | Can’t reject Lognormal | 0.1921 |
| Weibull | 0.0877 | Can’t reject Weibull | ||
| Normal | 0.0867 | Can’t reject Normal | ||
| SS | Lognormal | 0.0660 | Can’t reject Lognormal | 0.1739 |
| Weibull | 0.0988 | Can’t reject Weibull |
Disclaimer/Publisher’s Note: The statements, opinions and data contained in all publications are solely those of the individual author(s) and contributor(s) and not of MDPI and/or the editor(s). MDPI and/or the editor(s) disclaim responsibility for any injury to people or property resulting from any ideas, methods, instructions or products referred to in the content. |
© 2024 by the authors. Licensee MDPI, Basel, Switzerland. This article is an open access article distributed under the terms and conditions of the Creative Commons Attribution (CC BY) license (https://creativecommons.org/licenses/by/4.0/).
Share and Cite
Qi, Y.; Jiang, B.; Lei, W.; Zhang, Y.; Yu, W. Reliability Analysis of Normal, Lognormal, and Weibull Distributions on Mechanical Behavior of Wood Scrimber. Forests 2024, 15, 1674. https://doi.org/10.3390/f15091674
Qi Y, Jiang B, Lei W, Zhang Y, Yu W. Reliability Analysis of Normal, Lognormal, and Weibull Distributions on Mechanical Behavior of Wood Scrimber. Forests. 2024; 15(9):1674. https://doi.org/10.3390/f15091674
Chicago/Turabian StyleQi, Yue, Boyan Jiang, Wencheng Lei, Yahui Zhang, and Wenji Yu. 2024. "Reliability Analysis of Normal, Lognormal, and Weibull Distributions on Mechanical Behavior of Wood Scrimber" Forests 15, no. 9: 1674. https://doi.org/10.3390/f15091674
APA StyleQi, Y., Jiang, B., Lei, W., Zhang, Y., & Yu, W. (2024). Reliability Analysis of Normal, Lognormal, and Weibull Distributions on Mechanical Behavior of Wood Scrimber. Forests, 15(9), 1674. https://doi.org/10.3390/f15091674