
Validation of Satellite-Derived Green Canopy Cover in Rubber Plantations Using UAV and Ground Observations for Monitoring Leaf Fall Dynamics

 ,
,  ,
,  , , , ,
  ,
,
Abstract
1. Introduction
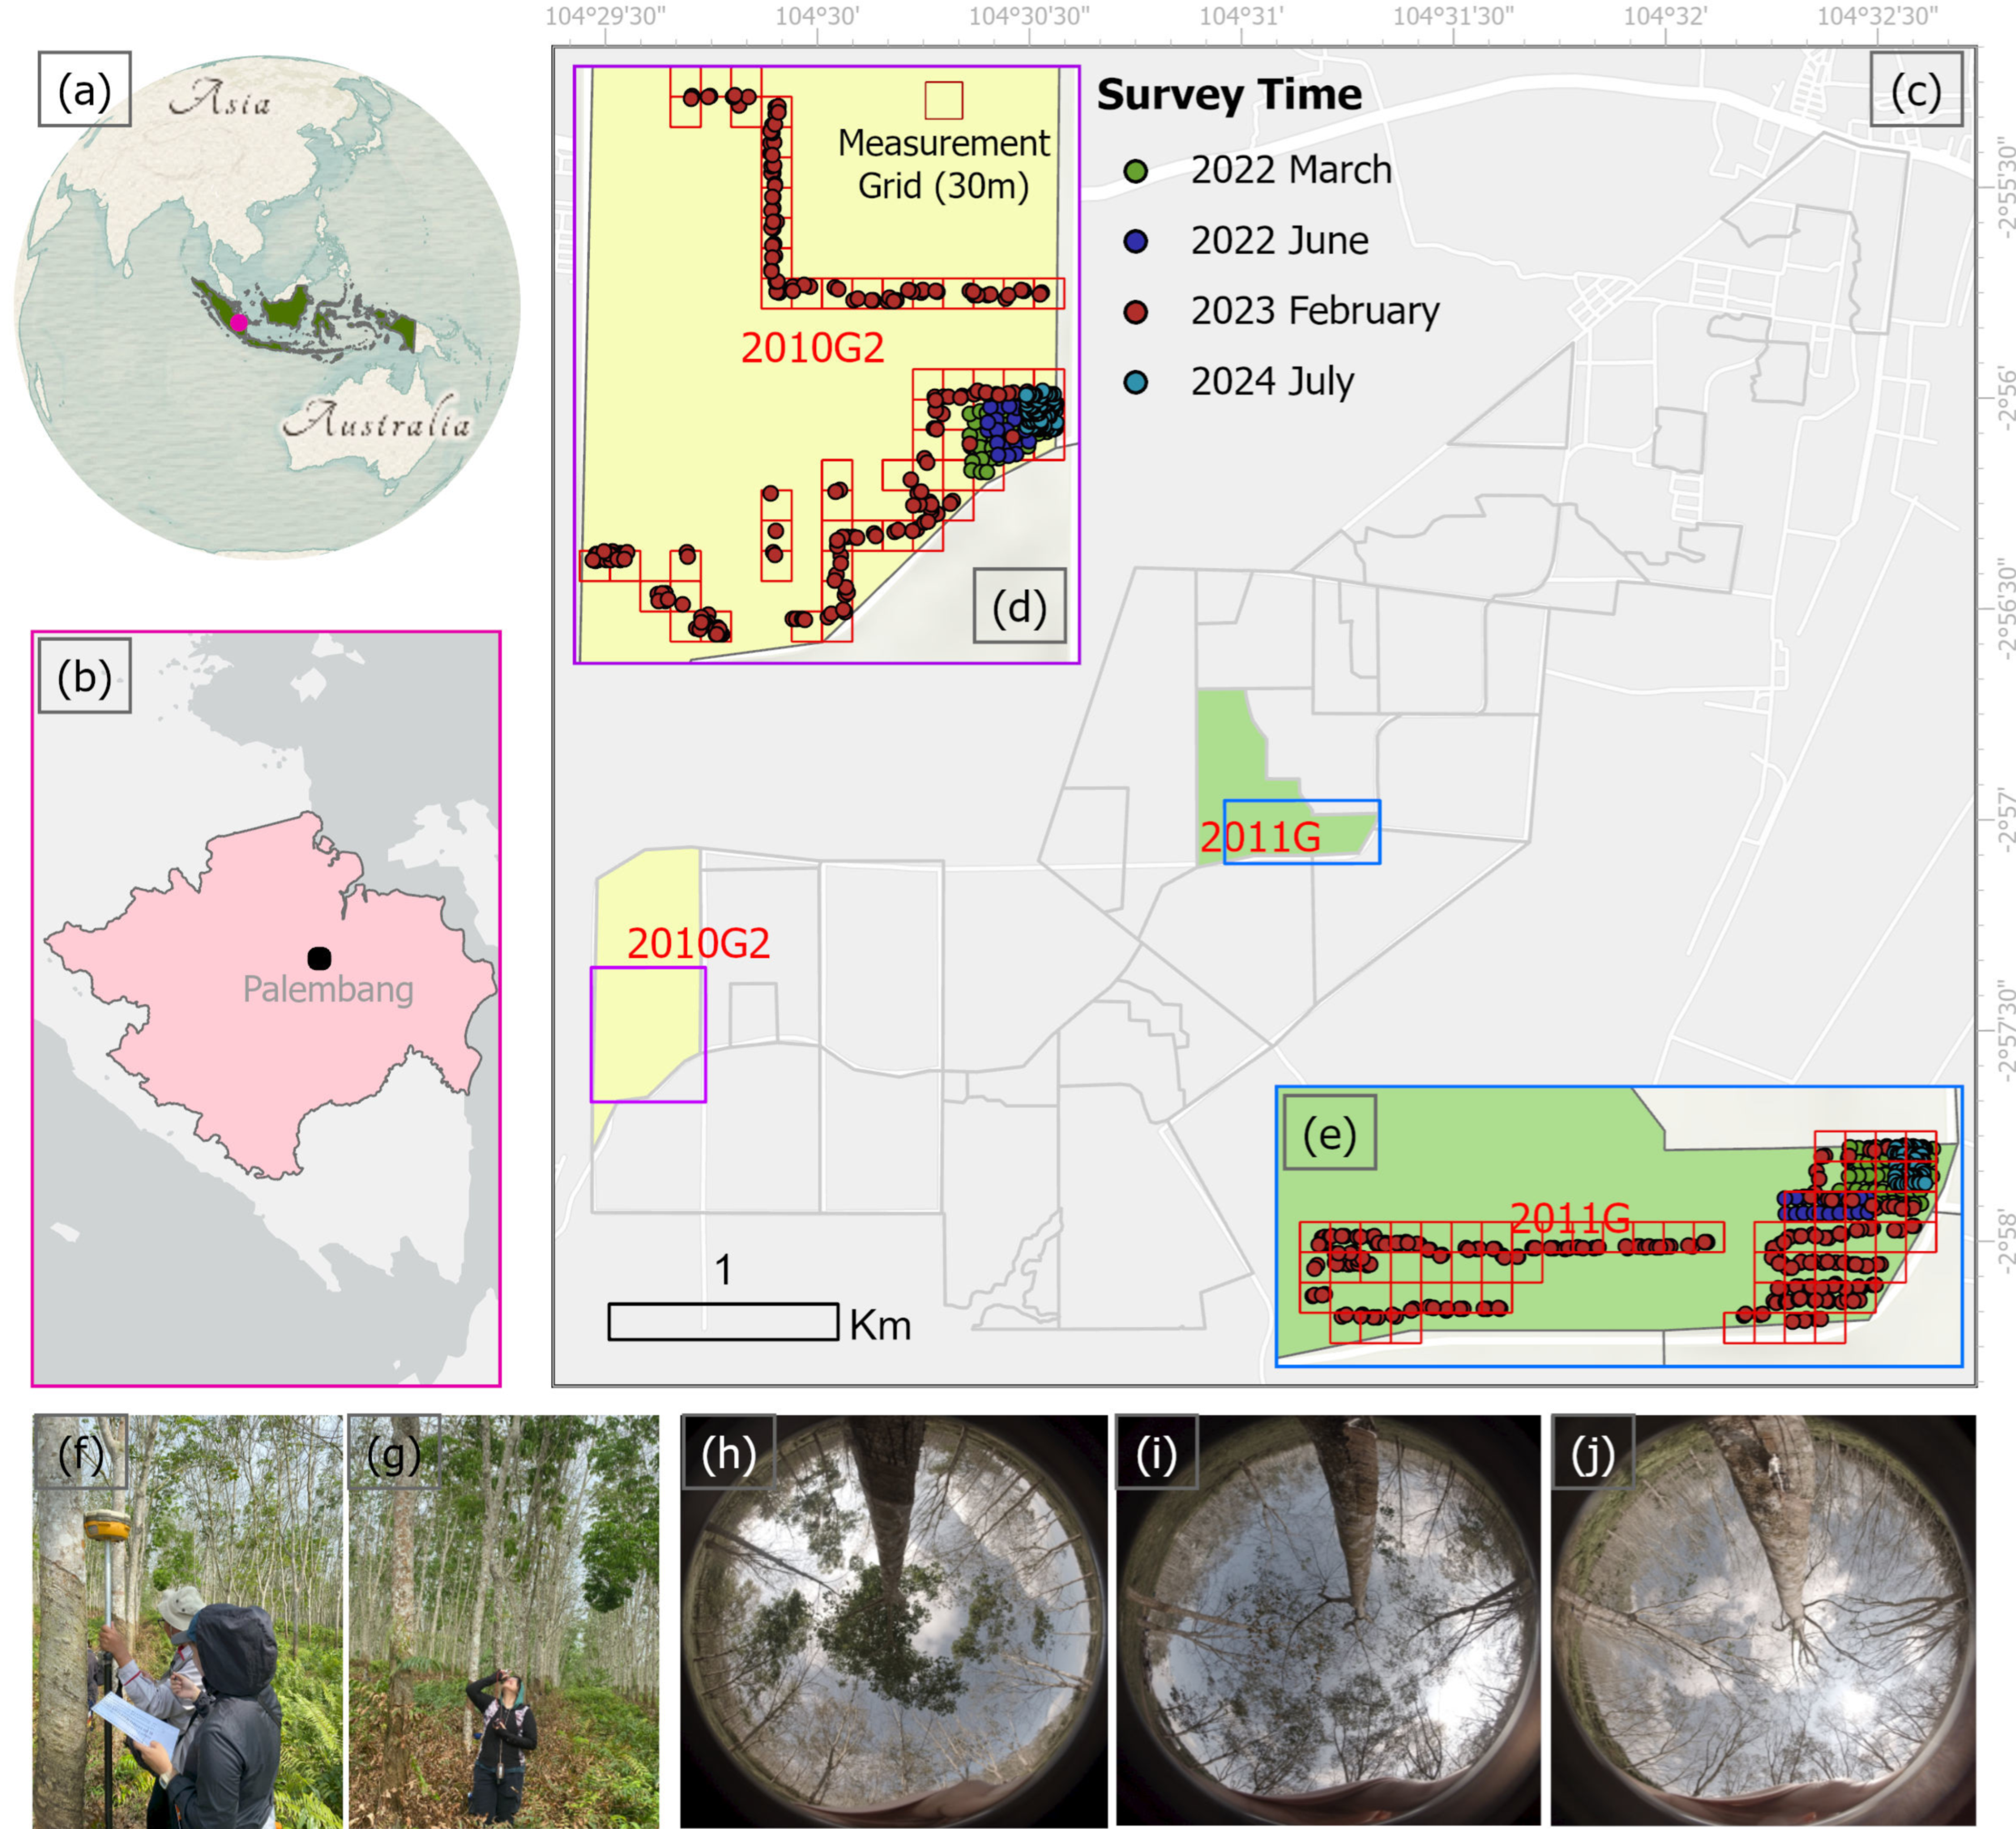
2. Study Area
3. Materials and Methods
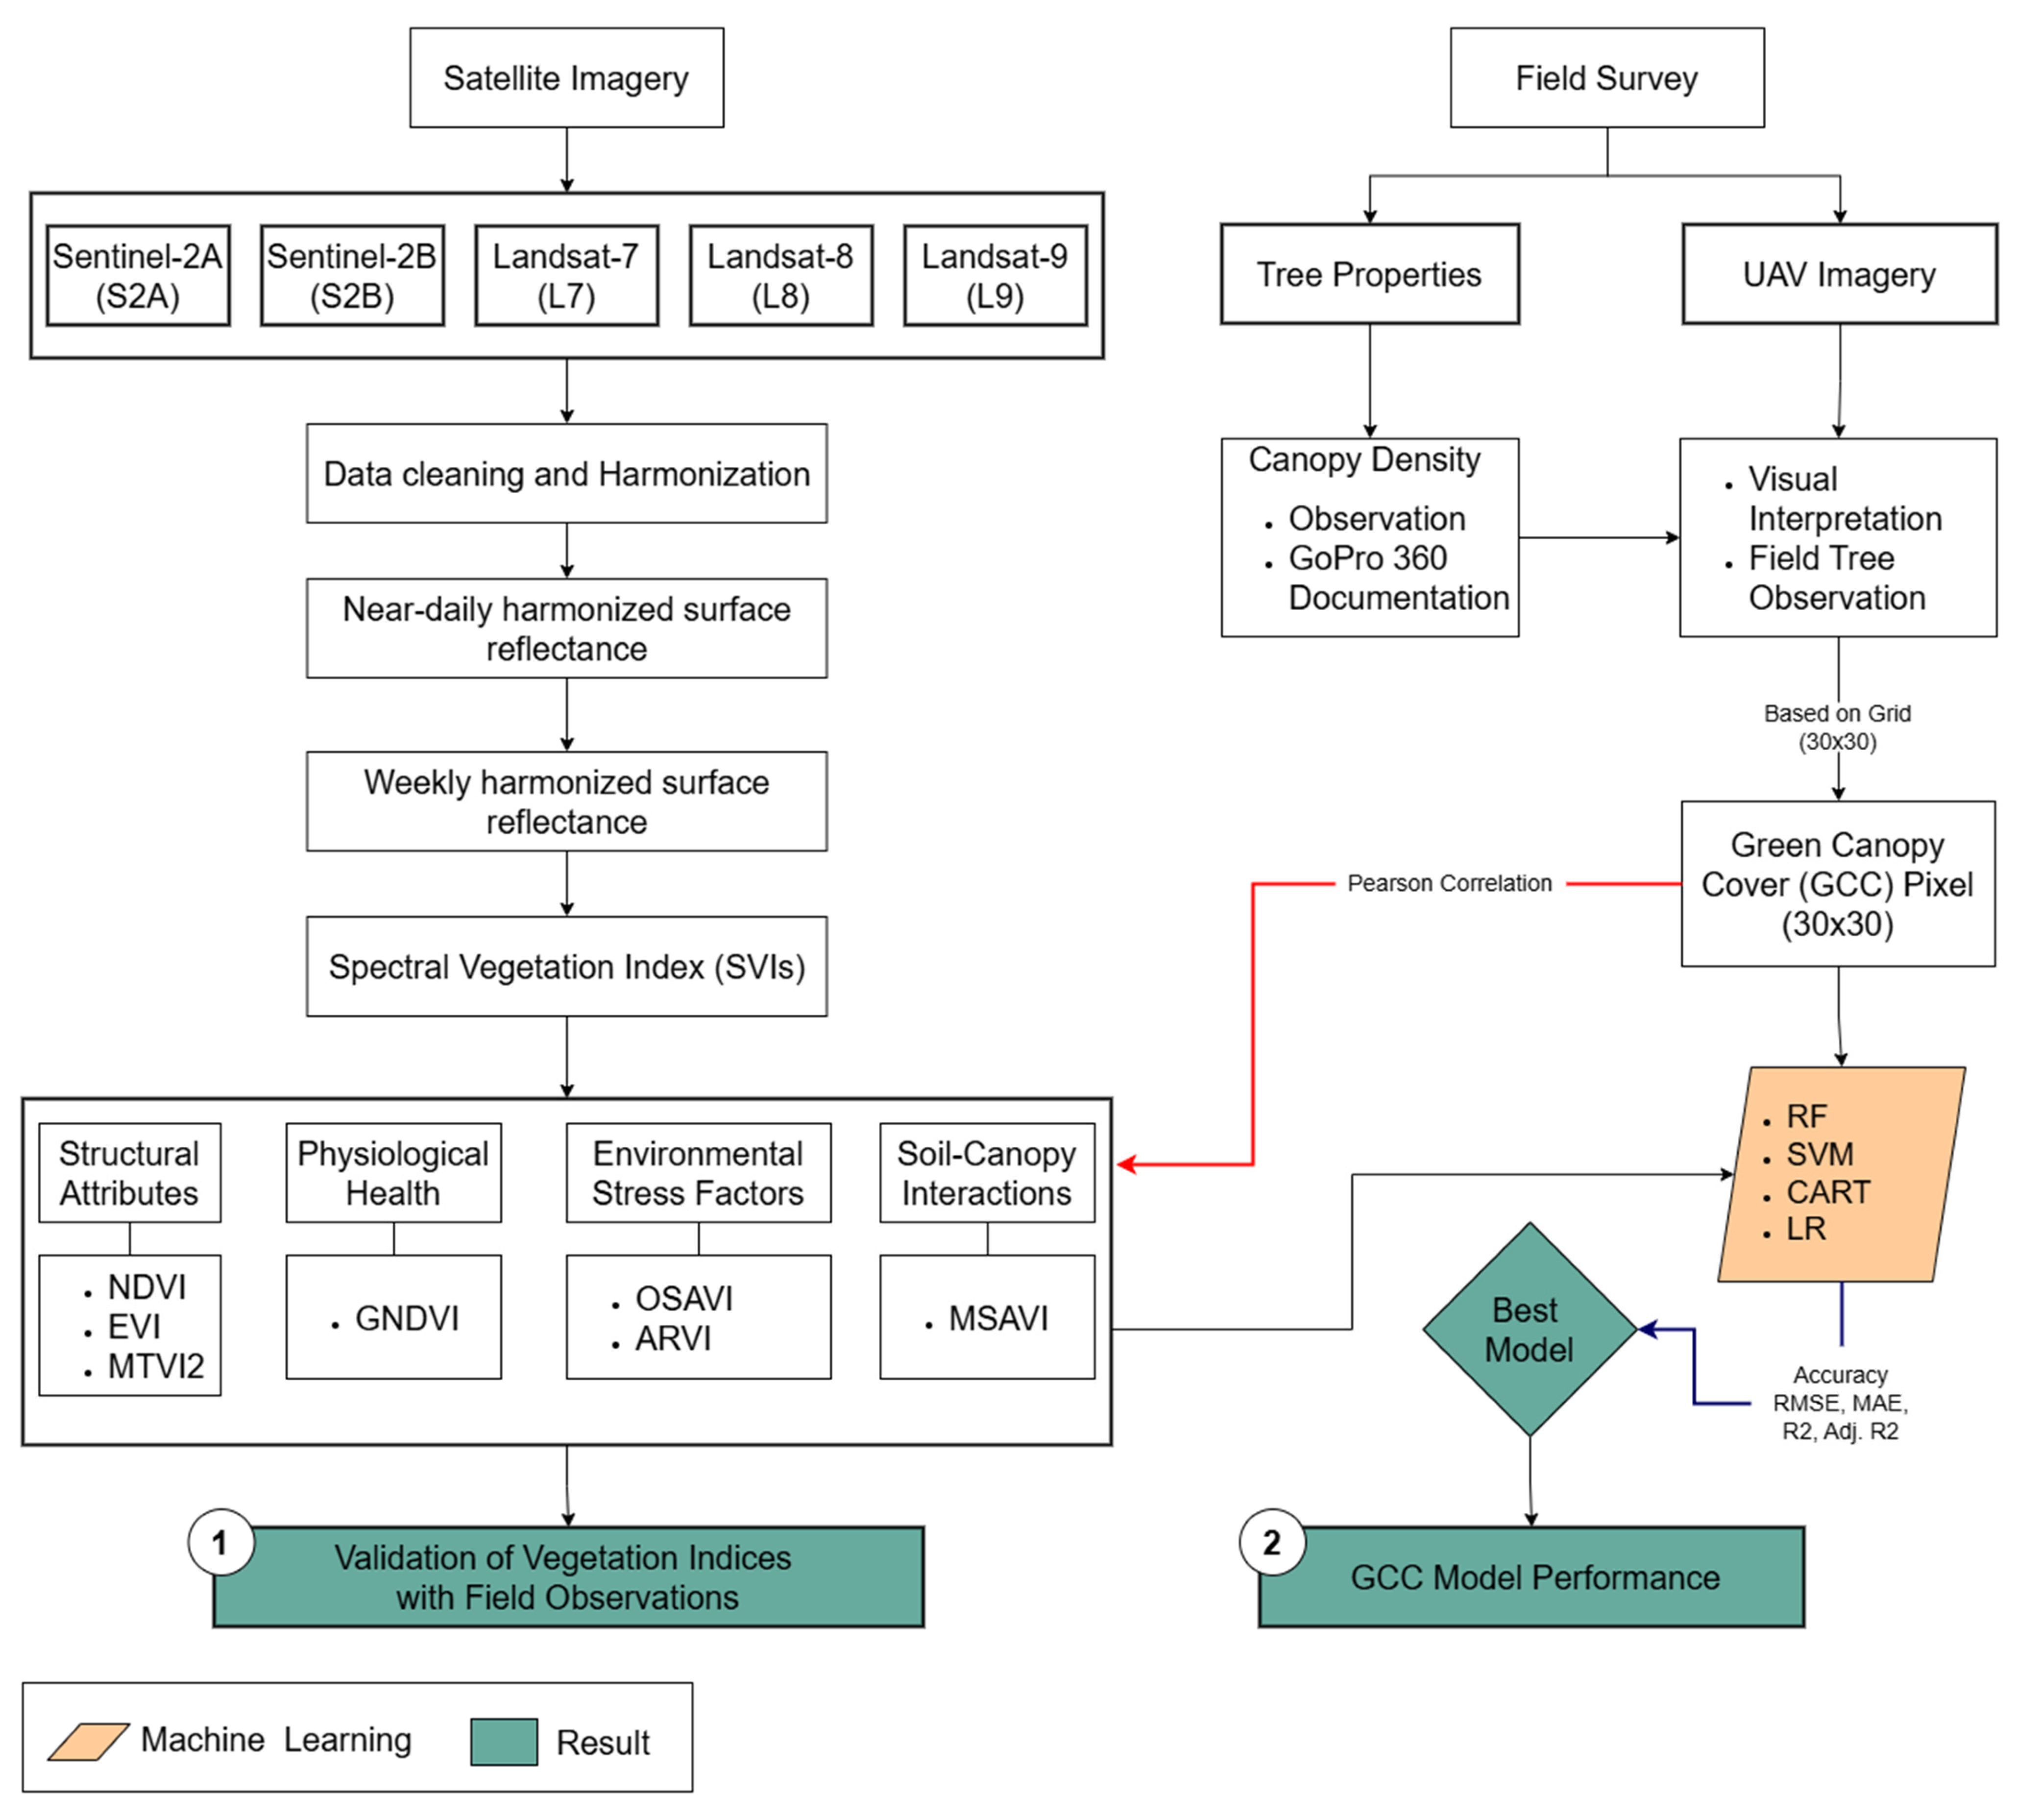
3.1. Integrated Data Collection Framework
3.1.1. Field Survey Collection
3.1.2. Remote Sensing Data
3.2. Data Processing Pipeline
3.2.1. Satellite Data Preprocessing
3.2.2. UAV Data Preprocessing
3.2.3. Ground Truth Data Preparation
- NDVI thresholding was applied to identify potential green canopy pixels.
- Manual selection was performed to refine the classification, ensuring only tree canopy pixels were included while excluding non-canopy vegetation such as grass and shrubs.
3.3. Vegetation Index Calculation
- Structural Attributes
- Normalized Difference Vegetation Index (NDVI): Widely used to quantify vegetation density and vigor, NDVI is sensitive to chlorophyll presence and effectively assesses canopy extent. Tucker’s research demonstrated the effectiveness of NDVI in monitoring photosynthetically active biomass in plant canopies [24].
- Enhanced Vegetation Index (EVI): This index offers improved sensitivity in high-biomass regions, reducing atmospheric and canopy background noise, making it suitable for monitoring dense vegetation. A. Huete et al. (2002) highlighted EVI’s ability to enhance the vegetation signal with improved sensitivity in high biomass regions and improved vegetation monitoring through decoupling the canopy background signal and reducing atmospheric influences [25].
- Modified Triangular Vegetation Index 2 (MTVI2): Enhances sensitivity to chlorophyll content and is less affected by soil background, aiding in accurate biomass estimation. While specific studies on MTVI2 in rubber plantations are limited, its general effectiveness in vegetation monitoring suggests potential applicability.
- Physiological Health
- Green NDVI (GNDVI): Utilizes green and near-infrared bands to assess chlorophyll concentration, providing insights into photosynthetic activity. While GNDVI has effectively monitored crop health, its application in rubber plantations has not been extensively documented.
- Environmental Stress Factors
- Optimized Soil-Adjusted Vegetation Index (OSAVI): Adjusts for soil brightness, improving vegetation monitoring in areas with sparse canopy cover [26]. OSAVI’s effectiveness in rubber plantations has not been specifically documented, suggesting an area for future research.
- Atmospherically Resistant Vegetation Index (ARVI): Reduces atmospheric effects, enhancing the accuracy of vegetation monitoring under varying atmospheric conditions. ARVI has been utilized to minimize atmospheric influences in vegetation monitoring, though specific applications in rubber plantations are limited.
- Soil-Canopy Interactions
- Modified Soil-Adjusted Vegetation Index (MSAVI): Reduces soil background influence, enhancing canopy detection accuracy, especially in areas with sparse vegetation [27]. A. R. Huete (1988) introduced the Soil-Adjusted Vegetation Index (SAVI) to address soil brightness influences, and MSAVI builds upon this to further minimize soil effects [28].
3.4. Supervised Machine Learning Regression Framework
3.4.1. Model Selection Rationale
3.4.2. Model Development Protocol
4. Results
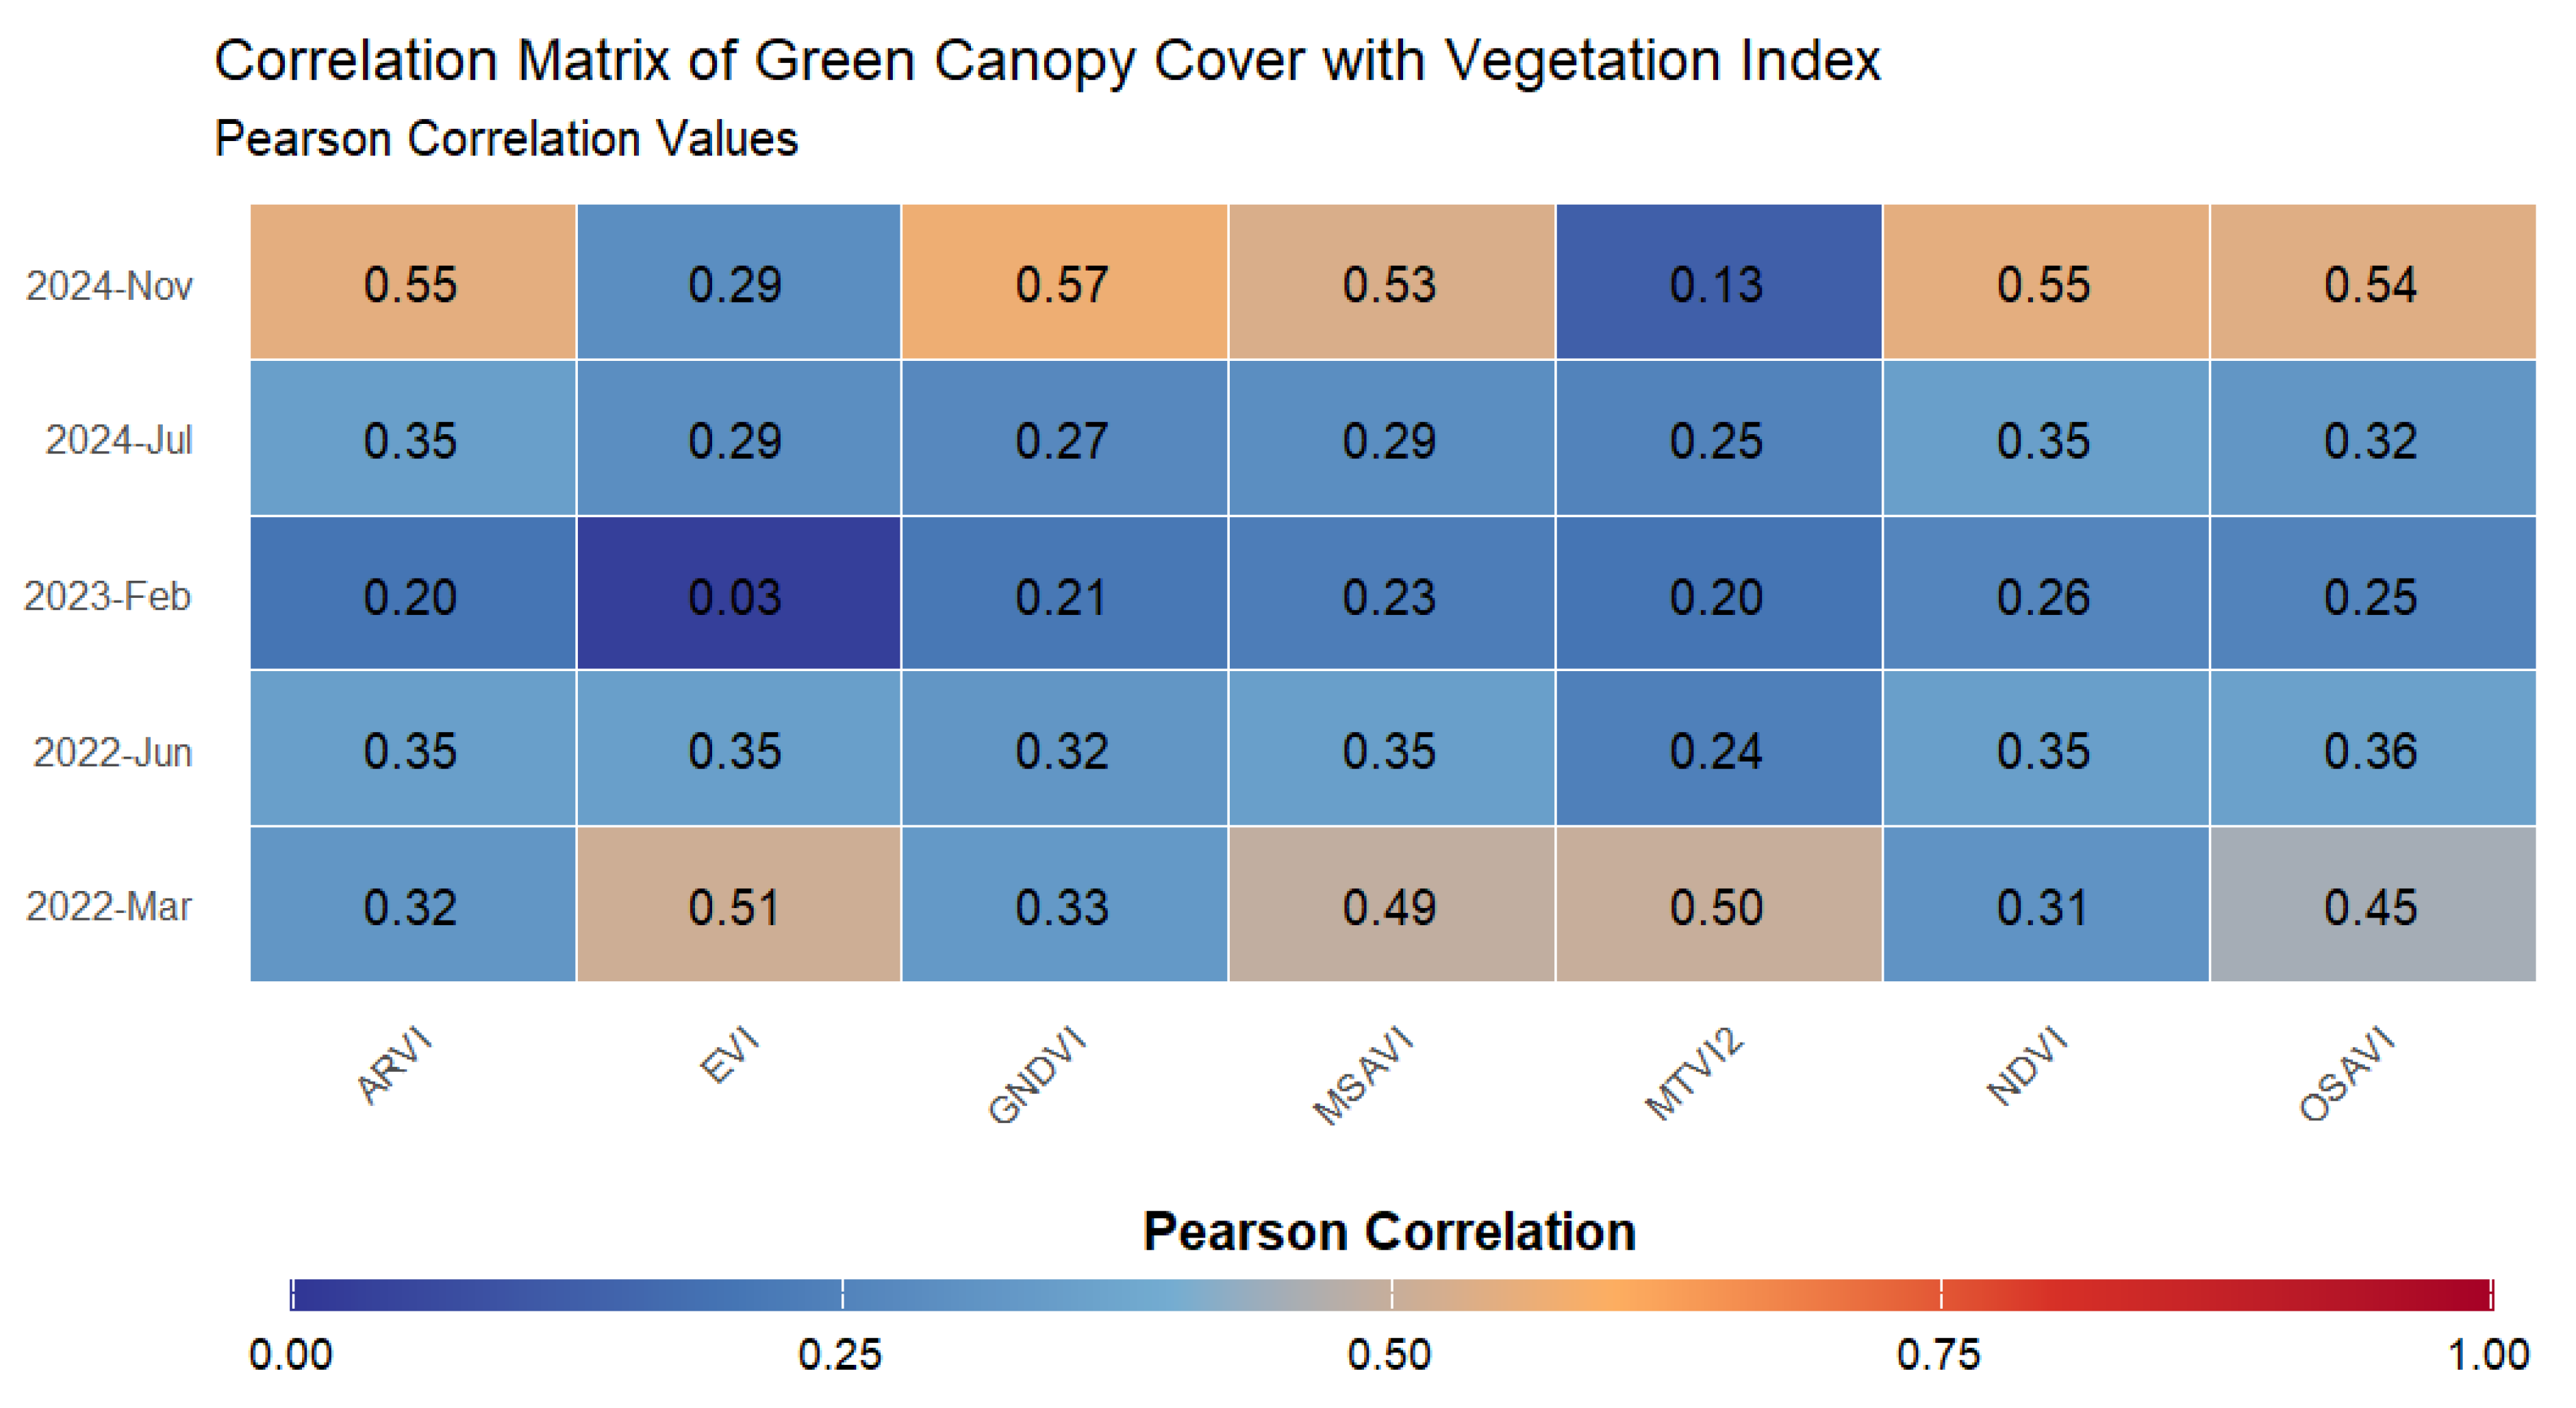
4.1. Validation of Satellite-Derived Vegetation Indices with Field Observations
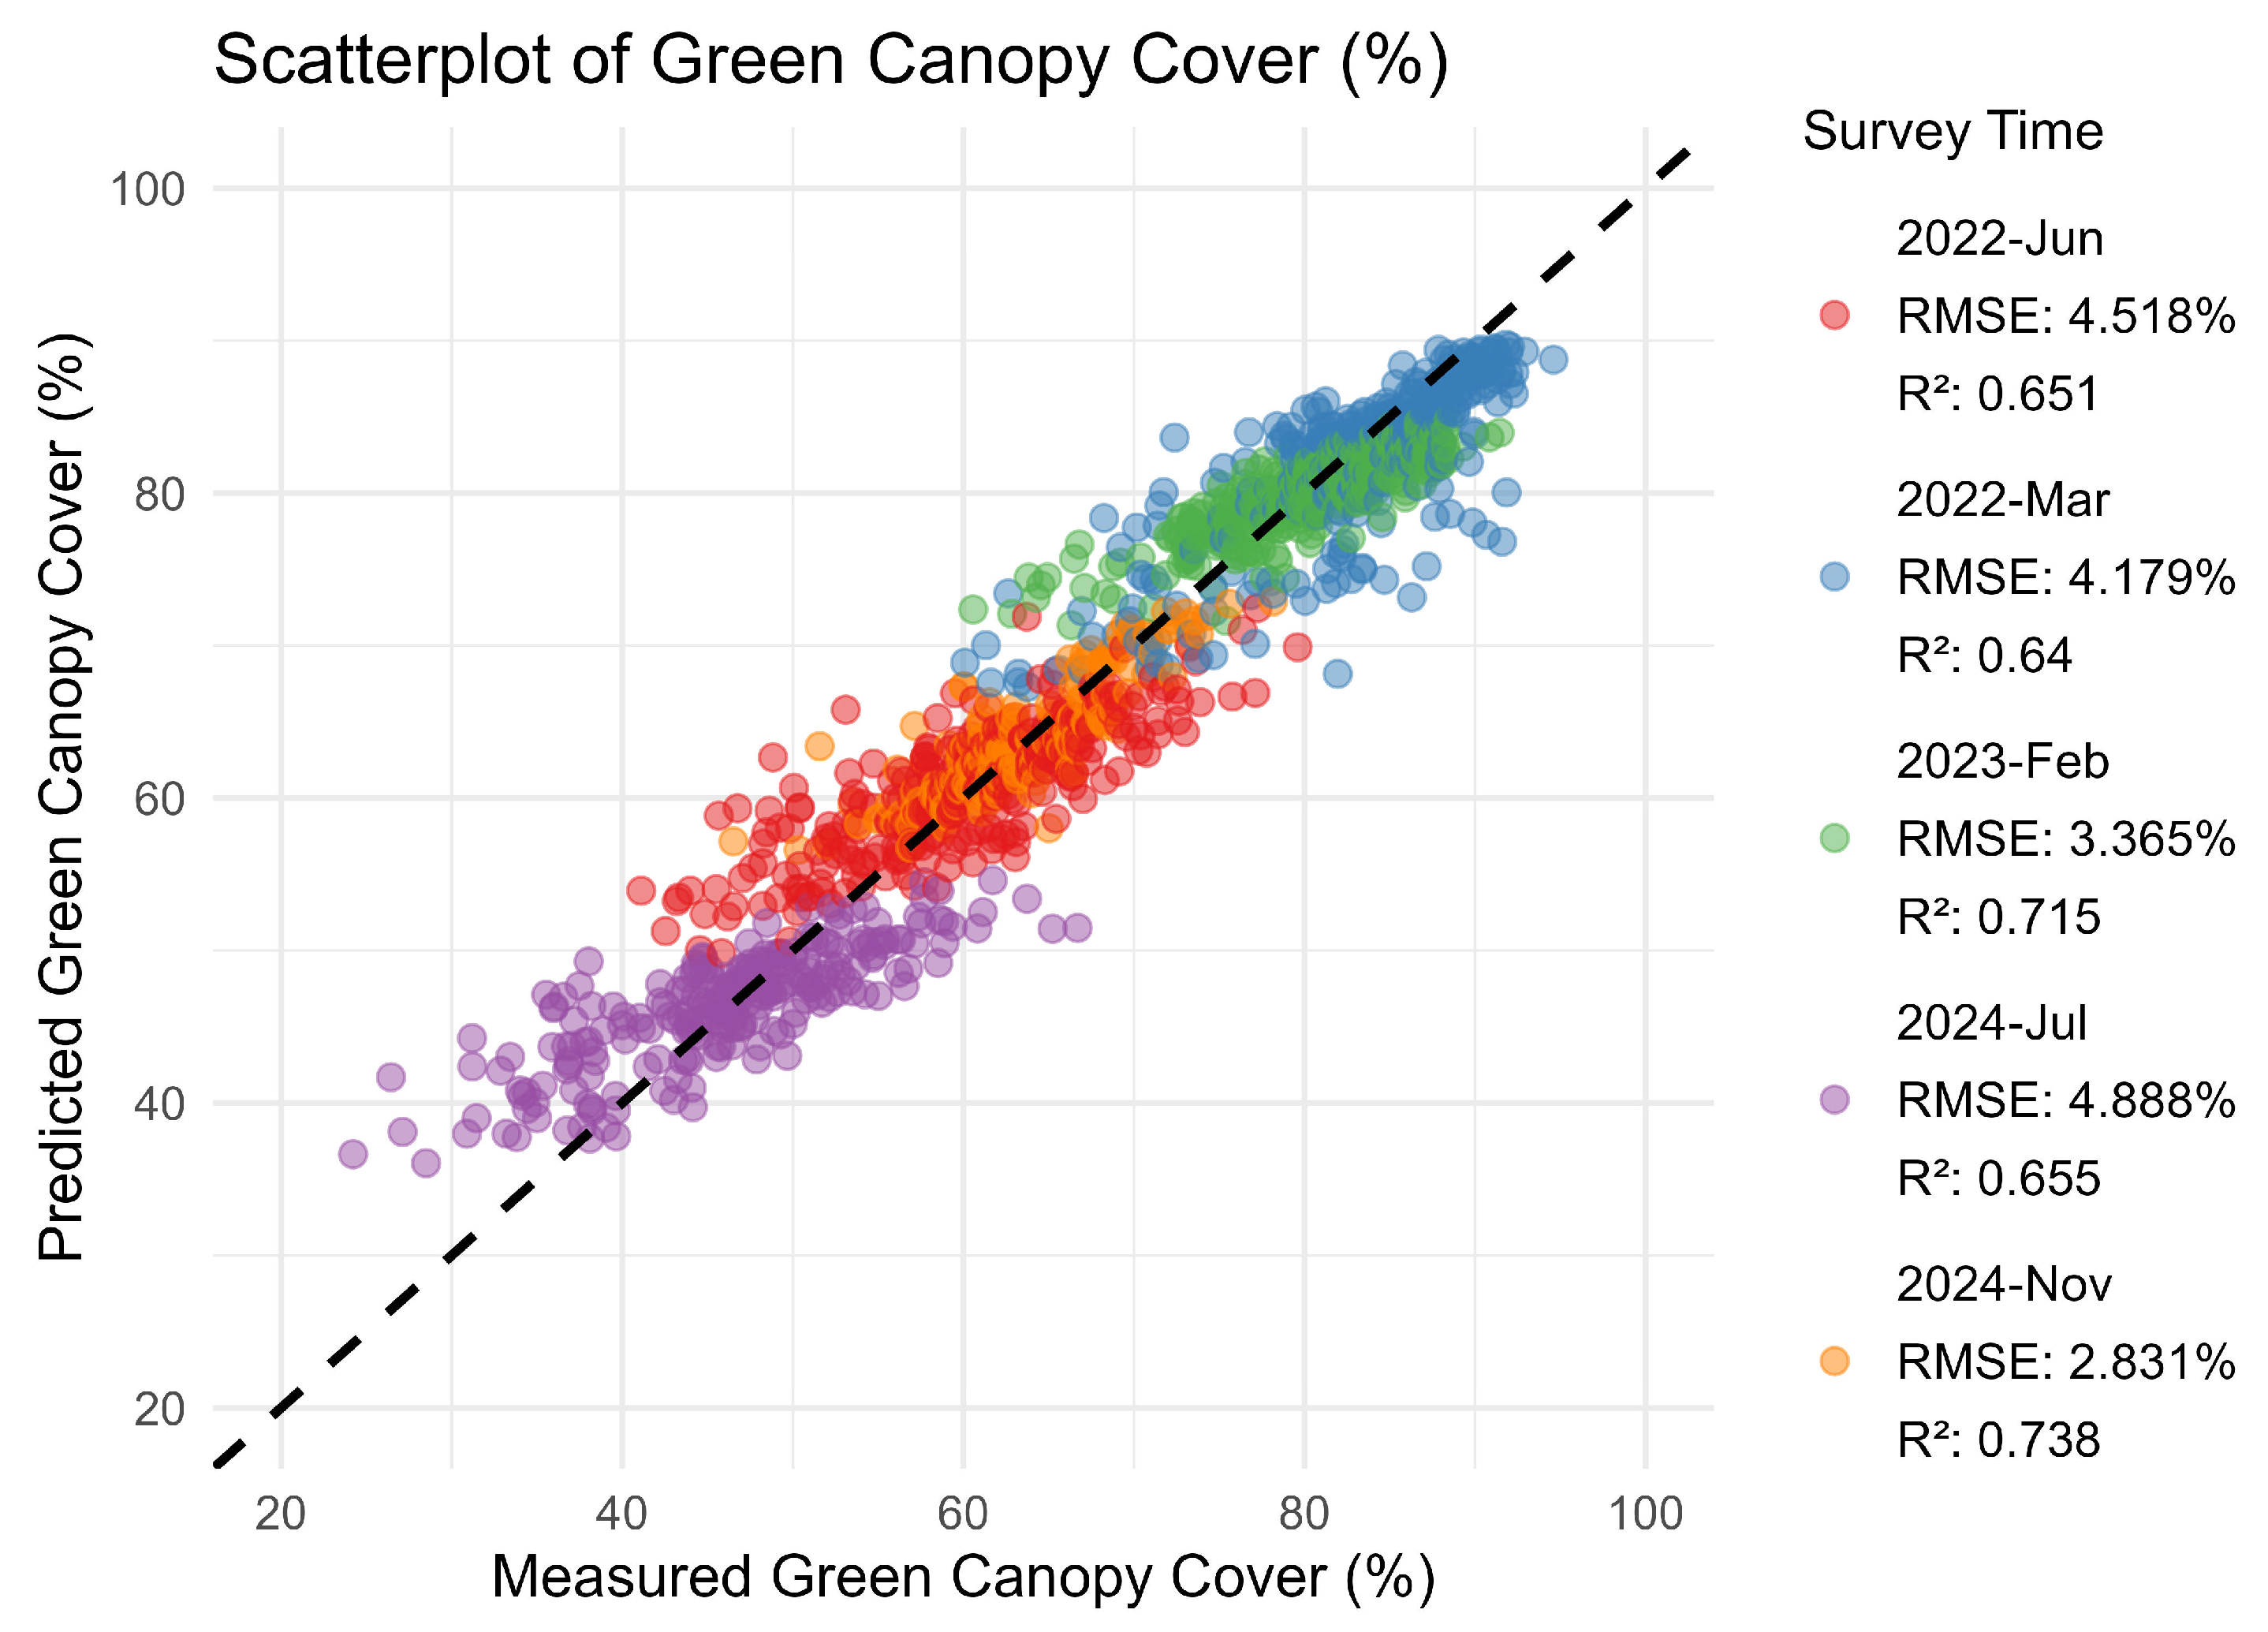
4.2. Green Canopy Cover Model Performance
5. Discussion
6. Conclusions
Author Contributions
Funding
Data Availability Statement
Acknowledgments
Conflicts of Interest
References
- Damiri, N.; Pratama, Y.; Febbiyanti, T.R.; Rahim, S.E.; Astuti, D.T.; Purwanti, Y. Pestalotiopsis Sp. Infection Causes Leaf Fall Disease of New Arrivals in Several Clones of Rubber Plants. Biodiversitas 2022, 23, 3943–3949. [Google Scholar] [CrossRef]
- Hadi Ismail, M.Z.; Mahyudin, M.M.; Noran, A.S.; Zambri, A.M.A.; Maiden, N.A.; Atan, S.; Aris, M.N.M. Identification and Characterisation of Causal Pathogens of Pestalotiopsis Leaf Fall Disease in Hevea Brasiliensis Using a Detached Leaf Technique. J. Rubber Res. 2024, 27, 159–173. [Google Scholar] [CrossRef]
- Alchemi, P.J.K.; Jamin, S. Impact Of Pestalotiopsis Leaf Fall Disease On Leaf Area Index and Rubber Plant Production. IOP Conf. Ser. Earth Environ. Sci. 2022, 995, 012030. [Google Scholar] [CrossRef]
- Karlson, M.; Ostwald, M.; Reese, H.; Sanou, J.; Tankoano, B.; Mattsson, E. Mapping Tree Canopy Cover and Aboveground Biomass in Sudano-Sahelian Woodlands Using Landsat 8 and Random Forest. Remote Sens. 2015, 7, 10017–10041. [Google Scholar] [CrossRef]
- Klobucar, B.; Sang, N.; Randrup, T.B. Comparing Ground and Remotely Sensed Measurements of Urban Tree Canopy in Private Residential Property. Trees For. People 2021, 5, 100114. [Google Scholar] [CrossRef]
- Azizan, F.A.; Kiloes, A.M.; Astuti, I.S.; Aziz, A.A. Application of Optical Remote Sensing in Rubber Plantations: A Systematic Review. Remote Sens. 2021, 13, 429. [Google Scholar] [CrossRef]
- Wu, W. Derivation of Tree Canopy Cover by Multiscale Remote Sensing Approach. Int. Arch. Photogramm. Remote Sens. Spat. Inf. Sci. 2012, XXXVIII-4-W25, 142–149. [Google Scholar] [CrossRef]
- Carreiras, J.M.B.; Pereira, J.M.C.; Pereira, J.S. Estimation of Tree Canopy Cover in Evergreen Oak Woodlands Using Remote Sensing. For. Ecol. Manag. 2006, 223, 45–53. [Google Scholar] [CrossRef]
- Zhai, D.; Dong, J.; Cadisch, G.; Wang, M.; Kou, W.; Xu, J.; Xiao, X.; Abbas, S. Comparison of Pixel- and Object-Based Approaches in Phenology-Based Rubber Plantation Mapping in Fragmented Landscapes. Remote Sens. 2017, 10, 44. [Google Scholar] [CrossRef]
- Fan, H.; Fu, X.; Zhang, Z.; Wu, Q. Phenology-Based Vegetation Index Differencing for Mapping of Rubber Plantations Using Landsat OLI Data. Remote Sens. 2015, 7, 6041–6058. [Google Scholar] [CrossRef]
- Li, P.; Zhang, J.; Feng, Z. Mapping Rubber Tree Plantations Using a Landsat-Based Phenological Algorithm in Xishuangbanna, Southwest China. Remote Sens. Lett. 2015, 6, 49–58. [Google Scholar] [CrossRef]
- Herdiyeni, Y.; Mumtaz, M.F.; Laxmi, G.F.; Setiawan, Y.; Prasetyo, L.B.; Febbiyanti, T.R. Analysis and Prediction of Rubber Tree Phenological Changes during Pestalotiopsis Infection Using Sentinel-2 Imagery and Random Forest. J. Appl. Remote. Sens. 2024, 18, 014524. [Google Scholar] [CrossRef]
- Sopian, N.A.M.; Supriatna, S.; Manessa, M.D.M.; Shidiq, I.P.A.; Nagasawa, R.; Haidar, M. A Study on Spatio-Temporal Trend of Rubber Leaf Fall Phenomenon Using Planetscope Multi-Index Vegetation Imagery in Relations to Climatological Conditions. Environ. Mater. 2024, 2, 45–60. [Google Scholar] [CrossRef]
- Cui, B.; Huang, W.; Ye, H.; Chen, Q. The Suitability of PlanetScope Imagery for Mapping Rubber Plantations. Remote Sens. 2022, 14, 1061. [Google Scholar] [CrossRef]
- Gao, Y.; Yun, T.; Chen, B.; Lai, H.; Wang, X.; Wang, G.; Wang, X.; Wu, Z.; Kou, W. Improving the Accuracy of Canopy Height Mapping in Rubber Plantations Based on Stand Age, Multi-Source Satellite Images, and Random Forest Algorithm. Int. J. Appl. Earth Obs. Geoinf. 2024, 131, 103941. [Google Scholar] [CrossRef]
- Dai, S.; Luo, H.; Hu, Y.; Zheng, Q.; Li, H.; Li, M.; Yu, X.; Chen, B. Retrieving Leaf Area Index of Rubber Plantation in Hainan Island Using Empirical and Neural Network Models with Landsat Images. J. Appl. Remote. Sens. 2023, 17, 014503. [Google Scholar] [CrossRef]
- Zeng, T.; Wang, Y.; Yang, Y.; Liang, Q.; Fang, J.; Li, Y.; Zhang, H.; Fu, W.; Wang, J.; Zhang, X. Early Detection of Rubber Tree Powdery Mildew Using UAV-Based Hyperspectral Imagery and Deep Learning. Comput. Electron. Agric. 2024, 220, 108909. [Google Scholar] [CrossRef]
- Ayu, F.; Manessa, M.D.M.; Stevanus, C.T.; Efriana, A.F. Machine Learning Approach to Assess Rubber Plant Health through Canopy Density Mapping Using Very High-Resolution Aerial Photographs. In Proceedings of the 8th Geoinformation Science Symposium 2023: Geoinformation Science for Sustainable Planet, Yogyakarta, Indonesia, 28–30 August 2023; SPIE: Bellingham, WA, USA, 2024; Volume 12977, pp. 667–676. [Google Scholar] [CrossRef]
- Lemes, E.M.; Machado, T.V.; Gontijo, L.N.; de Andrade, S.L.; Torres, J.L.R.; Santos, M.A.; Coelho, L. Detection of Rubber Tree Orchards Infested by Meloidogyne Exigua Using Vegetation Indexes Obtained from Satellite Images. New For. 2020, 51, 765–779. [Google Scholar] [CrossRef]
- Rasib, A.W.; Hamid, N.R.A.; Yaacob, M.L.M.; Ghani, Z.A.; Idris, N.H.; Alvin, L.M.S.; Hassan, M.I.; Idris, K.M.; Dollah, R.; Salleh, A.M.; et al. Rubber-Tree Leaf Diseases Mapping Using Close Range Remote Sensing Images. Int. J. Integr. Eng. 2022, 14, 1–12. [Google Scholar] [CrossRef]
- Kusdiana, A.P.J. Pengaruh Klon Karet Terhadap Epidemi Penyakit Gugur Daun Pestalotiopsis. War. Perkaretan 2021, 40, 41–52. [Google Scholar]
- Berra, E.F.; Fontana, D.C.; Yin, F.; Breunig, F.M. Harmonized Landsat and Sentinel-2 Data with Google Earth Engine. Remote Sens. 2024, 16, 2695. [Google Scholar] [CrossRef]
- Raj, R.; Walker, J.P.; Pingale, R.; Nandan, R.; Naik, B.; Jagarlapudi, A. Leaf Area Index Estimation Using Top-of-Canopy Airborne RGB Images. Int. J. Appl. Earth Obs. Geoinf. 2021, 96, 102282. [Google Scholar] [CrossRef]
- Tucker, C.J. Red and Photographic Infrared Linear Combinations for Monitoring Vegetation. Remote Sens. Environ. 1979, 8, 127–150. [Google Scholar] [CrossRef]
- Huete, A.; Didan, K.; Miura, T.; Rodriguez, E.P.; Gao, X.; Ferreira, L.G. Overview of the Radiometric and Biophysical Performance of the MODIS Vegetation Indices. Remote Sens. Environ. 2002, 83, 195–213. [Google Scholar] [CrossRef]
- Rondeaux, G.; Steven, M.; Baret, F. Optimization of Soil-Adjusted Vegetation Indices. Remote Sens. Environ. 1996, 55, 95–107. [Google Scholar] [CrossRef]
- Qi, J.; Chehbouni, A.; Huete, A.R.; Kerr, Y.H.; Sorooshian, S. A Modified Soil Adjusted Vegetation Index. Remote Sens. Environ. 1994, 48, 119–126. [Google Scholar] [CrossRef]
- Huete, A.R. A Soil-Adjusted Vegetation Index (SAVI). Remote Sens. Environ. 1988, 25, 295–309. [Google Scholar] [CrossRef]
- Kaufman, Y.J.; Tanre, D. Atmospherically Resistant Vegetation Index (ARVI) for EOS-MODIS. IEEE Trans. Geosci. Remote Sens. 1992, 30, 261–270. [Google Scholar] [CrossRef]
- Gitelson, A.A.; Kaufman, Y.J.; Merzlyak, M.N. Use of a Green Channel in Remote Sensing of Global Vegetation from EOS-MODIS. Remote Sens. Environ. 1996, 58, 289–298. [Google Scholar] [CrossRef]
- Haboudane, D.; Miller, J.R.; Pattey, E.; Zarco-Tejada, P.J.; Strachan, I.B. Hyperspectral Vegetation Indices and Novel Algorithms for Predicting Green LAI of Crop Canopies: Modeling and Validation in the Context of Precision Agriculture. Remote Sens. Environ. 2004, 90, 337–352. [Google Scholar] [CrossRef]
- Rouse, J.W., Jr.; Haas, R.H.; Deering, D.W.; Schell, J.A.; Harlan, J.C. Monitoring the Vernal Advancement and Retrogradation (Green Wave Effect) of Natural Vegetation; Remote Sensing Center, Texas A&M University: College Station, TX, USA, 1974. [Google Scholar]
- Belgiu, M.; Drăguţ, L. Random Forest in Remote Sensing: A Review of Applications and Future Directions. ISPRS J. Photogramm. Remote Sens. 2016, 114, 24–31. [Google Scholar] [CrossRef]
- Mountrakis, G.; Im, J.; Ogole, C. Support Vector Machines in Remote Sensing: A Review. ISPRS J. Photogramm. Remote Sens. 2011, 66, 247–259. [Google Scholar] [CrossRef]
- De’ath, G.; Fabricius, K.E. Classification and Regression Trees: A Powerful yet Simple Technique for Ecological Data Analysis. Ecology 2000, 81, 3178–3192. [Google Scholar] [CrossRef]
- Gitelson, A.A.; Gritz, Y.; Merzlyak, M.N. Relationships between Leaf Chlorophyll Content and Spectral Reflectance and Algorithms for Non-Destructive Chlorophyll Assessment in Higher Plant Leaves. J. Plant Physiol. 2003, 160, 271–282. [Google Scholar] [CrossRef]
- Kohavi, R. A Study of Cross-Validation and Bootstrap for Accuracy Estimation and Model Selection. In Proceedings of the Fourteenth International Joint Conference on Artificial Intelligence (II), IJCAI-95, Montreal, QC, Canada, 1995; Morgan Kaufman Publishing: San Francisco, CA, USA, 1995; Volume 14, pp. 1137–1144. [Google Scholar]
- Bergstra, J.; Bengio, Y. Random Search for Hyper-Parameter Optimization. J. Mach. Learn. Res. 2012, 13, 281–305. [Google Scholar]
- Draper, N.R. Applied Regression Analysis; McGraw-Hill Inc.: New York, NY, USA, 1998. [Google Scholar]
- Sterling, A.; Di Rienzo, J.A. Prediction of South American Leaf Blight and Disease-Induced Photosynthetic Changes in Rubber Tree, Using Machine Learning Techniques on Leaf Hyperspectral Reflectance. Plants 2022, 11, 329. [Google Scholar] [CrossRef]
- Amaral, C.H.; Almeida, T.I.R.; Quitério, G.C.M.; Alves, M.N.; Souza Filho, C.R. Change Analysis of the Spectral Characteristics of Rubber Trees at Canopy and Leaf Scales during the Brazilian Autumn. Int. Arch. Photogramm. Remote Sens. Spat. Inf. Sci. ISPRS Arch. 2012, 39, 381–386. [Google Scholar] [CrossRef]
- Lai, H.; Chen, B.; Wang, G.; Yin, X.; Wang, X.; Yun, T.; Lan, G.; Wu, Z.; Yang, C.; Kou, W. Unraveling the Dynamic of Rubber Phenology in Hainan Island, China: Insights from Multi-Source Remote Sensing and Climate Data. Authorea Prepr. 2024. [Google Scholar] [CrossRef]
- Akın, A.; Çilek, A.; Middel, A. Modelling Tree Canopy Cover and Evaluating the Driving Factors Based on Remotely Sensed Data and Machine Learning. Urban For. Urban Green 2023, 86, 128035. [Google Scholar] [CrossRef]
- Nasiri, V.; Beloiu, M.; Asghar Darvishsefat, A.; Griess, V.C.; Maftei, C.; Waser, L.T. Mapping Tree Species Composition in a Caspian Temperate Mixed Forest Based on Spectral-Temporal Metrics and Machine Learning. Int. J. Appl. Earth Obs. Geoinf. 2023, 116, 103154. [Google Scholar] [CrossRef]
- Zeng, T.; Fang, J.; Yin, C.; Li, Y.; Fu, W.; Zhang, H.; Wang, J.; Zhang, X. Recognition of Rubber Tree Powdery Mildew Based on UAV Remote Sensing with Different Spatial Resolutions. Drones 2023, 7, 533. [Google Scholar] [CrossRef]
- Xue, J.; Su, B. Significant Remote Sensing Vegetation Indices: A Review of Developments and Applications. J. Sens. 2017, 2017, 1353691. [Google Scholar] [CrossRef]
- Chang, A.; Yeom, J.; Jung, J.; Landivar, J. Comparison of Canopy Shape and Vegetation Indices of Citrus Trees Derived from UAV Multispectral Images for Characterization of Citrus Greening Disease. Remote Sens. 2020, 12, 4122. [Google Scholar] [CrossRef]


| Variable | Data Source | Time Frame | Spatial and Temporal Resolution |
|---|---|---|---|
| Tree Properties (Height, Diameter, Canopy Density, Photo) | Field Survey | 25–28 March 2022 8–12 June 2022 7–13 February 2023 1–5 July 2024 | – |
| UAV Imagery | 25–28 March 2022 8–12 June 2022 7–13 February 2023 1–5 July 2024 6–11 November 2024 | 10 cm | |
| Vegetation Index | Sentinel-2A (ESA) | 2022–2024 | 10 m, 5 Day |
| Sentinel-2B (ESA) | |||
| Landsat-7 (USGS) | 30 m, 16 Day | ||
| Landsat-8 (USGS) | |||
| Landsat-9 (USGS) | 2022–2024 |
| Vegetation Index | Formula | Description | Reference |
|---|---|---|---|
| ARVI | (NIR − (2 × RED) + BLUE)/(NIR + (2 × RED) + BLUE) | Enhances vegetation signal while reducing atmospheric effects. | [29] |
| EVI | 2.5 × (NIR − RED)/(NIR + 6 × RED − 7.5 × BLUE + 1) | Optimizes vegetation signal by reducing soil and atmospheric influences. | [25] |
| GNDVI | (NIR − GREEN)/(NIR + GREEN) | Sensitive to chlorophyll concentration and plant health. | [30] |
| MSAVI | (2NIR + 1 − sqrt((2NIR + 1)^2 − 8(NIR − RED)))/2 | Minimizes soil brightness influence on vegetation measurements. | [27] |
| MTVI2 | 1.5 × [1.2(NIR − GREEN) − 2.5(RED − GREEN)]/sqrt((2NIR + 1)^2 − (6NIR − 5sqrt(RED)) − 0.5) | Enhances detection of chlorophyll content and canopy structure. | [31] |
| NDVI | (NIR − RED)/(NIR + RED) | Standard index for measuring vegetation vigor and biomass. | [32] |
| OSAVI | (NIR − RED)/(NIR + RED + 0.16) | Reduces soil influence for sparse vegetation cover analysis. | [26] |
| Model | Training | Testing | ||||||
|---|---|---|---|---|---|---|---|---|
| RMSE | MAE | R2 | Adj. R2 | RMSE | MAE | R2 | Adj. R2 | |
| RF | 3.01 | 2.24 | 0.96 | 0.96 | 6.46 | 4.97 | 0.82 | 0.81 |
| SVM | 6.67 | 5.04 | 0.81 | 0.8 | 6.62 | 5.12 | 0.81 | 0.8 |
| CART | 7.06 | 5.3 | 0.78 | 0.78 | 7.78 | 5.66 | 0.74 | 0.72 |
| Linear Regression | 9.13 | 6.99 | 0.64 | 0.63 | 9.04 | 7.17 | 0.64 | 0.62 |
Disclaimer/Publisher’s Note: The statements, opinions and data contained in all publications are solely those of the individual author(s) and contributor(s) and not of MDPI and/or the editor(s). MDPI and/or the editor(s) disclaim responsibility for any injury to people or property resulting from any ideas, methods, instructions or products referred to in the content. |
© 2025 by the authors. Licensee MDPI, Basel, Switzerland. This article is an open access article distributed under the terms and conditions of the Creative Commons Attribution (CC BY) license (https://creativecommons.org/licenses/by/4.0/).
Share and Cite
Manessa, M.D.M.; Efriana, A.F.; Ayu, F.; Pamungkas, F.D.; Stevanus, C.T.; Febbiyanti, T.R.; Shidiq, I.P.A.; Rokhmatulloh, R.; Supriatna, S.; Lestari, R.; et al. Validation of Satellite-Derived Green Canopy Cover in Rubber Plantations Using UAV and Ground Observations for Monitoring Leaf Fall Dynamics. Forests 2025, 16, 717. https://doi.org/10.3390/f16050717
Manessa MDM, Efriana AF, Ayu F, Pamungkas FD, Stevanus CT, Febbiyanti TR, Shidiq IPA, Rokhmatulloh R, Supriatna S, Lestari R, et al. Validation of Satellite-Derived Green Canopy Cover in Rubber Plantations Using UAV and Ground Observations for Monitoring Leaf Fall Dynamics. Forests. 2025; 16(5):717. https://doi.org/10.3390/f16050717
Chicago/Turabian StyleManessa, Masita Dwi Mandini, Anisya Feby Efriana, Farida Ayu, Fajar Dwi Pamungkas, Charlos Togi Stevanus, Tri Rapani Febbiyanti, Iqbal Putut Ash Shidiq, Rokhmatulloh Rokhmatulloh, Supriatna Supriatna, Retno Lestari, and et al. 2025. "Validation of Satellite-Derived Green Canopy Cover in Rubber Plantations Using UAV and Ground Observations for Monitoring Leaf Fall Dynamics" Forests 16, no. 5: 717. https://doi.org/10.3390/f16050717
APA StyleManessa, M. D. M., Efriana, A. F., Ayu, F., Pamungkas, F. D., Stevanus, C. T., Febbiyanti, T. R., Shidiq, I. P. A., Rokhmatulloh, R., Supriatna, S., Lestari, R., Kase, K., Matsui, M., Sajjad, A. A. A., Aji, D. M., Riesnandar, A. A., Prakarsa, G. N., Nagara, R. P., Pradono, K. A., & Parhusip, R. (2025). Validation of Satellite-Derived Green Canopy Cover in Rubber Plantations Using UAV and Ground Observations for Monitoring Leaf Fall Dynamics. Forests, 16(5), 717. https://doi.org/10.3390/f16050717