Article

Response of Soil Enzyme and Plant Stoichiometry to Root Interactions: Insights from Mixed Plantings of Moso Bamboo

1
China National Bamboo Research Center, Key Laboratory of State Forestry and Grassland Administration on Bamboo Forest Ecology and Resource Utilization, Hangzhou 310012, China
2
College of Biology and the Environment, Nanjing Forestry University, Nanjing 210037, China
3
Agricultural and Forestry Technology Promotion Center in Lin’an District, Hangzhou 311300, China
4
Deqing Country Natural Resources and Planning Bureau, Huzhou 313200, China
*
Author to whom correspondence should be addressed.
Forests 2025, 16(5), 722; https://doi.org/10.3390/f16050722
Submission received: 24 February 2025 / Revised: 1 April 2025 / Accepted: 21 April 2025 / Published: 23 April 2025
(This article belongs to the Section Forest Ecology and Management)

Abstract

:
Root interactions are crucial in regulating soil microbial metabolism and plant nutrient allocation strategies, especially in mixed plantings. However, the effects of mixed planting and direct root contact on soil properties and plant nutrient allocation remain unclear. Thus, we established potted plants with Moso bamboo (Phyllostachys edulis) and Phoebe chekiangensis and created a physical barrier to the root system without blocking chemical communication using four treatments: mixed planting with root segregation (MT), mixed planting without root segregation (MS), pure Moso bamboo with root segregation (BT), and pure Moso bamboo without root segregation (BS). We investigated changes in soil and Moso bamboo nutrient content, soil enzyme activity, and microbial metabolic limitation. The results show that mixed planting and root segregation significantly affected soil and plant nutrient content and soil enzyme activities. Compared to the two pure Moso bamboo treatments, mixed planting increased microbial carbon limitation but decreased microbial nitrogen limitation. Physical segregation between roots increased microbial carbon use efficiency (CUE) compared to no segregation. Random forest analyses revealed that the best predictors of soil C and N limitations and CUE were microbial biomass and dissolved organic nitrogen (DON), respectively. Partial least squares path modeling indicated that mixed planting and root separation, directly and indirectly, affected soil microbial metabolic limitation through their effects on soil nutrients, microbial biomass, and enzyme activities. Carbon limitation significantly increased plant nutrient contents. Our study provides further insights into factors influencing nutrient limitation, CUE, and plant nutrient allocation strategies in mixed Moso bamboo plantations.

1. Introduction

Interactions between plants play an important role in ecosystem regulation [1]. These interactions can significantly affect soil microorganisms, which are important biological components of ecosystems. In turn, changes in soil microorganisms significantly influence soil fertility and nutrient cycling through their metabolic activities as decomposers, including the decomposition and mineralization of organic matter [2,3]. Soil microorganisms release extracellular enzymes that directly mediate microbial metabolism [4]. They participate in the degradation of microbial and plant cell walls, depolymerize macromolecules, drive soil nutrient cycling, and serve as key regulators in modulating the speed of decomposition processes [5,6]. Soil microorganisms are often constrained by key nutrients and energy sources [7] and can be impacted by changes in soil physico-chemical properties, climate, and other environmental elements [2,8]. These factors prompt soil microorganisms to adapt their metabolic processes by changing the proportion of extracellular enzyme secretion [9]. Moorhead et al. [10] proposed a measure to describe microbial metabolic limitation by using the activities of C, N, and P acquisition enzymes to calculate the length and angle of the vector, providing an assessment tool for metabolic limitations in soil microorganisms [11]. Microbial metabolism can be measured by the microbial carbon use efficiency (CUE) indicator [12]. Ref. [13] demonstrates that it can be calculated from soil enzyme activities, microbial biomass, and soil nutrient stoichiometry. Changes in extracellular enzyme activities and their stoichiometric ratios can be used to investigate the nutrient status and requirements of soils and can help to describe microbial nutrient requirements and resource acquisition strategies [14,15].
Roots act as the bridge between the plant and the soil, establishing relationships and serving as the key organ for plant interactions [16]. Many studies have demonstrated the influence of mixed plantings on soil nutrients and microorganisms. For example, Yang et al. [17] demonstrated that different intercropping systems can regulate soil stoichiometric ratios and microbial metabolic limitations. In addition, changes in soil properties in mixed planting systems can result from root distribution patterns and root secretions, which can, in turn, affect the plants. Some researchers have reported that plants may be able to detect neighboring plants by resource and non-resource methods [18]. Many researchers have used mesh, which does not prevent soil chemical and microbiological communication, to explore the effects of root contact. In soybean–cotton intercropping systems, root distribution and direct contact are the main factors influencing nitrogen transfer and dry matter in the aboveground part of cotton [19]. Similarly, in the maize and soybean intercrop system, direct root contact influences the dry matter quality of the above and below-ground parts of both soybean and maize [20]. However, these previous studies primarily focused on the effects of root direct contact on plant dry matter and chemosensory substances; research on the effects of root contact on soil microbial metabolic limitation and plant nutrient allocation strategies is scarce.
Moso bamboo (Phyllostachys edulis) is a fast-growing plant widely distributed in China [21]. The long-term cultivation of Moso bamboo decreases the soil enzyme activity, pH, and microbial diversity [22]. Conversely, the introduction of other tree taxa is beneficial to carbon and nitrogen pools in Moso bamboo forest soil and can improve soil quality and ecological functions [23]. Meanwhile, Phoebe chekiangensis is a very valuable tree species, and many farmers plant it together with Moso bamboo to enhance the economic benefits [24]. However, Moso bamboo is known for its rapid clonal growth through its root system [25], and its robust underground system enables strong interactions with other plants in mixed plantings. Environmental factors, the species composition of plant communities, and root interactions can influence soil enzyme activities and CUE, altering the metabolic constraints on soil microorganisms [26,27].
Therefore, in the present study, we aimed to investigate the effects of root segregation and mixed planting on soil nutrients, microbial metabolism, and nutrient allocation strategies of Moso bamboo. To this end, we established a long-term pot experiment with a mixed planting of Moso bamboo and Phoebe chekiangensis. Based on this, barriers were established between the roots of different plants to investigate the influence of introducing other tree taxa into the Moso bamboo on soil nutrient limitations. We hypothesized that (1) mixed planting of Moso bamboo and Phoebe chekiangensis alters soil chemical properties and affects soil enzymes and their stoichiometric ratios; (2) mixed planting helps alleviate soil microbial nitrogen limitation but exacerbates microbial carbon limitation; (3) physical segregation between roots affects microbial CUE; and (4) soil microbial carbon limitation is an important factor influencing plant nutrient content. In this study, we aimed to (1) identify the effects of mixed planting of Moso bamboo and Phoebe chekiangensis on soil enzymes, their stoichiometry, and soil microbial metabolic limitation; (2) examine new factors influencing and methods to improve CUE; and (3) explore the pathways of mixed planting and root system effects on plant nutrient distribution strategies.

2. Materials and Methods

2.1. Experimental Site

The study site was located in Yuhang District, Hangzhou City, Zhejiang Province, China (30°18′ N, 119°53′ E). The study area has an average annual temperature of 18.2 °C; precipitation of 1632 mm; annual sunshine of 1611 h; and a frost-free period of 314 d. The climate is subtropical monsoon.

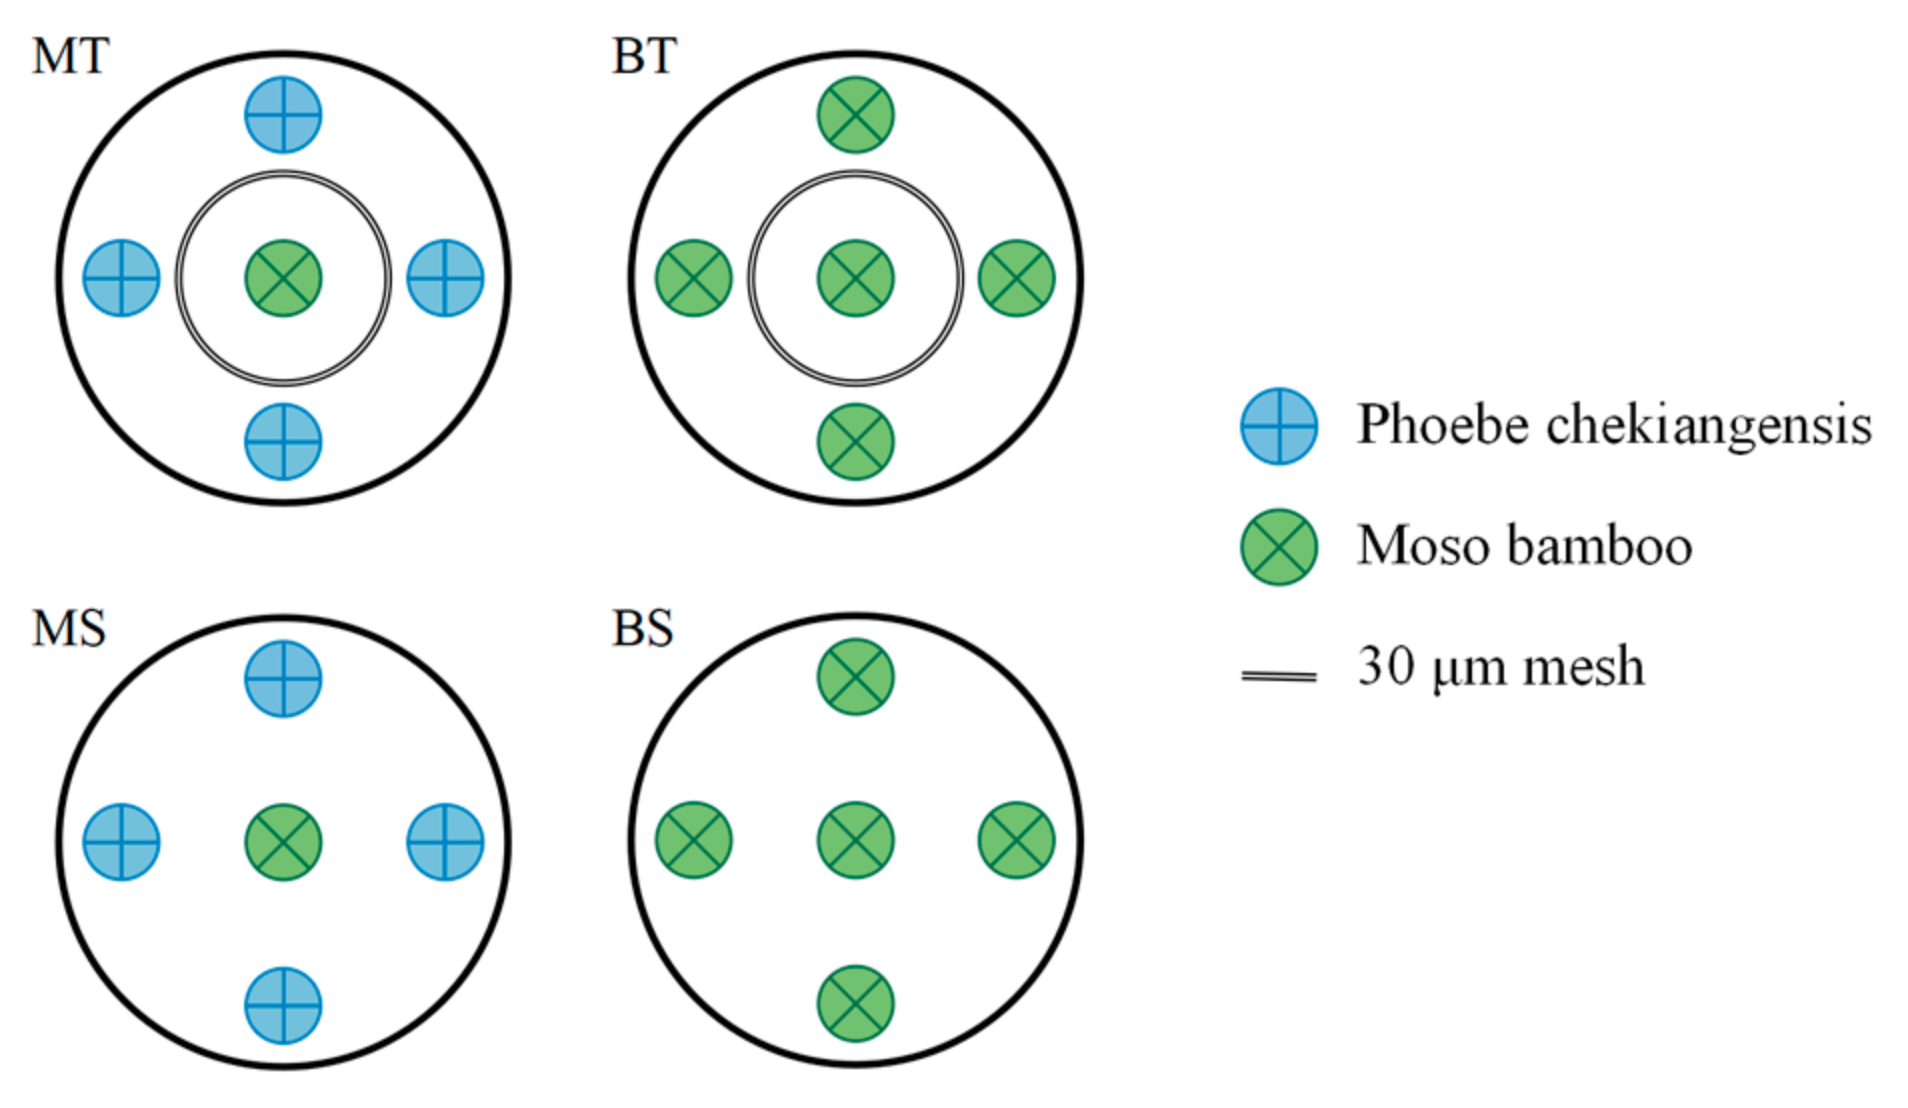
2.2. Experimental Design

The pots were set up for the experiments in May 2021. Pots with a diameter of 60 cm and a height of 50 cm were used for the experiment and were divided into two treatment groups. One of these had 30 μm mesh of nylon, which allowed for the interaction between chemicals and microbes; however, this prevented physical contact between roots inside the pot to separate the soil into a central area of 28 cm in diameter and an external area [28]. The others were not separated using mesh. In the center of each pot was a cluster of Moso bamboo. Four Phoebe chekiangensis or Moso bamboo trees were planted in the outer pots in a centrally symmetrical arrangement (Figure 1). This experiment comprised four treatments: using mesh segregation and planting Phoebe chekiangensis in the outer ring (MT); no mesh segregation and planting Phoebe chekiangensis in the outer ring (MS); using mesh segregation and planting Moso bamboo in the outer ring (BT); and no mesh segregation and planting Moso bamboo in the outer ring (BS). Each treatment was replicated five times, totaling twenty pots. The potting soil was collected from a Moso bamboo forest under conventional management conditions near the experimental site, which has montane red soil and is acidic, and thoroughly mixed after removing plant tissues. The pots consisted of black plastic root control containers designed with a grid-like structure, including internal vertical ridges and perforations. The Moso bamboo and Phoebe chekiangensis used in the experiment were all one-year-old seedlings that had undergone a hardening-off period of over 90 d. All the potted plants were completely randomized with regular weeding and watering, and no fertilizer was applied.

2.3. Sample Collection

In April 2024, the potted plants were dismantled, and the soil and plant samples were collected. For pots with a mesh, the outer shell was first removed, the outer soil was discarded, the central portion was transferred to a clean area, the mesh was removed, and the soil from the central portion was collected. For potted plants without mesh, the outer shell was removed first, followed by the separation of the outer roots and soil. The soil surrounding the central bamboo root was then collected. Soil from the same area in each pot was thoroughly mixed to form a single sample. Visible debris and plant and animal remains were removed from the collected soil by sieving through a 2 mm sieve. Soil for measuring microbial biomass was stored at 4 °C. The soil was air-dried before the determination of chemical properties and enzyme activity. Plant samples were collected during pot disassembly. First, the above-ground parts of the Moso bamboo were collected and cut at the stem bottom. The leaves were immediately removed from the stem to prevent nutrient transfer. The roots were collected during the soil collection process. The leaves, stems, and roots of each potted plant were separately placed in Ziplock bags and transported to the laboratory, where they were dried and used to measure the carbon, nitrogen, and phosphorus contents.

2.4. Analysis of Soil Biotic and Abiotic Indicators

Soil pH was determined using the glass electrode of pH meter using a 1:2.5 (w/v) soil–water suspension. The Kjeldahl method was used to determine the total soil nitrogen (TN) content [29]. Determination of microbial biomass carbon (MBC), microbial biomass phosphorus (MBP), and microbial biomass nitrogen (MBN) was carried out using chloroform fumigation and leaching. This method uses differential values after fumigation of fresh soil with chloroform [30,31]. MBC, MBN, dissolved organic carbon (DOC), and dissolved organic nitrogen (DON) were extracted using K2SO4 solution. A TOC analyzer (Multi N/C 3100; Analytik Jena, Germany) was used to determine the concentration of total carbon (TC) and the properties mentioned above [32]. C and N contents in plants were determined using an elemental analyzer (Elementar Scientific Instruments, Hanau, Germany). MBP and soil available phosphorus (AP) were extracted using NaHCO3 solution. Soil total phosphorus (TP) and plant phosphorus were extracted using the HClO4-H2SO4 digestion method. The molybdenum–antimony colorimetric method was used to measure the content of the aforementioned indicators [33]. The conversion factors for MBC, MBN, and MBP were set to 0.45, 0.45, and 0.4, respectively [34,35]. Five soil enzyme activities, including β-1,4-glucosidase (BG) and β-D-cellobiosidase (CBH), related to carbon acquisition; β-1,4-N-acetylglucosaminidase (NAG) and leucine aminopeptidase (LAP), related to nitrogen acquisition; and the phosphorus-acquiring enzyme acid phosphatase (ACP) were determined using the microtiter plate fluorescence method [36,37]. The unit of enzyme activity was defined in μmol·h−1·g−1 dry soil.

2.5. Calculation of Microbial Metabolic Limitation and CUE

Calculations based on the vector model using the relative ratios of C vs. N- and C vs. P-acquiring enzyme activities were used to analyze the resource limitations occurring during microbial metabolism [10,37,38]. The calculation process was as follows:
V e c t o r   l e n g t h = ( x 2 + y 2 ) 0.5
V e c t e r   a n g l e = D e g r e e s A T A N 2 ( x , y )
x = C a c q u i r i n g C a c q u i r i n g + P a c q u i r i n g
y = C a c q u i r i n g C a c q u i r i n g + N a c q u i r i n g
where C-acquiring enzyme activity is (CBH + BG), P-acquiring enzyme activity is ACP, and N-acquiring enzyme activity is (LAP + NAG). The values of x and y in the formula can be calculated using various methods. Following the method in [10], we used the original relative ratio of C- to N- or to P-acquiring enzyme to define it without further transformations. The vector length was related to carbon limitation, with severe carbon limitation being seen when the length was greater. The vector angle was related to microbial N/P limitation, with <45° representing nitrogen and >45° representing phosphorus limitations, and with values deviating more from 45° representing greater limitation.
Based on the method in [39], soil microbial CUE can be calculated as follows:
C U E = C U E m a x × ( S C : N × S C : P ) / ( K C : N + S C : N ) × ( K C : P + S C : P ) ,
S C : N = M C : N × 1 / ( L C : N × E E A C : N ) ,
S C : P = M C : P × 1 / ( L C : P × E E A C : P )
KC:N and KC:P are the half-saturation constants of CUE based on the availability of C, N, and P, both considering the value of 0.5.

2.6. Statistical Analysis

Excel 2016 was used to collate all the data; a one-way analysis of variance (ANOVA) was performed on the data, such as soil properties, enzyme activities, and microbial variables, using SPSS 26.0. Relationships between data were determined using Pearson’s correlation coefficients. The ‘Vegan’ package in R4.3.3 was used to perform redundancy analysis (RDA), the ‘randomForest’ and ‘rfPermute’ packages in R4.3.3 were used to perform random forest analysis, and the ‘plspm’ package in R4.3.3 was used to perform partial least squares path modeling (PLS-PM). Visualizations were created using the ‘ggplot2’ package in R and Origin 2025 software.

3. Results

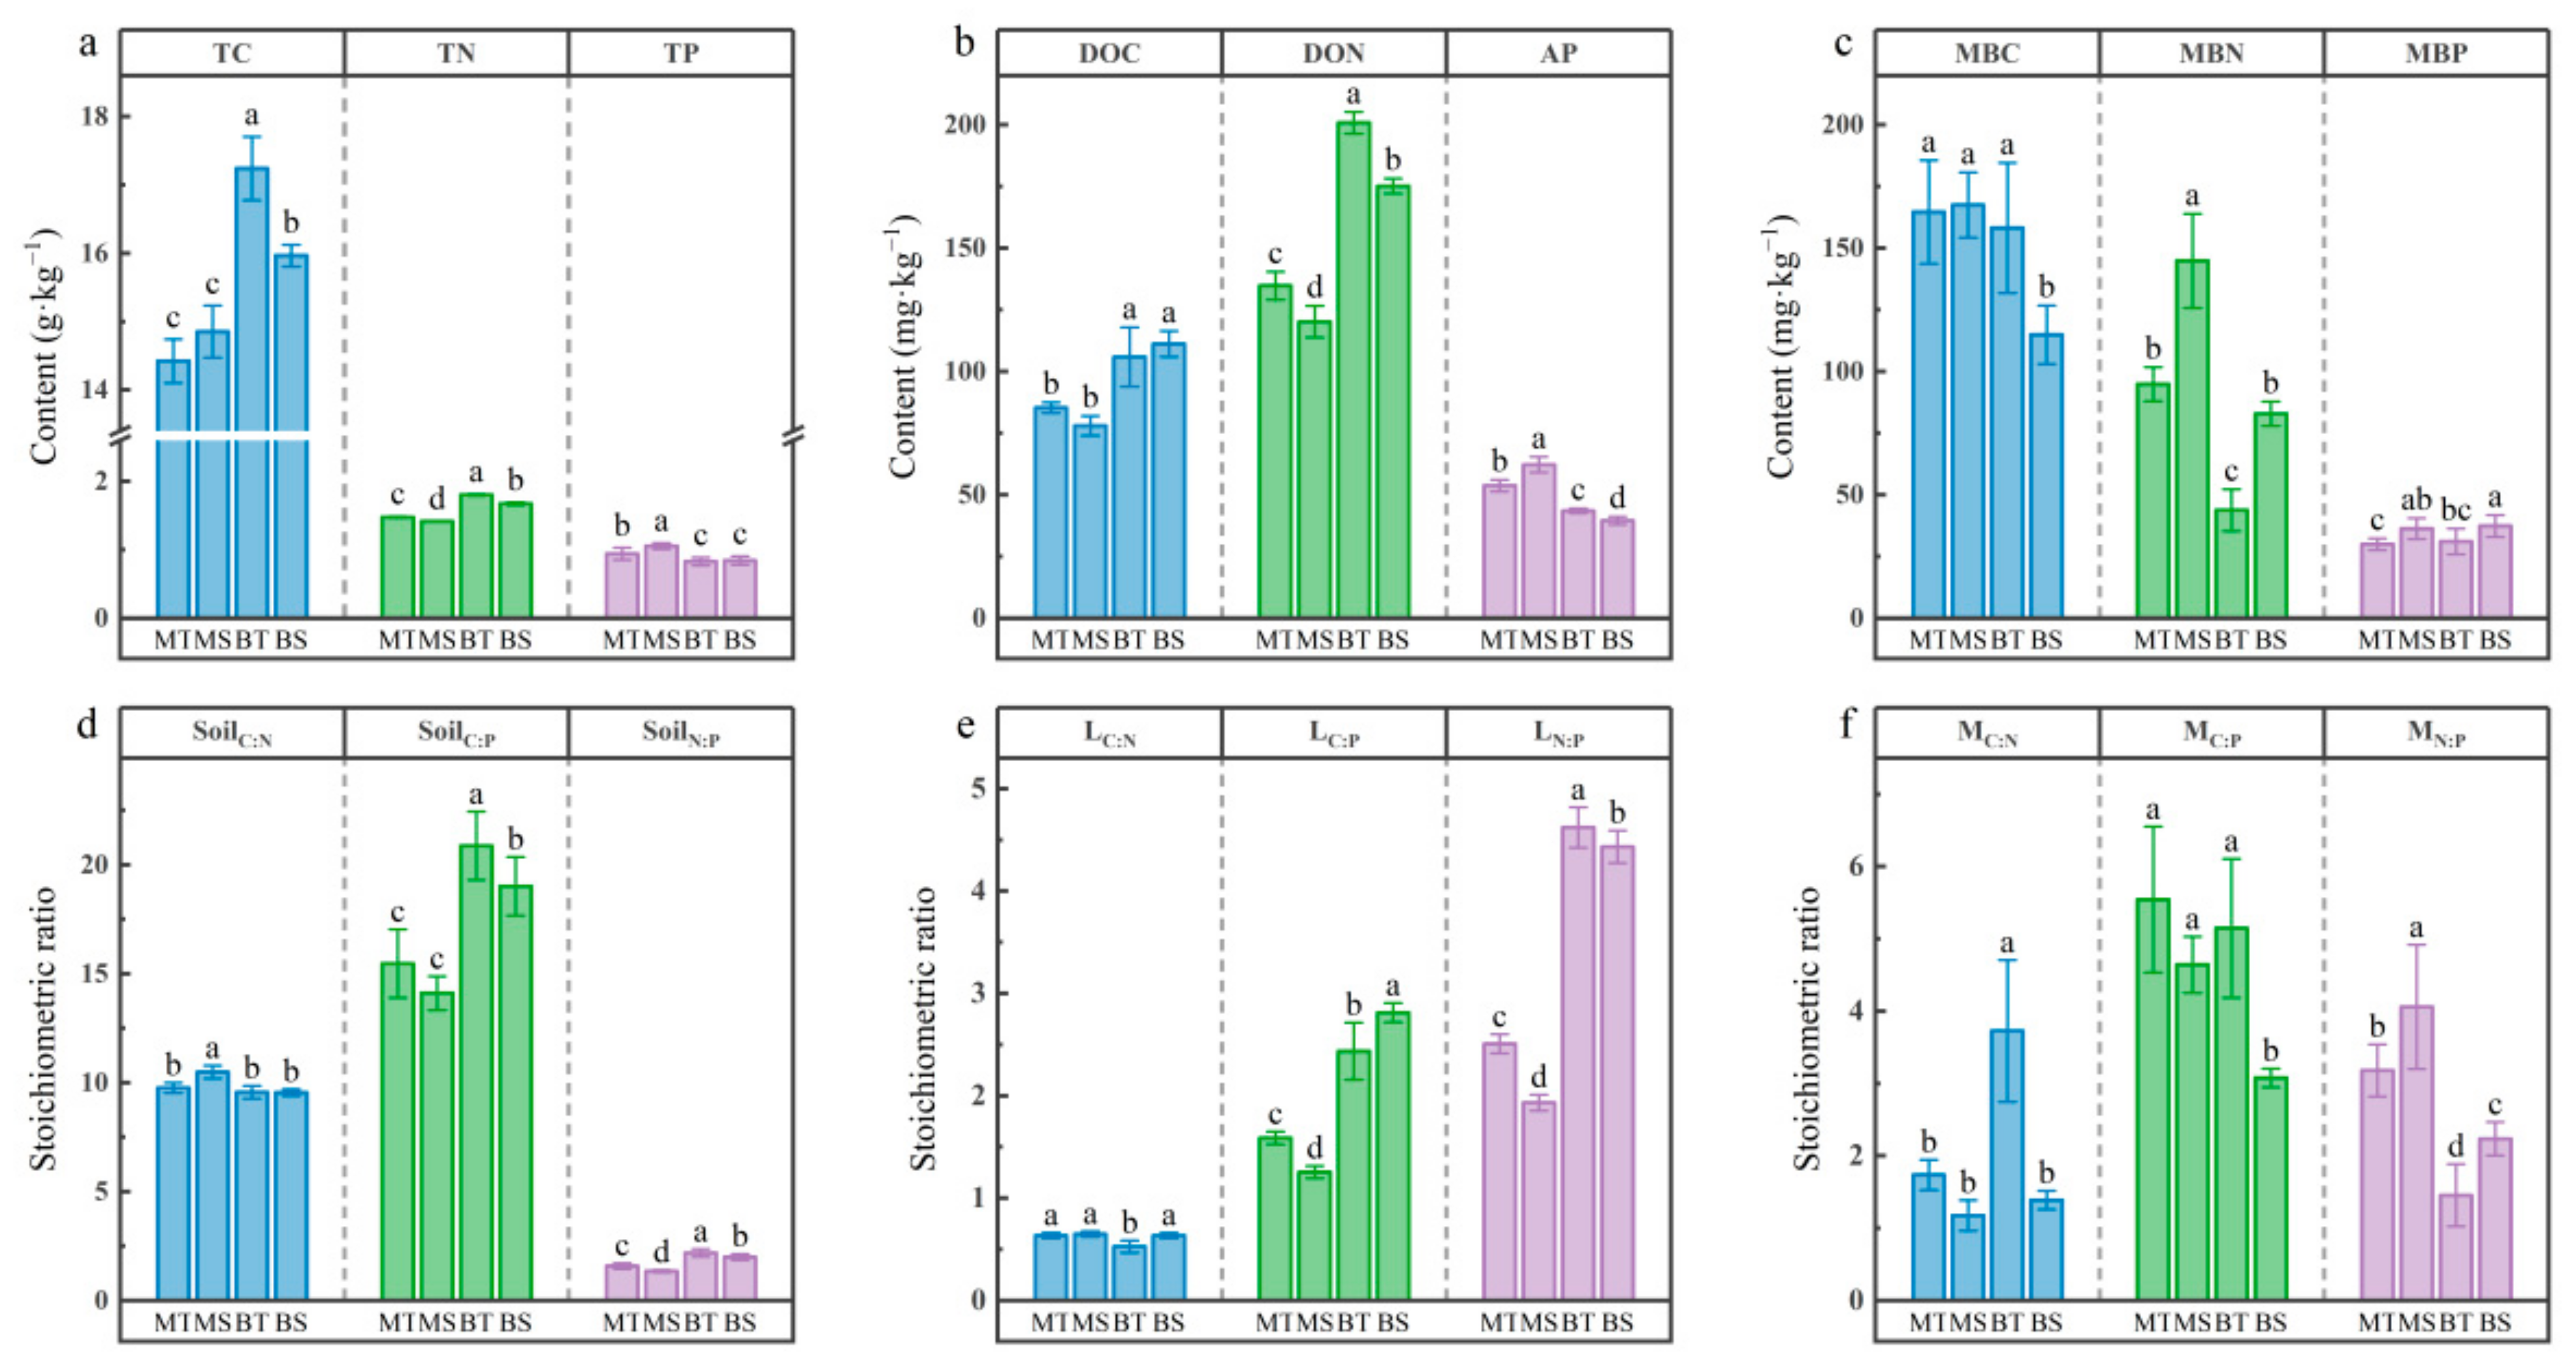
3.1. Soil Chemistry and Microbial Biomass

Mixed planting considerably affected the soil properties and microbial biomass (Figure 2). Compared to BT and BS, soil TC, TN, DOC, and DON were significantly (p < 0.05) reduced in MT and MS. However, the soil TP and AP contents were significantly (p < 0.05) enhanced. The soil TC, TN, and DON contents reached their maximum in BT. Meanwhile, BS had the lowest MBC and AP contents. The contents of MBP, MBN, DON, and TN were all significantly influenced by the mesh type, with MT > MS and BT > BS (p < 0.05). Soil pH was significantly (p < 0.05) lower in the BT than in the others (Figure S1a).
The four treatments significantly affected the soil stoichiometric ratios (Figure 2). Mixed planting (MT and MS) significantly (p < 0.05) reduced SoilC:P, SoilN:P, LC:P, and LN:P, and all the above indexes were minimized under the MS treatment at 14.11, 1.35, 1.26, and 1.93, respectively. MN:P was significantly (p < 0.05) higher in the MT and MS treatments than in the BT and BS treatments. The mesh influenced the values of SoilC:P, SoilN:P, LN:P, MC:N, MC:P, and MN:P, except MN:P showed MT > MS, BT > BS. And MN:P ordered from largest to smallest is MS > MT > BS > BT.

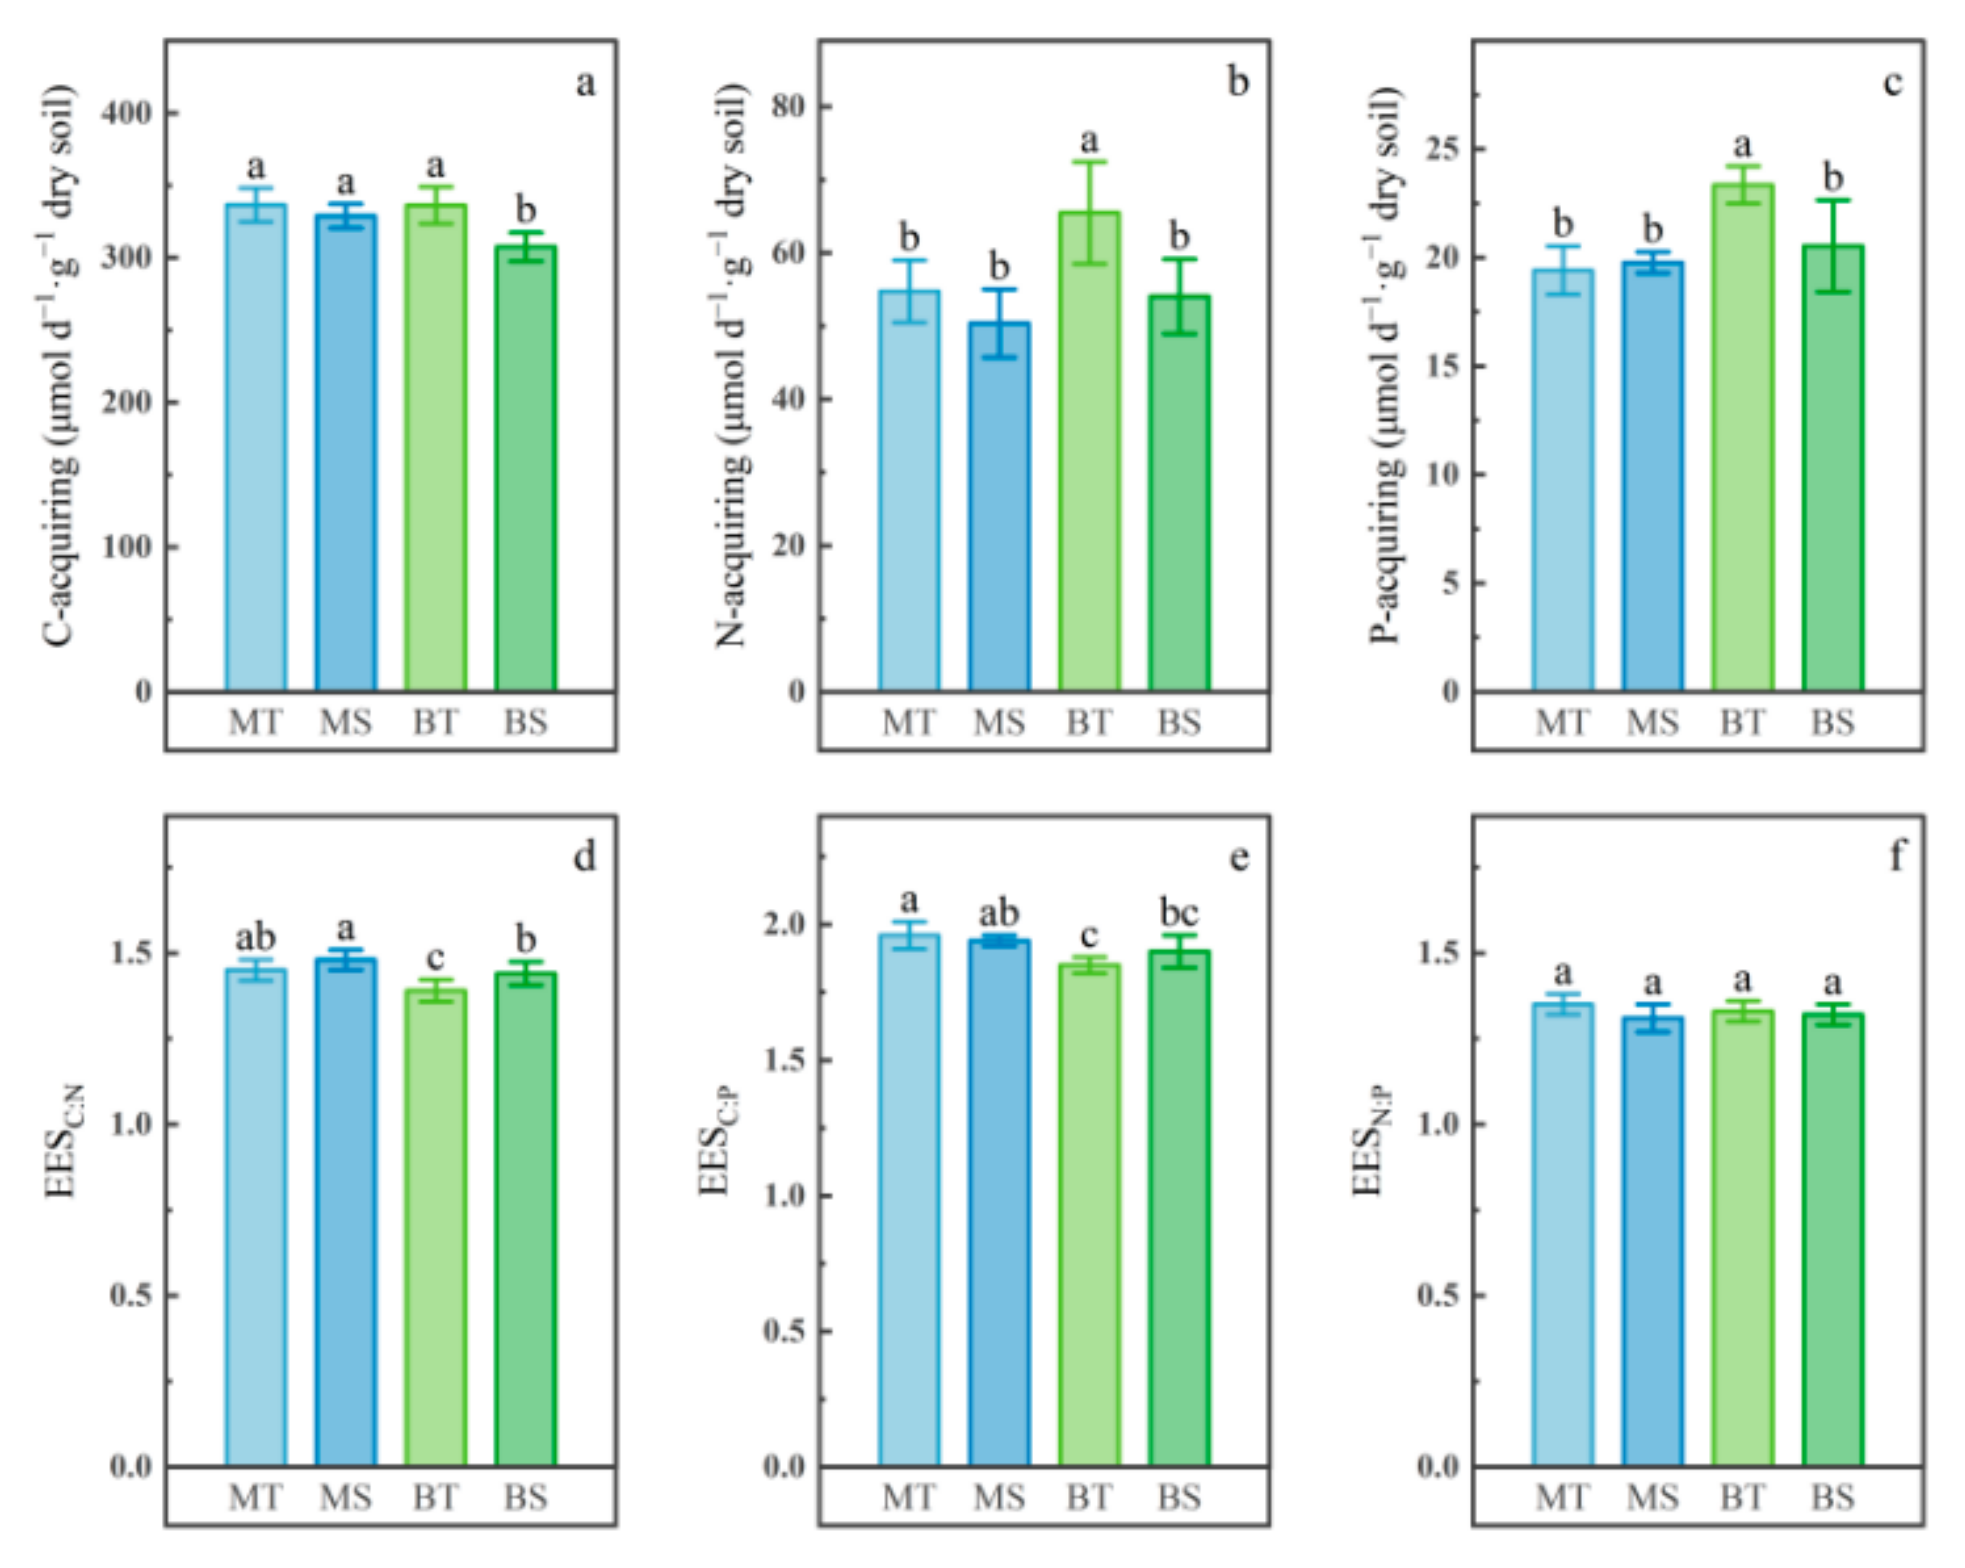
3.2. Soil Enzyme Activities and Stoichiometric Ratios

BS had the lowest and MT had the highest BG activities, respectively, with the order from highest to lowest being MT > BT > MS > BS (Figure S1c). CBH activity was significantly (p < 0.05) reduced at MT than at MS and BT (Figure S1b). Overall, C-acquiring enzyme activity was significantly (p < 0.05) reduced in BS than under the other three treatments. No difference was observed in C-acquiring enzyme activity among MT, MS, and BT (Figure 3a). Mixing significantly (p < 0.05) affected soil LAP activity, with LAP activity being significantly (p < 0.05) higher in BT and BS than in MT and MS (Figure S1d). NAG activity was significantly (p < 0.05) higher in the BT than in the other three treatments (Figure S1e). Overall, BT had the highest soil N-acquiring enzyme activity, with no significant (p < 0.05) differences between the remaining three treatments (Figure 3b). Soil P-acquiring enzyme activity reached a maximum at BT (Figure 3c). Compared with pure Moso bamboo, mixed planting increased EESC: N and EESC: P, both of which had minimum values in BT and maximum values in MS and MT (Figure 3d,e). No considerable differences were observed in the EESN: P for MT, MS, BT, and BS (Figure 3f).

3.3. Plant Nutrient Content and Stoichiometry

Mixed planting significantly (p < 0.05) increased the carbon content of the stems. Compared to the other three treatments, BT exhibited the lowest leaf carbon content, while MT had the highest root carbon content. The nitrogen content both the in leaves and stems was the highest in BT, followed by BS, MS, and MT. However, in the roots, the nitrogen content was the highest in BS, followed by BT, MS, and MT. Notably, mixed planting significantly (p < 0.05) reduced the nitrogen content in all parts of the plant. In pure Moso bamboo pots, the phosphorus content was high in the leaves and roots. In contrast, the phosphorus content was affected by the mesh in the stems and roots and was higher in MT and BT than in MS and BS, respectively. Notably, mixed planting increased the C:N ratio in all parts of the Moso bamboo and the C:P ratio in the leaves and roots. The mesh significantly (p < 0.05) affected the nutrient stoichiometry ratios of both the stems and roots. In particular, except for the C:N ratio in the stems, both stem and root C:P ratios and the root N:P ratio were higher in MS and BS than in MT and BT, respectively (Figure 4).

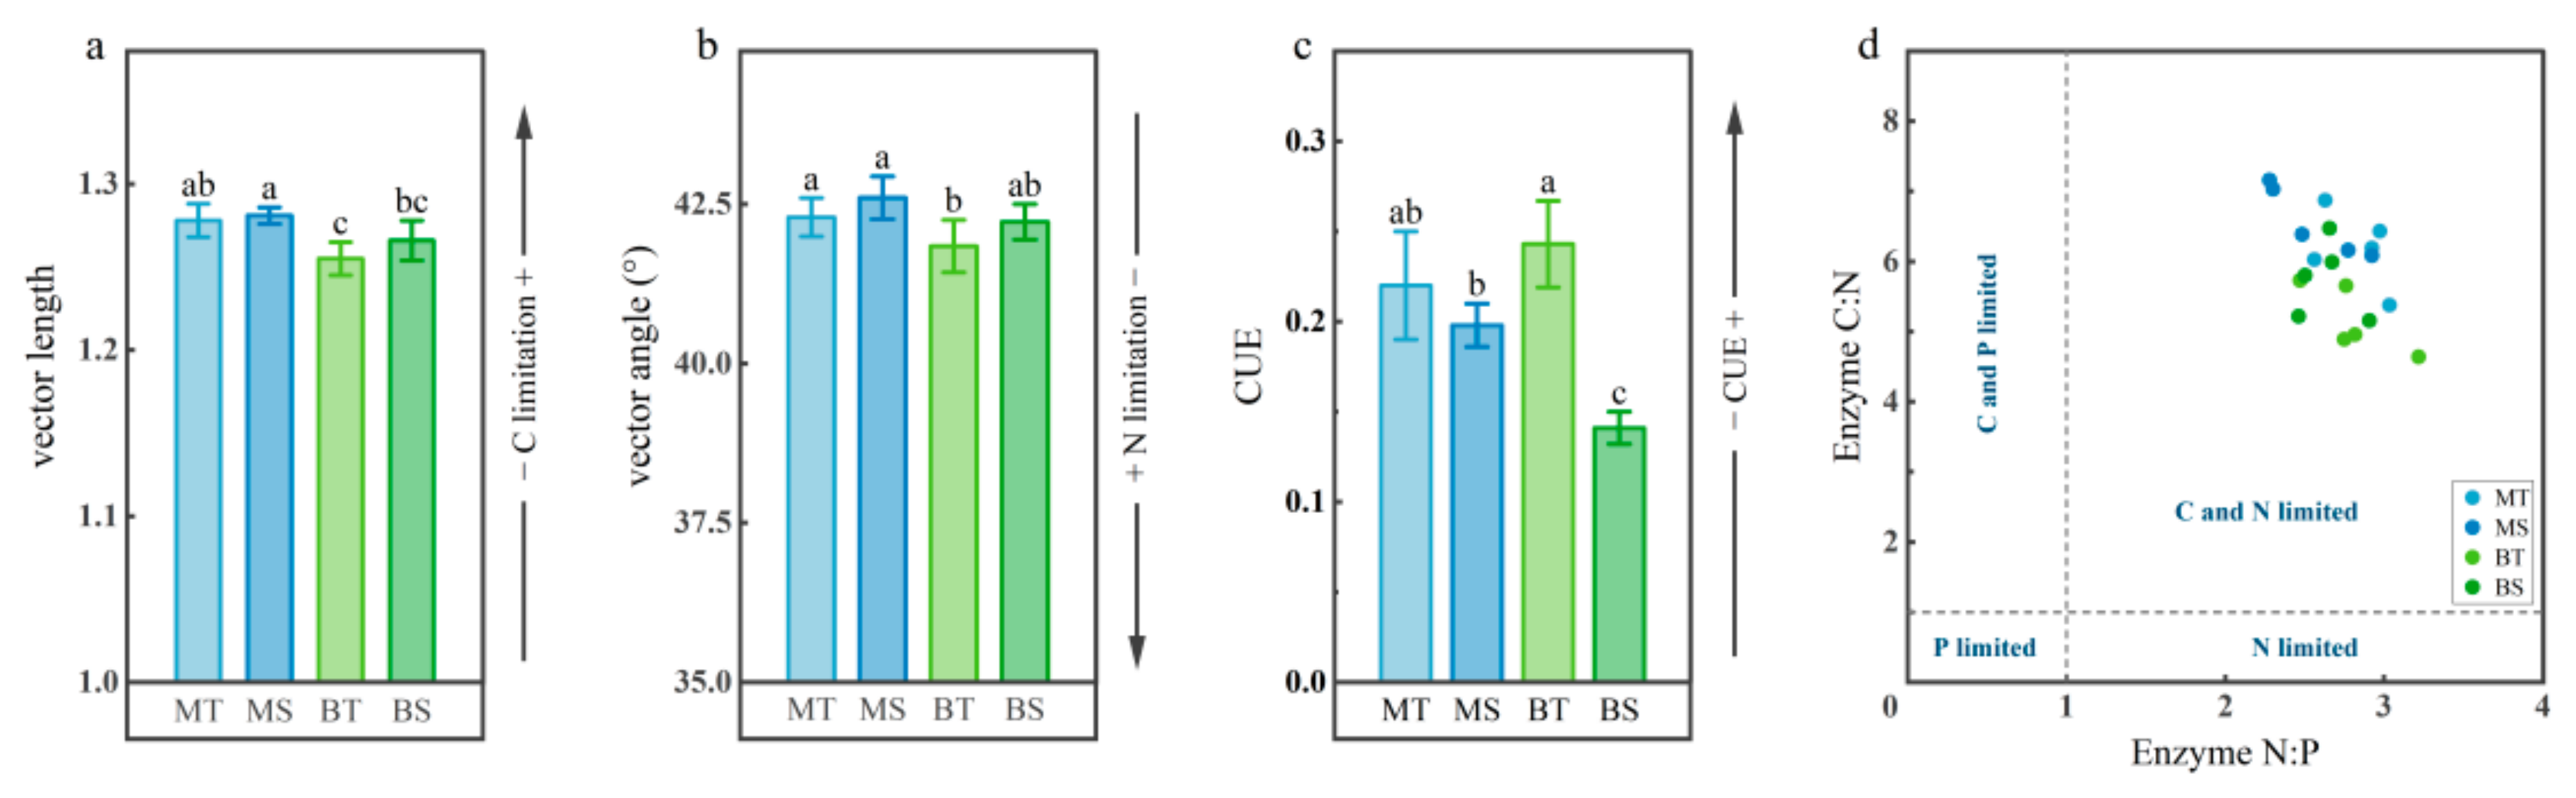
3.4. Microbial Metabolic Limitation and Carbon Use Efficiency

Mixing significantly (p < 0.05) affected microbial C and N limitation (Figure 5). Mixing increased the vector length (Figure 5a), indicating enhanced soil microbial carbon limitation. All four treatments exhibited N limitation with vector angles less than 45°. However, mixed planting increased the vector angle, suggesting a reduction in soil microbial nitrogen limitation. The MS and MT treatments reduced soil N limitation. A positive and significant (p < 0.001) correlation was observed between C and N limitation (Figure 5d). Root separation significantly (p < 0.05) influenced CUE (Figure 5c). Microbial CUE was the highest under BT and the lowest under BS, and both showed MT > MS and BT > BS.

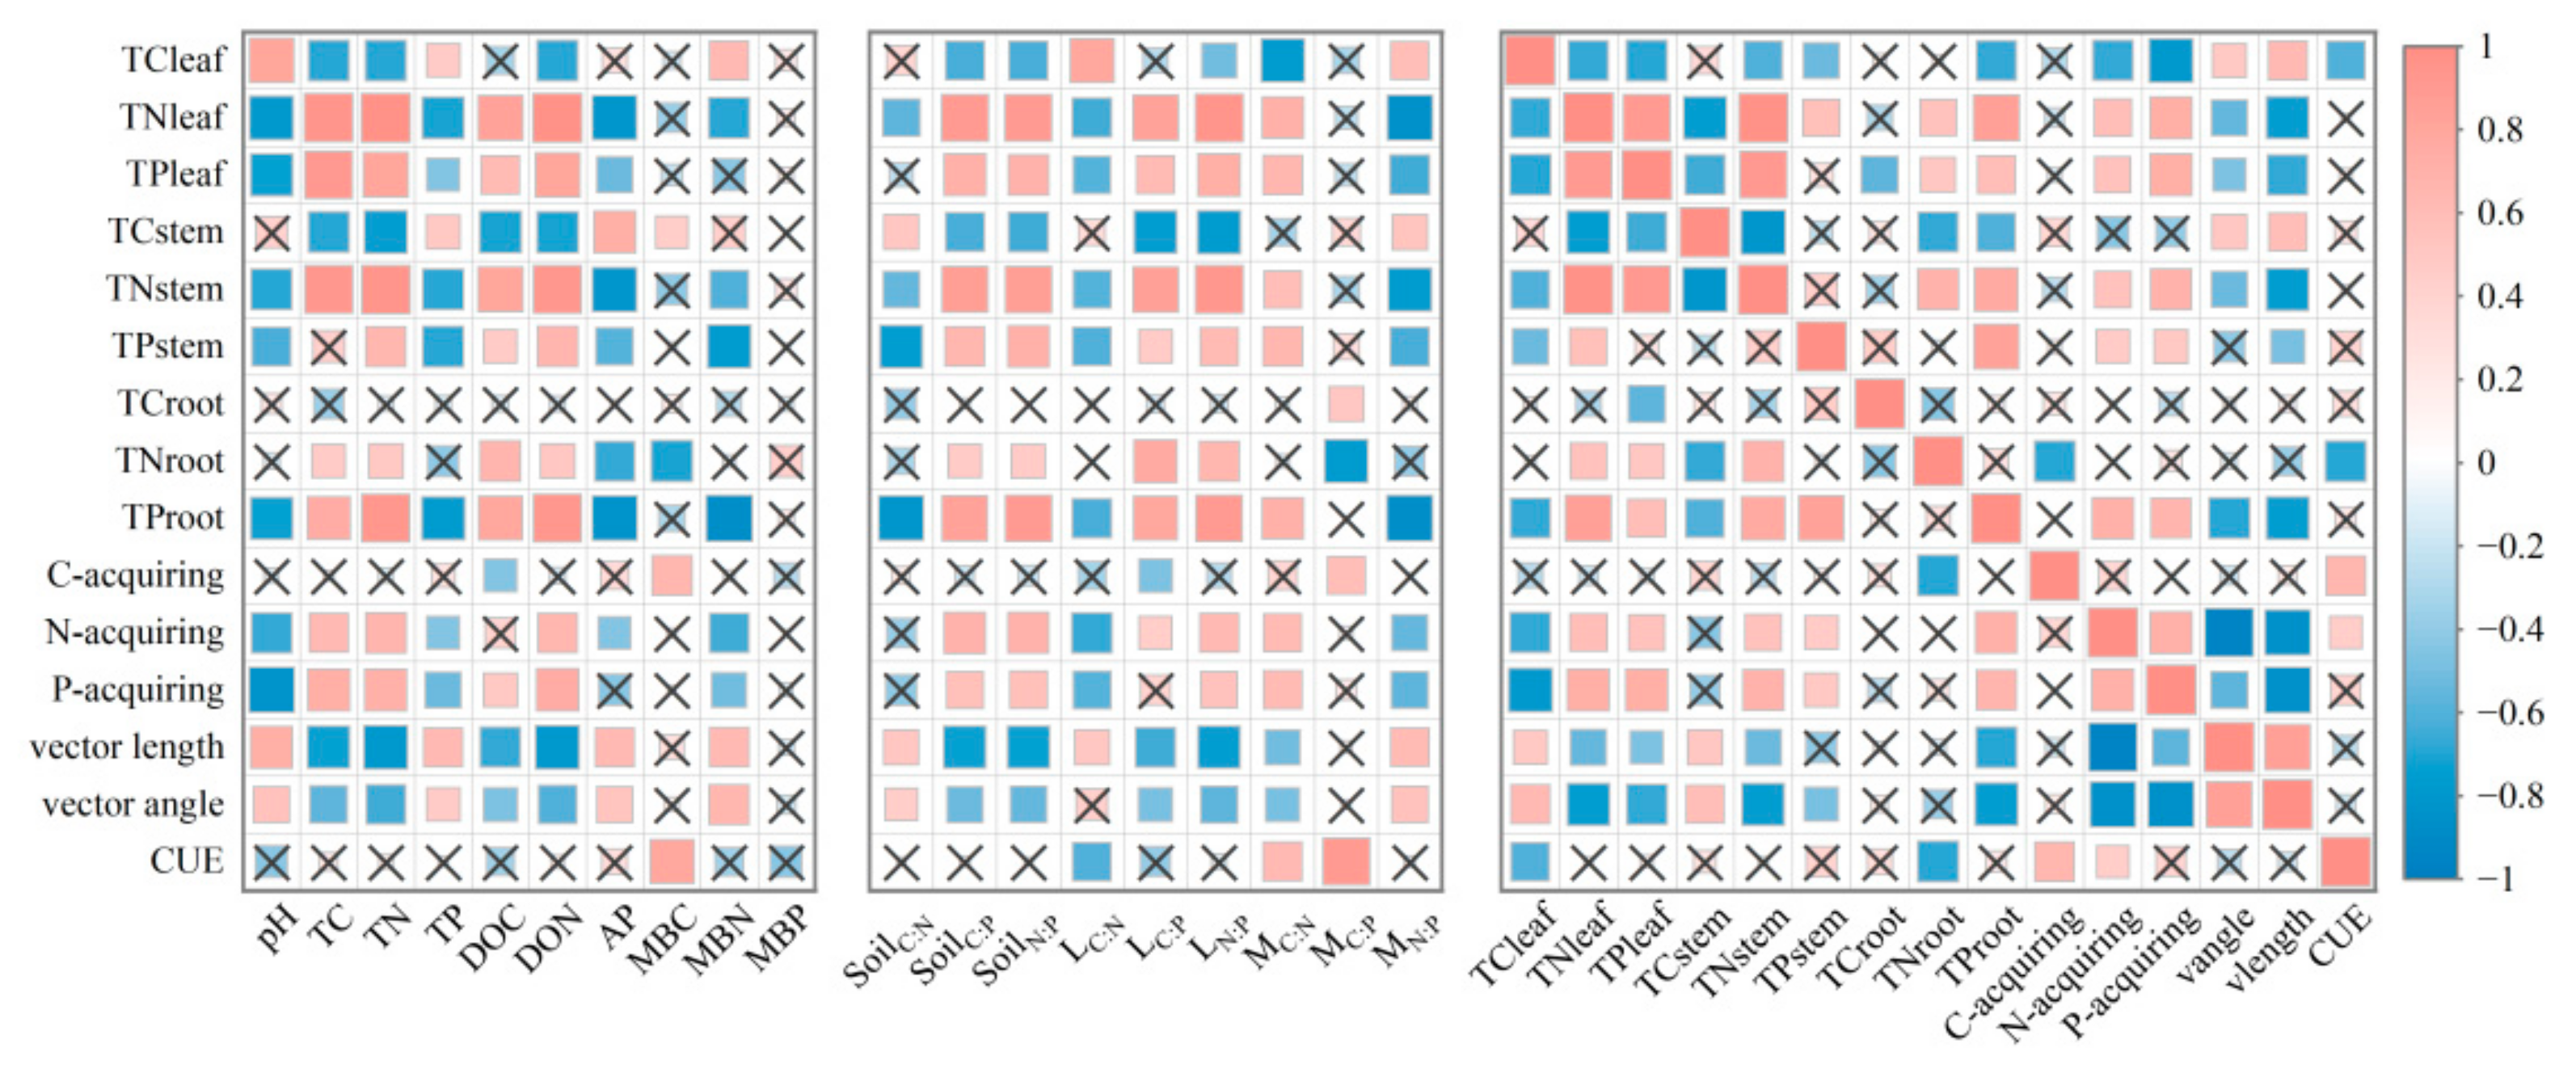
3.5. Relationship Between Soil Enzyme Activity and Chemical Properties

Soil enzyme activities for N and P acquisition were significantly and negatively correlated with pH, TP, MBN, LC:N, and MN:P (p < 0.05) and correlated positively with soil TC, TN, DON, SoilC:P, SoilN:P, LN:P, and MC:N (Figure 6). A significant (p < 0.05) negative correlation between soil C-acquiring enzyme activity and DOC and LC:P and a significant (p < 0.05) positive correlation between C-acquiring enzyme activity and CUE, MBC, and MC:P (Figure 6) were observed. The Pearson correlation between soil carbon limitation and soil chemical properties was similar to that between soil nitrogen limitation and soil chemical properties. There positive correlations were observed between soil pH, TP, AP, MBN, SoilC:N, LC:N, and MN:P with soil C and N limitation (p < 0.05). Moreover, soil TC, TN, SoilC:P, SoilN:P, DOC, DON, LC:P, LN:P, and MC:N exhibited significant (p < 0.05) negative correlations with soil C and N limitation. The nitrogen and phosphorus contents in the plant parts were significantly and positively correlated with TC, TN, DOC, and DON and negatively correlated with pH, TP, and AP (p < 0.05). In contrast, the carbon contents of plant leaves and stems exhibited positive correlations with pH, TP, and AP, and negative correlations with TC, TN, DOC, and DON. A redundancy analysis (RDA, Figure 7) indicated that environmental factors explained 93.62% of the changes in soil C and N limitation and CUE (RDA1, 58.24%; RDA2, 35.58%) and 86.71% of the changes in plant carbon, nitrogen, and phosphorus contents (RDA1, 62.43%; RDA2, 24.28%).

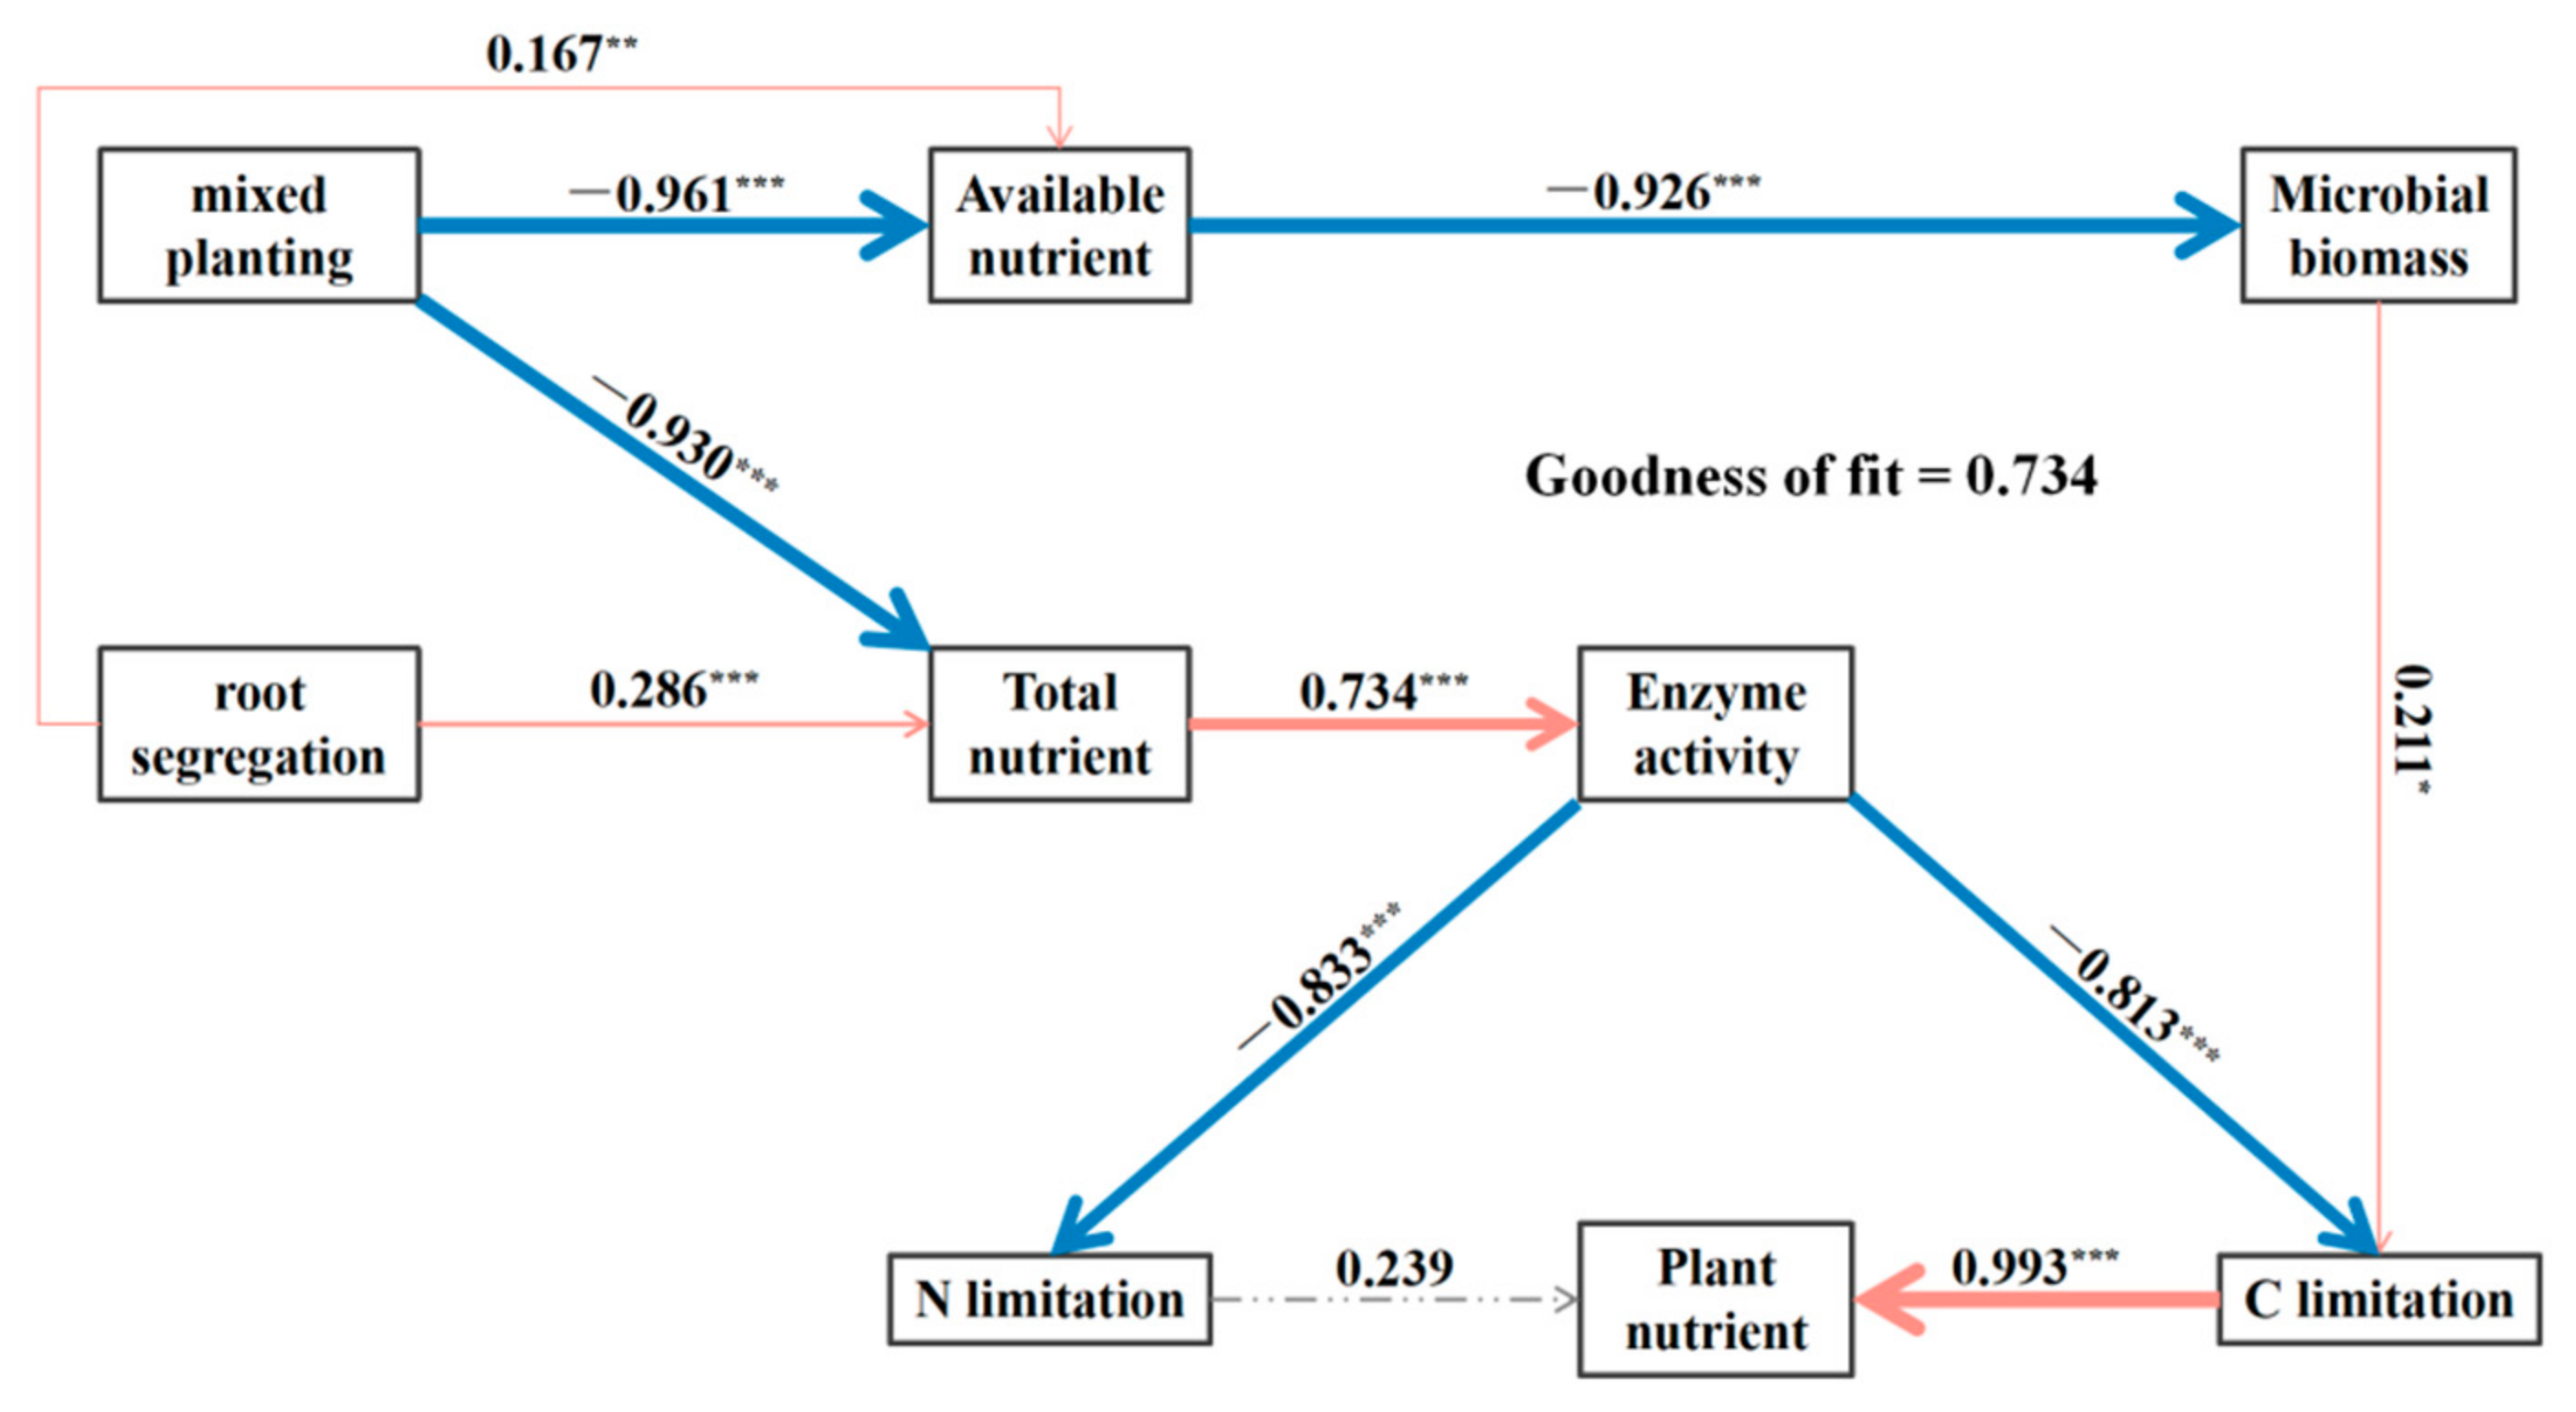
3.6. Drivers of Soil Microbial and Plant Indicators

The random forest model demonstrated that DON, LN:P, pH, SoilC:P, SoilN:P, and TN were significant (p < 0.05) factors showing microbial carbon limitation (Figure 8a). DON, MBN, and LC:P were the most crucial factors affecting microbial nitrogen limitation (Figure 8b). MC:P was the most important factor affecting CUE, with MBC, DOC, TN, and LC:P also exhibiting a significant (p < 0.05) effect. MC:N and AP had a highly significant (p < 0.01) effect on CUE (Figure 8c). Partial least squares path modeling (PLS-PM; Figure 9) revealed direct and indirect effects of mixed planting and root segregation on total soil nutrients, available nutrients, microbial variables, soil enzyme activities, microbial carbon limitation, nitrogen limitation, and plant nutrient content. Mixed planting exhibited a significant (p < 0.001) negative effect on total and available soil nutrients (path coefficients = −0.930 and −0.961), while root segregation had a positive effect on total and available soil nutrients (path coefficients = 0.286 and 0.167). Soil available nutrients directly influenced microbial biomass (path coefficient = −0.926), while soil total nutrients exerted a direct positive effect on soil enzyme activity (path coefficient = 0.734). Soil carbon limitation was directly influenced by soil microbial biomass and enzyme activity (path coefficients = 0.211 and −0.813) and had a direct positive effect on plant nutrients (path coefficient = 0.993). Soil nitrogen limitation was directly and negatively affected by enzyme activity (path coefficient = −0.833). Soil nitrogen limitation was directly and negatively affected by enzyme activity (path coefficient = −0.833).

4. Discussion

4.1. Factors Influencing Soil Chemistry, Microbial Biomass, and Enzyme Activity

Plant interactions can change soil enzyme activity and nutrient content through root interactions and secretions [27]. Here, we investigated the effects of mixed planting of Moso bamboo and Phoebe chekiangensis and physical root segregation on the soil nutrient content and enzyme activity through pot experiments. Mixed planting was the primary factor influencing the soil properties. Mixed planting significantly (p < 0.05) changed the total and available nutrient contents of the soil and their stoichiometric ratios (Figure 2). Litter, root secretions, and detritus nutrient return are the primary ways through which plants provide fresh carbon for microorganisms [40,41]. Moso bamboo has a more developed and robust root system than that of trees [42], which can explain the higher TC and DOC in the BS and BT. Nutrient changes induced by plant interactions are also regulated by competition intensity [43]. Excessive competition intensity has negative effects and counteracts increases in the soil nutrient content [44]. Excessive competition intensity may explain the significantly (p < 0.05) lower TC, TN, DON, and AP values under the BS treatment than those under the BT treatment. Differences in the stoichiometric ratios of the soluble fractions of different substrates can be reflected in the microbial community [45]. The stoichiometric ratios of microbial biomass may be altered by nutrient limitations, such as N and P [46]. In this study, the stoichiometric ratios of MBN, MBP, and MBC were less than those of microbial biomass on a global scale, as shown in [47]. This may be because of the effects of mixed planting and root segregation on soil nutrient supply, which, in turn, affects the soil microbial community.
A global meta-analysis of enzymes that acquire C, N, and P [48] showed that the global ratio of these three types of enzymes was nearly 1:1:1. In our study, EESC:N, EESC:P, and EESN:P deviated from 1. This indicates that the microbial strategies for investing in C-, N-, and P-acquiring enzymes changed with alterations in resources [49]. Microorganisms acquire resources through the secretion of enzymes. When resources are readily available, they follow the ‘economic rules’ by reducing enzyme yield [50,51]. However, under resource limitations, enzyme activities will be consistent with the availability of the corresponding resource [2,7]. Our study’s soils exhibited N and slight C limitations. A positive relationship was observed between N-acquiring enzymes and DON and a negative relationship between C-acquiring enzymes and DOC. Microorganisms increase soil nitrogen availability by increasing the secretion of nitrogen-acquiring enzymes to reduce nitrogen limitation. In this experiment, phosphorus resources were relatively abundant and easily available. Meanwhile, P-acquiring enzyme activities showed a negative correlation with TP and AP (Figure 6). Soil enzymes are nitrogen-rich compounds, and available nitrogen can enhance the synthesis and secretion of enzymes [52]. This explains the positive correlation between P-acquiring enzymes, TN, and DON.

4.2. Factors Influencing Microbial Metabolic Limitation and CUE

In the vector model, the vector lengths of MS and MT were significantly (p < 0.05) larger than those of BS and BT. This indicates that mixing had more severe carbon limitation [10]. The spatial expansion and stratification of plants above and below-ground can lead to increased competition for resources between plants [53]. As forests fix more carbon through photosynthesis, excess carbon is provided to the soil through the roots and litter [41]. In this study, the mixed Phoebe chekiangensis was located in the lower space and was strongly affected by the shadows cast by the Moso bamboo canopy. This weakened the photosynthesis of Phoebe chekiangensis, intensified resource competition, and reduced the carbon source obtained by soil microorganisms through root inputs, exacerbating the carbon limitation in the mixed pot plantation. Conversely, the exacerbation of soil carbon limitation by hybridization has not been observed in natural bamboo–broadleaf mixed forests [54]. This may also be due to the fact that potting soil only provides a very limited amount of total nutrients. In the present study, nitrogen limitation, rather than phosphorus limitation, was observed in all four treatments because the vector angles were less than 45° in all treatments. Simultaneously, we observed that the vector angles of the mixed plantings were closer to 45° than those of the pure Moso bamboo treatments. This indicates that nitrogen limitation was reduced. This may be due to greater plant diversity and increased root secretion in mixed planting, which increased nitrogen availability.
CUE reflects the microbial use of carbon [12]. In our study, the physical separation of roots was the dominant factor contributing to changes in CUE. In both the mixed and unmixed pot experiments, the MT and BT plants with physical root segregation exhibited higher CUE. A higher CUE means that less energy is allocated by organisms to respiration and more energy is available for biomass [55]. The physical segregation of roots can alleviate the intense competition between roots, allowing more nutrients to be available to soil microorganisms. Adequate mineral nutrients reduce the cost of nutrient acquisition for microbes, allowing more carbon to be allocated for growth, which manifests as a higher CUE. Soil microbial metabolic limitation and CUE were mainly affected by the soil pH, nutrient content, and stoichiometric ratios [14,56]. In the RDA, environmental factors explained 93.82% of microbial metabolic limitations and CUE. pH is a key factor influencing microbial community activity [57]. Random forest analysis has shown that pH is a key determinant of soil carbon limitation. The ratio of nitrogen to phosphorus is an important ecological stoichiometry that affects plant and microbial growth [58,59]. In our study, the LN:P ratio was an extremely important predictor of microbial C and N limitation. Carbon and nutrients are important components of microbial metabolism that directly regulate CUE [60]. Duan et al. [61] proposed that changes in the microbial community biomass and specific soil properties could explain changes in CUE. The positive relationship between microbial biomass and carbon limitation may be due to the ‘burial effect.’ Here, soil microorganisms assimilate plant residues into their biomass and regulate soil nutrient pools through the production and deposition of microbial necromass, thereby changing microbial metabolism [62,63]. A higher CUE is associated with a higher microbial product yield, which benefits soil carbon stabilization and alleviates carbon limitation [64].

4.3. Factors Driving Plant Nutrient Distribution Strategies

Plants adopt different strategies for distributing nutrients under different nutrient conditions and adjust their morphology accordingly [65]. In the present study, RDA revealed that the soil nutrient content explained 86.71% of the variation in the plant part nutrient content. Changes in the soil nutrient content are the main factor influencing the plant nutrient content. Moreover, soil TN and DON contents and plant phosphorus contents were significantly (p < 0.05) increased in the BS and BT treatments than in MT and MS. This result may be attributed to increased soil nitrogen promoting fine root growth, which enhances plants’ uptake of phosphorus [66]. This conclusion is further supported by the reduction in the soil phosphorus content under BS and BT, as well as the significant (p < 0.05) positive correlation between soil DON, TN, and plant phosphorus content. In mixed planting, P. chekiangensis occupied the lower space, reducing the competition for light with Moso bamboo leaves compared to pure Moso bamboo potted plants. Competition for sunlight forces leaves to improve their photosynthetic capacity. As N is an important component of various photosynthesis-related enzymes [67], this caused a significant (p < 0.05) increase in the leaf nitrogen content and a significant (p < 0.05) decrease in the C:N ratio in pure Moso bamboo pot plants. According to the adaptive growth hypothesis, an elevated C:N ratio in plants enhances survivability under nitrogen-limited conditions [68]. This provides a competitive advantage for MT and MS Moso bamboo with P. chekiangensis in mixed plantings. Moreover, the higher TC content of MT and MS stems reflects their stronger competitiveness. In this study, the TC content of the stem was negatively correlated with the soil N content, possibly because reduced soil N promotes lignin synthesis in Moso bamboo [69]. This may also lead to reduced carbon input from the roots to the soil, thus decreasing the soil carbon content. The partial least squares pathway model revealed that carbon limitation had a highly significant (p < 0.001) positive effect on plant nutrients. In contrast, mixed planting had an indirect negative effect on plant nutrients through soil nutrients, enzyme activities, and microorganisms. Root segregation exhibited an indirect positive effect on plant nutrients through soil nutrients, enzyme activities, and microorganisms. These findings suggest that microbial limitation is also an important environmental factor influencing plant nutrient allocation strategies.
In this experiment, we used potted plants to simulate mixed cultivation of Moso bamboo and Phoebe chekiangensis and investigated the effects on the soil and plant allocation strategies resulting from mixed planting after using mesh to limit direct contact between plant roots. This experiment provided a better simulation of the initial planting of Phoebe chekiangensis in Moso bamboo forests. However, the small space and limited soil nutrient supply of the pot are not sufficiently accurate to model mature bamboo width in mixed forests. We also lacked an investigation of soil nutrient content changes before and after the experiment. Moreover, while litter is often considered an important input of soil nutrients, its production and accumulation were lacking in this study. The actual occurrence is often more complex under real conditions. Therefore, future research on long-term bamboo–broadleaf mixed forests is important. We also recommend future research on how direct root contact affects root secretion, soil microbial community structure, and microbial necromass turnover.

5. Conclusions

In this study, mixed planting and root segregation significantly (p < 0.05) influenced most soil nutrients and enzyme activities. Mixed planting reduced soil TC, TN, DOC, and DON contents and P-acquiring enzyme activity and increased soil total and available P contents and EESC:N and EESC:N ratios. Mixed planting of Moso bamboo and Phoebe chekiangensis exacerbated soil carbon limitation but alleviated soil nitrogen limitation; root segregation contributed to microbial CUE. DON, LN:P, pH, and SoilC:P were significant (p < 0.05) predictors of soil carbon limitation, whereas DON, LC:P, LN:P, and MBN were significant (p < 0.05) predictors of soil nitrogen limitation. In addition, carbon limitation, soil total nutrient content, and mixed planting were found to be important environmental factors influencing plant nutrient allocation strategies. Our results suggest that appropriate management measures are needed to address potential carbon limitations in mixed bamboo–broadleaf forests, such as increasing carbon sources at the beginning of mixed planting. At the same time, physical root segregation is an effective way to reduce below-ground competition for plants, which provides new insights into increasing CUE. However, studies of long-term mature Moso bamboo mixed forests are needed to clarify the specific mechanisms of how mixed planting affects plant nutrient allocation strategies.

Supplementary Materials

The following supporting information can be downloaded at https://www.mdpi.com/article/10.3390/f16050722/s1, Figure S1. Soil pH and enzyme activities under different treatments. (a) soil pH, (b) β-D-cellobiosidase (CBH), (c) β-1,4-glucosidase (BG), (d) leucine aminopeptidase (LAP), (e) β-1,4-N-acetylglucosaminidase (NAG). Significant differences are indicated by different lowercase letters and error lines indicate standard deviation (n = 5, p < 0.05).

Author Contributions

Y.N.: conceptualization, investigation, visualization, and writing—original draft; J.Z.: investigation and visualization; A.W.: conceptualization and writing—review and editing; Q.W.: funding acquisition; Q.Y.: investigation; K.H.: investigation; Y.B.: writing—review and editing and funding acquisition; X.D.: funding acquisition. All authors have read and agreed to the published version of the manuscript.

Funding

This research was funded by (1) the Fundamental Research Funds of the Chinese Academy of Forestry (grant numbers CAFYBB2021MA011 and CAFYBB2023XB002), (2) the Central Finance Forest and Grass Technology Promotion Demonstration Fund Project (grant number (2024) TS17), and (3) the Key Research and Development Program of Zhejiang Province (2020C02008).

Data Availability Statement

The dataset for this study is available from the corresponding author upon reasonable request.

Conflicts of Interest

The authors declare no conflicts of interest.

References

  1. Guo, S.; Cui, L.; Xu, J.; Liu, M.; Wang, W.; Xia, A.; Zhang, Z.; Yang, Y.; Xu, X.; Cui, X. A Global Synthesis of Plant-Plant Interaction Investigations: Current Knowledge and Future Directions. Plant Soil 2025. [Google Scholar] [CrossRef]
  2. Cui, Y.; Fang, L.; Guo, X.; Wang, X.; Zhang, Y.; Li, P.; Zhang, X. Ecoenzymatic Stoichiometry and Microbial Nutrient Limitation in Rhizosphere Soil in the Arid Area of the Northern Loess Plateau, China. Soil Biol. Biochem. 2018, 116, 11–21. [Google Scholar] [CrossRef]
  3. Duan, C.; Wang, Y.; Wang, Q.; Ju, W.; Zhang, Z.; Cui, Y.; Beiyuan, J.; Fan, Q.; Wei, S.; Li, S.; et al. Microbial Metabolic Limitation of Rhizosphere under Heavy Metal Stress: Evidence from Soil Ecoenzymatic Stoichiometry. Environ. Pollut. 2022, 300, 118978. [Google Scholar] [CrossRef]
  4. Cui, Y.; Moorhead, D.L.; Wang, X.; Xu, M.; Wang, X.; Wei, X.; Zhu, Z.; Ge, T.; Peng, S.; Zhu, B.; et al. Decreasing Microbial Phosphorus Limitation Increases Soil Carbon Release. Geoderma 2022, 419, 115868. [Google Scholar] [CrossRef]
  5. Allison, S.D.; Wallenstein, M.D.; Bradford, M.A. Soil-Carbon Response to Warming Dependent on Microbial Physiology. Nat. Geosci. 2010, 3, 336–340. [Google Scholar] [CrossRef]
  6. Sinsabaugh, R.L.; Hill, B.H.; Follstad Shah, J.J. Ecoenzymatic Stoichiometry of Microbial Organic Nutrient Acquisition in Soil and Sediment. Nature 2009, 462, 795–798. [Google Scholar] [CrossRef]
  7. Kuzyakov, Y.; Xu, X. Competition between Roots and Microorganisms for Nitrogen: Mechanisms and Ecological Relevance. New Phytol. 2013, 198, 656–669. [Google Scholar] [CrossRef]
  8. Schneider, T.; Keiblinger, K.M.; Schmid, E.; Sterflinger-Gleixner, K.; Ellersdorfer, G.; Roschitzki, B.; Richter, A.; Eberl, L.; Zechmeister-Boltenstern, S.; Riedel, K. Who Is Who in Litter Decomposition? Metaproteomics Reveals Major Microbial Players and Their Biogeochemical Functions. ISME J. 2012, 6, 1749–1762. [Google Scholar] [CrossRef]
  9. Tapia-Torres, Y.; Elser, J.J.; Souza, V.; García-Oliva, F. Ecoenzymatic Stoichiometry at the Extremes: How Microbes Cope in an Ultra-Oligotrophic Desert Soil. Soil Biol. Biochem. 2015, 87, 34–42. [Google Scholar] [CrossRef]
  10. Moorhead, D.L.; Sinsabaugh, R.L.; Hill, B.H.; Weintraub, M.N. Vector Analysis of Ecoenzyme Activities Reveal Constraints on Coupled C, N and P Dynamics. Soil Biol. Biochem. 2015, 93, 1–7. [Google Scholar] [CrossRef]
  11. Chen, H.; Li, D.; Zhao, J.; Zhang, W.; Xiao, K.; Wang, K. Nitrogen Addition Aggravates Microbial Carbon Limitation: Evidence from Ecoenzymatic Stoichiometry. Geoderma 2018, 329, 61–64. [Google Scholar] [CrossRef]
  12. Wu, J.; Cheng, X.; Liu, G. Increased Soil Organic Carbon Response to Fertilization Is Associated with Increasing Microbial Carbon Use Efficiency: Data Synthesis. Soil Biol. Biochem. 2022, 171, 108731. [Google Scholar] [CrossRef]
  13. Sinsabaugh, R.L.; Turner, B.L.; Talbot, J.M.; Waring, B.G.; Powers, J.S.; Kuske, C.R.; Moorhead, D.L.; Shah, J.J.F. Stoichiometry of Microbial Carbon Use Efficiency in Soils. Ecol. Monogr. 2016, 86, 172–189. [Google Scholar] [CrossRef]
  14. Deng, L.; Peng, C.; Huang, C.; Wang, K.; Liu, Q.; Liu, Y.; Hai, X.; Shangguan, Z. Drivers of Soil Microbial Metabolic Limitation Changes along a Vegetation Restoration Gradient on the Loess Plateau, China. Geoderma 2019, 353, 188–200. [Google Scholar] [CrossRef]
  15. Rosinger, C.; Rousk, J.; Sandén, H. Can Enzymatic Stoichiometry Be Used to Determine Growth-Limiting Nutrients for Microorganisms?—A Critical Assessment in Two Subtropical Soils. Soil Biol. Biochem. 2018, 128, 115–126. [Google Scholar] [CrossRef]
  16. Carrillo, Y.; Bell, C.; Koyama, A.; Canarini, A.; Boot, C.M.; Wallenstein, M.; Pendall, E. Plant Traits, Stoichiometry and Microbes as Drivers of Decomposition in the Rhizosphere in a Temperate Grassland. J. Ecol. 2017, 105, 1750–1765. [Google Scholar] [CrossRef]
  17. Yang, Z.; Zhang, Y.; Luo, G. Regulation of Soil C–N–P Stoichiometry by Intercropping Mitigates Microbial Resource Limitations and Contributes to Maize Productivity. Plant Soil 2023, 498, 21–38. [Google Scholar] [CrossRef]
  18. Callaway, R.M. The Detection of Neighbors by Plants. Trends Ecol. Evol. 2002, 17, 104–105. [Google Scholar] [CrossRef]
  19. Jing, B.; Shi, W.; Wang, H.; Lin, F. 15N Labeling Technology Reveals Enhancement of Nitrogen Uptake and Transfer by Root Interaction in Cotton/Soybean Intercropping. J. Sci. Food Agric. 2023, 103, 6307–6316. [Google Scholar] [CrossRef]
  20. Te, X.; Din, A.M.U.; Cui, K.; Raza, M.A.; Fraz Ali, M.; Xiao, J. Inter-Specific Root Interactions and Water Use Efficiency of Maize/Soybean Relay Strip Intercropping. Field Crops Res. 2023, 291, 108793. [Google Scholar] [CrossRef]
  21. Chen, M.; Guo, L.; Ramakrishnan, M.; Fei, Z.; Vinod, K.K.; Ding, Y.; Jiao, C.; Gao, Z.; Zha, R.; Wang, C.; et al. Rapid Growth of Moso Bamboo (Phyllostachys edulis): Cellular Roadmaps, Transcriptome Dynamics, and Environmental Factors. Plant Cell 2022, 34, 3577–3610. [Google Scholar] [CrossRef] [PubMed]
  22. Qin, H.; Chen, J.; Wu, Q.; Niu, L.; Li, Y.; Liang, C.; Shen, Y.; Xu, Q. Intensive Management Decreases Soil Aggregation and Changes the Abundance and Community Compositions of Arbuscular Mycorrhizal Fungi in Moso Bamboo (Phyllostachys pubescens) Forests. For. Ecol. Manag. 2017, 400, 246–255. [Google Scholar] [CrossRef]
  23. He, H.; Gao, H.; Xue, X.; Ren, J.; Chen, X.; Niu, B. Variation of Sugar Compounds in Phoebe Chekiangensis Seeds during Natural Desiccation. PLoS ONE 2024, 19, e0299669. [Google Scholar] [CrossRef] [PubMed]
  24. Zhao, J.; Wang, B.; Yang, Z. Effects of Precious Tree Introduction into Moso Bamboo Forests on Soil Carbon and Nitrogen Pools. Forests 2022, 13, 1927. [Google Scholar] [CrossRef]
  25. Zheng, A.; Lv, J. Spatial Patterns of Bamboo Expansion across Scales: How Does Moso Bamboo Interact. with Competing Trees? Landsc. Ecol. 2023, 38, 3925–3943. [Google Scholar] [CrossRef]
  26. Wang, B.; Bi, R.; Xu, X.; Shen, H.; Zhang, Q.; Xiong, Z. General Patterns of Soil Nutrient Stoichiometry, Microbial Metabolic Limitation and Carbon Use Efficiency in Paddy and Vegetable Fields along a Climatic Transect of Eastern China. Agric. Ecosyst. Environ. 2025, 378, 109322. [Google Scholar] [CrossRef]
  27. Xiao, L.; Min, X.; Liu, G.; Li, P.; Xue, S. Effect of Plant–Plant Interactions and Drought Stress on the Response of Soil Nutrient Contents, Enzyme Activities and Microbial Metabolic Limitations. Appl. Soil Ecol. 2023, 181, 104666. [Google Scholar] [CrossRef]
  28. Kong, C.-H.; Zhang, S.-Z.; Li, Y.-H.; Xia, Z.-C.; Yang, X.-F.; Meiners, S.J.; Wang, P. Plant Neighbor Detection and Allelochemical Response Are Driven by Root-Secreted Signaling Chemicals. Nat. Commun. 2018, 9, 3867. [Google Scholar] [CrossRef]
  29. Bremner, J.M. Nitrogen-total. In Methods of Soil Analysis, Part III. Chemical Methods; SSSA Book Series No. 5; Sparks, D.L., Page, A.L., Helmke, P.A., Loeppert, R.H., Eds.; American Society of Agronomy: Madison, WI, USA, 1996; pp. 1085–1121. [Google Scholar]
  30. Brookes, P.C.; Powlson, D.S.; Jenkinson, D.S. Measurement of Microbial Biomass Phosphorus in Soil. Soil Biol. Biochem. 1982, 14, 319–329. [Google Scholar] [CrossRef]
  31. Tietz, A.; Kirschner, A.; Langergraber, G.; Sleytr, K.; Haberl, R. Characterisation of Microbial Biocoenosis in Vertical Subsurface Flow Constructed Wetlands. Sci. Total Environ. 2007, 380, 163–172. [Google Scholar] [CrossRef]
  32. Vance, E.D.; Brookes, P.C.; Jenkinson, D.S. An Extraction Method for Measuring Soil Microbial Biomass C. Soil Biol. Biochem. 1987, 19, 703–707. [Google Scholar] [CrossRef]
  33. Hedin, L.O. Global Organization of Terrestrial Plant–Nutrient Interactions. Proc. Natl. Acad. Sci. USA 2004, 101, 10849–10850. [Google Scholar] [CrossRef] [PubMed]
  34. Shen, R.; Xu, M.; Li, R.; Zhao, F.; Sheng, Q. Spatial Variability of Soil Microbial Biomass and Its Relationships with Edaphic, Vegetational and Climatic Factors in the Three-River Headwaters Region on Qinghai-Tibetan Plateau. Appl. Soil Ecol. 2015, 95, 191–203. [Google Scholar] [CrossRef]
  35. Peng, Y.; Duan, Y.; Huo, W.; Zhang, Z.; Huang, D.; Xu, M.; Wang, X.; Yang, X.; Wang, B.; Kuzyakov, Y.; et al. C:P Stoichiometric Imbalance between Soil and Microorganisms Drives Microbial Phosphorus Turnover in the Rhizosphere. Biol. Fertil. Soils 2022, 58, 421–433. [Google Scholar] [CrossRef]
  36. Zhang, S.; Pan, Y.; Zhou, Z.; Deng, J.; Zhao, F.; Guo, Y.; Han, X.; Yang, G.; Feng, Y.; Ren, G.; et al. Resource Limitation and Modeled Microbial Metabolism along an Elevation Gradient. Catena 2021, 209, 105807. [Google Scholar] [CrossRef]
  37. Liu, D.; Liu, Y.; Li, J.; Mo, Q.; Tang, J.; Liu, W.; Batyrbek, M.; Liu, T.; Zhang, X.; Han, Q. Shaping the Succession Patterns of Different Soil Nutrients, Enzyme Stoichiometry, and Microbial Communities through Rotation Systems. Catena 2023, 236, 107740. [Google Scholar] [CrossRef]
  38. Yu, J.; Bing, H.; Chang, R.; Cui, Y.; Shen, G.; Wang, X.; Zhang, S.; Fang, L. Microbial Metabolic Limitation Response to Experimental Warming along an Altitudinal Gradient in Alpine Grasslands, Eastern Tibetan Plateau. Catena 2022, 214, 106243. [Google Scholar] [CrossRef]
  39. Sinsabaugh, R.L.; Shah, J.J.F. Ecoenzymatic Stoichiometry and Ecological Theory. Annu. Rev. Ecol. Evol. Syst. 2012, 43, 313–343. [Google Scholar] [CrossRef]
  40. Castellano, M.J.; Mueller, K.E.; Olk, D.C.; Sawyer, J.E.; Six, J. Integrating Plant Litter Quality, Soil Organic Matter Stabilization, and the Carbon Saturation Concept. Glob. Change Biol. 2015, 21, 3200–3209. [Google Scholar] [CrossRef]
  41. Yang, L.; Gu, J.; Yang, Y.; Yang, Y.; Shan, C.; Shen, F. The Effects of Postfire Regeneration Patterns on Soil Microbial Metabolic Limitation Based on Eco-Enzyme Stoichiometry in the Boreal Forest of China. For. Ecol. Manag. 2024, 568, 122129. [Google Scholar] [CrossRef]
  42. Bian, F.; Zhong, Z.; Zhang, X.; Yang, C.; Gai, X. Bamboo—An Untapped Plant Resource for the Phytoremediation of Heavy Metal Contaminated Soils. Chemosphere 2019, 246, 125750. [Google Scholar] [CrossRef] [PubMed]
  43. Zhou, Z.; Wang, C.; Jin, Y.; Sun, Z. Impacts of Thinning on Soil Carbon and Nutrients and Related Extracellular Enzymes in a Larch Plantation. For. Ecol. Manag. 2019, 450, 117523. [Google Scholar] [CrossRef]
  44. Li, J.; Zhou, L.; Lin, W. Calla Lily Intercropping in Rubber Tree Plantations Changes the Nutrient Content, Microbial Abundance, and Enzyme Activity of Both Rhizosphere and Non-Rhizosphere Soil and Calla Lily Growth. Ind. Crops Prod. 2019, 132, 344–351. [Google Scholar] [CrossRef]
  45. Gulis, V.; Kuehn, K.A.; Schoettle, L.N.; Leach, D.; Benstead, J.P.; Rosemond, A.D. Changes in Nutrient Stoichiometry, Elemental Homeostasis and Growth Rate of Aquatic Litter-Associated Fungi in Response to Inorganic Nutrient Supply. ISME J. 2017, 11, 2729–2739. [Google Scholar] [CrossRef]
  46. Fanin, N.; Fromin, N.; Buatois, B.; Hättenschwiler, S. An Experimental Test of the Hypothesis of Non-homeostatic Consumer Stoichiometry in a Plant Litter–Microbe System. Ecol. Lett. 2013, 16, 764–772. [Google Scholar] [CrossRef]
  47. Gao, D.; Bai, E.; Wang, S.; Zong, S.; Liu, Z.; Fan, X.; Zhao, C.; Hagedorn, F. Three-dimensional Mapping of Carbon, Nitrogen, and Phosphorus in Soil Microbial Biomass and Their Stoichiometry at the Global Scale. Glob. Change Biol. 2022, 28, 6728–6740. [Google Scholar] [CrossRef]
  48. Sinsabaugh, R.L.; Lauber, C.L.; Weintraub, M.N.; Ahmed, B.; Allison, S.D.; Crenshaw, C.; Contosta, A.R.; Cusack, D.; Frey, S.; Gallo, M.E.; et al. Stoichiometry of Soil Enzyme Activity at Global Scale. Ecol. Lett. 2008, 11, 1252–1264. [Google Scholar] [CrossRef]
  49. Gai, X.; Zhong, Z.; Zhang, X.; Bian, F.; Yang, C. Effects of Chicken Farming on Soil Organic Carbon Fractions and Fungal Communities in a Lei Bamboo (Phyllostachys Praecox) Forest in Subtropical China. For. Ecol. Manag. 2020, 479, 118603. [Google Scholar] [CrossRef]
  50. Spohn, M.; Pötsch, E.M.; Eichorst, S.A.; Woebken, D.; Wanek, W.; Richter, A. Soil Microbial Carbon Use Efficiency and Biomass Turnover in a Long-Term Fertilization Experiment in a Temperate Grassland. Soil Biol. Biochem. 2016, 97, 168–175. [Google Scholar] [CrossRef]
  51. Allison, S.D.; Vitousek, P.M. Responses of Extracellular Enzymes to Simple and Complex Nutrient Inputs. Soil Biol. Biochem. 2005, 37, 937–944. [Google Scholar] [CrossRef]
  52. Keeler, B.L.; Hobbie, S.E.; Kellogg, L.E. Effects of Long-Term Nitrogen Addition on Microbial Enzyme Activity in Eight Forested and Grassland Sites: Implications for Litter and Soil Organic Matter Decomposition. Ecosystems 2008, 12, 1–15. [Google Scholar] [CrossRef]
  53. Binkley, D.; Stape, J.L.; Bauerle, W.L.; Ryan, M.G. Explaining Growth of Individual Trees: Light Interception and Efficiency of Light Use by Eucalyptus at Four Sites in Brazil. For. Ecol. Manag. 2009, 259, 1704–1713. [Google Scholar] [CrossRef]
  54. Zhao, Y.; Liang, C.; Shao, S.; Chen, J.; Qin, H.; Xu, Q. Linkages of Litter and Soil C:N:P Stoichiometry with Soil Microbial Resource Limitation and Community Structure in a Subtropical Broadleaf Forest Invaded by Moso Bamboo. Plant Soil 2021, 465, 473–490. [Google Scholar] [CrossRef]
  55. Manzoni, S.; Taylor, P.; Richter, A.; Porporato, A.; Ågren, G.I. Environmental and Stoichiometric Controls on Microbial Carbon-use Efficiency in Soils. New Phytol. 2012, 196, 79–91. [Google Scholar] [CrossRef]
  56. Chen, H.; Zheng, M.; Mao, Q.; Xiao, K.; Wang, K.; Li, D. Cropland Conversion Changes the Status of Microbial Resource Limitation in Degraded Karst Soil. Geoderma 2019, 352, 197–203. [Google Scholar] [CrossRef]
  57. Nicol, G.W.; Leininger, S.; Schleper, C.; Prosser, J.I. The Influence of Soil pH on the Diversity, Abundance and Transcriptional Activity of Ammonia Oxidizing Archaea and Bacteria. Environ. Microbiol. 2008, 10, 2966–2978. [Google Scholar] [CrossRef]
  58. Zechmeister-Boltenstern, S.; Keiblinger, K.M.; Mooshammer, M.; Peñuelas, J.; Richter, A.; Sardans, J.; Wanek, W. The Application of Ecological Stoichiometry to Plant–Microbial–Soil Organic Matter Transformations. Ecol. Monogr. 2015, 85, 133–155. [Google Scholar] [CrossRef]
  59. Zhang, Z.; Zhao, Y.; Li, Z.; Wang, H.; Li, Z.; Chen, Y.; Li, B.L. Vegetation Drives Soil Microbial Metabolic Limitation through Modifications of Soil Properties and Microbial Biomass during Desert Grassland-Shrubland State Anthropogenic Transition. Appl. Soil Ecol. 2024, 202, 105609. [Google Scholar] [CrossRef]
  60. Cui, Y.; Hu, J.; Peng, S.; Delgado-Baquerizo, M.; Moorhead, D.L.; Sinsabaugh, R.L.; Xu, X.; Geyer, K.M.; Fang, L.; Smith, P.; et al. Limiting Resources Define the Global Pattern of Soil Microbial Carbon Use Efficiency. Adv. Sci. 2024, 11, 2308176. [Google Scholar] [CrossRef]
  61. Duan, P.; Fu, R.; Nottingham, A.T.; Domeignoz-Horta, L.A.; Yang, X.; Du, H.; Wang, K.; Li, D. Tree Species Diversity Increases Soil Microbial Carbon Use Efficiency in a Subtropical Forest. Glob. Change Biol. 2023, 29, 7131–7144. [Google Scholar] [CrossRef]
  62. Liang, C.; Schimel, J.P.; Jastrow, J.D. The Importance of Anabolism in Microbial Control over Soil Carbon Storage. Nat. Microbiol. 2017, 2. [Google Scholar] [CrossRef] [PubMed]
  63. Cai, M.; Zhang, Y.; Zhao, G.; Zhao, B.; Cong, N.; Zhu, J.; Zheng, Z.; Wu, W.; Duan, X. Excessive Climate Warming Exacerbates Nitrogen Limitation on Microbial Metabolism in an Alpine Meadow of the Tibetan Plateau: Evidence from Soil Ecoenzymatic Stoichiometry. Sci. Total Environ. 2024, 930, 172731. [Google Scholar] [CrossRef]
  64. Malik, A.A.; Puissant, J.; Goodall, T.; Allison, S.D.; Griffiths, R.I. Soil Microbial Communities with Greater Investment in Resource Acquisition Have Lower Growth Yield. Soil Biol. Biochem. 2019, 132, 36–39. [Google Scholar] [CrossRef]
  65. Wang, R.; Lu, J.; Jiang, Y.; Dijkstra, F.A. Carbon Efficiency for Nutrient Acquisition (CENA) by Plants: Role of Nutrient Availability and Microbial Symbionts. Plant Soil 2022, 476, 289–300. [Google Scholar] [CrossRef]
  66. Wang, R.; Cavagnaro, T.R.; Jiang, Y.; Keitel, C.; Dijkstra, F.A. Carbon Allocation to the Rhizosphere Is Affected by Drought and Nitrogen Addition. J. Ecol. 2021, 109, 3699–3709. [Google Scholar] [CrossRef]
  67. Dong, N.; Prentice, I.C.; Wright, I.J.; Wang, H.; Atkin, O.K.; Bloomfield, K.J.; Domingues, T.F.; Gleason, S.M.; Maire, V.; Onoda, Y.; et al. Leaf Nitrogen from the Perspective of Optimal Plant Function. J. Ecol. 2022, 110, 2585–2602. [Google Scholar] [CrossRef]
  68. Zhang, J.; He, N.; Liu, C.; Xu, L.; Chen, Z.; Li, Y.; Wang, R.; Yu, G.; Sun, W.; Xiao, C.; et al. Variation and Evolution of C:N Ratio among Different Organs Enable Plants to Adapt to N-limited Environments. Glob. Chang. Biol. 2020, 26, 2534–2543. [Google Scholar] [CrossRef]
  69. Peng, Q.; Shrestha, A.; Zhang, Y.; Fan, J.; Yu, F.; Wang, G. How Lignin Biosynthesis Responds to Nitrogen in Plants: A Scoping Review. Plant Biol. J. 2024, 26, 881–895. [Google Scholar] [CrossRef]
Figure 1. Schematic diagram of potted plant arrangement.
Forests 16 00722 g001
Figure 2. Total soil nutrients (a) and their stoichiometric ratios (d), available nutrients (b) and their stoichiometric ratios (e), and soil microbial biomass (c) and their stoichiometric ratios (f) under different treatments. (a) Total carbon (TC), total nitrogen (TN), and total phosphorus (TP); (b) dissolved organic carbon (DOC), dissolved organic nitrogen (DON), and available phosphorus (AP); (c) microbial biomass carbon (MBC), microbial biomass nitrogen (MBN), and microbial biomass phosphorus (MBP); (d) TC:TN (SoilC:N), TC:TP (SoilC:P), and TN:TP (SoilN:P); (e) DOC:DON (LC:N), DOC:AP (LC:P), and DON:AP (LN:P); (f) MBC:MBN (MC:N), MBC:MBP (MC:P), and MBN:MBP (MN:P). Significant differences are indicated by different lowercase letters, and error lines indicate the standard deviation (n = 5, p < 0.05).
Forests 16 00722 g002
Figure 3. Soil enzyme activities (a,b,c) and their stoichiometric ratios (d,e,f) under different treatments. (a) BG + CBH (C-acquiring), (b) LAP + NAG (N-acquiring), and (c) ACP (P-acquiring). (d) EESC:N: ln(BG + CBH) vs. ln(LAP + NAG), (e) EESC:P: ln(BG + CBH) vs. ln(ACP), and (f) EESN:P: ln(LAP + NAG) vs. ln(ACP). Significant differences are indicated by different lowercase letters, and error lines indicate standard deviation (n = 5, p < 0.05).
Forests 16 00722 g003
Figure 4. Carbon content (a), nitrogen content (b), phosphorus content (c), C:N ratio (d), C:P ratio (e), and N:P ratio (f) in different organs of plants. Significant differences are indicated by different lowercase letters, and error lines indicate standard deviation (n = 5, p < 0.05).
Forests 16 00722 g004
Figure 5. Vector length (a) and angle (b); soil microbial carbon use efficiency (c); relationship between microbial carbon limitation and nitrogen limitation (d). CUE indicates soil microbial carbon use efficiency. Significant differences are indicated by different lowercase letters, and error lines indicate standard deviation (n = 5, p < 0.05).
Forests 16 00722 g005
Figure 6. Pearson correlation analysis between various soil and plant indicators. A cross indicates not significant (p > 0.05).
Forests 16 00722 g006
Figure 7. (a) Redundancy analysis of soil carbon and nitrogen limitation and microbial carbon use efficiency with soil chemical properties and microbial variables as limiting factors. (b) Redundancy analysis of plant carbon, nitrogen, and phosphorus contents with soil chemical properties and microbial variables as limiting factors.
Forests 16 00722 g007
Figure 8. Random forest analysis reveals the relative contribution of soil environmental factors in determining soil carbon limitation (a), nitrogen limitation (b), and microbial carbon use efficiency (c). Vector length and vector angle indicate carbon and nitrogen limitation, respectively. *, p < 0.05; **, p < 0.01. %IncMSE: percentage increase in mean square error.
Forests 16 00722 g008
Figure 9. Partial least squares pathway model (PLS-PM) showing possible pathways for mixed planting and root segregation to influence soil total nutrients, available nutrients and microbial biomass, microbial C limitation, N limitation, and plant nutrient content. Red lines indicate positive effects, blue lines indicate negative effects; and gray line indicates no significant effects; values are standardized pathway coefficients. *, p < 0.05; **, p < 0.01; and ***, p < 0.001. Line width is positively related to pathway coefficients. Goodness of fit was 0.734. Total nutrients: soil TC, TN, and TP; available nutrients: DOC, DON, and AP; microbial biomass: MBC, MBN, and MBP; N limitation: vector angle; C limitation: vector length; enzyme activity: C-acquiring, N-acquiring, and P-acquiring; plant nutrient: TCleaf, TCstem, TCroot, TNleaf, TNstem, TNroot, TPleaf, TPstem, and TProot.
Forests 16 00722 g009
Disclaimer/Publisher’s Note: The statements, opinions and data contained in all publications are solely those of the individual author(s) and contributor(s) and not of MDPI and/or the editor(s). MDPI and/or the editor(s) disclaim responsibility for any injury to people or property resulting from any ideas, methods, instructions or products referred to in the content.

