Abstract
Four mechanical models were proposed to derive formulas predicting the bending moment capacities of layered particleboard under simply supported center-loading. Experimental validation confirmed these models are effective tools for describing the bending moment development process, including proportional limit, yield, and ultimate points. With predicted and experimental ratios ranging from 0.88 to 1.04, Model 4 can reasonably predict the ultimate bending moment capacity of elastic–plastic and bi-modular-layered particleboard materials. Photo-elastic testing revealed neutral axis shifting toward the compressive side, resulting from the face layer’s significantly higher mean modulus of elasticity in compression than in tension. Additionally, the core material above the centerline of PB thickness contributed to tensile resistance. The proposed mechanical models require inputs such as the tensile and compressive strengths and thickness of each layer, accounting for the asymmetric strength profile and neutral axis shifting. The main conclusion was that the bending moment resistance of the particleboard depends on the combined effect of tensile and compressive strengths of all layers. A 3D plot visualized the PB’s mechanical design space, displaying feasible tensile–compressive strength combinations of particleboard layers. This enables determination of optimal strength properties for each layer. For M2 grade particleboard, the most cost-effective design occurred when the face layer reached a 5.38 MPa tensile strength, with the compressive strength ranging between 13.00 and 18.59 MPa.
1. Introduction
Particleboard (PB) is a wood-based panel composite made in layers from wood particles of various sizes, pressed together with adhesive under specific temperatures and pressures. Numerous studies have emphasized that the density profile is the key factor controlling PB bending properties [1,2,3]. For example, the bending properties were found to benefit from the high-density surface layer and increase linearly with peak density. The density of the outer core layer and wood particles size were also found to enhance the modulus of rupture (MOR) of commercial PBs [4]. However, the maximum bending MOE does not occur when the peak density is at the board surface [5]. Additionally, the effectiveness of this improvement decreases gradually at a higher peak density [6]. There have been limited explanations for the complexity between mechanical properties and density profiles: why do the highest mechanical properties not occur in high-density face layers and why there is still a large variation in the bending strength of PB despite the average panel density and density profile being well-controlled? How does the face-to-core ratio impact on mechanical properties? Current understanding shows the density profile pattern cannot fully explain the bending properties. The strength development process and strength distribution of PB under simply supported center-loading should be studied.
The strength of PB products is commonly evaluated using the simply supported center-loading bending test because of its simplicity. Modulus of rupture (MOR) is one of the most commonly used measurements to quantify the bending strength of a wood-based composite such as PB materials. The MOR of a test PB is calculated using the following flexure formula: MOR = M × c/I, where M is the ultimate bending moment of a test PB strip recorded during the test, c is the distance from the neutral surface to the outermost surface of a test PB strip, and I is the moment of inertia of a test PB strip. This calculation assumes that the material in the bending test is homogeneous, linear elastic, and free from defects. Furthermore, it assumes that flexure stresses at its cross-section vary linearly with the distance from the neutral axis, and that the neutral axis is located at the middle of the cross-section of a test strip. Therefore, to satisfy the equilibrium equations, the pure tensile strength measured directly should be equal to the bending normal strength that is calculated from the flexure formula [7].
However, ductile composites such as PB materials behave in a nonlinear elastic–plastic manner under bending, indicating that the primary assumption of the flexure formula—a linear stress distribution—is invalid. The calculated MOR value is a nominal failure stress, i.e., an apparent or fictitious maximum stress occurring at the outermost particles of a test beam-like material, rather than the real ultimate stress at the outermost particles [8]. This invalidation has been found for two reasons. Generally, medium- to high-density particle and fiber composites exhibit a higher compressive modulus of elasticity (MOE) and ultimate strength compared to their tensile MOE and ultimate strength [9]. In addition, PB materials exhibit nonlinear stress–strain relationships on tensile and compressive sides [10]. The presence of bi-stress and nonlinear stress–strain conditions will result in a nonlinear stress distribution at a PB cross-section when subjected to a bending moment up to its ultimate value, resulting in the neutral axis shifting to the compression side, which causes the tested PB strip to fail suddenly in tension rather than in compression [11,12].
Mechanics models have primarily been created for modeling bending strength distributions of sawn timber. The ultimate strength of sawn timber (Figure 1a) is higher in tension than in compression [13,14]. The stress–strain relationship of sawn timber is linear in tension, whereas it behaves nonlinearly in compression, showing a decreasing trend after reaching its ultimate value. The differing mechanical response in tension and compression of sawn timber causes the neutral axis to shift toward the tensile side of the timber. In contrast, the ultimate tensile strength of PB materials is significantly lower than that of compressive strength (Figure 1b) [15,16].
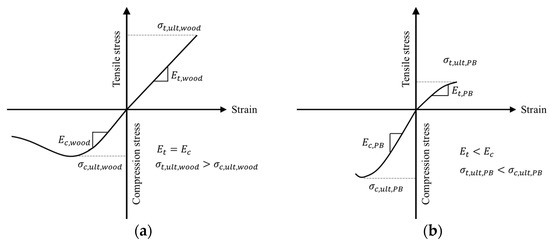
Figure 1.
The general configurations of stress–strain relationship of (a) solid wood timber and (b) PBs, where
is tensile stress, is compressive stress, is tensile modulus, and is compressive modulus.
Zaw et al. summarized the existing mechanics models for deriving the flexure formulas of timber beams [17]. These models assumed that the material’s MOE is the same for both the tensile and compressive sides, and they considered a linear stress–strain relationship with a triangular stress distribution pattern on the tensile side in all analytical models. The simplified stress distributions representing various plastic behaviors on the compression side of timber beams included a rectangular stress distribution from the compression edge to a depth where the stress immediately increased to its ultimate compressive stress [18]; a stress distribution with a second-degree parabolic shape stress distribution [13]; a linear increase from the compression edge to a depth where the stress immediately increased to its ultimate compressive stress [14,19]; and a rectangular stress distribution from the compression edge to a depth where the ultimate compressive stress started with a trapezoidal shaped distribution [20]. These mechanics models are not suitable for deriving the flexure formula of layered PB materials because the stress distribution behaviors differ between timber and PB materials when subjected to bending moments, but the approach of developing a mechanics model for deriving the flexure formula offers a methodology for PB materials.
Therefore, the main objective of this study was to develop mechanics models for derivation of formulas predicting the true bending strength of layered PB materials relative to their moment resistance capacity. These models are based on tensile and compressive properties of each layer of layered PB materials when the materials are subjected to a simply supported center-loading. Identifying the true strength of PB materials, in terms of tensile strength of the layers that compose the PB, can provide clarity and effectively help manufacturers identify process issues. The specific objectives were to (1) evaluate tensile and compressive properties of each layer of layered PB materials; (2) investigate the stress–strain behavior of outermost layers of layered PB materials under bending using the strain-gauge measuring method; (3) observe how the neutral axis of a PB strip shifts when subjected to bending moments using the photo-stress method; (4) propose analytical mechanics models and derive formulas for predicting true bending moment capacities that are directly related to the true strengths of each of layers that compose the layered PB materials; and (5) validate these proposed mechanics models experimentally.
2. Materials and Methods
2.1. Materials
In this study, five full-sized, M2 grade PB panels were used [21]. Typically, PB has a three-layer structure. During manufacturing, both the core layer and face layers are formed using two spreaders to ensure uniform particle distribution. Nevertheless, due to factors such as mechanical wear and adhesive precure, the mechanical properties of the layers of PB are asymmetrical. Therefore, this study treats PB as a four-layer structure, with two face layers and two core layers.
The full-size panel, made from Southern Pine, had its normal dimensions of 2489 mm in length, 1245 mm in width, and 20.9 mm in thickness. Each face layer was 4.1 mm thick, and each core layer was 6.35 mm thick. All PB panels were provided by Roseburg Forest Products Company Inc., Taylorsville, MS, USA. All five PB panels were fabricated with urea formaldehyde resin and had a nominal mean density of 775 kg/m3 at a mean moisture content of 7%. In addition, all panels were produced using a 12-opening batch hot-press. Each of five PB panels was randomly selected from the ninth opening of hot-press loads’ runs during the day shift. The surface of the panel that contacted the top hot plate of the press was defined as the PB top face, and the surface that contacted the bottom hot plate was designated as the PB bottom face.
2.2. Experimental Design
2.2.1. Bending
Figure 2 illustrates the cutting pattern, showing the locations from which all test PB strips were cut (ASTM D 1037, 2020 [22]). These strips were cut to dimensions of 508 mm in length and 76.2 mm in width. The strips cut with their lengths oriented along the width of a full-size panel were coded as W#-#-#, and those cut along machine direction (length direction) of the panel were coded as L#-#-#. In both coding systems, the first number # represented the sequence number of the panel selected, the second number # indicated the strip set, and the third number # denoted the replicate within that set. Nine strips in each of the two panel directions, width and length, were cut from each of five full-size PB panels. Three consecutive strips were grouped together as one set, for example, L#-3-1, L#-3-2, and L#-3-3 for a panel with the sequence number #, under the assumption that these three replicates shared similar physical and mechanical properties. Consequently, a total of ninety bending strips, comprising thirty sets, were prepared.

Figure 2.
Cutting pattern showing where particleboard bending strips were cut from a full-size panel.
Five strips coded as W#-3-3 were selected from each of five full-size panels, and a simply supported center-loading setup was designed for developing mechanics models to predict the bending moment capacity of layered PB (Figure 3a). A photo-elastic coating strip was used to monitor the shifting of the neutral axis during the entire loading process. Two strain gauges were mounted on the top and bottom surfaces of each test PB strip to measured tensile and compressive strains throughout the loading process.
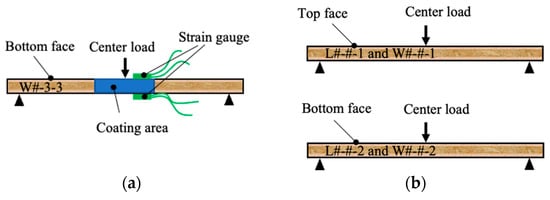
Figure 3.
Diagrams illustrate simply supported center-loading conditions designed for the (a) development and (b) validation of the proposed mechanics models.
For the validation of mechanics model, bending tests were conducted by using a complete 2 × 2 factorial experiment design, considering two factors that affect the ultimate bending moment of PB. The factors included the center-loading direction (top or bottom face of a test strip) and strip orientation (lengthwise along the panel’s width or crosswise along the panel’s length). Fifteen replicates were evaluated for each of four combinations. Specifically, in the combination of center-loading applied to the top face, three replicates coded with L#-#-1 and three replicates coded with W#-#-1 were selected from a full-size panel (Figure 3b top). The same selection method (three replicates coded with L#-#-2 and three replicates coded with W#-#-2) was used for the combination with center-loading applied to the bottom face (Figure 3b bottom). Therefore, a total of 60 replicates were evaluated.
2.2.2. Pure Tension and Compression
Five rectangular strips, each measuring 152.4 mm long by 25.4 mm wide (Figure 4a), were first cut off from the unbroken ends of strips used in the mechanics model development group, while sixty other rectangular strips were cut from those used in the validation group. After slicing the strips into four layers along their length direction, the layers were labeled as layer 1, layer 2, layer 3, and layer 4, in the order from the tensile side to the compression side when subjected to the center-loading in bending (Figure 4b). Approximately 1.1 mm of material was lost due to the band saw kerf. Layers 1 and 4 had an average thickness of 3.9 mm, while layer 3 averaged 4.8 mm in thickness and layer 2 averaged 5.0 mm in thickness. Layers 1 and 2 were 152.4 mm long by 25.4 mm wide with their corresponding thickness, whereas layers 3 and 4 were 50.8 mm long by 25.4 mm wide with their respective thickness. Therefore, five replicates were tested for each combination of face layer and stress type during the mechanics model development group (Figure 4c, top), and 60 replicates were tested for each combination of face and core layers and stress type during the mechanics model validation group (Figure 4c bottom). In model development tests, layer 1 for the tensile test and layer 4 for the compressive test were affixed with a strain gauge to measure the pure tensile and compressive strains, respectively.
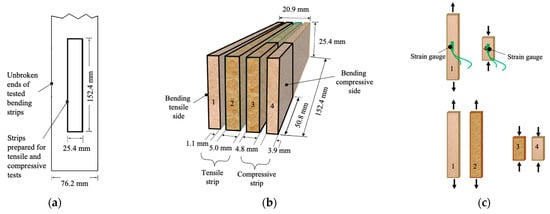
Figure 4.
(a) The process of cutting pure tensile and compressive testing strips from the unbroken end of a previously tested bending strip. (b) The strips then sliced into four layers and (c) subsequently tested in tension and compression.
2.2.3. Density and Strength Profile
Thirty density profile blocks, each measuring 50.8 mm in length and 50.8 mm in width, and twenty-seven tension profile specimens, each measuring 152.4 mm in length and 25.4 mm in width, were cut from the unbroken ends of strips used in the mechanics model validation group. The tension profile specimens were sliced into seven layers along their length, followed the cutting method as the pure tensile test in the validation group (Figure 4b). The cut layered strips were labeled from layer 1 to layer 7, ordered from the tensile side to the compression side (as subjected to bending). Layers 1, 2, 3, 5, 6, and 7 were fixed at thickness of 2.0 mm, while layer 4’s thickness varied depending on the overall sample thickness.
2.3. Testing
Prior to testing, all strips were conditioned in an environmental humidity chamber, with the chamber’s temperature maintained at 20 °C ± 2 °C and relative humidity at 50 ± 5% for 40 h. All bending, tensile, and compressive tests were then conducted in accordance with ASTM D1037 2020 [22] using an Instron series 5566 universal testing machine (Instron Corporation, Norwood, MA, USA).
2.3.1. Bending
The bending load was applied to the midpoint of a 457.2 mm span with a speed of 0.15 mm/s. The shift in the neutral axis on the lateral section of each test PB strip was observed using the photo-elastic method through a Basic Reflection Polariscope (Model 031, Vishay Measurements Group, Raleigh, NC, USA) (Figure 5a). A photo-elastic measuring sheet, 127 mm long by 20.6 mm wide (PS-1 flat sheets, Vishay Measurements Group, Raleigh, NC, USA), was centered and glued to the lateral section of each of the five testing PB strips (Figure 5b) using PC-10 adhesive (Vishay Measurements Group, Raleigh, NC, USA). The Polariscope was set up with the polarizer/analyzer axes aligned with the principal axes of each PB strip. The compensator ring was set at zero and the neutral axis shifting was recorded using a video camera. The strain gauges (KFGS-5-350-C1-11, KYOWA Americans Inc., Novi, MI, USA) were mounted in pairs on the top and bottom of each of five strips using CC-35 adhesive (KYOWA Americans Inc., Novi, MI, USA) in the model development group. Each of the strain gauges was placed with its center 12.7 mm away from the midpoint of a test PB strip (Figure 5c). The tensile and compressive strains at the surfaces were recorded using the LabVIEW software (version 2018) (National Instruments, Austin, TX, USA).
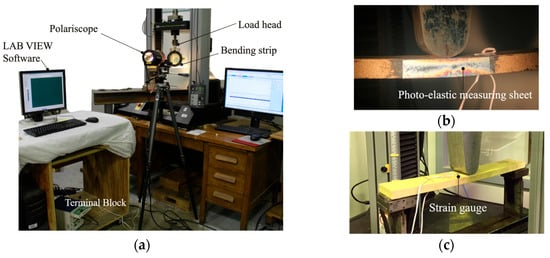
Figure 5.
Photos show (a) the overall appearance of test setup for evaluating neutral axis shifting using photo-coating method and for measuring surface strain of a test particleboard strip under simply supported center-loading in bending; (b) details of a photo-elastic measuring sheet attached to the side of the test strip; and (c) two strain gauges mounted on the top and bottom surfaces of the test strip.
2.3.2. Pure Tension and Compression
Figure 6 shows the setups for performing tensile and compressive tests in the model development group (Figure 6a,b) and the validation group (Figure 6c,d), respectively. The loading speed for the tensile tests was 0.06 mm/s, and for the compressive tests, it was 0.009 mm/s. A strain gauge (KFGS-5-350-C1-11, KYOWA Americans Inc., Novi, MI, USA) was attached to the center of each tensile or compressive strip tested in the model development group to measure its longitudinal strain under tensile or compressive loading. The measured strain was recorded using the LabVIEW software (National Instruments, Austin, TX, USA).
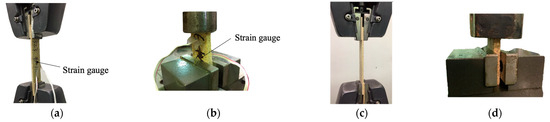
Figure 6.
Testing setups for evaluating (a) pure tensile and (b) compressive properties of particleboard layers at mechanics model development group, and for the (c) pure tensile and (d) compressive properties in the validation group, respectively.
2.3.3. Density and Strength Profile
The density profile was measured using a QMS Density Profiler (Model QDP-01X, Quintek Measurement Systems, Inc., Oak Ridge, TN, USA). The tensile strength profile test followed the same setup as the pure tensile test in the validation group (Figure 6c).
3. Results
3.1. Physical Property
Mean values of PB moisture content and specific gravity were 7.01% (3) and 0.72 (3), respectively.
3.2. Stresses and Strains Evaluated in Mechanics Model Development
The mean of ultimate tensile strain in bending was 0.00360, which is significantly higher, about 1.7 times, than the mean 0.00210 measured in pure tension (Table 1). However, there is no significant difference in ultimate strains measured between pure compressive stain (0.00379 mm/mm), tensile strain (0.00360 mm/mm), and compressive strain (0.00371 mm/mm) when PB is under simply supported center-loading in bending. Those indicate both face layers in compression and tension failed at a similar bending strain, and the additional core material, particularly above the thickness centerline, may contribute to resisting bending tensile strain. This claim could be supported by the fact that it was observed that the neutral axis was actually moving off its centerline in the thickness direction towards the compressive side in the photo-elastic testing of PB strips. This could be further explained by the fact that a significantly higher mean MOE value of the face layer was measured in pure compression than in pure tension (Figure 7), resulting in the neutral axis shifting towards the compressive side.

Table 1.
Mean values of ultimate strain and modulus of elasticity for particleboards tested under pure tensile, compressive, and simply supported center-loading (bending) conditions.
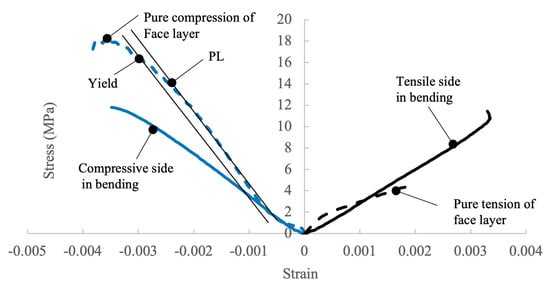
Figure 7.
Typical stress–strain curves of simply supported center-loading bending, face layer pure tension, and face layer pure compression.
Table 2 summarizes the mean values of the bending moment capacity at its proportional limit, yield, and ultimate points for five PB strips evaluated in the mechanics model development group. It also includes the corresponding pure tensile and compressive strength properties for the four layers cut from each strip after bending test. The yield strength and moment values were determined by offsetting the proportional limit straight line by 5% of the strain, as shown in Figure 7.
Table 2.
Mean values of pure tensile and compressive strengths of the face and core layers and bending moment capacity, selected and tested in mechanical model development group.
3.3. Neutral Axis Shifting
It was observed that the coated section on the thickness side of a testing PB strip appeared in silver color at the beginning when center-load bending was applied (Figure 8a). As the load increased, a black, wide color band (indicating zero stress) appeared below the centerline of the thickness of the testing PB strip and gradually became narrower, forming the neutral axis that moved up towards the centerline. As the load was further increased, an orange-and-blue color band started to appear at the bottom edge of the testing PB strip, which was in tension. On average, when the load reached one-third of its ultimate bending load, the neutral axis reached the centerline position of the testing PB strip (Figure 8b). As the load kept increasing, for instance, to two-thirds of the ultimate load, the neutral axis passed the centerline and shifted towards the compressive surface of the testing PB strip (Figure 8c). The neutral axis movement could be explained by the fact that the stiffness of a PB strip when loaded in compression was higher than when in tension (Table 1). As the load continued to increase to its ultimate value, the color bands spread throughout the parts on both the tensile and compressive sides, but the band on the tensile side was wider than the one on the compressive side (Figure 8d).
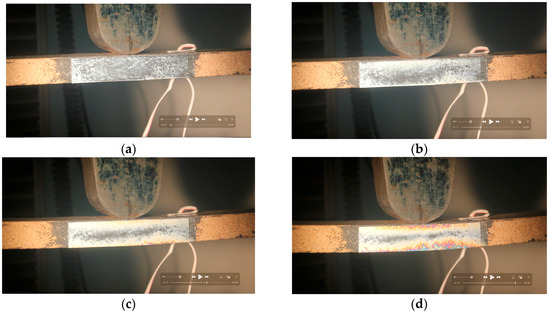
Figure 8.
Photos recorded during photo-elastic testing show the shift in the neutral axis as the bending load increases at various stages: (a) initial, (b) 1/3 of ultimate, (c) 2/3 of ultimate, and (d) ultimate loads.
3.4. Bending Moment and Stresses Evaluated in Mechanics Model Validation
The PB used in this study was produced in a well-controlled process. However, there was a significant difference in the average bending moment. The bending moment was higher when the load was applied to the top face compared to the bottom face. Meanwhile, the bending moment was higher when the load was applied to the length direction compares to the group with the load applied to the width direction, as shown in Table 3. The ultimate bending moment was recorded and compared to the corresponding predicted value from the proposed mechanics models, which were based on layer mean values of each layer’s ultimate strength.
Table 3.
Mean values of ultimate bending moment of sixty particleboard strips evaluated in the mechanics model validation group, along with their corresponding ultimate pure tensile and compressive strengths of face and core layers.
3.5. Tensile Stress Profile and Density Profile
The density profile is symmetric, but the tensile strength profile is asymmetric, as shown in Figure 9 and Table A1. This finding can partly explain the significant difference in bending moments shown in Table 4, which was caused by the higher strength material of the bottom face layer being subjected to tension. However, the correlation coefficient between each layer’s tensile strength and bending moment was weak (only the tensile strength of layer 1, layer 4, and layer 7 was relatively correlated with bending moment, with an r value of 0.39, 0.55, and 0.46, respectively, Tabel A2). The tensile strength was not the only factor that determined the PB’s bending performance. The stress distribution and combined effect of tensile and compressive stresses on PB bending are further studied in the following part of this paper.
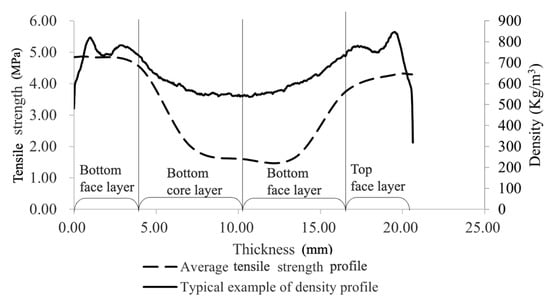
Figure 9.
Average tension strength profile with the center-bending load applied on top face and typical density profile.
Table 4.
Comparisons between predicted and experimental bending moment capacities of particleboard materials evaluated in model development.
4. Bending Moment Prediction Formulas
4.1. Basic Assumption
This study developed mechanics models to predict the bending moment resistance of four-layered PBs under simply supported center-loading conditions. The models account for elastic–plastic and bi-modular behaviors of PB during bending and predict the capacity at different loading stages. The general assumption for the stress distribution in a rectangular PB cross-section under simply supported center-loading involves three stages in the bending moment development process (Figure 10).
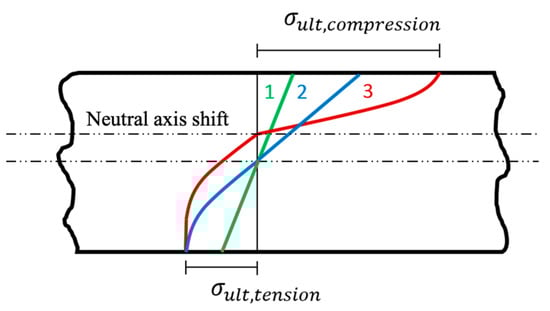
Figure 10.
Three stages of the bending moment development process proposed to develop mechanics models for predicting the bending moment capacities of particleboard.
Stage 1: Elastic behavior. Both tensile and compressive sides remain in the elastic stage, with the linear stress distribution from the top to the bottom of the cross-section. The neutral axis is located at the center of the test PB strip, and the material under compression exhibits the same strain and stress as that under tension. As the bending moment gradually increases into the next stage, the tensile side will reach its yield point and begin to develop into its plastic range, because the pure compressive ultimate strain of PB materials was found to be higher than the tensile ultimate strain.
Stage 2: Initial plastic development. The tensile side develops a plastic deformation at its edge while the compressive side remains elastic. Specifically, the outer layer of the PB material in tension gradually reaches its ultimate stress, developing a partial plastic stress distribution on the tensile side, while a linear stress distribution is still maintained on the compressive side. The neutral axis might still be at the centroid of the material cross-section or might start shifting towards the compressive side as the bending moment increases.
Stage 3: Partially plastic development. With the increasing bending moment, the outer layer of the compressive side of the test PB strip enters the plastic stage as the neutral axis shifts towards the compressive side. Complex linear-plastic stress distributions could develop on both the tensile and compressive sides at the time of material failure.
4.2. Mechanical Model Development and Validation
Based on the three-stage stress distributions proposed in this study (Figure 10), the following four mechanics models (Figure 11) were proposed to derive formulas for predicting the bending moment capacities of a PB material at the stages, including the proportional limit, yield, and ultimate, under simply supported center-loading. The equilibrium conditions require that the moments of the stresses, (MPa), of the neutral z-axis equal the bending moment (N-mm) acting on the cross-section of a test PB strip, and that the resultant normal force produced by the stresses on the cross-section of a test PB strip is zero. These conditions yield the following expressions:
where is an evaluated PB strip width, 76.2 mm.
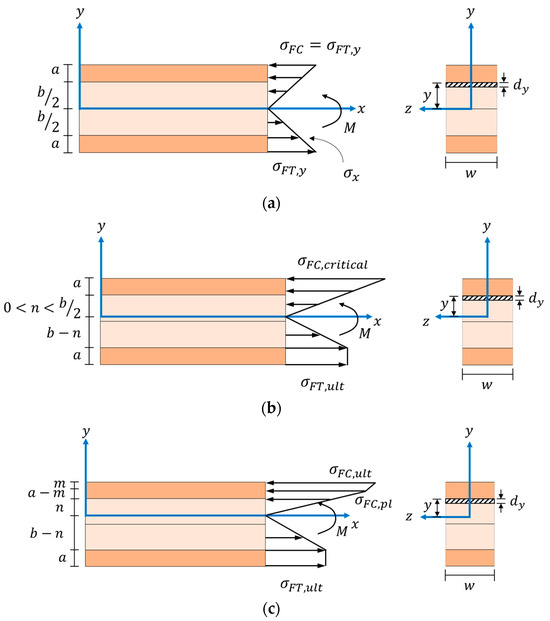
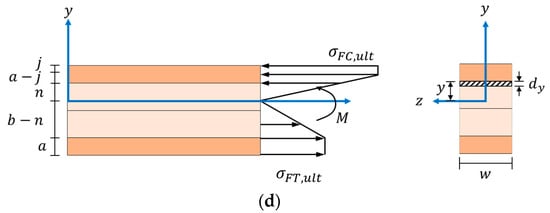
Figure 11.
Illustrations of four proposed stress distributions on the middle cross-section of a four-layered particleboard strip (dark color: for face layers; light color: core layers) at (a) Stage 1, (b,c) Stage 2, and (d) Stage 3 when subjected to simply supported center-loading.
4.2.1. Elastic–Elastic Model
Figure 11a is the elastic–elastic model (Model 1) proposed for deriving formulas to predict the bending moment capacity of an evaluated PB strip at the proportional limit. The assumption is that the stress on the cross-section of the test PB strip is at Stage 1, meaning there exists a linear stress distribution from the top to the bottom on the cross-section, and the neutral axis is located at the centroid of the strip. Additionally, the tensile stress at the bottom surface of a test PB strip just reaches its yield strength, , and the compressive stress at the top surface, , equals the tensile yield strength. Therefore, applying expression (1) yields the following equation for predicting the bending moment capacity of a test PB strip at the proportional limit:
where is the face layer thickness, 4.1 mm, and is the combined thickness of the two core layers, 12.7 mm. Formula (3), which predicts the bending moment capacity at proportional limit for the middle section of a test PB strip, can be written below by further simplifying the previous equation:
Substituting = 5.59 MPa (from Table 3), = 76.2 mm, = 4.1 mm, and = 12.7 mm into Formula (3) yields the predicted bending moment capacity at the proportional limit:
4.2.2. Elastic–Partially Plastic Model
Figure 11b is the elastic–partially plastic model (Model 2) proposed for deriving formulas to predict the bending moment capacity of an evaluated PB strip at the yield point. The assumption is that the stress on the cross-section of a test PB strip enters Stage 2, i.e., the stress on the tensile side first develops into its plastic stage in the section close to its surface, while the stress on the compressive side remains in its elastic stage. In other words, a linear stress distribution is still maintained on the compressive side; the stress along the edge of face layer reaches its critical value, ; and the neutral axis might still be located at the centroid of the material cross-section or may start shifting towards the compressive side as the applied center-loading magnitude increases. Additionally, the tensile stress in the partial section close to the bottom surface of a test PB strip reaches the ultimate tensile strength of face layer material, , meaning that the yielding occurs on the tensile surface and progresses towards the interior, while the partial core layer material on the tensile side still exhibits the linear stress distribution. Therefore, applying expression (2) with the specific stress distributions and geometries provided in Figure 11b yields the following:
where is the distance between the neutral axis and the interface of the face and core layer at the compressive side of a test strip (Figure 11b), and its value could range from zero to = 6.35 mm. Formula (4), which predicts the critical compressive stress along the edge of face layer, can be derived by solving the above equation:
Therefore, the functional relationship between and can be plotted in Figure 12a by substituting = 6.14 MPa, = 4.1 mm, and = 12.7 mm into Formula (4). This indicates that when the critical compressive stress, , reaches its ultimate value of 16.89 MPa (as per Table 3), the corresponding calculated value of is 2.57 mm. Conversely, when the critical compressive stress, , is set to 8.55 MPa by setting the value of equal to 6.35 mm, the neutral axis is at the middle of the PB thickness. These observations imply that the value will be limited to the range from 2.57 to 6.35 mm, i.e., 2.57 mm ≤ ≤ 6.35 mm, as shown in Figure 12a. Applying expression (1) with specific stress distributions and geometries provided in Figure 11b yields the following equation for predicting the bending moment capacity of a test PB strip at its yield point:
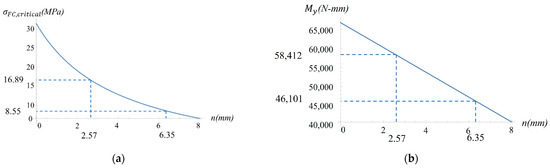
Figure 12.
Plots of (a) the critical compressive stress in the face layer () as a function of , where is the distance between the neutral axis and the interface of face and core layers of the compressive side of a test strip (see Figure 11b), and (b) the bending moment at the yield point as a function of .
Formula (5), which predicts the bending moment capacity on the section of a test PB strip at its yield point, can be written below by further simplifying the previous equation:
Substituting , as given by Formula (4), into Formula (5), along with other known material geometries, such as = 76.2 mm, = 4.1 mm, = 12.7 mm, and mechanical property = 6.14 MPa, yields the functional relationship between and , as plotted in Figure 12b. The maximum and minimum predicted bending moment capacities of 58,412 N-mm and 46,101 N-mm can be found by setting to 2.57 mm and 6.35 mm, respectively.
4.2.3. Stepped Elastic–Partially Plastic Model
Figure 11c is the stepped elastic–partially plastic model (Model 3) proposed for deriving formulas to predict the bending moment capacity of an evaluated PB strip at the ultimate point. The assumption is that the stress on the cross-section of a test PB strip transitions from Stage 2 to Stage 3. Specifically, the face layer material on the tensile side is fully yielded and reaches its ultimate tensile strength, while the outer surface of the face layer material on the compressive side just reaches its ultimate compressive strength . The stress distribution on the compressive side is in a trapezoidal form, i.e., the stress within the face layer at the point (mm) away from the outer surface reaches its proportional limit . The value of m could range from zero to = 4.1 mm. Meanwhile, the neutral axis shifts towards to the compression side. Applying expression (2) with specific stress distribution and geometries provided in Figure 11c yields the following:
The above equation, which governs the relationship between n and m values, can be simplified as below:
Therefore, the functional relationship between and , as plotted in Figure 13a, can be obtained by substituting = 6.14 MPa, = 16.89 MPa (from Table 3), = 16.4 MPa, = 76.2 mm, = 4.1 mm, and = 12.7 mm into Equation (6). This illustrates that will be 3.3 mm if is set to 0 mm, and will be 0.004 mm if is set to 4.1 mm, Figure 13a.
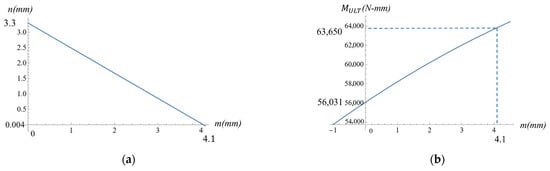
Figure 13.
Plots of (a) the distance between the neutral axis and the interface of face and core layers of the compressive side a test strip (), as a function of , which is the distance from the outer surface of the face layer where its strength reaches its proportional limit, and (b) the bending moment at ultimate point as a function of .
Applying expression (1) yields the following equation for predicting the bending moment capacity of a test PB strip at ultimate point:
Formula (7), which predicts the bending moment capacity of a test PB strip at ultimate point, can be written below by further simplifying the previous equation:
Combining Equation (6) with Formula (7) to eliminate the variable , and substituting the known material geometries and mechanical properties into the combined equation, yields the functional relationship between and , as plotted in Figure 13b. The maximum and minimum predicted bending moment capacities of 63,650 N-mm and 56,031 N-mm can be obtained by setting to 4.1 mm and 0 mm, respectively. These results suggest that when the ultimate bending moment capacity of a test PB strip reaches its maximum value, the neutral axis could shift to a position very close to the interface of face and core layers, and is only 0.004 mm.
4.2.4. Partially Plastic Model
Figure 11d is the partially plastic model (Model 4) proposed for deriving of formulas to predict the bending moment capacity at ultimate point, in addition to the stepped elastic–partially plastic model (Figure 11c). The assumption is that the stress on the cross-section of a test PB strip is in Stage 3, where the face layer material on the compressive side is partially yielded, and the yielded section with a thickness of mm reaches its ultimate compressive strength. The value of could range from zero to = 4.1 mm. On the tensile side, the face layer material is fully yielded and reaches its ultimate tensile strength. Meanwhile, the neutral axis shifts towards to the compressive side. Therefore, applying expression (2) with specific stresses and geometries provided in Figure 11d yields the following:
The equation governing the relationship between and values can be written below by further simplifying the previous equation:
Therefore, the functional relationship between and , as plotted in Figure 14a, can be obtained through substituting = 6.14 MPa, = 16.89 MPa (Table 3), = 76.2 mm, = 4.1 mm, and = 12.7 mm into Equation (8). This illustrates that is 2.56 mm when is set to 0 mm, and will be 3.5 mm when is set to 0 mm, as shown in Figure 14a.
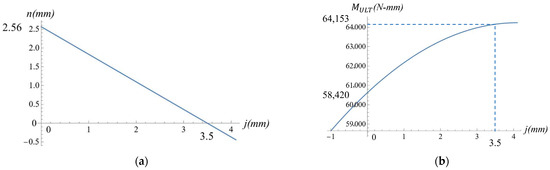
Figure 14.
Plots of (a) the distance between the neutral axis and the interface of face and core layers on the compressive side a test strip () as a function of (the thickness of the face layer in compression reaching its ultimate compressive strength), and (b) the bending moment at ultimate point as a function of .
Applying expression (1) yields the following equation for predicting the bending moment capacity of a test PB strip at the ultimate point:
Formula (9), which predicts the bending moment capacity at the ultimate point for a section of a test PB strip, can be written below by further simplifying the previous equation:
Combining Equation (8) with Formula (9) to eliminate the variable , and substituting the known material geometries and mechanical properties into the combined equation, yields the functional relationship between and , as plotted in Figure 14b. The maximum and minimum predicted bending moment capacities are 64,153 N-mm and 58,420 N-mm, respectively, which can be obtained by setting = 3.5 mm and = 0 mm.
Table 4 indicates that Formula (3) tends to underpredict the bending moment capacity of four-layered PB materials at the proportional limit because of an Exp/Pre. ratio of 1.168. The upper limit for the bending moment capacity, predicted by Formula (5) for four-layered PB materials at yield point, tends to be reasonable, with an Exp./Pre. ratio of 0.957, but the lower limit is underpredicted because of an Exp./Pre. ratio of 1.213. The upper limit predicted by Formula (7) for the bending moment capacity at the ultimate point tends to be reasonable, with an Exp./Pre. ratio of 1.033, but the lower limit is underpredicted at an Exp./Pre. ratio of 1.168. Both the upper and lower limits predicted for the bending moment capacities at the ultimate point using Formula (9) tend to be reasonable, with a slight improvement compared to those using Formula (7). This suggests that Formula (9) should be considered for the prediction of the ultimate bending moment capacity of four-layered PB materials. In general, the derived formulas, based on proposed mechanics models, can provide reasonable predictions of the moment capacities of evaluated PB materials using the layers’ tensile and compressive strength properties as inputs.
The ultimate pure tensile and compressive strengths of face and core layers, measured with the mechanics model validation group (Table 3), were substituted into Formula (9) to predict the ultimate bending moment for each of the four evaluated loading conditions. The differences between the predicted ultimate bending moments and their corresponding measured mean values were compared and summarized in Table 5. The Exp./Pre. ratios, ranging from 0.88 to 1.04, indicate that the Formula (9), derived from Model 4, can be used to reasonably predict the ultimate bending moment capacity of elastic–plastic and bi-modular-layered PB materials.
Table 5.
Comparisons between predicted and experimental bending moment capacities of four-layered particleboard materials evaluated in model validation group.
4.3. Case Study Bending Failure Model for Design the Layer Properties of Particleboard
The proposed model for predicting nonlinear bi-modular particleboard bending moments is valid, demonstrating a functional relationship between the face layer tension, face layer compression, and bending moment for PB design optimization. The face layer’s tensile strength of the model validation group, obtained through random sampling, ranged from 4.65 MPa to 6.78 MPa, and the face layer’s compressive strength of the model validation group ranged from 13.00 MPa to 18.59 MPa when a bending load was applied on the top face. The M2 grade PB bending moment was set to the target value (ranging from 56,492 N-mm to 67,791 N-mm). By using the Formula (9) bending failure and its corresponding tested parameters, the combination of face tensile and compressive strength values was developed from a 3D plot, as shown in Figure 15.
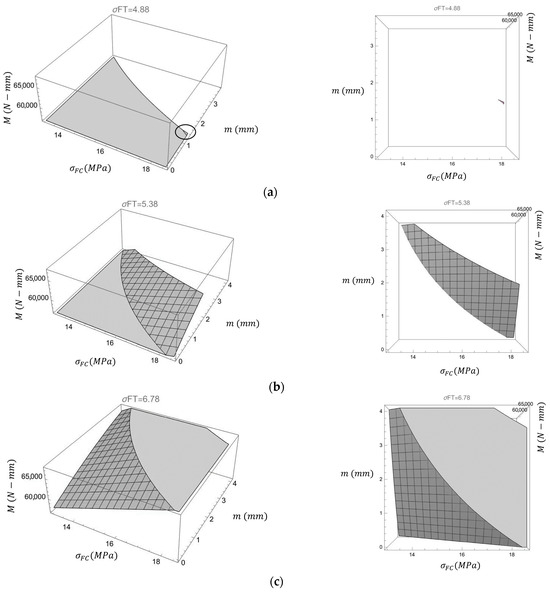
Figure 15.
3D plot of the face tensile and compressive strength with corresponding bending moment (gray grid area), perspective view and front view. (a) Face layer tensile strength is 4.88 MPa. (b) Face layer tensile strength is 5.38 MPa. (c) Face layer tensile strength is 6.78 MPa.
To meet the minimum bending moment requirement of 56,492 N-mm for M2 grade PB, the face layer tensile stress should not be less than 4.88 MPa, while the corresponding compressive stress reaches its maximum value of 18.59 MPa (Figure 15a). The bending moment requirement cannot be achieved if the face layer tensile stress is below 4.88 MPa, regardless of compressive stress increase. Insufficient tension support explains why a higher face-layer density did not always improve mechanical performance, as reported previously [23]. As the face layer tensile stress increases, the tension–compressive stress combinations show a significant increase (the dark grey grid area). At a face layer tensile stress of 5.38 MPa, the widest range of the face layer compressive stress (13.00 MPa to the maximum 18.59 MPa) is achieved, representing the most efficient and economic combination among all tested scenarios (Figure 15b). However, material properties become over-specified in tension when the face layer tensile stress reaches its highest value of 6.78 MPa, producing a minimum bending moment of 57,691N-mm that exceeds the target requirement of 56,492 N-mm (Figure 15c). These findings confirm that the bending moment resistance capacity of the particleboard was governed by the synergistic interaction between tensile and compressive strengths across all four material layers.
5. Conclusions
Strain analysis indicated that both face layers, whether in compression or tension, failed at the same strain when the PB strip was subjected to the simply supported center-loading conditions. The mean of ultimate tensile strain in bending was significantly higher than that measured in pure tension, indicating that more core material, particularly above the PB thickness centerline, helped undertake the tensile stress. This claim was supported by the photo-elastic testing of the neutral axis shift away from its centerline towards the compressive side. This could be further corroborated by the significantly higher mean MOE value of face layers in pure compression compared to pure tension. These observations strongly support the mechanical model’s assumption that the tensile side develops a plastic deformation before the compressive side.
The bending moment capacities of PB strips loaded at different stages (proportional limit, yield, and ultimate points) were reasonably predicted using the derived formulas, which require layer-specific tensile and compressive strengths and thicknesses as inputs. Equation (9), based on the partially plastic model, was experimentally validated for predicting the ultimate moment capacity in four-layered PBs.
The mechanical model can be used to explain bending strength variations in terms of different combinations of layer strength properties that commonly occur in real manufacturing environments due to process variations. A 3D plot illustrated design boundary and synergistic interactions between tensile and compressive strengths. These plots visualized estimated general behavior of PB bending moments after applying correction factors. The results showed that a smooth convex curved surface was developed, representing the bending moment in relation to the face layer tensile stress, face layer compressive stress, and the thickness of the face layer at a full compression yield. For M2 grade PB, to meet the minimum bending moment requirement of 56,500 N-mm, the face layer’s tensile stress should higher than 4.88 MPa. The most efficient and economic design was found when the face layer tensile stress reached 5.38 MPa and the range of the face layer compression strength was from 13.00 MPa to 18.59 MPa. Based on the model, industries can optimally design particleboard structures by controlling the face tensile and compressive strength. However, the relationship of manufacturing parameters with tensile and compression strengths should be further studied.
Author Contributions
Conceptualization, S.D., Y.W.,W.H., and J.Z.; methodology, Y.W., W.H., and J.Z.; software, S.D. and W.H.; validation, J.Z.; formal analysis, S.D. and W.H.; investigation, S.D., and W.H.; resources, J.Z.; data curation, F.Q. and Y.W.; writing—original draft preparation, Y.W. and X.Y.; writing—review and editing, Y.W., J.Z., and S.S., and X.Y.; visualization, Y.W., S.S., and F.Q.; supervision, F.Q.; project administration, J.Z.; funding acquisition, Y.W. and S.S. All authors have read and agreed to the published version of the manuscript.
Funding
This project was partially funded by the Department of Sustainable Bioproducts at Mississippi State University and partially funded by the Roseburg Particleboard Company, Taylorsville, Mississippi.
Data Availability Statement
The original contributions presented in this study are included in the article. Further inquiries can be directed to the corresponding author.
Acknowledgments
The authors acknowledge Roseburg Particleboard Company, Taylorsville, Mississippi, for providing particleboard for this study. The authors would also like to thank the support from Mississippi State University (MSU), Forest & Wildlife Research Center (FWRC), and the Department of Sustainable Bioproducts. The authors would also like to thank the support from Hunan Province Key R&D Program AC202406121712590006.
Conflicts of Interest
The authors declare that they have no conflicts of interest.
Appendix A
Table A1.
Mean of tensile strength of particleboard in strength profile test (was applied bending load on top face).
Table A1.
Mean of tensile strength of particleboard in strength profile test (was applied bending load on top face).
| Bending Moment (N-mm) | Pure Tensile Stress (MPa) (Tension Surface1→Compression Surface7) | ||||||
|---|---|---|---|---|---|---|---|
| Layer 1 | Layer 2 | Layer 3 | Layer 4 | Layer 5 | Layer 6 | Layer 7 | |
| 59,582(2.5) | 4.44(9) 1 | 4.49(10) | 1.79(18) | 1.41(27) | 1.55(11) | 3.74(8) | 4.03(10) |
1 COV.
Table A2.
The coefficient of correlation of bending moment with tensile strength in strength profile test (was applied bending load on top face).
Table A2.
The coefficient of correlation of bending moment with tensile strength in strength profile test (was applied bending load on top face).
| Bending Moment | Layer 1 | Layer 2 | Layer 3 | Layer 4 | Layer 5 | Layer 6 | Layer 7 | |
|---|---|---|---|---|---|---|---|---|
| Bending moment | 1.00 | |||||||
| Layer 1 | 0.46 | 1.00 | ||||||
| Layer 2 | 0.15 | −0.05 | 1.00 | |||||
| Layer 3 | 0.30 | 0.29 | 0.09 | 1.00 | ||||
| Layer 4 | 0.55 | 0.32 | 0.30 | 0.28 | 1.00 | |||
| Layer 5 | 0.19 | 0.43 | −0.02 | 0.35 | 0.14 | 1.00 | ||
| Layer 6 | 0.08 | −0.06 | 0.69 | 0.01 | 0.25 | 0.06 | 1.00 | |
| Layer 7 | 0.39 | 0.71 | 0.36 | 0.36 | 0.40 | 0.51 | 0.16 | 1.00 |
References
- Nemli, G.; Demirel, S. Relationship between the density profile and the technological properties of the particleboard composit. J. Compos. Mater. 2007, 41, 1793–1802. [Google Scholar] [CrossRef]
- Jin, J.; Dai, C.; Hsu, W.E.; Yu, C. Properties of strand boards with uniform and conventional vertical density profiles. Wood Sci. Technol. 2009, 43, 559–574. [Google Scholar] [CrossRef]
- Bardak, S.; Nemli, G.; Sari, B.; Baharoǧlu, M.; Zekoviç, E. Effects of density profile and hot press diagram on the some technological properties of particleboard composite. High Temp. Mater. Process. 2011, 30, 31–37. [Google Scholar] [CrossRef]
- Korai, H. Analysis of the density profile and bending properties of commercial particleboard. J. Indian Acad. Wood Sci. 2024, 21, 255–264. [Google Scholar] [CrossRef]
- Xu, W. Influence of vertical density distribution on bending modulus of elasticity of wood composite panels: A theoretical consideration. Wood Fiber Sci. 1999, 31, 277–282. [Google Scholar]
- Wong, E.-D.; Yang, P.; Zhang, M.; Wang, Q.; Nakao, T.; Li, K.-F.; Kawai, S. Analysis of the effects of density profile on the bending properties of particleboard using finite element method (FEM). Eur. J. Wood Prod. 2003, 61, 66–72. [Google Scholar] [CrossRef]
- Craig, R.R., Jr.; Taleff, E.M. Mechanics of Materials; John Wiley & Sons: Hoboken, NJ, USA, 2020. [Google Scholar]
- Ugural, A.C. Mechanics of Materials; John Wiley & Sons: Hoboken, NJ, USA, 2007. [Google Scholar]
- Bodig, J.; Jayne, B.A. Mechanics of Wood and Wood Composites; Krieger Publishing Company: Malabar, FL, USA, 1982. [Google Scholar]
- Baryeh, E.A. Properties of Chipboard (No. IC--92/433); International Centre for Theoretical Physics: Trieste, Italy, 1993. [Google Scholar]
- Shim, K.B.; Kim, K.M.; Park, J.S. Improvement of prediction accuracy of glulam modulus of elasticity by considering neutral axis shift in bending. Wood Fiber Sci. 2009, 41, 90–96. [Google Scholar]
- Destrade, M.; Murphy, J.G.; Rashid, B. Differences in tension and compression in the nonlinearly elastic bending of beams. arXiv 2013, arXiv:1303.1901. [Google Scholar]
- Zakić, B.D. Inelastic bending of wood beams. J. Struct. Div. 1973, 99, 2079–2095. [Google Scholar] [CrossRef]
- Buchanan, A.H. Bending strength of lumber. J. Struct. Eng. 1990, 116, 1213–1229. [Google Scholar] [CrossRef]
- McNatt, J.D. Basic Engineering Properties of Particleboard; Forest Products Laboratory: Madison, WI, USA, 1973; Volume 206. [Google Scholar]
- Steidl, C.M.; Wang, S.; Bennett, R.M.; Winistorfer, P.M. Tensile and compression properties through the thickness of oriented strandboard. For. Prod. J. 2003, 53, 72–80. [Google Scholar]
- Zaw, K.M.; Mohamed, Z.; Bakar, S.A. A modified stress model to predict the ultimate bending strength of solid timber beams using plastic approach. Malays. J. Civ. Eng. 2005, 17, 15674. [Google Scholar]
- Moe, J. The Mechanism of Failure of Wood in Bending; CABI Digital Library: Wallingford, UK, 1961. [Google Scholar]
- Gilbert, B.P.; Bailleres, H.; Zhang, H.; McGavin, R.L. Strength modelling of laminated veneer lumber (LVL) beams. Constr. Build. Mater. 2017, 149, 763–777. [Google Scholar] [CrossRef]
- Nwokoye, D.N. An Investigation into an Ultimate Beam Theory for Rectangular Timber Beams-Solid and Laminated; CABI Digital Library: Wallingford, UK, 1972. [Google Scholar]
- ANSI A208. 1-2022; Particleboard. American National Standards Institute: Washington, DC, USA, 2022.
- ASTM D 1037-12; Standard Test Methods for Evaluating Properties of Wood-Base Fiber and Particle Panel Materials. American Society for Testing and Materials—ASTM: West Conshohocken, PA, USA, 2020.
- Luo, S.; Gao, L.; Guo, W. Effect of face layer manipulation on the density profile and properties of low density particleboard. Wood Res. 2020, 65, 125–134. [Google Scholar] [CrossRef]


Disclaimer/Publisher’s Note: The statements, opinions and data contained in all publications are solely those of the individual author(s) and contributor(s) and not of MDPI and/or the editor(s). MDPI and/or the editor(s) disclaim responsibility for any injury to people or property resulting from any ideas, methods, instructions or products referred to in the content. |
© 2025 by the authors. Licensee MDPI, Basel, Switzerland. This article is an open access article distributed under the terms and conditions of the Creative Commons Attribution (CC BY) license (https://creativecommons.org/licenses/by/4.0/).