


Abstract
Topography regulates vegetation functioning by controlling water redistribution, microclimate, and solar exposure. In Mediterranean ecosystems, where water availability constitutes a fundamental limiting factor, vegetation functioning is also influenced by environmental drivers such as temperature, climatic seasonality, drought recurrence, and soil properties that interact with terrain heterogeneity. Understanding how these elements operate at the micro-scale is essential for interpreting the spatial variability of photosynthetic vigor and canopy water condition. This study evaluates the relationships between the topographic metrics Topographic Position Index (TPI), Terrain Ruggedness Index (TRI), and Diurnal Anisotropic Heat Index (DAH) and two spectral proxies of vegetation condition, the Normalized Difference Vegetation Index (NDVI) and the Normalized Difference Moisture Index (NDMI), in Los Nogales Nature Sanctuary (central Chile). Multitemporal Sentinel-2 time series (2017–2025) were analyzed using Generalized Additive Models (GAMs) with Gaussian distribution and cubic splines to detect non-linear topographic responses. All topographic predictors were statistically significant (p < 0.001). NDVI and NDMI values were higher in concave and less rugged areas, decreasing toward convex and thermally exposed slopes. NDMI exhibited greater sensitivity to topographic position and thermal anisotropy, indicating the strong dependence of vegetation water condition on topographically driven water redistribution. These results highlight the role of terrain in modulating vegetation vigor and moisture in Mediterranean ecosystems.
Keywords:
topography; Mediterranean ecosystems; vegetation moisture; terrain metrics; NDVI; NDMI; Sentinel-2; GAM 1. Introduction
Mediterranean ecosystems of central Chile are characterized by marked hydrological seasonality, prolonged dry summers, and high topographic heterogeneity, conditions that directly influence ecohydrological processes and vegetation functioning [1,2,3]. At the global scale, Mediterranean biomes exhibit similar climatic and structural patterns, and numerous studies have demonstrated that the interaction between topography, microclimate, and water availability decisively modulates canopy physiological performance [1,3,4]. In regions such as California, the European Mediterranean Basin, and southwestern Australia, small variations in curvature, aspect, and slope have been shown to generate microenvironmental contrasts capable of substantially modifying leaf temperature, incident radiation, and soil moisture, thereby directly affecting photosynthetic activity and vegetation water condition. In central Chile, these processes have been intensified by sustained aridification and the 2010–2018 megadrought [5], increasing vegetation dependence on topographic gradients that regulate water availability and thermal load. However, studies explicitly evaluating how micro-scale topographic heterogeneity influences canopy spectral condition remain scarce in the national context, despite the relevance of these patterns for the persistence of drought-adapted species.
Several metrics derived from digital elevation models allow characterization of terrain attributes closely linked to ecohydrological processes. The Topographic Position Index (TPI) describes concave–convex gradients associated with lateral water accumulation or loss; the Terrain Ruggedness Index (TRI) represents local elevation variability related to microclimate generation; and the Diurnal Anisotropic Heat Index (DAH) approximates differences in thermal load derived from terrain orientation and slope [4,6,7]. These metrics have been widely used to evaluate relationships between terrain geometry and vegetation behavior, enabling the capture of relief properties that operate at spatial scales where environmental gradients do not follow simple or linear patterns. Nevertheless, knowledge remains limited regarding how these topographic attributes influence photosynthetic vigor and canopy water condition at fine spatial scales in Mediterranean ecosystems, particularly in mountainous landscapes subject to prolonged water deficit [5,8]. This gap is especially relevant given that the magnitude of micro-scale topographic variation can define conditions of shading, water retention, or thermal exposure that are critical for the persistence of drought-adapted species.
Vegetation activity in these environments is strongly dependent on water availability and terrain-controlled thermal fluctuations [9,10]. Therefore, understanding how local variations in landform shape generate differentiated microenvironmental conditions is fundamental for interpreting spatial patterns of canopy functioning. Spectral indices derived from satellite imagery, such as the Normalized Difference Vegetation Index (NDVI; proxy for photosynthetic vigor) and the Normalized Difference Moisture Index (NDMI; proxy for vegetation water condition), have proven to be robust tools for assessing vegetation physiological responses [11,12]. NDVI is associated with canopy photosynthetic activity and its capacity to maintain green foliar tissue, whereas NDMI is particularly sensitive to vegetation water content and reflects hydric conditions more closely linked to drought stress. However, most studies have focused on regional climatic gradients, leaving the role of local topography in modulating these indices relatively unexplored in Mediterranean mountain landscapes. This conceptual disconnection hinders progress toward an integrated understanding of the ecohydrological mechanisms that allow vegetation persistence under prolonged water stress and limits the ability to interpret spatial variation in canopy condition under scenarios of progressive aridification [8,11,12].
In this context, analyzing how TPI, TRI, and DAH explain variation in NDVI and NDMI at fine spatial scales constitutes a necessary step toward improving the spatial interpretation of ecosystem functioning in Mediterranean environments with complex relief. This approach is particularly relevant in ravine landscapes, where topography generates microclimatic gradients that are determinant for canopy structure and water status [13,14,15,16,17,18,19,20,21,22,23,24]. Mediterranean ravines frequently act as thermal and hydrological microrefugia, maintaining more humid, shaded, and thermally buffered conditions compared to exposed slopes, thereby promoting the persistence of vegetation communities sensitive to summer stress. Los Nogales Nature Sanctuary, located in the Andean foothills of central Chile, represents a characteristic example of these systems, defined by a combination of abrupt relief, heterogeneous exposure, and sclerophyllous vegetation adapted to summer water deficit.
The objective of this study is to evaluate how topographic metrics (TPI, TRI, and DAH) modulate vegetation spectral responses (NDVI and NDMI) in a Mediterranean ravine ecosystem. Specifically, non-linear relationships between these variables are analyzed as proxies for photosynthetic vigor and canopy water condition, in order to identify the most relevant topographic gradients explaining the observed spatial variation. Accordingly, this study addresses the following questions: (1) To what extent do micro-scale topographic metrics explain the spatial variation in NDVI and NDMI? (2) Do these relationships exhibit non-linear patterns detectable using generalized additive models? (3) Which topographic gradients relative position, ruggedness, and thermal exposure exert the greatest influence on canopy photosynthetic vigor and water condition? Finally, we hypothesize that concave positions, less rugged areas, and thermally protected sectors exhibit higher NDVI and NDMI values due to enhanced water retention and reduced thermal stress, consistent with the ecohydrological mechanisms described for Mediterranean ecosystems.
2. Materials and Methods
2.1. Study Area
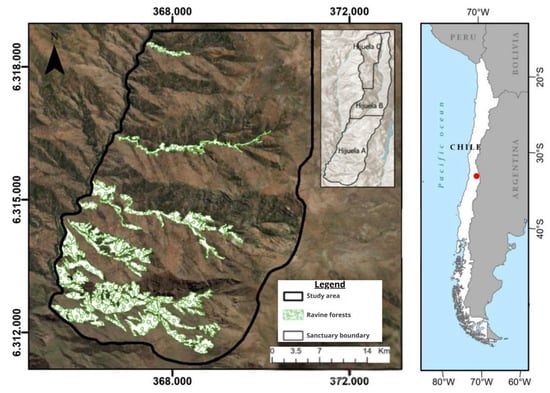
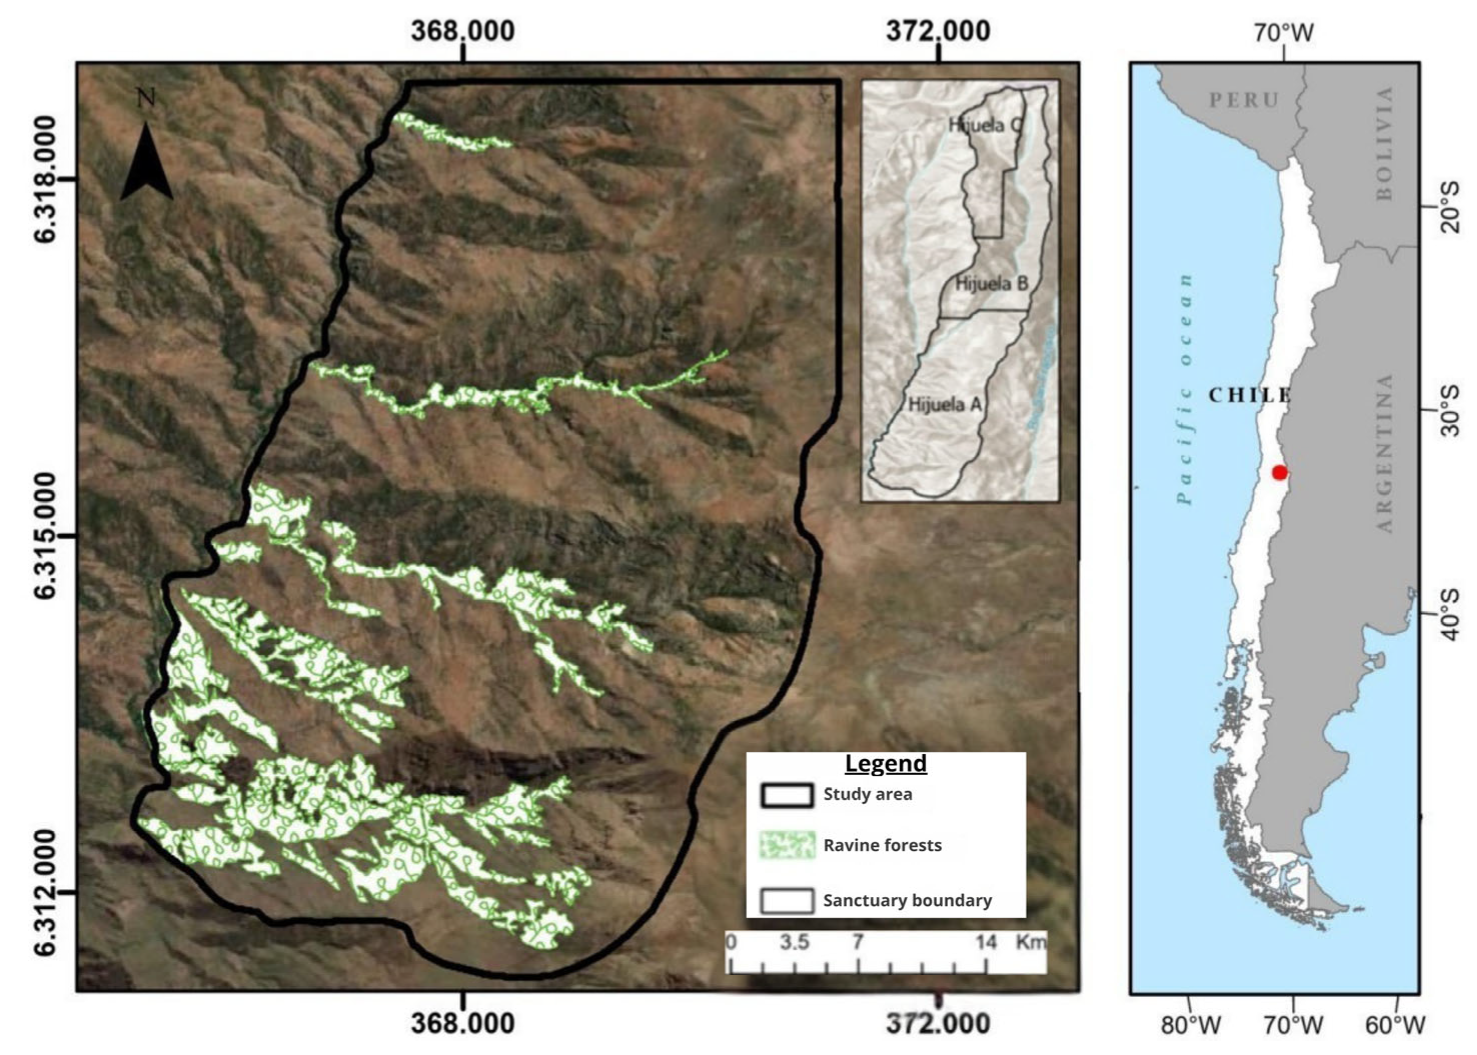
The study was conducted in Los Nogales Nature Sanctuary (NS Los Nogales) (Figure 1), located in the Andean foothills of central Chile, within the municipality of Lo Barnechea (33°37′ S, 70°33′ W), Metropolitan Region. According to the phytogeographic classification of Luebert and Pliscoff (2006) [25], the area corresponds to Mediterranean sclerophyllous shrubland of the Andean foothills, characterized by marked thermal and pluviometric seasonality typical of the Mediterranean climate of central Chile.
Figure 1.
Location of the study area and ravine forests in Los Nogales Nature Sanctuary, located in the foothills of the Mediterranean Andes, Chile.
Mean annual precipitation ranges from approximately 300 to 400 mm and is concentrated mainly during the austral winter period (May–August), whereas dry conditions prevail from late spring through early autumn [26,27].
Mean annual temperatures vary between 12 and 14 °C, with marked daily and altitudinal fluctuations, particularly within ravine environments [28].
The site is dominated by Mediterranean sclerophyllous vegetation, with plant formations composed of native species such as Lithraea caustica (litre), Peumus boldus (boldo), Quillaja saponaria (quillay), and Cryptocarya alba (peumo). The local flora is adapted to summer drought conditions and is distributed over an abrupt terrain characterized by steep slopes, dissected landforms, and strong gradients of elevation, aspect, and slope [25].
The pronounced topographic heterogeneity of NS Los Nogales generates microenvironmental contrasts within the site, producing local variations in radiation, temperature, and water availability [14]. In particular, ravines in the area exhibit more humid and shaded conditions than exposed slopes, directly affecting vegetation structure and functioning [13,14,15,16,17,18,19,20,21,22,23,24].
2.2. Satellite Data and Spectral Indices
A time series of Sentinel-2 images covering the period from January 2017 to June 2025 was used. This period was selected because, from 2017 onward, the Sentinel-2 constellation (S2A + S2B) has been fully operational, ensuring a five-day revisit frequency, stable temporal availability, and adequate radiometric consistency for generating robust multitemporal series. In addition, the upper limit of the period (June 2025) corresponds to the most recent date with imagery available at the time of analysis.
Images were downloaded from the Copernicus Open Access Hub platform of the European Space Agency (ESA) and subsequently processed in RStudio v 4.4.1 using the terra, sf, and tidyverse packages [29,30,31,32]. During preprocessing, scenes were selected and filtered by removing those with cloud cover greater than 15%. Cloud detection was based on the Scene Classification Layer (SCL) included in Level-2 products, excluding classes 3, 8, 9, 10, and 11 (cloud shadows, clouds, and cirrus).
NDVI and NDMI were calculated over the entire spatial domain of the study area, without prior segmentation by vegetation type. No vegetation mask was applied, as the objective of the study was to evaluate the continuous variation in spectral indices along topographic gradients, regardless of the land-cover unit present in each pixel. Although different vegetation formations are present in the area (sclerophyllous forest, shrubland, and mixed formations), no class-stratified analysis was performed.
For each pixel, the mean value and standard deviation of both indices were computed from the multitemporal series. The following indices were calculated at a spatial resolution of 10 m:
Normalized Difference Vegetation Index (NDVI):
Normalized Difference Moisture Index (NDMI):
and their coefficients of variation:
NDVImean, NDVIstd, NDMImean, NDMIstd,
Finally, the resulting raster layers were resampled to a spatial resolution of 12.5 m using bilinear interpolation, in order to match the spatial resolution of the Digital Elevation Model (ALOS PALSAR DEM) and to allow direct comparison with the topographic metrics (TPI, TRI, and DAH) in the subsequent statistical analysis.
2.3. Topographic Metrics
TPI, TRI, and DAH were derived from the ALOS PALSAR Digital Elevation Model (12.5 m), clipped to the study area using a 5 m buffer. Processing was carried out in Google Earth Engine and validated in SAGA-GIS [33,34]. Three main metrics were calculated:
Topographic Position Index (TPI):
TPI was calculated following Weiss (2001) [35] as the difference between the elevation of a pixel and the mean elevation of its surrounding neighborhood within a 100 m radius:
where corresponds to the elevation of the central pixel and to the mean elevation within a circular neighborhood (radius = 100 m). Positive values indicate convex or ridge positions, whereas negative values correspond to concave or valley positions.
Terrain Ruggedness Index (TRI):
TRI was calculated following Riley et al. (1999) [36], which quantifies local altitudinal variation (surface ruggedness) within a moving window:
which represents surface ruggedness within the neighborhood.
Diurnal Anisotropic Heat Index (DAH):
DAH was calculated following the approach of Iwahashi and Pike (2007) [37], which estimates potential daytime thermal exposure as a function of slope, aspect, and latitude:
where values close to 1 indicate high solar exposure (north-facing slopes), whereas low values reflect more shaded areas (south-facing slopes) [37].
All topographic metrics were standardized using z-transformation to facilitate comparison of magnitudes among predictors:
The resulting raster layers were exported in GeoTIFF format and integrated with the spectral layers (NDVI and NDMI) resampled to 12.5 m for subsequent statistical analysis.
2.4. Statistical Analysis
Generalized Additive Models (GAMs) were fitted to evaluate non-linear relationships between topographic metrics (TPI_z, TRI_z, and DAH_z) and mean spectral indices (NDVI_mean and NDMI_mean). GAMs allow the modeling of non-parametric effects through smooth functions, making them suitable for capturing complex responses to environmental gradients, and were implemented using the mgcv package [38] in R (v4.3.2).
The implemented models were:
where s denotes penalized cubic splines with a basis dimension of k = 10. Smoothing parameters were estimated using Restricted Maximum Likelihood (REML). The statistical significance of each term was assessed using F-tests (α = 0.05), and overall model performance was quantified using adjusted R2 and explained deviance. All partial effect curves were generated using mgcv to visualize the non-linear responses of NDVI and NDMI to each topographic gradient.
GAM NDMI: NDMImean = s(TPIz) + s(TRIz) + s(DAHz),
All analyses were conducted in RStudio, and partial effect curves were produced to visualize the non-linear responses of NDVI and NDMI to each topographic gradient.
3. Results
3.1. Model Performance and Significance of Topographic Predictors
Generalized Additive Models (GAMs) showed significant effects of all topographic metrics on both vegetation indices (F-test, p < 0.001; Table 1). Overall model performance was low (adjusted R2: NDVI = 0.0179; NDMI = 0.0137). Effective degrees of freedom (edf ranging from 8.20 to 8.81) reflect non-linear responses of NDVI y NDMI frente a TPI , TRI y DAH .
Table 1.
Results of the Generalized Additive Models (GAMs) fitted to mean vegetation indices (NDVI and NDMI) as a function of standardized topographic metrics (TPI_z, TRI_z, and DAH_z). All predictors were statistically significant (F-test, p < 0.001).
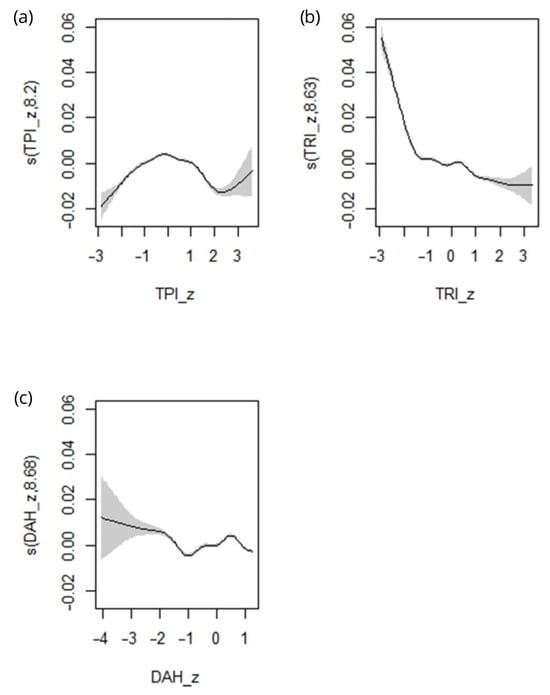
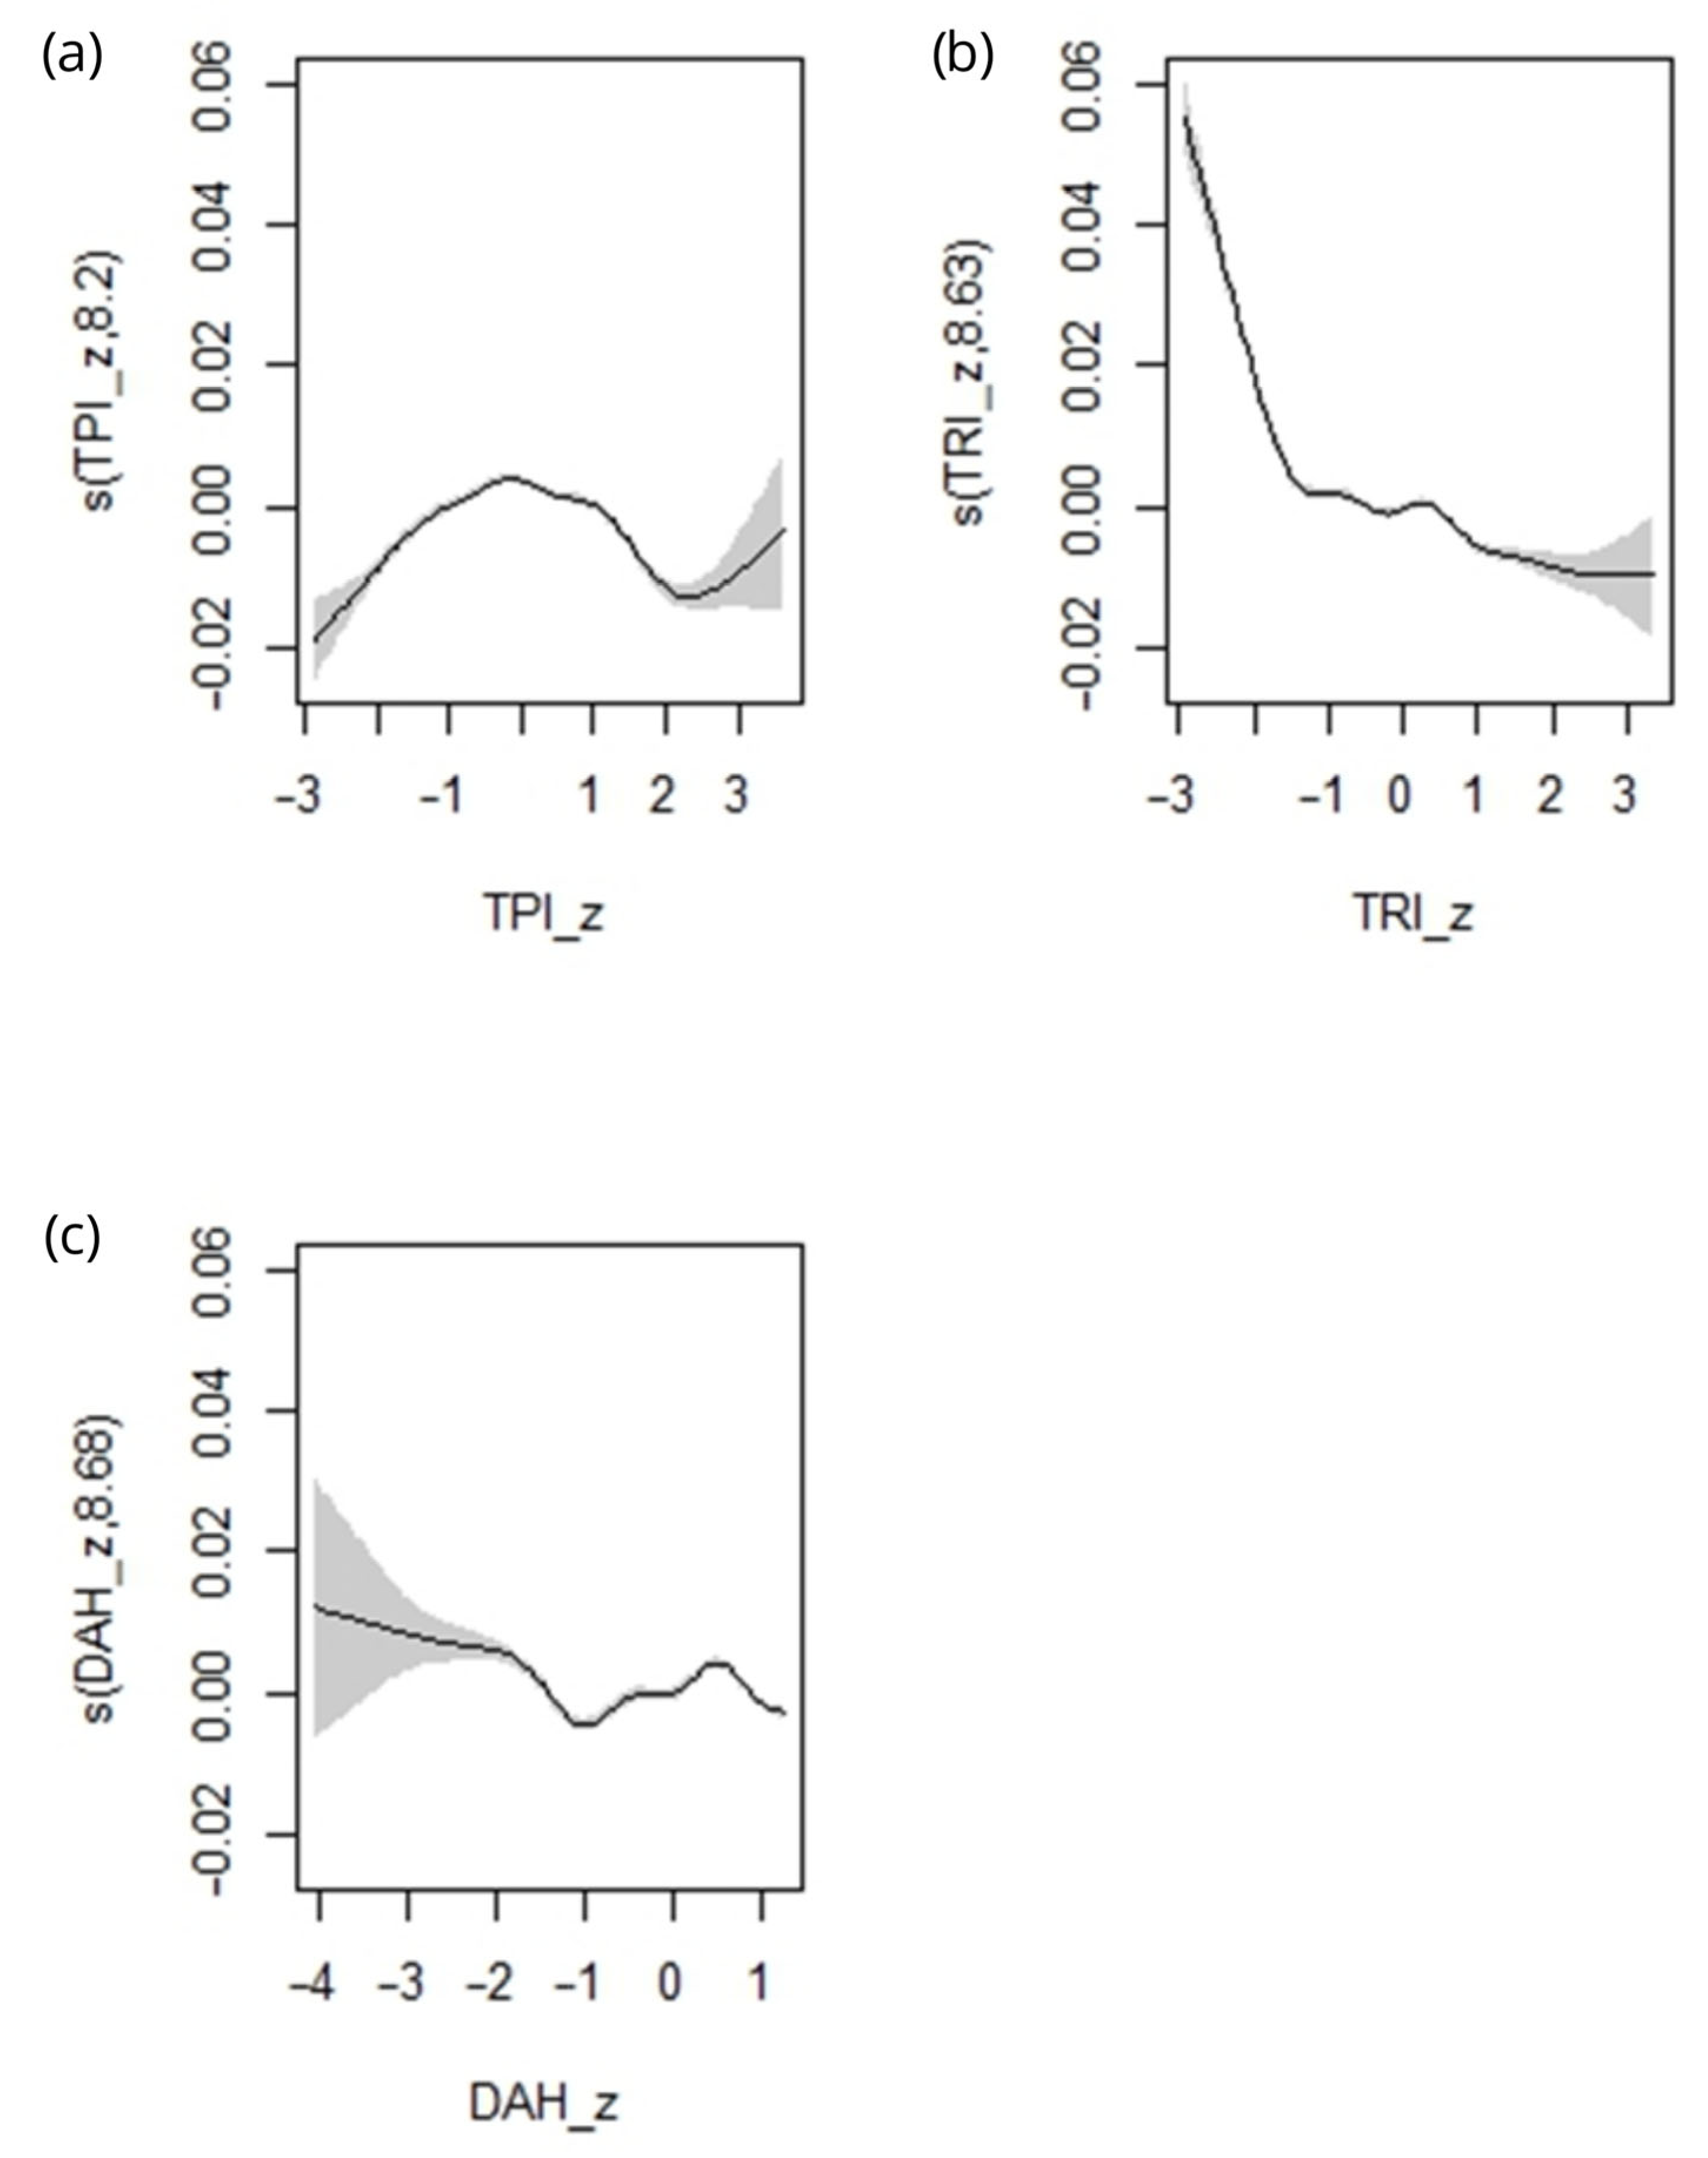
In the case of TPI_z (Figure 2a), NDMI_mean increased from concave values (TPI_z ≈ −3) toward values close to 0. Between TPI_z ≈ 0 and 1, the curve showed a slight decrease, followed by small oscillations between 1 and 2, and an increase again toward convex values (TPI_z > 2). Confidence intervals were wider at the extremes of the gradient (TPI_z < −2 and TPI_z > 2.5).
Figure 2.
Partial dependence plots showing the smoothed functions fitted by the GAM for NDMI_mean as a function of standardized topographic metrics: (a) Topographic Position Index (TPI_z), (b) Terrain Ruggedness Index (TRI_z), and (c) Diurnal Anisotropic Heat Index (DAH_z). Shaded areas represent 95% confidence intervals.
For TRI_z (Figure 2b), NDMI_mean exhibited higher values at the lower end of the gradient (TRI_z ≈ −3), with a pronounced decrease down to approximately −1. Between TRI_z ≈ −1 and 1, NDMI_mean continued to decrease, but with a lower slope. For positive values (TRI_z > 1), the response remained nearly stable. Confidence intervals were narrower within the central range of the gradient (TRI_z between −1 and 1).
With respect to DAH_z (Figure 2c), NDMI_mean decreased between DAH_z ≈ −4 and −2. From −2 up to 1, the curve remained nearly flat, with low-magnitude variations. Confidence intervals widened at the extreme portions of the gradient (DAH_z < −3 and DAH_z > 0.5).
3.2. Comparative Responses of NDVI and NDMI to Topographic Gradients
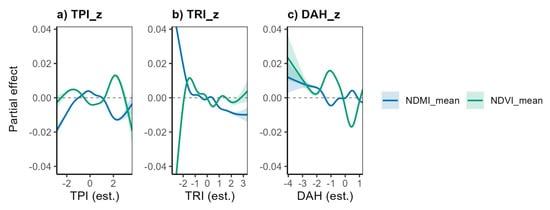
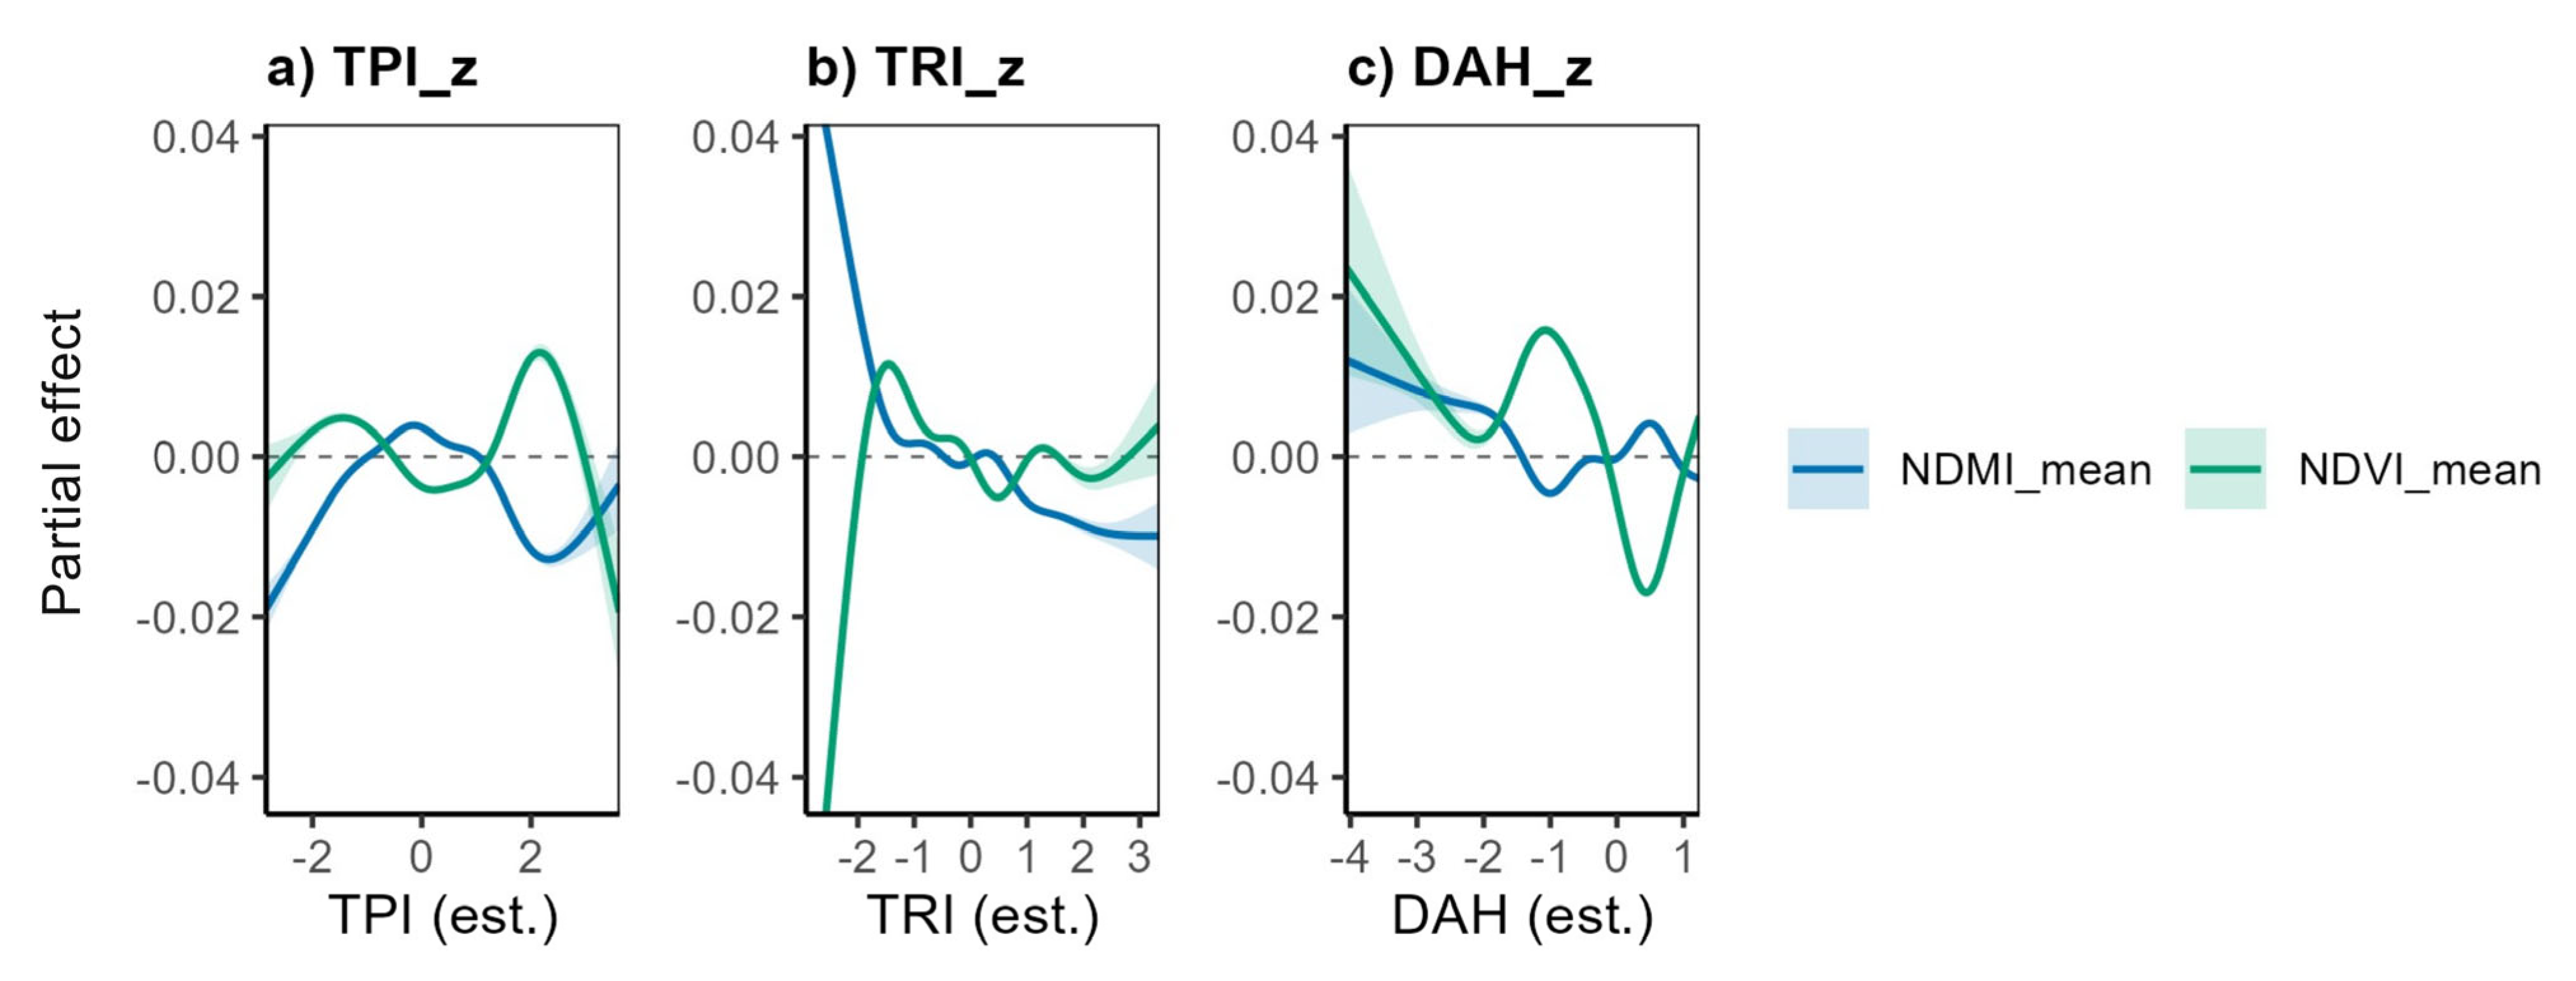
Vegetation indices exhibited non-linear responses to the topographic gradients considered (Figure 3). The response curves of NDVI_mean and NDMI_mean differed in both amplitude and shape across each metric, reflecting differences in their relative sensitivity.
Figure 3.
Comparative partial effect curves showing the non-linear responses of NDVI (green) and NDMI (blue) to standardized topographic metrics: (a) Topographic Position Index (TPI_z), (b) Terrain Ruggedness Index (TRI_z), and (c) Diurnal Anisotropic Heat Index (DAH_z). Shaded areas represent 95% confidence intervals.
For TPI_z (Figure 3a), NDVI_mean showed low-amplitude variations along the gradient, with smooth oscillations between concave values (TPI_z ≈ −3) and convex values (TPI_z > 1). NDMI_mean increased between TPI_z ≈ −2 and 0, followed by lower values around 1 and an additional increase for TPI_z > 1. Confidence intervals were wider at the upper extremes of the gradient (TPI_z > 2). Overall, NDMI_mean exhibited changes in greater amplitude than NDVI_mean in response to this metric.
In the case of TRI_z (Figure 3b), NDVI_mean displayed intermediate-amplitude variations across the entire range of the axis. NDMI_mean showed higher values at the lower end of the gradient (TRI_z ≈ −3), a pronounced decrease down to approximately −1, and a more gradual decrease between −1 and 1, stabilizing thereafter at positive values (TRI_z > 1). Differences between indices were mainly observed in the lower portion of the gradient, where NDMI_mean exhibited larger-magnitude variations.
With respect to DAH_z (Figure 3c), both indices decreased between DAH_z ≈ −4 and −2. Beyond −2, NDVI_mean showed additional low-amplitude variations, whereas NDMI_mean exhibited minimal changes within the range −2 to 1. Confidence intervals were wider at the extreme portions of the gradient.
The analysis was conducted using all pixels with valid NDVI and NDMI values within the study area, without stratification by vegetation type. Overall, NDMI_mean showed greater response amplitude across the three topographic gradients, whereas NDVI_mean exhibited lower-amplitude variations along the same gradients.
4. Discussion
4.1. Influence of Topography on Vegetation Functioning
The influence of topography on radiation, temperature, and water availability is widely recognized as a key determinant of vegetation functioning in Mediterranean and forest ecosystems [1,2,3,14,15,16]. At the global scale, studies conducted across different Mediterranean and temperate biomes have demonstrated that variations in curvature, ruggedness, and exposure generate microenvironmental contrasts capable of modifying local energy balance, water redistribution, and thermal stress intensity, thereby directly affecting canopy physiological performance [1,3,4,7,8]. In Mediterranean regions of Europe, North America, and Australia, these topographic gradients have been shown to operate at fine spatial scales, producing environmental mosaics whose expression depends on canopy structure, species composition, and soil properties [1,2,4,16,20]. This conceptual framework establishes that small topographic variations can translate into significant differences in canopy ecophysiological functioning, particularly under conditions of seasonal water limitation.
The thermal gradient associated with DAH_z generated the clearest response, with marked decreases in both indices under conditions of higher thermal load. The greater sensitivity of NDMI_mean within this gradient is consistent with studies documenting the close relationship between thermal stress, direct radiation, and foliar moisture loss, as well as reductions in vegetation water content [4,13,21,24]. In particular, solar exposure and increased leaf temperature have been shown to enhance evapotranspiration and reduce canopy water-use efficiency, effects that are more strongly expressed in Mediterranean environments subject to seasonal water deficit [13,16,21]. In contrast, NDVI_mean exhibited more limited variations within the mid-range of the thermal gradient, consistent with its lower relative sensitivity under moderate water stress conditions.
The results obtained are consistent with this general framework. The non-linear relationships observed between spectral indices and topographic metrics indicate that TPI_z, TRI_z, and DAH_z represent sufficiently contrasted gradients to generate detectable variation in NDVI_mean and NDMI_mean. The absence of a monotonic pattern between concave and convex positions is consistent with studies emphasizing that the effect of curvature is modulated by interactions among terrain geometry, soil heterogeneity, and canopy structure [1,15].
In the case of terrain ruggedness (TRI_z), the greater amplitude observed in NDMI_mean is consistent with evidence showing that changes in local relief modify radiation distribution and near-surface temperature, exerting a stronger influence on spectral indicators associated with water content than on photosynthetic vigor [2,4,16]. This suggests that altitudinal ruggedness introduces microenvironmental variability relevant to canopy moisture, although its effect is not uniform along the gradient.
Overall, these results support the theoretical framework proposing that topography introduces microenvironmental variability capable of modulating canopy water condition and spectral performance. The greater response amplitude of NDMI_mean compared to NDVI_mean suggests that vegetation responses are more strongly expressed through changes in moisture than in photosynthetic vigor, a pattern widely documented in Mediterranean ecosystems under seasonal water limitation [12,17].
4.2. Differential Sensitivity of NDVI and NDMI to Topographic Gradients
The greater sensitivity of NDMI_mean to TPI_z, TRI_z, and DAH_z is consistent with global evidence indicating that spectral indices associated with vegetation water content respond more directly and rapidly to microenvironmental variations affecting evaporation, water retention, and canopy thermal load than indices linked to photosynthetic vigor [12,18,19]. Studies conducted in Mediterranean ecosystems of Europe and North America have shown that NDMI and other shortwave infrared–based indices more accurately capture the effects of solar exposure, local topography, and thermal heterogeneity on vegetation water status, particularly under prolonged summer stress conditions [4,12,39,40]. In this context, the marked decrease in NDMI_mean observed in sectors of higher thermal exposure in this study is consistent with patterns reported for Mediterranean landscapes, where direct radiation and leaf temperature strongly control canopy water dynamics.
In contrast, NDVI_mean showed lower-amplitude variations across the same topographic gradients, suggesting greater relative stability of photosynthetic vigor under microtopographic variation. This behavior has been documented in multiple studies indicating that NDVI tends to saturate in relatively dense vegetation cover and responds less sensitively to moderate fluctuations in water availability or temperature compared to water-related indices [8,17,39]. The differential sensitivity observed in this study reinforces the notion that distinct terrain attributes differentially affect physiological components of vegetation, highlighting the complementary value of NDVI and NDMI for interpreting canopy ecohydrological functioning in Mediterranean mountain environments.
4.3. Ecological Implications
Although the topographic effects detected by the models explained a relatively small proportion of total variability (R2 < 0.02), they indicate that TPI_z, TRI_z, and DAH_z are associated with detectable differences in spectral indices within the observed range. This result is consistent with studies suggesting that topographic gradients often operate as secondary modulators of vegetation functioning, generating fine-scale environmental heterogeneity without necessarily explaining large proportions of total variance in spectral or structural indicators [1,3,14]. In Mediterranean and mountainous ecosystems, such subtle but consistent influences acquire ecological relevance through their interaction with dominant climatic drivers, particularly under scenarios of recurrent water stress [2,21].
The variations in NDMI_mean and NDVI_mean along gradients represented by TPI_z, TRI_z, and DAH_z reflect environmental differences linked to terrain geometry, particularly with respect to thermal exposure and local altitudinal variability. Although these differences do not allow inference of specific functional processes or detailed structural patterns of vegetation, the results suggest that topographic gradients contribute to generating differentiated microenvironmental conditions within the landscape, as documented in other Mediterranean settings with complex topography [14,20,21,22]. In this regard, recent studies highlight that integrating high-resolution topographic information with optical sensor time series enables the identification of subtle spatial transitions in canopy functioning, complementing traditional monitoring approaches based exclusively on regional climatic gradients [1,4,8].
The limited explanatory power of R2 underscores that, in this type of system, spectral indices capture only part of the environmental heterogeneity associated with relief, and their interpretation should consider the complementary nature of the topographic metrics used. Within this framework, integrating Sentinel-2 time series with terrain-derived parameters constitutes a useful tool for identifying emerging spatial patterns in canopy spectral response and for contextualizing the influence of relief under scenarios of progressive aridification, particularly in landscapes where small topographic variations generate locally relevant microenvironmental gradients [3,14,23].
5. Conclusions
This study evaluated how the topographic metrics TPI_z, TRI_z, and DAH_z modulate vegetation spectral responses in a Mediterranean ravine landscape, demonstrating that topography introduces detectable non-linear variation in NDVI_mean and NDMI_mean at fine spatial scales. In particular, the results show that NDMI_mean exhibits significantly greater sensitivity to topographic gradients, especially along the thermal exposure gradient represented by DAH_z, with marked decreases under conditions of higher thermal load. This pattern indicates that canopy water condition responds directly to solar exposure and topographically induced thermal stress. In contrast, NDVI_mean displayed more stable and lower-amplitude responses across the same gradients, suggesting lower relative sensitivity of photosynthetic vigor to moderate microtopographic variation. These differences confirm that spectral indices capture complementary components of canopy functioning and reinforce the relevance of employing multiple indicators to characterize spatial heterogeneity in Mediterranean ecosystems.
The results also indicate that, although the variance explained by the models was limited, gradients associated with terrain form, altitudinal ruggedness, and thermal load provide relevant information for interpreting the microenvironmental variability experienced by vegetation in complex-relief landscapes. In Mediterranean ecosystems, where water availability constitutes the primary limiting factor for much of the year, small topographic variations can modify water redistribution, incident radiation, and thermal stress, conditioning key ecophysiological processes and generating local-scale environmental mosaics.
Nevertheless, this study presents certain limitations that should be considered when interpreting the results. First, the use of mean spectral indices derived from Sentinel-2 implies spatial and temporal integration that may attenuate signals associated with specific ecophysiological processes or individual species responses. Second, the low explained variance suggests that other factors not explicitly considered such as floristic composition, soil properties, canopy structure, or disturbance history also contribute substantially to the observed variability. Finally, the analysis focused on specific topographic metrics and a defined spatial scale; therefore, the identified patterns should not be directly extrapolated to other contexts without additional evaluation.
Despite these limitations, the applied approach based on Sentinel-2 time series and non-linear models constitutes a replicable methodological framework for integrating topography and remote sensing in the spatial analysis of canopy functioning. From an applied perspective, these results provide relevant inputs to support adaptation and mitigation measures in Mediterranean landscapes subject to limiting environmental conditions. In particular, identifying thermally protected sectors, concave areas, and zones with higher water retention can support spatial prioritization of conservation and restoration actions, the design of monitoring strategies focused on environmental microrefugia, and the assessment of canopy vulnerability under scenarios of progressive aridification. In this way, integrating topographic metrics and spectral time series offers a complementary tool for the management and monitoring of Mediterranean ecosystems characterized by high environmental heterogeneity.
Author Contributions
Conceptualization, J.G.-L. and L.D.-G.; Methodology, J.G.-L.; Software, J.G.-L. and W.P.-M.; Validation, J.G.-L., L.D.-G. and W.P.-M.; Formal analysis, J.G.-L.; Investigation, J.G.-L., L.D.-G. and W.P.-M.; Resources, L.D.-G. and W.P.-M.; Data curation, J.G.-L.; Writing—original draft, J.G.-L.; Writing—review & editing, J.G.-L., L.D.-G. and W.P.-M.; Visualization, J.G.-L.; Supervision, L.D.-G. and W.P.-M.; Project administration, L.D.-G. and W.P.-M.; Funding acquisition, L.D.-G. and W.P.-M. All authors have read and agreed to the published version of the manuscript.
Funding
This research was funded by Anglo American Chile, contract number 5.23.0022.1 “Servicio de Estudios de Conservacion de Humedales Altoandinos Hijuela C en Santuario de la Naturaleza Los Nogales”.
Data Availability Statement
Restrictions apply to the availability of these data. The datasets were obtained from Anglo American Chile under a service contract and are therefore not publicly available. Data may be requested from the corresponding author with the permission of Anglo American Chile.
Conflicts of Interest
The authors declare no conflicts of interest.
References
- Moeslund, J.E.; Arge, L.; Bøcher, P.K.; Dalgaard, T.; Svenning, J.-C. Topographically controlled soil moisture is the primary driver of local vegetation patterns across a lowland region. Ecology 2013, 94, 2116–2125. [Google Scholar] [CrossRef] [Scilit]
- McNichol, B.H.; Wang, R.; Hefner, A.; Helzer, C.; McMahon, S.M.; Russo, S.E. Topography-driven microclimate gradients shape forest structure, diversity, and composition in a temperate refugial forest. Plant-Environ. Interact. 2024, 5, e10153. [Google Scholar] [CrossRef] [Scilit]
- Chen, J.; Saunders, S.C.; Crow, T.R.; Naiman, R.J.; Brosofske, K.D.; Mroz, G.D.; Brookshire, B.L.; Franklin, J.F. Microclimate in forest ecosystem and landscape ecology. BioScience 1999, 49, 288–297. [Google Scholar] [CrossRef] [Scilit]
- Rita, A.; Bonanomi, G.; Allevato, E.; Borghetti, M.; Cesarano, G.; Mogavero, V.; Rossi, S.; Saulino, L.; Zotti, M.; Saracino, A. Topography modulates near-ground microclimate in the Mediterranean Fagus sylvatica treeline. Sci. Rep. 2021, 11, 8122. [Google Scholar] [CrossRef] [Scilit]
- Garreaud, R.D.; Boisier, J.P.; Rondanelli, R.; Montecinos, A.; Sepúlveda, H.H.; Veloso-Aguila, D. The Central Chile Mega Drought (2010–2018): A climate dynamics perspective. Int. J. Climatol. 2020, 40, 421–439. [Google Scholar] [CrossRef] [Scilit]
- Chen, R.; Yin, G.; Liu, G.; Li, J.; Verger, A. Evaluation and Normalization of Topographic Effects on Vegetation Indices. Remote Sens. 2020, 12, 2290. [Google Scholar] [CrossRef] [Scilit]
- Yin, G.; Verger, A.; Filella, I.; Peñuelas, J. Aspect matters: Unraveling microclimate impacts on mountain greenness. Geophys. Res. Lett. 2023, 50, e2023GL105879. [Google Scholar] [CrossRef] [Scilit]
- Ma, Y.; He, T.; McVicar, T.R.; Liang, S.; Liu, T.; Peng, W.; Song, D.; Tian, F. Quantifying how topography impacts vegetation indices at various spatial and temporal scales. Remote Sens. Environ. 2024, 312, 114311. [Google Scholar] [CrossRef] [Scilit]
- Herrault, P.-A.; Ullmann, A.; Ertlen, D. Combined effects of topography, soil moisture, and snow cover regimes on growth responses of grasslands. Biogeosciences 2025, 22, 705–724. [Google Scholar] [CrossRef] [Scilit]
- McNichol, B.H. Effects of Topography and Microclimate on Plant Community Structure in a Great Plains Refugial Forest. Ph.D. Thesis, The University of Nebraska-Lincoln, Lincoln, Nebraska, 2023. [Google Scholar]
- Pettorelli, N.; Ryan, S.; Mueller, T.; Bunnefeld, N.; Jedrzejewska, B.; Lima, M.; Kausrud, K. The Normalized Difference Vegetation Index (NDVI): Unforeseen successes in animal ecology. Clim. Res. 2011, 46, 15–27. [Google Scholar] [CrossRef] [Scilit]
- Gao, B.-C. NDWI—A Normalized Difference Water Index for remote sensing of vegetation liquid water from space. Remote Sens. Environ. 1996, 58, 257–266. [Google Scholar] [CrossRef] [Scilit]
- Adeyeri, O.E.; Folorunsho, A.H.; Ayegbusi, K.I.; Bobde, V.; Adeliyi, T.E.; Ndehedehe, C.E.; Akinsanola, A.A. Land surface dynamics and meteorological forcings modulate land surface temperature characteristics. Sustain. Cities Soc. 2024, 101, 105072. [Google Scholar] [CrossRef] [Scilit]
- Dobrowski, S.Z. A climatic basis for microrefugia: The influence of terrain on climate. Glob. Change Biol. 2011, 17, 1022–1035. [Google Scholar] [CrossRef] [Scilit]
- Böhner, J.; Antonić, O. Land-surface parameters specific to topo-climatology. Dev. Soil Sci. 2009, 33, 195–226. [Google Scholar]
- Jucker, T.; Hardwick, S.R.; Both, S.; Elias, D.M.; Ewers, R.M.; Milodowski, D.T.; Swinfield, T.; Coomes, D.A. Canopy structure and topography jointly constrain the microclimate of human-modified tropical landscapes. Glob. Change Biol. 2018, 24, 5243–5258. [Google Scholar] [CrossRef] [Scilit] [PubMed]
- Pettorelli, N. The Normalized Difference Vegetation Index. 2013. Available online: https://academic.oup.com/book/8114 (accessed on 10 November 2025).
- Kakapor, V.; Fekrat, H.; Sadeghi, M.; Valizadeh Kamran, K.H.; Bayati Khatibi, M. Evaluating the performance of remote sensing to monitor the severity of drought through the comparison of three drought severity indicators (NDDI, NDWI and NDVI) in the Karkheh basin. Adv. Eng. Days 2024, 8, 6. [Google Scholar]
- Peng, L.; Wan, Y.; Shi, H.; Anwaier, A.; Shi, Q. Influence of climate, topography, and hydrology on vegetation Distribution Patterns—Oasis in the Taklamakan Desert hinterland. Remote Sens. 2023, 15, 5299. [Google Scholar] [CrossRef] [Scilit]
- Lenoir, J.; Hattab, T.; Pierre, G. Climatic microrefugia under anthropogenic climate change: Implications for species redistributionpersistence. Ecol. Lett. 2017, 20, 1339–1357. [Google Scholar] [CrossRef] [Scilit]
- Zellweger, F.; De Frenne, P.; Lenoir, J.; Vangansbeke, P.; Verheyen, K.; Bernhardt-Römermann, M.; Baeten, L.; Hedl, R.; Berki, I.; Brunet, J.; et al. Forest microclimate dynamics drive plant responses to climate warming. Science 2020, 368, 772–775. [Google Scholar] [CrossRef] [Scilit]
- Morelli, T.L.; Daly, C.; Dobrowski, S.Z.; Dulen, D.M.; Ebersole, J.L.; Jackson, S.T.; Lundquist, J.D.; Millar, C.I.; Maher, S.P.; Monahan, W.B.; et al. Managing climate change refugia for climate adaptation. PLoS ONE 2020, 15, e0239653. [Google Scholar]
- Saatkamp, A.; Argagnon, O.; Noble, V.; Finocchiaro, M.; Meineri, E. Climate change impacts on Mediterranean vegetation are amplified at low altitudes. Glob. Ecol. Biogeogr. 2023, 32, 1113–1126. [Google Scholar] [CrossRef] [Scilit]
- Ashcroft, M.B.; Gollan, J.R. Moisture, thermal inertia, and the spatial distributions of near-surface soil and air temperatures: Understanding factors that promote microrefugia. Agric. For. Meteorol. 2013, 176, 77–89. [Google Scholar] [CrossRef] [Scilit]
- Luebert, F.; Pliscoff, P. Sinopsis Bioclimática y Vegetacional de Chile; Editorial Universitaria: Santiago, Chile, 2006; 316p. [Google Scholar]
- Cristea, N.C.; Breckheimer, I.; Raleigh, M.S.; HilleRisLambers, J.; Lundquist, J.D. An evaluation of terrain-based downscaling of fractional snow covered area data sets based on LiDAR-derived snow data and orthoimagery. Water Resour. Res. 2017, 53, 6802–6820. [Google Scholar] [CrossRef] [Scilit]
- Kvitek, R.; Lampietro, P.; Summers-Morris, E. NOAA Technical Report: Integrated Spatial Data Modeling Tools for Auto-Classification and Delineation of Species-Specific Habitat Maps from High-Resolution, Digital Hydrographic Data. 2003. Available online: http://seafloor.otterlabs.org/publications/Kvitek_NA17OC2586_Rpt.pdf (accessed on 5 August 2024).
- Muddarisna, N.; Yuniwati, E.D.; Masruroh, H.; Oktaviansyah, A.R. An automated approach using Topographic Position Index (TPI) for landform mapping (case study: GedeWatershed, Malang Regency, East Java, Indonesia). IOP Conf. Ser. Earth Environ. Sci. 2020, 412, 012027. [Google Scholar] [CrossRef] [Scilit]
- Posit Team. RStudio: Integrated Development Environment for R.; Posit Software, PBC: Boston, MA, USA, 2023. [Google Scholar]
- Hijmans, R.J. Terra: Spatial Data Analysis, R package version 1.7-39; 2023. Available online: https://cran.r-project.org/web/packages/terra/index.html (accessed on 12 December 2025).
- Pebesma, E. Simple Features for R: Standardized Support for Spatial Vector Data. R J. 2018, 10, 439–446. [Google Scholar] [CrossRef] [Scilit]
- Wickham, H.; Averick, M.; Bryan, J.; Chang, W.; D’Agostino McGowan, L.; François, R.; Grolemund, G.; Hayes, A.; Henry, L.; Hester, J.; et al. Welcome to the tidyverse. J. Open Source Softw. 2019, 4, 1686. [Google Scholar] [CrossRef] [Scilit]
- Gorelick, N.; Hancher, M.; Dixon, M.; Ilyushchenko, S.; Thau, D.; Moore, R. Google Earth Engine: Planetary-scale geospatial analysis for everyone. Remote Sens. Environ. 2017, 202, 18–27. [Google Scholar] [CrossRef] [Scilit]
- Conrad, O.; Bechtel, B.; Bock, M.; Dietrich, H.; Fischer, E.; Gerlitz, L.; Wehberg, J.; Wichmann, V.; Böhner, J. System for Automated Geoscientific Analyses (SAGA) v. 2.1.4. Geosci. Model Dev. 2015, 8, 1991–2007. [Google Scholar] [CrossRef] [Scilit]
- Weiss, A. Topographic position and landforms analysis. In Proceedings of the ESRI User Conference, San Diego, CA, USA, 2001. [Google Scholar]
- Riley, S.J.; DeGloria, S.D.; Elliot, R. A terrain ruggedness index that quantifies topographic heterogeneity. Intermt. J. Sci. 1999, 5, 23–27. [Google Scholar]
- Iwahashi, J.; Pike, R.J. Automated classifications of topography from DEMs by an unsupervised nested-means algorithm and a three-part geometric signature. Geomorphology 2006, 86, 409–440. [Google Scholar] [CrossRef] [Scilit]
- Wood, S.N. Generalized Additive Models: An Introduction with R, 2nd ed.; Chapman & Hall/CRC: Boca Raton, FL, USA, 2017. [Google Scholar]
- Fensholt, R.; Sandholt, I. Derivation of a shortwave infrared water stress index from MODIS near- and shortwave infrared data in a semiarid environment. Remote Sens. Environ. 2003, 87, 111–121. [Google Scholar] [CrossRef] [Scilit]
- Vicente-Serrano, S.M.; Beguería, S.; López-Moreno, J.I. A multiscalar drought index sensitive to global warming: The Standardized Precipitation evapotranspiration Index. J. Clim. 2009, 23, 1696–1718. [Google Scholar] [CrossRef] [Scilit]

Disclaimer/Publisher’s Note: The statements, opinions and data contained in all publications are solely those of the individual author(s) and contributor(s) and not of MDPI and/or the editor(s). MDPI and/or the editor(s) disclaim responsibility for any injury to people or property resulting from any ideas, methods, instructions or products referred to in the content. |
© 2026 by the authors. Licensee MDPI, Basel, Switzerland. This article is an open access article distributed under the terms and conditions of the Creative Commons Attribution (CC BY) license.