


Abstract
This manuscript presents a transferable and reproducible methodology for quantitative 3D tree-structure mensuration and transparent, rule-based decision support for tree risk management. The workflow integrates (i) Structure-from-Motion/Multi-View Stereo (SfM–MVS) reconstruction from multi-view imagery, (ii) independent referencing to ensure metric scaling and a consistent local frame, and (iii) point cloud analytics to derive branch-level geometric descriptors (e.g., base diameter, length, inclination, slenderness, and projected reach). A clear rule-based layer operationalizes Tree Risk Assessment Qualification (TRAQ)-style risk components and As Low As Reasonably Practicable (ALARP) principles to map geometry and exposure into auditable management recommendations (e.g., monitoring intervals, pruning/weight reduction, supplemental support, and exclusion-zone planning). To provide a real-data example, the demonstration uses the public Fuji-SfM apple orchard dataset, including three neighboring trees with partially overlapping crowns for tree instance extraction and subsequent TRAQ/ALARP scenarios on an outer tree. The proposed decision layer is intentionally based on external geometry and exposure; internal decay indicators and species-specific mechanical properties (e.g., Modulus of Elasticity (MOE), Modulus of Rupture (MOR)) are outside this demonstration and should be incorporated via complementary diagnostics in operational deployments.
1. Introduction
Trees in managed forests, parks, road corridors, and urban–peri-urban interfaces deliver substantial ecological and social benefits, yet they also pose a non-negligible safety risk when structural parts fail under wind, decay, soil saturation, or cumulative mechanical fatigue. Tree risk management therefore sits at the intersection of ecology, biomechanics, public safety, and operations: managers must preserve tree value while reducing the likelihood and consequences of harm to people, vehicles, and infrastructure. In practice, many jurisdictions recommend or require that tree owners apply a systematic approach to identifying hazards, evaluating risk, and documenting proportionate mitigation actions within feasible operational constraints [1,2,3].
A widely used structured framework in arboriculture is the ISA Tree Risk Assessment Qualification (TRAQ), which decomposes tree-related “risk” into a likelihood of failure, a likelihood of impact on a target, and the expected consequences, thus supporting transparent and defensible management decisions. A complementary principle adopted in public safety settings is ALARP (As Low As Reasonably Practicable), which emphasizes reducing risk to a tolerable level through practicable interventions and/or exposure management. In operational assessments, TRAQ judgments also consider species characteristics, physiological condition, and potential internal defects; the present workflow focuses on quantifying the external geometric component in a reproducible way as an input to (not a replacement for) holistic arboricultural evaluation [1,2,4].
Advances in low-cost 3D reconstruction (SfM–MVS) provide a practical path to derive geometric descriptors relevant to tree-structure mensuration and risk screening (e.g., trunk/branch diameters, branch lengths and inclination angles, and reach relative to potential targets) [5,6]. However, camera-based reconstructions are sensitive to imaging geometry and, like any SfM model, are defined only up to a similarity transform (rotation, translation, and scale) [7]. Importantly, modern SfM software (including COLMAP) estimates camera poses and performs self-calibration of camera intrinsics directly from the images via bundle adjustment; no prior ‘internal orientation’ parameters or pre-calibration are required [6]. For metric mensuration, what is required is an independent metric reference (e.g., scale bars/control points or a known acquisition geometry) and a consistent local frame for reporting (Section 2.3 and Section 2.4) [7].
Tree documentation and structural modeling can be supported by multiple geomatics modalities. Terrestrial laser scanning (TLS) and related quantitative structure modeling (QSM) approaches can reconstruct stem and crown architecture and have been widely used to estimate tree- and branch-level metrics [8,9,10]. Airborne/UAV LiDAR, mobile mapping/SLAM, and close-range photogrammetry provide complementary options with different trade-offs in cost, logistics, coverage, and occlusion [11,12,13]. In this study we focus on a photogrammetry-driven workflow because of its low-cost instrumentation and reproducibility, while keeping the analytics stage compatible with any metric point cloud.
Once a metrically referenced point cloud or mesh is available, 3D analytics can extract descriptors that are directly meaningful for risk-oriented interpretation and management. Examples include branch base diameter, branch length, inclination relative to gravity, slenderness, and projected reach (strike-zone proxy), as well as measures derived from local neighborhoods or principal directions [14]. Open-source 3D processing libraries provide a practical foundation for such analytics at scale [15], while density-based clustering and related methods can support segmentation and branch-level organization in complex scenes [16]. Critically, the goal in a risk-management context is not only to compute geometry, but to compute the geometry that is decision-relevant—i.e., descriptors that can be mapped to plausible failure modes, impact potential, and consequence categories in a way that can be explained, reviewed, and reproduced.
Translating geometry into management actions introduces another long-standing source of inconsistency: thresholds and recommendations are often applied implicitly, informed by experience, local practice, or standards that are not operationalized in a machine-readable form. Arboricultural standards and best-management practices, however, already encode many practical decision elements—particularly for pruning strategies and supplemental support systems [17,18,19,20]. A method that makes such thresholds explicit and traceable can reduce ambiguity: a rule-based layer can link measurable geometry and exposure assumptions to TRAQ-style components and then map the resulting risk state to recommendations aligned with ALARP reasoning. Importantly, the objective is to provide a transparent action plan that is (i) auditable, (ii) repeatable given the same inputs, and (iii) suitable for sensitivity testing when exposure assumptions or operational constraints change.
This manuscript presents a transferable and reproducible methodology for quantitative 3D tree-structure mensuration and transparent, rule-based decision support for tree risk management. The workflow integrates: (i) SfM–MVS reconstruction from multi-view imagery, (ii) independent referencing for metric scaling and consistent local framing, and (iii) point cloud/mesh analytics to derive branch-level geometric descriptors that serve as inputs to a rule-based TRAQ/ALARP decision layer. The decision layer operationalizes risk components (failure, impact, consequences) and maps them—together with explicit target/exposure assumptions—into auditable management recommendations (e.g., monitoring intervals, pruning/weight reduction, supplemental support, and exclusion-zone planning) consistent with standards and best practices [17,18,19,20,21,22,23,24,25]. To provide a real-data example, we demonstrate the complete pipeline on the publicly available Fuji-SfM apple orchard dataset [26], which contains multi-view imagery and an SfM-derived XYZRGB point cloud acquired in an orchard row where neighboring tree crowns partially overlap. This setting allows us to (a) demonstrate tree instance extraction for three adjacent trees and (b) apply the TRAQ/ALARP decision layer to an outer tree under configurable target/exposure scenarios (e.g., pedestrian zone, road/parking, infrastructure), highlighting how recommended measures respond predictably to changes in exposure assumptions and enabling transparent decision documentation.
2. Materials and Methods
2.1. Overview of the Reproducible Workflow
This study presents a transferable, end-to-end workflow for (i) acquiring or reusing multi-view imagery of tree structures, (ii) reconstructing a metrically consistent 3D model using an SfM–MVS pipeline, (iii) extracting branch-level geometric descriptors from point cloud/mesh analytics, and (iv) translating these descriptors into transparent, auditable management recommendations through a rule-based TRAQ-style risk layer and ALARP-consistent target management logic. The methodological structure follows the same modular logic of: SfM–MVS reconstruction → independent referencing/scaling → branch metric extraction → decision rules.
The core analysis (branch extraction + scenario evaluation) is executed via a single command-line call to the provided Python script. For the Fuji demonstration, a preparatory helper script first exports per-tree PLY files from the public orchard point cloud, after which the main analysis script is run on the selected tree point cloud.
Example main-analysis command (Windows): python pipeline_PAPER.py --images <PATH_TO_IMAGES> --colmap <PATH_TO_COLMAP_EXE> --work <WORK_DIR> --skip_colmap --prefer_dense --preset paper_major --auto_eps.
All required inputs, outputs, exact script names, and default parameters used in this manuscript are included in the Supplementary Materials.
2.2. Real Demonstration Dataset (Fuji-SfM Apple Orchard; Multi-Tree Instance Extraction and TRAQ/ALARP Scenarios)
Fuji-SfM Real-Tree Dataset and Tree Instance Extraction
For the real-data example we used the RGB point cloud distributed with the Fuji-SfM apple orchard dataset [26], provided as a plain-text table of x, y, z, R, G, B values. The point cloud is SfM-derived and reported in metric units (meters), allowing direct mensuration once a consistent local frame is defined. In the present case study, this public point cloud—not a newly recomputed dense reconstruction—was the direct input to the subsequent analysis. Prior to analysis, we translate the coordinates so that the local ground is z = 0 and define a local horizontal frame for plan-view analyses. To demonstrate multi-tree instance extraction under partial crown overlap, stems are detected by clustering points in a near-ground slice (0–0.8 m above the ground), after which points are assigned to the nearest detected stem and cropped within a maximum horizontal radius (here 3.0 m) to export per-tree point clouds.
Example command (Supplementary script): python fuji_sfm_extract_trees.py --fuji_xyzrgb “Fuji_apple_trees_point_cloud.txt” --out_dir “./fuji_demo” --export_n 3 --select_mode middle --max_xy_radius 3.0 --make_plan_png.
This step produces per-tree PLY files (tree_01.ply–tree_03.ply) and a plan-view diagnostic plot of the detected stems. In the released Fuji script, the number of neighboring trees exported is user-defined (parameter “--export_n”, here 3) unless explicit stem IDs are supplied; stems are ordered along the orchard-row axis, and a consecutive left/middle/right block is selected according to “--select_mode”. The three exported trees are adjacent along an orchard row and include partially overlapping crowns, which makes the instance extraction step visually verifiable. In this study, the outer (edge-of-row) tree among the selected triplet (tree_01) was used for branch-level mensuration and the TRAQ/ALARP scenarios, while tree_02 and tree_03 are retained to illustrate separation under crown overlap.
2.3. SfM–MVS Reconstruction Logic and Dense Point Cloud Input
2.3.1. Sparse Model Generation and Camera-Center Anchors (COLMAP)
The generic image-to-geometry workflow starts from a standard COLMAP sparse reconstruction using SIFT-based feature extraction, exhaustive matching, and incremental mapping. Camera intrinsics and extrinsics are estimated from the image network via bundle adjustment (self-calibration), so no prior camera calibration or pre-defined internal orientation elements are required [6,7]. When metric alignment is needed, the selected sparse component is converted to text format so that camera centers can be used as anchors for the similarity transform described in Section 2.4.
- colmap feature_extractor --database_path <db> --image_path <images>
- colmap exhaustive_matcher --database_path <db>
- colmap mapper --database_path <db> --image_path <images> --output_path <sparse>
- colmap model_converter --input_path <sparse/0> --output_path <model_txt> --output_type TXT
2.3.2. Dense Point Cloud Consumed by the Released Pipeline
The released analysis script does not itself run COLMAP dense stereo. Instead, it consumes an existing dense point cloud (e.g., a dense/fused.ply file under the work directory, an openmvs/scene_dense.ply file, or an explicitly provided “--dense_ply” path) together with the corresponding sparse model. In the public Fuji-SfM demonstration reported in Table 1 and Figure 1, Figure 2 and Figure 3, no dense reconstruction was recomputed by the authors: the branch analytics were applied directly to the public metrically scaled XYZRGB orchard point cloud distributed with the Fuji-SfM dataset [26]. For readers applying the workflow to their own images, any metrically consistent dense PLY can be used; in our in-house tests, OpenMVS dense output was used as a convenient CPU-friendly source.
Table 1.
Derived geometric descriptors for the trunk and detected branches (Fuji tree_01).
Figure 1.
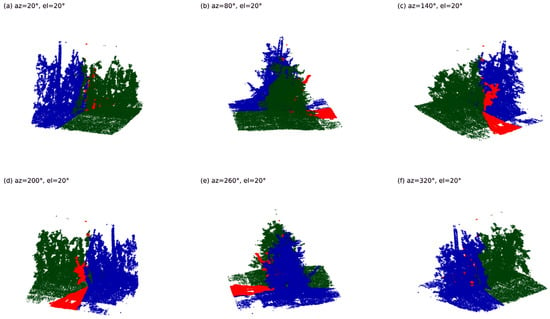
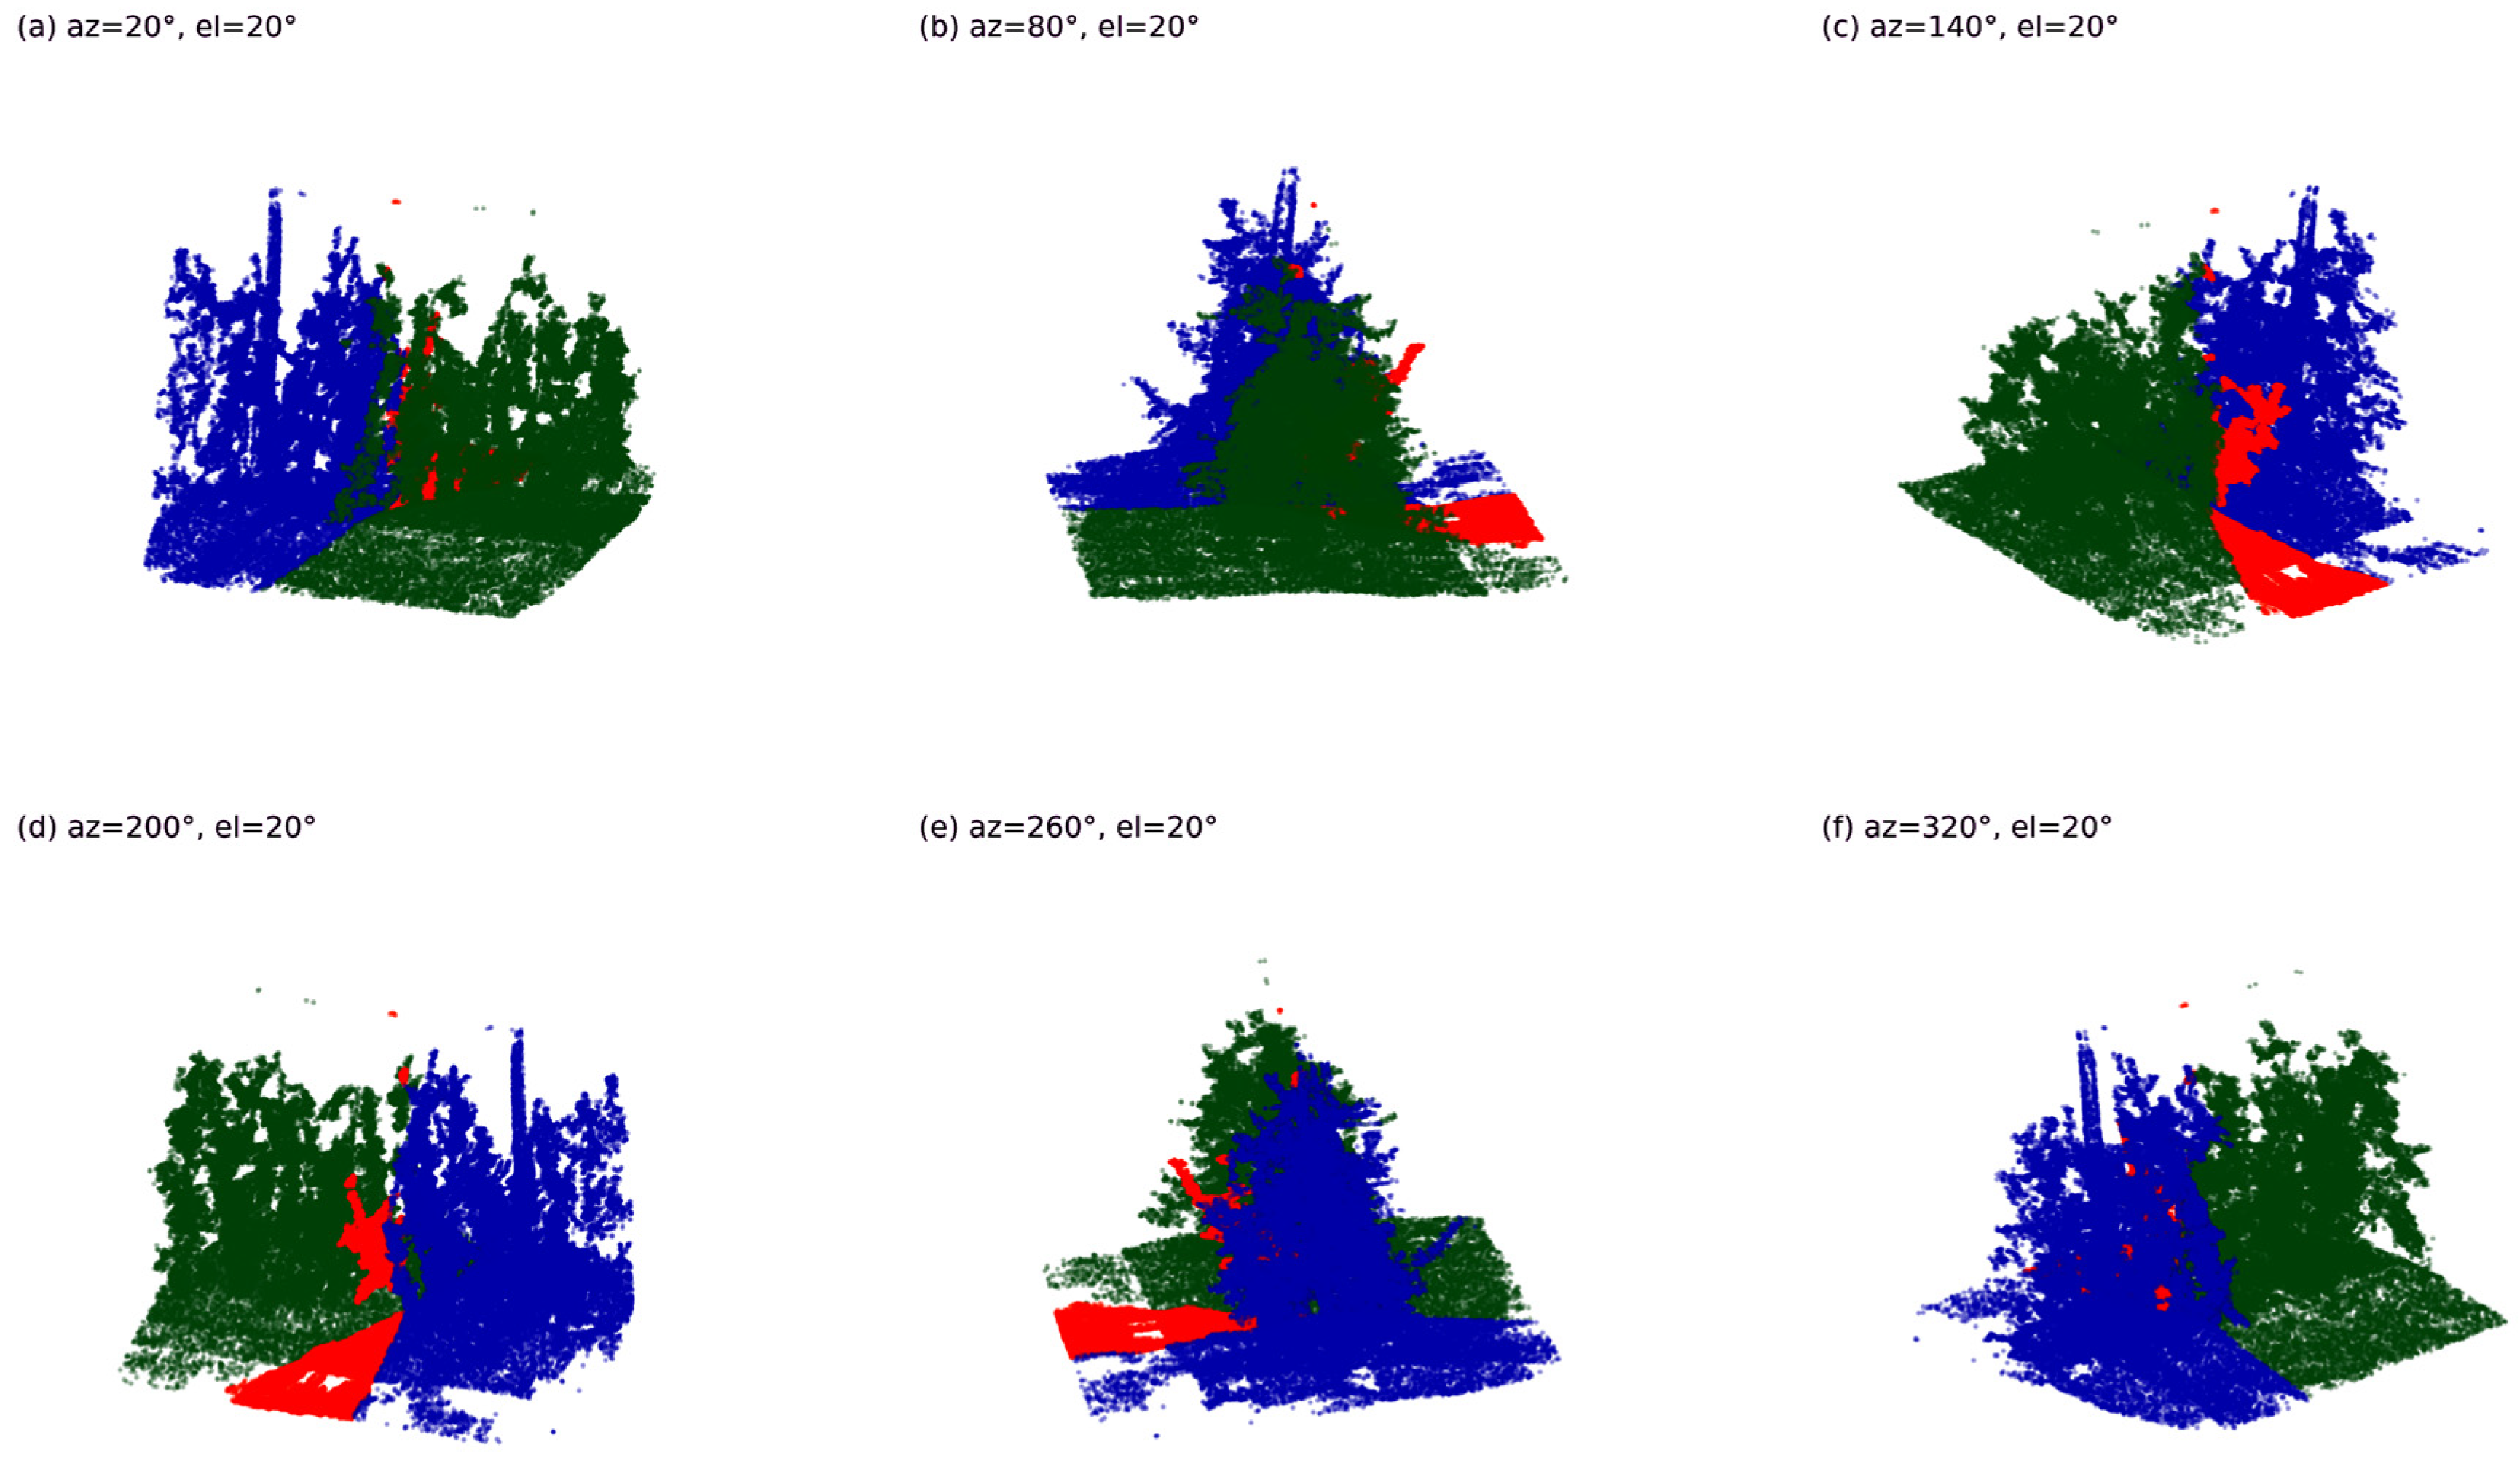
Representative rendered views (a–f) of a real-tree dataset (Fuji-SfM apple orchard point cloud) used to demonstrate tree instance segmentation in a crowded canopy setting (three neighboring trees). Different colors denote the three segmented tree instances. Each panel is annotated with view azimuth and elevation (degrees) for unambiguous interpretation; mild background contrast enhancement was applied to improve readability.
Figure 2.
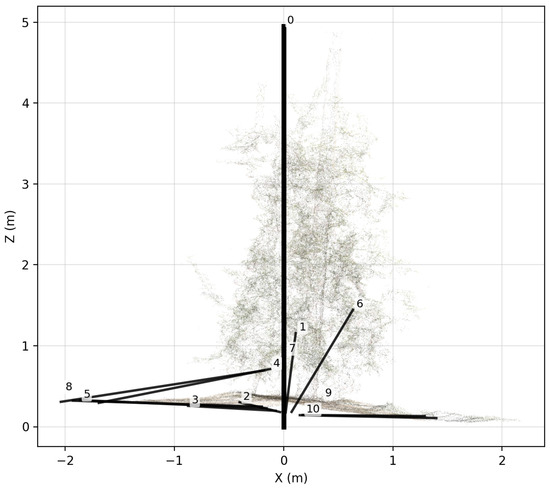
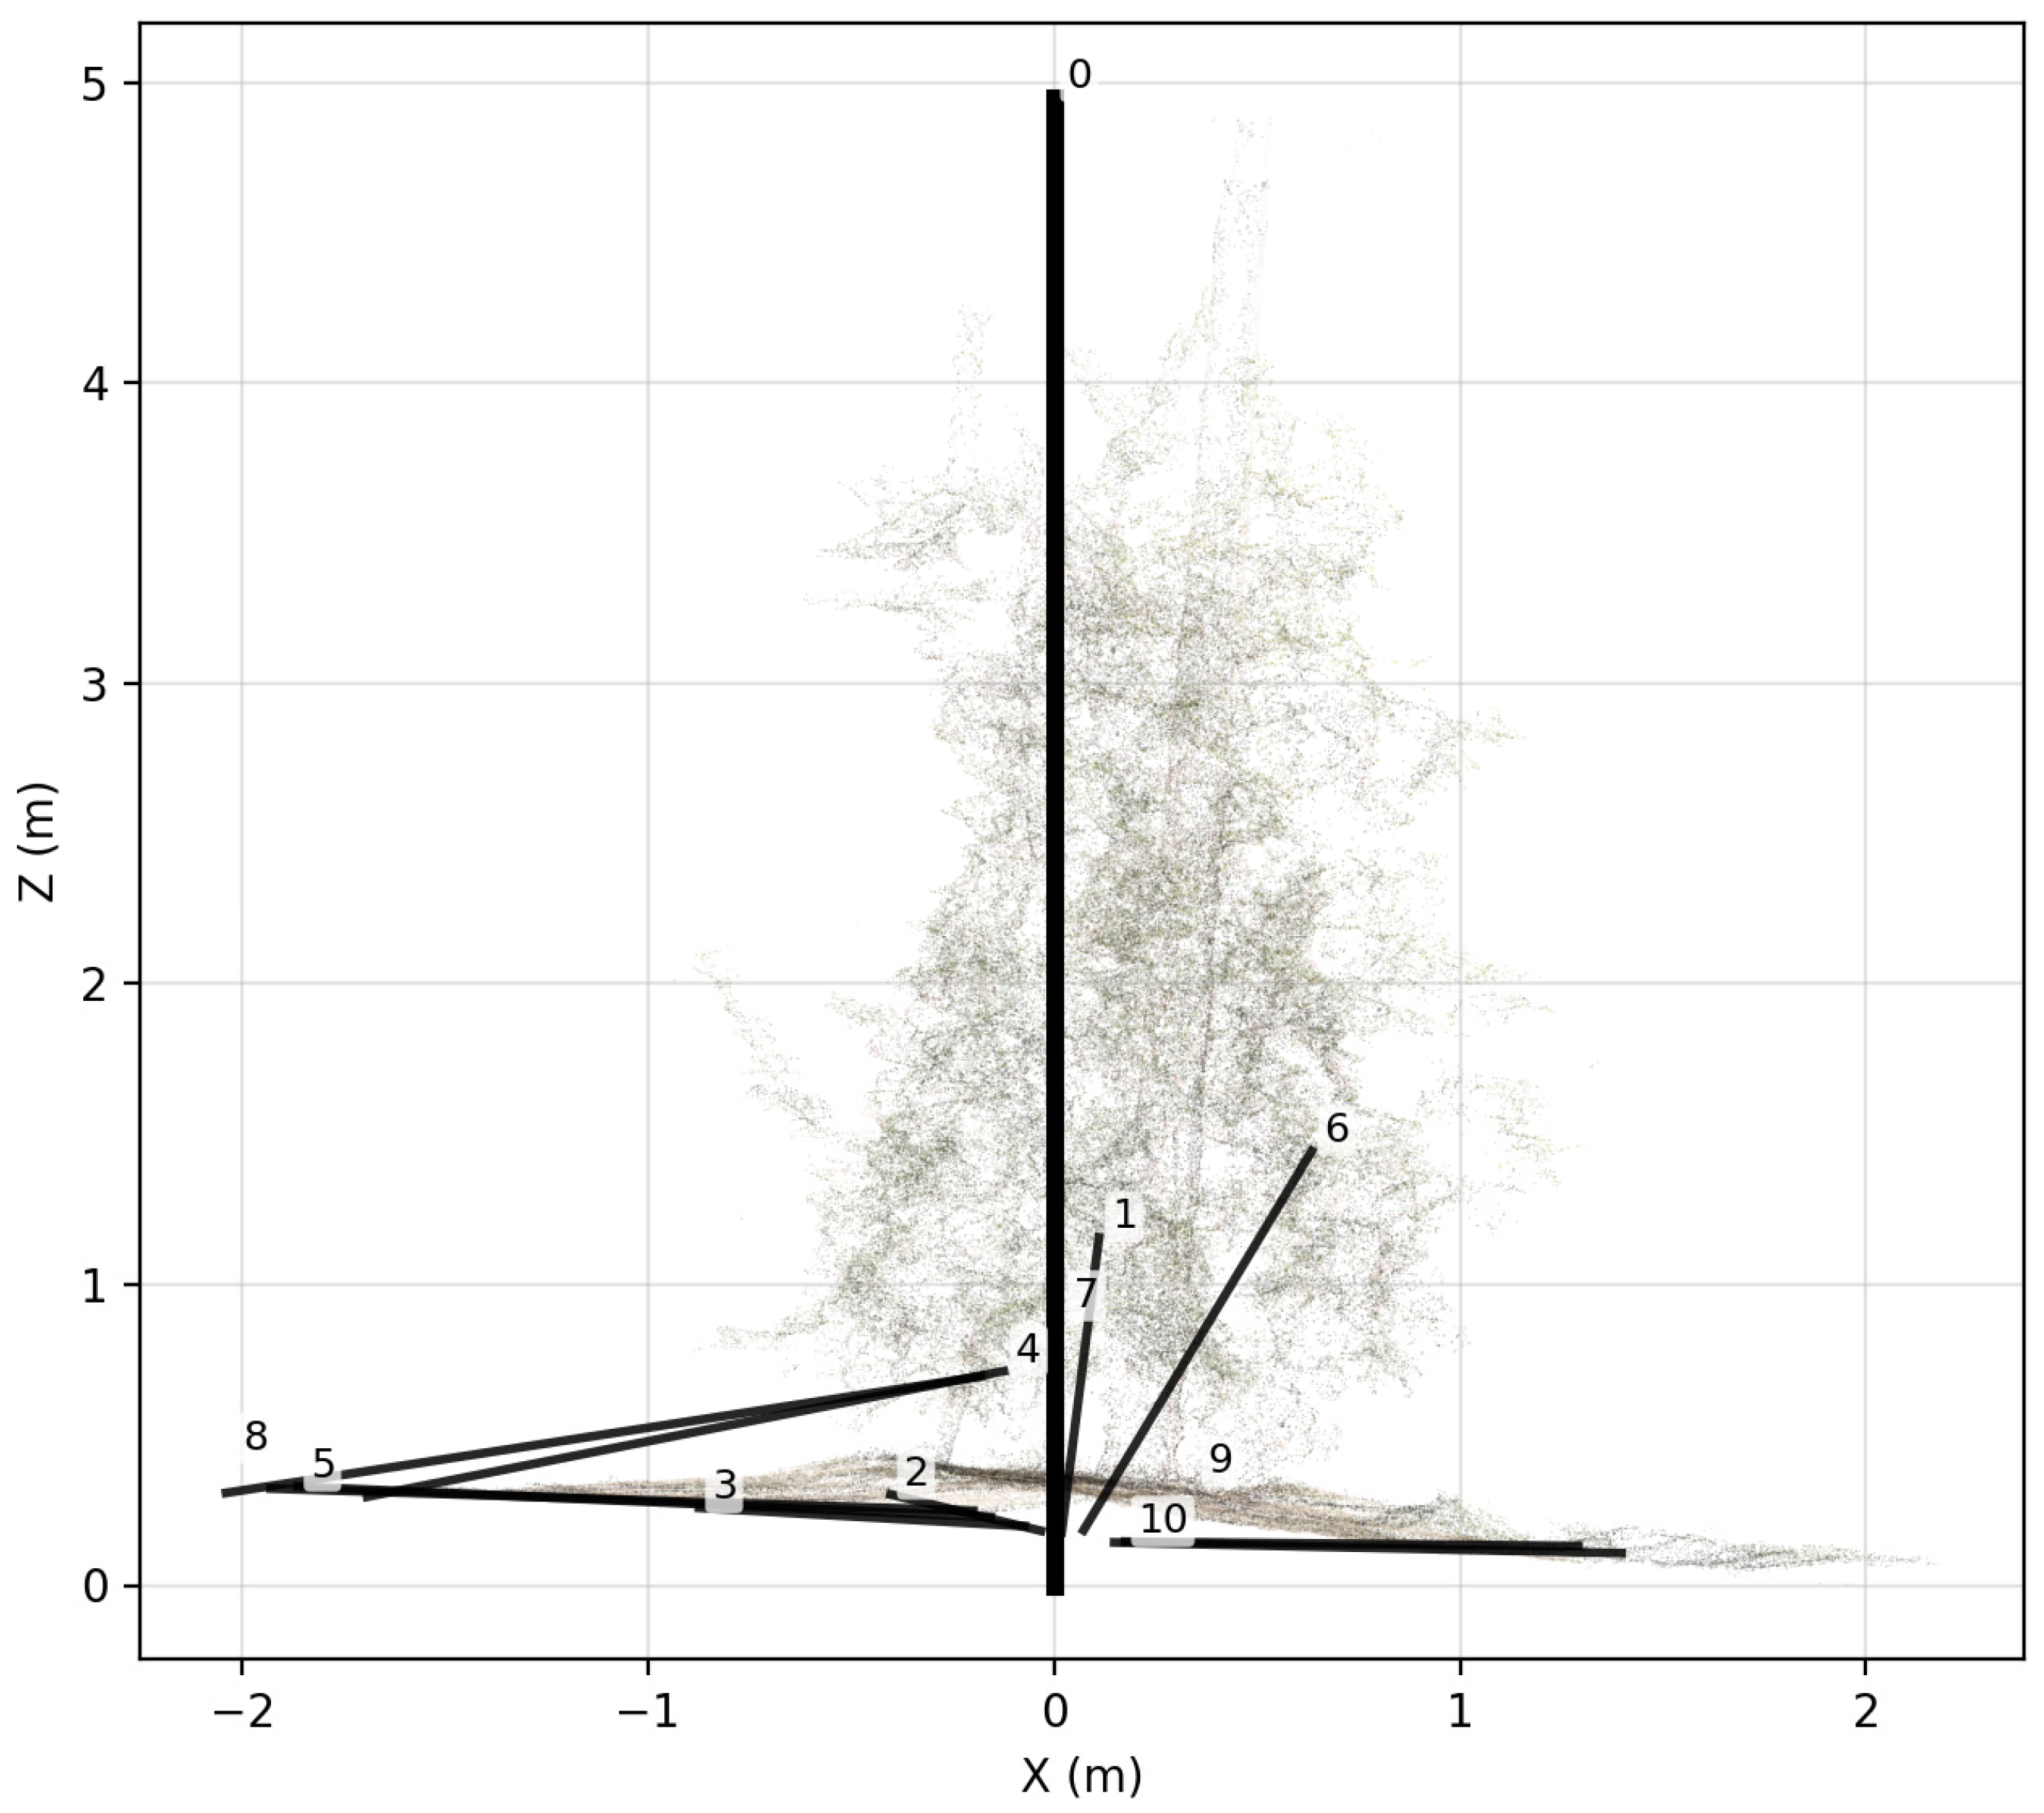
Elevation view of the extracted tree structure for the selected outer tree (Fuji tree 01). The main trunk and the detected major branches are shown together with their connections; branch centerlines are labeled by ID (IDs correspond to Table 1).
Figure 3.
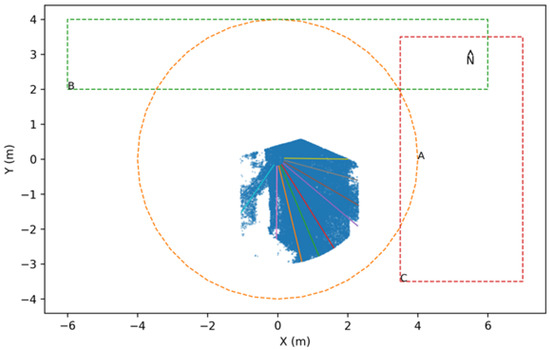
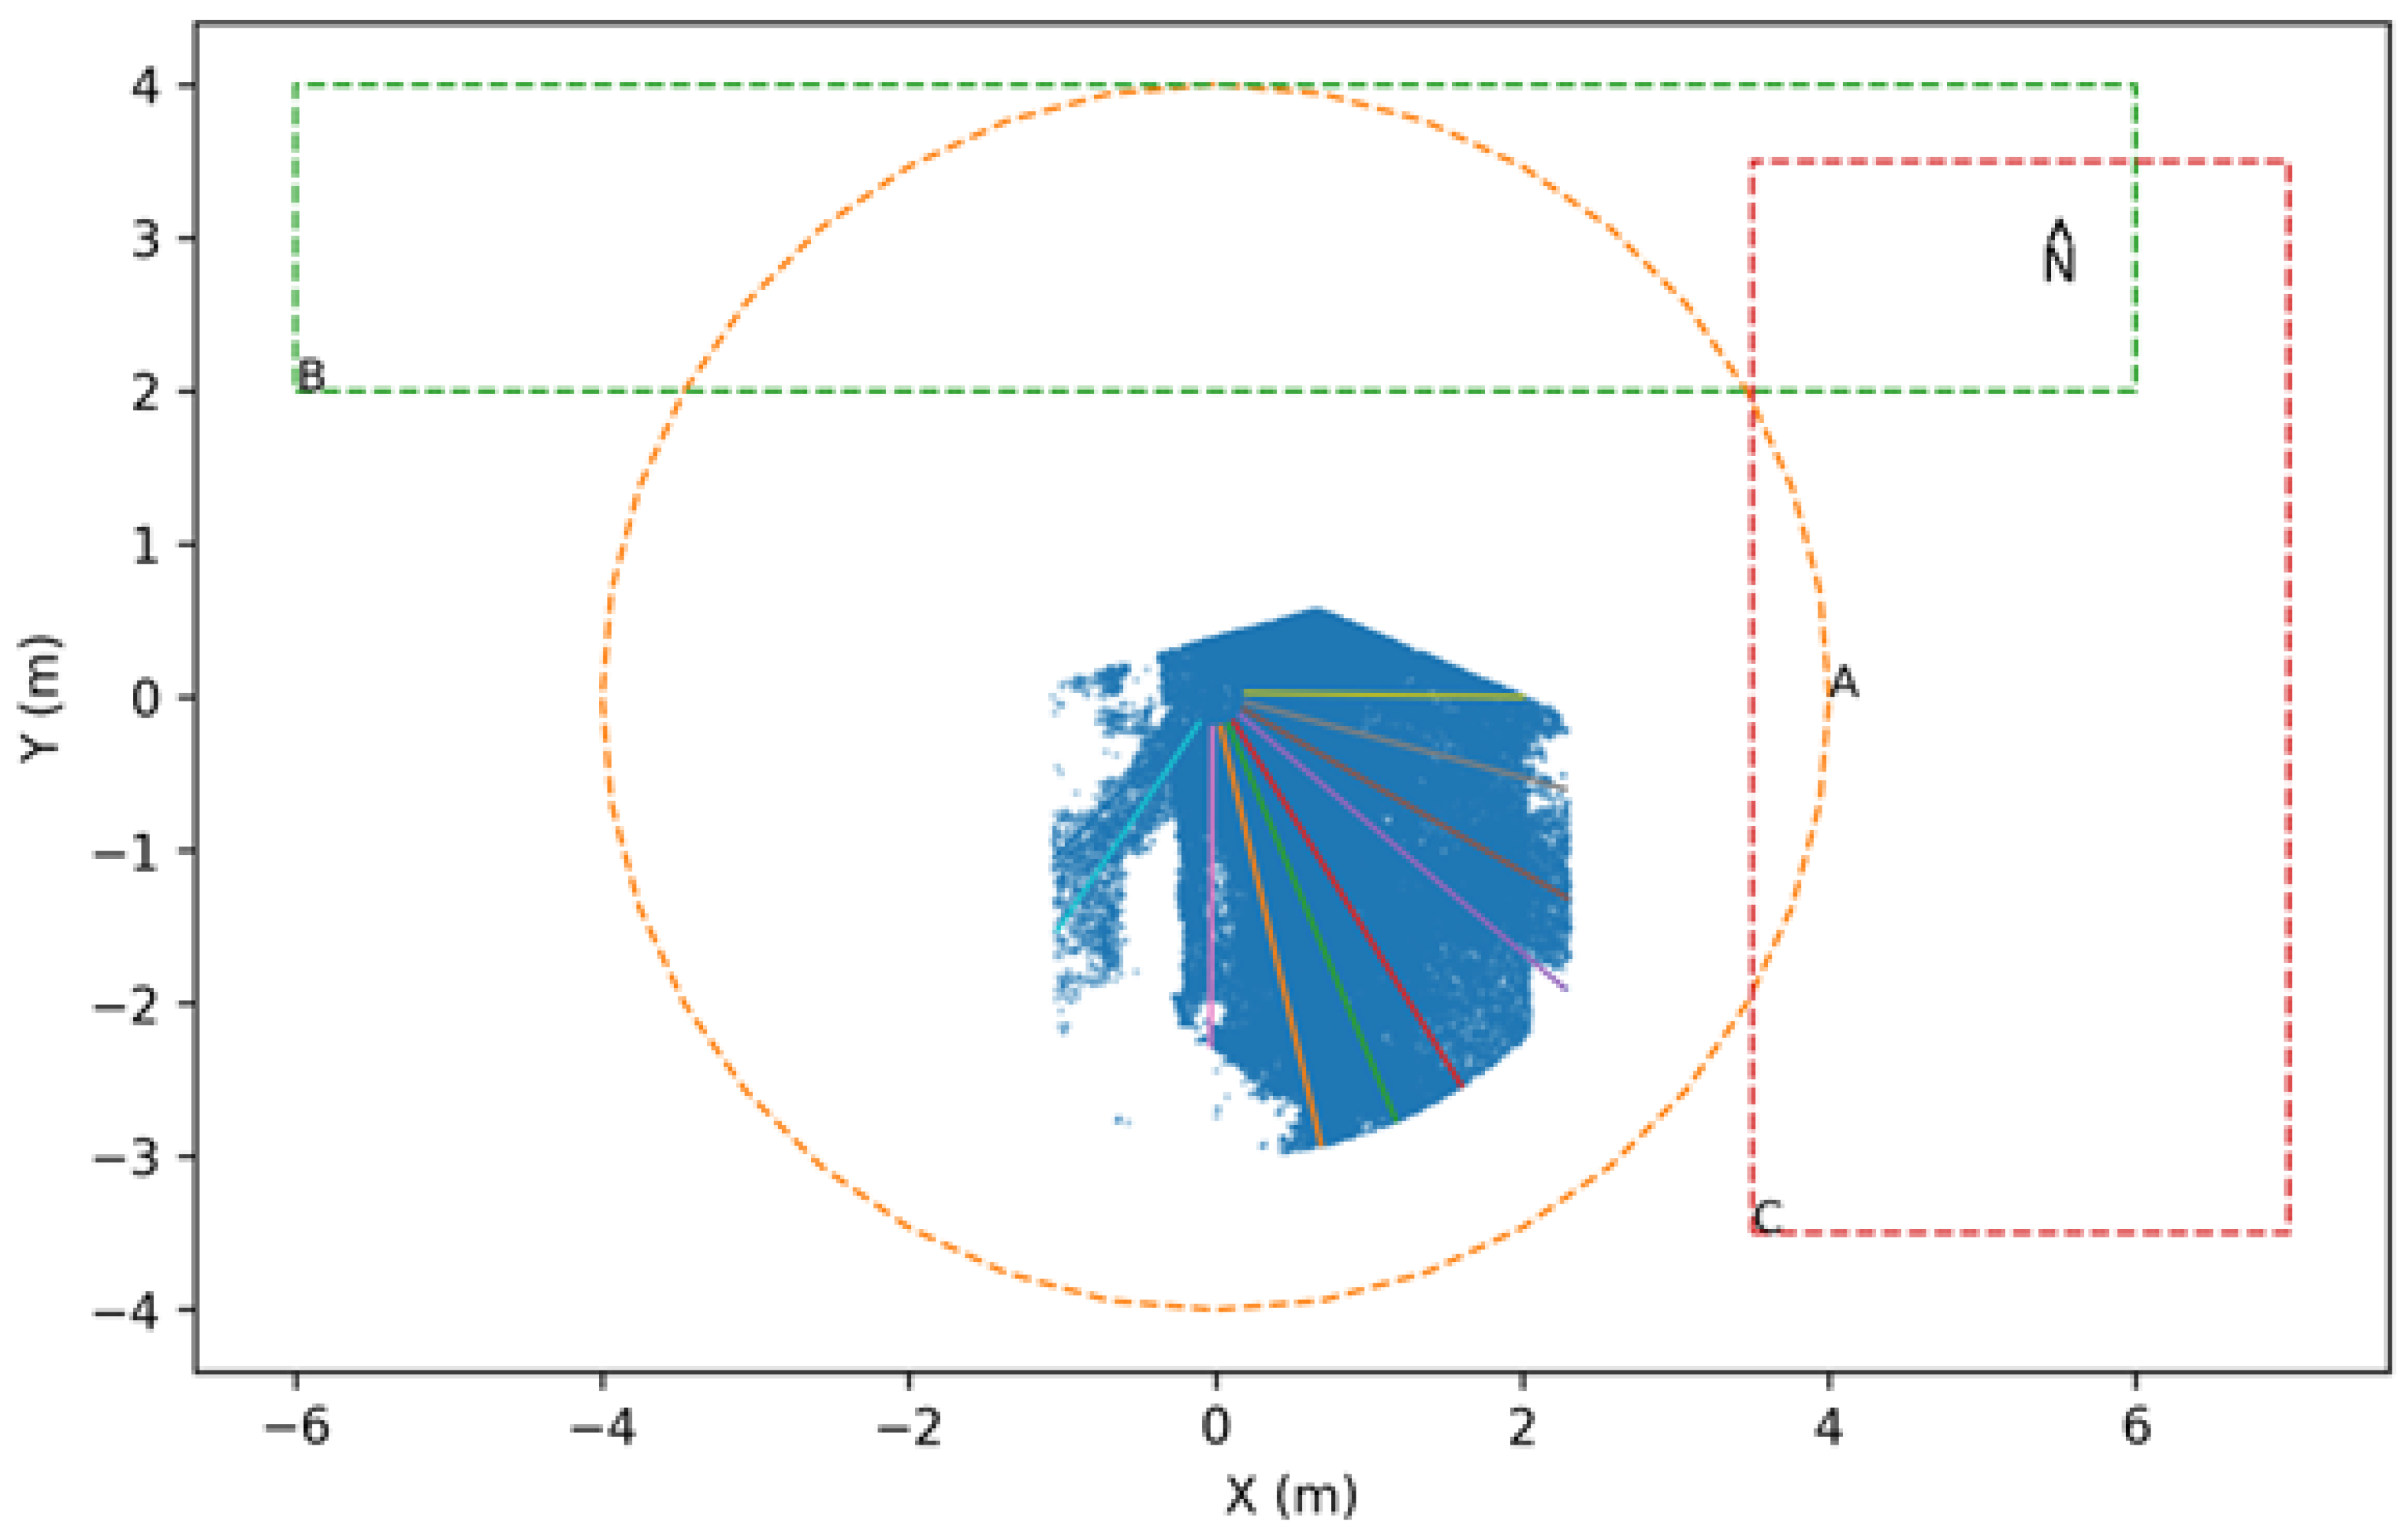
Plan view (top-down) of the same extracted tree structure (Fuji tree 01). Dotted outlines indicate the adopted target footprints for the illustrative risk-assessment scenarios: Scenario A, orange dashed circle (public plaza); Scenario B, green dashed horizontal rectangle (road/parking strip); Scenario C, red dashed vertical rectangle (low-use area). A North arrow is provided for orientation.
2.3.3. Computing Environment and Exact Implementation Used Here
All experiments were executed on a Windows 10 Pro workstation (OS Build 19045.6466; Intel i7-6700K CPU, 64 GB RAM). The branch-extraction and risk-assessment scripts were run in Python 3.12 using NumPy 2.4.0, Open3D 0.19.0, and OpenPyXL for XLSX export. In the released code, COLMAP is used only where needed to convert an existing sparse model to TXT (camera-center anchors), whereas the geometric extraction is performed on the existing dense PLY supplied to the workflow.
2.4. Independent Referencing and Metric Consistency (Field Referencing Logic)
2.4.1. Referencing Measurements (Generalizable “Laser Geo” Concept)
In the full methodology (meant to be deployable beyond the present case study), metric consistency and local framing can be achieved via independent field measurements (e.g., with Haglöf Laser Geo), recording:
- Slope Distance (SD);
- Horizontal Distance (HD);
- Height (H);
- inclination angle (DEG);
- azimuth (AZ);
- plus metadata (e.g., UTC, reference height REFH, declination).
A basic internal consistency check is: SD2 ≈ HD2 + H2; repeated measurements from two nearby operator positions can be used to estimate internal dispersion.
2.4.2. Conversion to a Local ENZ Frame
Measured polar quantities can be converted into a local Cartesian frame (East–North–Zenith, ENZ) using:
- r = HD;
- x = rsin (AZ);
- y = rcos (AZ);
- Z = H + REFH.
2.4.3. Similarity Transform (Scale–Rotation–Translation) from SfM to ENZ
Because SfM reconstructions are in an arbitrary scale and orientation, a similarity transform is estimated with the formula pENZ = sRpSfM + t using standard similarity alignment solvers [27]). Outliers among anchor correspondences can be rejected with RANSAC, and the alignment can be quality-checked via RMSD of anchors and consistency checks of distances and directions.
For clarity, we denote the 3D similarity transformation by S = {s, R, t}, where s is the global scale factor, R is a 3 × 3 rotation matrix, and t is a 3 × 1 translation vector. For any point p in the SfM coordinate frame, the metric-frame coordinates are p_metric = s·R·p_SfM + t (equivalently, a 4 × 4 homogeneous transform).
In the Fuji-SfM case study used here, the provided XYZRGB point cloud is already expressed in metric units (meters) [26], so the referencing step reduces to defining a consistent local frame (translation to set z = 0 at ground level and optional rotation for plan-view visualization). In general field deployments, metric consistency and local framing can be achieved via independent referencing, e.g., by collecting a small set of ground control points or anchor measurements with survey instruments (e.g., total station, GNSS, laser rangefinder) and estimating a similarity transform (scale–rotation–translation) between the reconstruction and the measured anchors.
2.5. Point Cloud Pre-Processing
Scene Isolation and Downsampling
Before branch analytics, the reconstructed dense point cloud is cleaned by isolating points representing the tree structure (removing irrelevant environment where present), filtering outliers, and applying voxel downsampling. A representative voxel size for stable branch-scale analytics is on the order of 1–3 cm (reported explicitly).
Although the workflow is illustrated on a single target tree, it is not restricted to truly isolated individuals. In practice, dense point clouds can be spatially segmented to isolate the target crown and stem from nearby trees or urban elements (e.g., using simple distance-based clustering and manual bounding boxes in Open3D/CloudCompare), provided that the target tree is sufficiently visible from multiple viewpoints. The main limitation is severe crown interpenetration or strong occlusions that prevent reliable separation and branch-level reconstruction.
2.6. Branch-Level Segmentation and Geometric Descriptor Extraction (Python/Open3D)
2.6.1. Branch Representation and Exported Variables
Each detected branch is represented by:
- a branch identifier (branch_id);
- a base point (center_x, center_y, center_z) corresponding to the branch base in the local frame;
- a direction unit vector (axis_dx, axis_dy, axis_dz);
- primary geometric descriptors including base height, diameter, inclination angle, and length.
Core descriptor definitions used in the workflow include:
- height_m: the Z-coordinate of the branch base (base height above local ground);
- diameter_*: diameter at branch base (report units clearly; in the original variable naming, D is treated in cm in downstream risk logic, while geometric estimation is naturally in metric units);
- angle_deg: branch angle relative to the vertical trunk axis (0° vertical, 90° horizontal);
- length_m: branch length.
2.6.2. Algorithmic Procedure for Branch Extraction
The implemented measurement logic (Python/Open3D) follows a sequence of: (i) voxel downsampling and mild denoising of the dense point cloud, (ii) estimation of the main trunk axis and radius, (iii) removal of trunk points, (iv) DBSCAN clustering of the remaining points into candidate structural elements, (v) conversion of each retained cluster to a branch record by PCA axis estimation, and (vi) robust near-base diameter estimation from local point-to-axis distances. Branch orientation is taken from the first principal component of the cluster points, the branch base is defined as the point with minimum distance to the trunk axis, and branch diameter is not obtained by explicit cylinder fitting. Instead, the implementation computes radial distances in a basal slice, removes outliers by a median-absolute-deviation filter, and estimates diameter as twice the median of the retained core radial distances (default core quantile q = 0.70), clipped so as not to exceed 0.95× the estimated trunk diameter.
For full reproducibility, the point cloud analytics were implemented in Python using Open3D and were executed with a fixed parameter preset (“paper_major”) that intentionally yields a limited number of major branches (i.e., fewer but more meaningful structural elements). Specifically, the dense point cloud was voxel-downsampled with voxel size v = 0.015 m and mildly denoised using statistical outlier removal (20 neighbors; σ = 2.0). Trunk points were identified as points within 1.10× the estimated trunk radius (relaxed to 1.60× if the initial trunk mask was too short). The remaining points were clustered with DBSCAN; ε was either provided explicitly or auto-estimated from kNN distances (k = 8, q = 0.60, multiplier 1.6, clamped to 0.03–0.14 m), the default DBSCAN min_points value was 35, and only clusters with at least N_min = 150 points were retained as candidate branches. Candidate clusters were then merged when their endpoints were separated by less than 0.18 m and their principal axes differed by less than 15°, and the final output was restricted to at most 16 branch elements with length ≥ 0.9 m and diameter ≥ 8 cm, while always retaining any secondary trunk and any branch that triggered the explicit support rule.
The analysis pipeline was executed with Python 3.12 (venv), Open3D 0.19.0, NumPy 2.4.0 and openpyxl for spreadsheet outputs. All scripts and implementation-level defaults used to produce the reported results are provided in the Supplementary Materials.
2.7. Multi-Bole Separation and Topology Inference
2.7.1. Bole Segmentation (Main vs. Secondary Stems)
When the extracted structural elements include stem-like axes in addition to the main trunk, the released implementation does not apply weighted k-means. Instead, each retained cluster is first converted to a branch record, and any candidate with angle to the main trunk axis ≤ 35°, estimated diameter ≥ 15 cm, and length ≥ 1.5 m is relabelled as “secondary_trunk”. Thus, the number of within-tree bole elements is determined by the number of clusters satisfying explicit geometric criteria, not by a preset k. In the separate Fuji orchard instance extraction step (Section Fuji-SfM Real-Tree Dataset and Tree Instance Extraction), neighboring stems are detected in a near-ground slice by DBSCAN, and the number of exported tree instances is user-defined (parameter “--export_n”) or explicitly specified via “--select_ids”.
2.7.2. Branch Parent Assignment (Branch–Branch Connectivity)
To infer branch origins (parent–child relationships), the released implementation uses a deliberately simple and auditable nearest-parent rule. The main trunk (branch_id = 0) and any retained secondary_trunk elements are treated as candidate parents. For each branch, the base point is already defined geometrically as the point of the cluster with minimum distance to the trunk axis (Section 2.6.2); parent assignment then selects the candidate bole whose axis gives the smallest point-to-line distance to that base point, subject to a vertical plausibility constraint (the candidate base cannot lie more than 0.7 m above the child base). The stored outputs are parent_branch_id, parent_dist_m, and parent_note.
2.8. Derived Metrics for Risk-Oriented Decision Support
2.8.1. Geometry Inputs and Derived Indicators
For each branch, the decision layer consumes the primary geometry:
- base diameter ;
- length ;
- base height;
- inclination angle (0° vertical, 90° horizontal).
- and automatically derives:
- slenderness ;
- horizontal projection Lhoriz (plan-view reach).
Slenderness ratio (S) is used as a geometry-only proxy for mechanical susceptibility of a branch: S = L/(D/100), where L is branch length in meters and D is branch diameter in centimeters. Higher S indicates a slenderer (and typically more failure-prone) branch and is used as one of the triggers to increase the Likelihood of Failure category in the TRAQ–ALARP decision layer.
2.8.2. Exclusion-Zone Radii as an Auditable Intermediate Quantity
To operationalize reach/exposure, the workflow computes a simple geometry-only cordon radius from branch length and plan-view reach. In the released implementation, this is an explicit intermediate quantity rather than a dynamic fall simulation.
For each extracted branch, L is the estimated branch length (m) and L_horiz is the plan-view reach (m), computed as the Euclidean distance between base and tip after projection to the ground plane. The ratio L_horiz/D (where D is the branch diameter) is reported as a proxy for lateral lever-arm severity. A conservative exclusion-zone radius is computed as r_cordon = max (L, L_horiz) + 0.5 m. The +0.5 m term is not intended as a universal normative constant; rather, it is a deliberately conservative operational allowance that avoids false precision in a geometry-only footprint and is exposed explicitly in the released code so it can be modified for local policy or sensitivity testing.
2.9. Rule-Based TRAQ-Style Logic and ALARP-Constrained Recommendations
2.9.1. Failure Probability (Rule-Based, Geometry-Driven)
This study implements a transparent, rule-based approximation of the ISA Tree Risk Assessment Qualification (TRAQ) workflow [23], adapted to geometry-only inputs derived from surface reconstructions (SfM/MVS point clouds). For each extracted branch i, the pipeline computes four geometric descriptors: length L_i (m), diameter D_i (cm), inclination θ_i (°) relative to vertical (0° = vertical, 90° = horizontal), and base height h_i (m). From these, a slenderness proxy is computed as S_i = L_i/(D_i/100).
Likelihood of Failure (LoF) is then assigned using explicit implementation-level defaults. These numerical breakpoints are not presented as universal normative ISA/ANSI/EAS cut-offs; rather, they are transparent operational triggers used in the released proof-of-concept code so that the rule layer is auditable and easily recalibrated. Concretely, S ≥ 80 and S ≥ 60 with θ ≥ 60° act as high-slenderness triggers; L ≥ 3 m with θ ≥ 60° and 25 ≤ D ≤ 60 cm identifies a long lateral major branch and is also reused by the explicit support trigger; D ≥ 40 cm with h ≥ 3 m and θ ≥ 60° flags a large elevated lateral element; and θ < 45°, L < 2 m, S < 30 identifies short, steep, relatively stocky elements. The aim is not to diagnose internal decay or defects from surface geometry alone, but to demonstrate how a consistent rule-set can propagate measured external geometry and explicit exposure assumptions into risk categories and actionable measures.
Implementation logic (pseudocode) is as follows:
S = L/(D/100)
- if S ≥ 80 or (S ≥ 60 and θ ≥ 60): LoF = Imminent
- elif (D ≥ 40 and h ≥ 3 and θ ≥ 60): LoF = Probable
- elif (L ≥ 3 and θ ≥ 60 and 25 ≤ D ≤ 60): LoF = Probable
- elif (θ < 45 and L < 2 and S < 30): LoF = Improbable
- else: LoF = Possible
All LoF thresholds are exposed explicitly in the released code, which makes the present implementation auditable and provides a clear basis for later calibration or sensitivity analysis.
2.9.2. TRAQ Synthesis and Mapping to Management Actions
Likelihood of Impact (LoI) is scenario-dependent and represents exposure. Each scenario defines a 2D target polygon in the ground plane (X–Y), together with an occupancy class (Unlikely, Somewhat likely, Likely, Very likely) and a manageability class (High/Medium/Low) describing how feasible it is to restrict access to the target area.
For each branch, a conservative “fall reach” is defined as R_i = max(L_i, L_horiz,i). The branch is considered able to impact the target if a circle centered at the branch base with radius R_i intersects the target polygon. If there is no intersection, LoI is set to Unlikely for that scenario. If intersection occurs, LoI is mapped directly from the scenario’s occupancy descriptor.
The combined likelihood (Failure × Impact) is computed on a 4 × 4 ordinal scale. In the implementation, the numeric levels of LoF and LoI are multiplied and mapped back to an ordinal class:
- L = level(LoF) # 1–4 (Improbable–Imminent)
- I = level(LoI) # 1–4 (Unlikely–Very likely)
- FxI = L x I
- if FxI ≤ 3: Likelihood = Unlikely
- elif FxI ≤ 6: Likelihood = Somewhat likely
- elif FxI ≤ 12: Likelihood = Likely
- else: Likelihood = Very likely
Consequences are estimated from branch size and position using a simple additive severity score based on diameter, length, and base height:
- if D ≥ 10 cm: score += 1
- if D ≥ 30 cm: score += 1
- if L ≥ 3 m: score += 1
- if h ≥ 5 m: score += 1
- if score == 0: Consequences = Negligible
- elif score == 1: Consequences = Minor
- elif score <= 3: Consequences = Significant
- else: Consequences = Severe
Finally, a TRAQ-style overall risk category (Low, Moderate, High, Extreme) is obtained by combining the Likelihood class with the Consequences class through an ordinal risk matrix. This yields a repeatable, auditable mapping from measured 3D geometry and scenario exposure into risk categories.
Scenario definitions used in the case study are:
- (1)
- Scenario A—Plaza: a circular pedestrian target zone centered at the trunk (radius 8 m). Occupancy is set to Very likely (continuous presence). Manageability is Medium (temporary fencing is feasible but must maintain access).
- (2)
- Scenario B—Road/Parking: a rectangular strip representing a roadway/parking lane adjacent to the tree. Occupancy is Likely. Manageability is Low, reflecting the practical difficulty of maintaining a long-term exclusion zone.
- (3)
- Scenario C—Low-use area: a rectangular target zone offset from the trunk, representing a low-use buffer or restricted-access area. Occupancy is Somewhat likely. Manageability is High, meaning exclusion and rerouting are readily feasible.
As with the LoF layer, these consequence thresholds are explicit implementation defaults intended to make the proof-of-concept auditable; they can be recalibrated in future application- or species-specific deployments.
2.9.3. ALARP-Constrained Recommendations (Immediate Action and Final Recommendation)
Immediate Action and Final Recommendation are produced by applying an ALARP constraint (“as low as reasonably practicable”) to the TRAQ-style risk outcome. Immediate Action is the near-term measure required to control exposure and/or reduce probability (e.g., temporary exclusion, traffic management, urgent pruning). Final Recommendation is the medium-term plan that keeps risk ALARP given the scenario’s manageability constraints, and typically includes longer-term structural mitigation (e.g., weight-reduction pruning, or support systems such as cabling/bracing) and monitoring frequency.
The logic is fully rule-based and auditable: each branch row includes the trigger tags that caused a recommendation. For example, a specific deliverable-style trigger is used to activate structural support recommendations: a long lateral branch with L ≥ 3 m, θ ≥ 60° and diameter 25–60 cm triggers a “cabling/bracing now” recommendation when the branch can impact a target.
Implementation logic (pseudocode) is:
- if not impacts_target: Immediate = routine monitoring; Final = routine monitoring
- else:
- if Risk in {High, Extreme}:
- if Manageability is Low: Immediate = traffic control + urgent weight-reduction pruning
- else: Immediate = fence/exclusion + urgent weight-reduction pruning
- if (L ≥ 3 and θ ≥ 60 and 25 ≤ D ≤ 60): Immediate += cabling/bracing now
- Final = ALARP-compliant permanent mitigation (support + monitoring)
- elif Risk == Moderate:
- Immediate = targeted inspection after storms + plan intervention
- Final = scheduled weight-reduction pruning; consider preventive support if trigger applies
- else:
- Immediate = none beyond routine inspection; Final = routine monitoring
3. Results
3.1. Real-Tree Dataset and Multi-Tree Instance Segmentation (Fuji-SfM)
To address the need for a real-data demonstration, we used the publicly available Fuji-SfM apple orchard dataset, which provides a dense RGB point cloud reconstructed from real multi-view imagery. From the orchard point cloud, stems were detected by DBSCAN clustering in a near-ground slice and three neighboring trees were exported as separate instances (tree_01–tree_03). Figure 1 shows representative views of the segmented point cloud; despite partially touching crowns, the three tree instances are clearly separated (distinct colors) with minimal cross-assignment in the canopy.
3.2. Branch Extraction and Derived Mensuration Variables
From the metrically aligned point cloud of Fuji tree_01, the pipeline identified the main trunk and extracted 10 branch clusters (11 structural elements including the trunk). For each element, geometric descriptors were computed from a principal-axis fit, including branch length (L), diameter (D), horizontal reach, inclination angle and azimuth. Table 1 reports the derived variables for the trunk and all detected branches. For Fuji tree_01, the estimated total height was 4.95 m and the stem diameter at breast height (DBH) was 29.1 cm. Figure 2 and Figure 3 illustrate the elevation and plan view of the reconstructed structure, respectively.
3.3. Scenario-Based Risk Outcomes and Recommended Measures
Branch-level decision support was evaluated under three target-exposure scenarios (A–C) with different occupancy and manageability assumptions. For each branch, the pipeline computed: (i) likelihood of failure (LoF) from geometric triggers, (ii) likelihood of impact (LoI) from whether the branch fall footprint intersects the scenario target, and (iii) combined likelihood (LoF × LoI). Consequences were assigned from branch size, and an overall qualitative risk rating was then mapped to an action recommendation following a TRAQ-inspired decision matrix implemented in the pipeline.
Applying these parameters, Fuji tree_01 was evaluated across the three scenarios. Table 2, Table 3 and Table 4 report, for each structural element, the target-intersection flag, the TRAQ-derived likelihood score, the TRAQ-derived likelihood score, the overall risk rating, and the resulting Immediate Action and Final Recommendation.
The computed cordon radius is a branch-specific geometric quantity (fall footprint) derived from branch length and horizontal reach. Therefore, for a given branch the cordon radius remains identical across scenarios. Scenario assumptions affect risk through LoI (whether the footprint intersects the target) and through occupancy/manageability when mapping risk to recommended actions.
Table 2.
Branch-level risk outcomes and recommended measures for Scenario A—public plaza (Fuji tree 01).
Table 3.
Branch-level risk outcomes and recommended measures for Scenario B—road/parking strip (Fuji tree 01).
Table 4.
Branch-level risk outcomes and recommended measures for Scenario C—low-use area (Fuji tree 01).
In Scenario A (public plaza, very likely occupancy), all 11 structural elements (trunk + 10 branches) intersected the target footprint. Five elements were classified as High overall risk and six as Moderate (Table 2). Under Scenario B (road/parking strip, likely occupancy), eight elements intersected the target footprint and the overall risk ratings shifted to five Moderate and six Low (Table 3). Under Scenario C (low-use area, somewhat likely occupancy), only one branch intersected the target footprint; ten elements were rated Low and one Moderate (Table 4).
4. Discussion
4.1. Why This Methodology Matters: From “Expert Impression” to Reproducible, Auditable Evidence
Tree risk management decisions in urban environments are frequently made under time pressure and incomplete information, and they often rely on a combination of visual inspection and coarse field measurements. While professional judgment is essential, the literature recognizes that tree risk assessment remains partly subjective, influenced by assessor training, risk perception, and the way different methods weight likelihood and consequence components [4,28].
The core contribution of the present work is not “another 3D model of a tree”, but a transferable pipeline that converts a tree’s complex 3D branching architecture into (i) branch-level, quantitative descriptors and then into (ii) transparent, rule-based recommendations that can be reviewed, defended, and repeated. This is aligned with broader risk-management principles emphasizing traceability, consistent framing, and decision accountability [24,29].
Overall, the scenario analysis shows the expected sensitivity to exposure and target proximity: Scenario A yields the most conservative outcomes (higher likelihood and overall risk ratings), whereas Scenario C yields the least conservative outcomes because only one element intersects the target area. This illustrates how the same geometric mensuration inputs can support context-dependent decision making through the TRAQ/ALARP rule layer.
The “worksite kit” approach (tape or caliper for accessible diameters; laser rangefinder + clinometer for heights/lengths) remains widespread because it is inexpensive and fast. However, it has structural limitations that become critical, precisely in the cases where risk stakes are highest: large, complex, historic/veteran trees with dense crowns, multiple co-dominant stems, cavities, and heavily interlaced scaffold branches. From ground level, (i) many key branch unions are partially occluded, (ii) crown geometry is difficult to measure without climbing, and (iii) the final documentation often collapses into qualitative statements (“large lateral limb over target”) rather than reproducible numbers.
By contrast, the SfM–MVS + field-referencing approach targets a different objective: capturing the 3D geometry of woody structure in a way that is spatially coherent, enabling consistent extraction of branch metrics (e.g., length, inclination, slenderness, projected reach) across the whole crown. SfM has long been recognized as a low-cost, flexible route to dense 3D reconstruction from overlapping imagery [5], and robust, widely used implementations such as COLMAP have helped make this workflow accessible and repeatable [6].
Crucially, the present workflow is designed so that measurement is not limited to what is reachable, and so that the geometry used in decision-making is not a “best guess” from a single viewpoint. This does not eliminate the need for arboricultural expertise; rather, it upgrades what the expert can base judgments on—from partial, local measurements to a consistent 3D evidence base.
4.2. Positioning Relative to TLS/QSM and Point Cloud-Based Tree Modeling
Point cloud-based tree modeling has advanced rapidly—especially in the terrestrial laser scanning (TLS) community—where quantitative structure modeling (QSM) approaches represent woody structure as connected primitives (often cylinders) to recover topology and geometry. TLS has been described as transformative for quantifying tree structure and biomass, while also having well-known logistical and cost constraints for routine municipal deployments [8].
Open tools such as SimpleTree have demonstrated efficient reconstruction of tree models and extraction of structural parameters from point clouds, further underscoring the maturity of computational tree-structure pipelines [9].
Within this landscape, the present methodology sits at a pragmatic intersection: it seeks TLS-like structural outputs (branch-level descriptors, topology-aware segmentation) while using a data acquisition route that can be simpler, cheaper, and more deployable in many contexts (multi-view imagery + SfM–MVS), acknowledging that SfM and TLS each have characteristic strengths and failure modes. A recent synthesis of branch characterization from point clouds emphasizes both the growth of the field and the continuing challenges posed by occlusion, fine-branch resolution, and complex canopy conditions—issues that motivate robust, well-documented pipelines rather than ad hoc processing [13].
4.3. What Is Novel Here: Coupling 3D Mensuration to Explicit TRAQ/ALARP Decision Logic
Many workflows stop after producing a point cloud or mesh, leaving a gap between “3D reconstruction” and “risk-oriented decisions”. The methodological novelty here is the explicit coupling of mensuration to a rule-based decision layer consistent with mainstream risk-assessment structures—particularly the separation of (i) likelihood of failure, (ii) likelihood of impact (target/exposure), and (iii) consequences, which is central to multiple professional approaches and is discussed in the literature as a key backbone of tree risk reasoning [28].
In practice, the manuscript operationalizes this by mapping quantitative geometric descriptors (e.g., branch dimensions and projected reach) plus configurable exposure/target scenarios into auditable recommendations (monitoring, pruning/weight reduction, support, exclusion-zone planning). This is strongly aligned with the intent of formal arboricultural frameworks such as the ANSI A300 (Part 9) risk assessment standard and the ISA TRAQ framework, which emphasize structured evaluation and documentation—while still leaving room for professional judgment [23,30].
The explicit inclusion of ALARP-type reasoning (“reduce risk as low as reasonably practicable”) further clarifies why certain measures become preferable when target manageability is constrained (e.g., inability to sustain long-term exclusion zones in high-use public space), and why the same structural condition can lead to different recommendations under different exposure assumptions [24].
4.4. Why a Public Real-Tree Dataset Strengthens Reproducibility and Practical Relevance
A recurring barrier in tree risk publications is the difficulty of sharing full-resolution imagery and detailed site context (privacy, permissions, sensitive locations), which weakens reproducibility and slows methodological comparison. To address this, we demonstrate the complete workflow on an openly available real-tree dataset that can be accessed by any reader: the Fuji-SfM apple orchard dataset [26]. This choice allows end-to-end reproduction of the analysis (data → per-tree extraction → branch metrics → TRAQ/ALARP tables) without the logistical burden of new field acquisition.
Fuji-SfM provides multi-view imagery and an SfM-derived XYZRGB point cloud acquired in a commercial orchard with multiple neighboring trees. In addition to citing the original dataset, we provide the exact scripts used in this manuscript (fuji_sfm_extract_trees.py, pipeline_PAPER.py, and make_figures_2_3.py) together with the derived per-tree point clouds (tree_01–tree_03), so that the instance extraction step and subsequent mensuration/risk outputs can be regenerated and inspected independently.
Methodologically, the modular structure of the workflow also supports controlled sensitivity tests: by changing only target polygons, occupancy assumptions, or “manageability constraints”, one can demonstrate that the recommendation layer behaves predictably and transparently—an important property for decision support in safety-relevant contexts.
A full field validation of (i) the mensuration layer and (ii) the risk/recommendation layer would require two types of independent ground truth that are rarely available at branch level: (1) exhaustive in situ measurements for each branch (e.g., climber-based tape/diameter measurements or comparable high-accuracy survey data) to quantify measurement error; and (2) longitudinal observations of actual branch failures (or controlled pull tests) to evaluate predictive performance of likelihood/consequence ratings. Such paired datasets were outside the scope of this proof-of-concept study. Future work will therefore focus on controlled field campaigns where limited subsets of branches can be measured independently and on curating longitudinal datasets to evaluate risk predictions under real operating conditions.
Importantly, all mensuration results reported in this paper are computed directly on the public Fuji-SfM point cloud (after per-tree extraction); no new dense reconstruction was recomputed by the authors for Table 1 or Figure 1, Figure 2 and Figure 3. The case study therefore exercises the same analysis pathway that would be used for a real-tree point cloud supplied to the workflow. Practical applicability of the present workflow should be interpreted in light of the existing validation literature on photogrammetric tree mensuration. The aim of this study is not to re-establish SfM/MVS as a metrological principle, but to use a metrically referenced point cloud as input to a reproducible branch-extraction and TRAQ/ALARP decision workflow. Close-range and terrestrial photogrammetry have already shown useful accuracy for tree mensuration tasks such as DBH, stem diameter/perimeter, taper, and volume [31,32,33], and broader reviews have concluded that SfM can deliver operationally relevant forestry measurements at relatively low cost when acquisition conditions are adequate [34]. For architectural traits beyond the stem, image-based comparisons with TLS or 3D digitizing indicate practical utility for variables such as branch angle, branch thickness, and the structure of thicker branches, although fine-branch reconstruction remains more sensitive to occlusion, motion, and vegetation complexity [35,36]. At the same time, branch-level validation on standing trees remains a recognized bottleneck because standardized benchmark datasets and independent field ground truth are scarce [13]. Accordingly, the present manuscript is positioned as a reproducible workflow and decision-support contribution built on an established mensuration literature, while full branch-by-branch benchmarking on the same trees is left for dedicated future validation studies.
4.5. Relevance to Veteran/Heritage Trees: Managing Risk While Protecting Irreplaceable Value
Veteran and heritage trees are not simply “large trees”; they are living cultural and ecological assets whose management goals often prioritize longevity, habitat continuity, and minimal intervention, while still meeting public safety obligations. Guidance documents for ancient/veteran trees explicitly emphasize keeping such trees alive as long as possible, careful consideration before intervention, and proportional actions that balance multiple values [37,38]. Public safety pressures can nevertheless constrain conservation outcomes for large old trees in frequently visited places, creating strong incentives for heavy interventions even when such actions conflict with conservation goals [39].
In that context, the proposed methodology is particularly relevant because it enables:
- Defensible proportionality: interventions can be justified using documented geometry and explicit exposure assumptions rather than intuition alone.
- Scenario-based planning: the same veteran-tree structure can be evaluated under different public-use patterns (e.g., plaza vs. road/parking vs. low-use area), supporting realistic municipal decision-making rather than one-size-fits-all prescriptions.
- Conservation-sensitive risk management: when the tree’s heritage value raises the threshold for invasive interventions, the ALARP-style framing makes trade-offs explicit and documentable [20,24].
This is also consistent with the broader view that urban tree risk management benefits from systematic programs and documented processes, not only one-off reactions after incidents [1].
4.6. Greek Municipal Practice: Why a Quantitative, Standardized Workflow Is Timely
In Greece, urban tree works (pruning, crown reduction, removals) are often implemented through municipal operational programs and contractors, but public debate frequently highlights concerns about inconsistent practice, variable expertise, and the absence of a unified, enforceable technical framework for urban-tree pruning decisions across municipalities. Indicatively, the Geotechnical Chamber (GEOT.E.E.) has publicly pointed to weaknesses in the institutional/procedural setting around pruning in the urban fabric [40,41].
A reproducible, quantitative methodology can therefore act as a bridging instrument between (i) arboricultural expertise and (ii) municipal governance needs: it can support standardized documentation, transparent procurement specifications (what data are collected, what outputs are delivered), and clearer communication with citizens about why specific measures were selected under specific exposure assumptions.
4.7. Limitations and Future Research Directions
Despite its strengths, the methodology inherits known limitations of image-based and point cloud-based reconstruction in complex vegetation:
- Occlusion and fine-branch resolution remain challenging; small twigs may be under-reconstructed depending on imaging geometry and reconstruction settings [10].
- Parameter sensitivity in the present workflow is governed mainly by voxel size, DBSCAN ε and min_points, the minimum retained cluster size, the diameter-core quantile used in near-base radial estimation, and the exclusion-buffer term used in the cordon radius. This work reports the exact defaults used here, but no formal confidence intervals are reported because this proof-of-concept study does not include repeated reconstructions or independent branch-level ground truth. The released code exposes all of these parameters explicitly, which makes the present implementation auditable and provides a clear basis for future sensitivity/uncertainty studies [42].
- Tree motion (wind) and changing illumination in real deployments can degrade reconstruction quality relative to controlled acquisitions; systematic robustness evaluation under realistic outdoor conditions remains an important next step.
- A critical limitation is that external morphology alone cannot provide a complete risk profile. Internal physiological condition (e.g., decay, cavities, cracks), species-specific mechanical behavior, and wood quality can substantially alter the likelihood of failure even when external geometry appears similar. Accordingly, the proposed workflow should be interpreted as a quantitative, geometry-driven decision-support layer that standardizes branch-level mensuration and exposure geometry; it is designed to complement—not replace—expert inspection and internal assessment methods where warranted.
Future work should therefore focus on: (i) benchmarking against TLS/QSM outputs when feasible, (ii) quantifying uncertainty bounds for key branch descriptors through repeated reconstructions and formal sensitivity analyses, (iii) expanding the decision layer to incorporate additional defect indicators (e.g., cavities and decay proxies) and to formalize uncertainty-aware recommendations, and (iv) integrating complementary arboricultural diagnostics and species-dependent material properties (e.g., Modulus of Elasticity (MOE), Modulus of Rupture (MOR)) when moving from geometry-based screening to holistic risk profiling [43,44].
5. Conclusions
This study advances tree risk practice by presenting a reproducible, end-to-end methodology that links quantitative 3D mensuration of tree structure to transparent, rule-based risk-oriented decision support. Using SfM–MVS reconstruction combined with independent metric referencing and point cloud analytics enables branch-level descriptors that are otherwise difficult, costly, or unsafe to obtain through conventional ground-based mensuration alone.
Beyond reconstruction, the key contribution is the explicit operationalization of TRAQ-style risk components together with ALARP reasoning, allowing management recommendations to be traced back to geometry and target/exposure assumptions in an auditable way, consistent with established risk-management practice.
Finally, by demonstrating the workflow on an openly available real-tree dataset with neighboring trees and partial crown overlap (Fuji-SfM), the manuscript removes a common barrier to replication and simultaneously shows that the proposed mensuration and TRAQ/ALARP decision layer transfers to real-world point clouds.
Supplementary Materials
The following supporting information can be downloaded at: https://www.mdpi.com/article/10.3390/f17040431/s1.
Author Contributions
Conceptualization, E.M. and K.K.; methodology, E.M. and K.K.; validation, E.M. and K.K.; formal analysis, E.M. and K.K.; data curation, E.M. and K.K.; writing—original draft preparation, E.M. and K.K.; writing—review and editing, E.M. and K.K.; supervision, E.M. All authors have read and agreed to the published version of the manuscript.
Funding
This research received no external funding.
Data Availability Statement
Supplementary Materials contain the exact scripts used in this study (fuji_sfm_extract_trees.py, pipeline_PAPER.py, make_figures_2_3.py), the extracted per-tree point clouds (tree_01–03), stem-detection outputs, branch-level metrics, and scenario risk tables derived from the Fuji-SfM dataset. The original Fuji-SfM dataset (multi-view imagery and the orchard point cloud) is publicly available [26].
Conflicts of Interest
The authors declare no conflicts of interest.
Abbreviations
The following abbreviations are used in this manuscript:
| ALARP | As Low As Reasonably Practicable |
| ANSI | American National Standards Institute |
| A300 | ANSI A300 Tree Care Operations standards |
| COLMAP | Structure-from-Motion/Multi-View Stereo pipeline (software) |
| CPU | Central Processing Unit |
| CUDA | Compute Unified Device Architecture |
| CSV | Comma-Separated Values |
| DAERA | Department of Agriculture, Environment and Rural Affairs (Northern Ireland) |
| DBH | Diameter at Breast Height |
| DBSCAN | Density-Based Spatial Clustering of Applications with Noise |
| ENZ | East–North–Zenith (local coordinate frame) |
| FOV | Field of View |
| GPU | Graphics Processing Unit |
| HDRI | High Dynamic Range Imaging |
| ISA | International Society of Arboriculture |
| JPEG | Joint Photographic Experts Group (image format) |
| JSON | JavaScript Object Notation |
| KD-tree | k-dimensional tree |
| MVS | Multi-View Stereo |
| PCA | Principal Component Analysis |
| PNG | Portable Network Graphics (image format) |
| RANSAC | Random Sample Consensus |
| RMSD | Root Mean Square Deviation |
| SfM | Structure-from-Motion |
| SfM–MVS | Structure-from-Motion and Multi-View Stereo |
| SIFT | Scale-Invariant Feature Transform |
| TLS | Terrestrial Laser Scanning |
| TRAQ | Tree Risk Assessment Qualification |
| QSM | Quantitative Structure Model |
| UTC | Coordinated Universal Time |
| ISO | International Organization for Standardization |
References
- Pokorny, J.; O’Brien, J.; Hauer, R.; Johnson, G.; Albers, J.; Bedker, P.; Mielke, M. Urban Tree Risk Management: A Community Guide to Program Design and Implementation; USDA Forest Service: Newtown Square, PA, USA, 2003.
- Forestry Commission. Operational Guidance Booklet No. 1: Tree Safety Management (Version 1.1); Forestry Commission: Edinburgh, UK, 2007.
- Department of Agriculture, Environment and Rural Affairs (DAERA). Tree Safety Management: Practice Guide (v3.1); DAERA: Belfast, UK, 2023.
- Koeser, A.K.; Smiley, E.T. Impact of Assessor on Tree Risk Assessment Ratings and Prescribed Mitigation Measures. Urban For. Urban Green. 2017, 24, 109–115. [Google Scholar] [CrossRef] [Scilit]
- Westoby, M.J.; Brasington, J.; Glasser, N.F.; Hambrey, M.J.; Reynolds, J.M. Structure-from-Motion Photogrammetry: A Low-Cost, Effective Tool for Geoscience Applications. Geomorphology 2012, 179, 300–314. [Google Scholar] [CrossRef] [Scilit]
- Schönberger, J.L.; Frahm, J.-M. Structure-from-Motion Revisited. In Proceedings of the IEEE Conference on Computer Vision and Pattern Recognition (CVPR), Las Vegas, NV, USA, 27–30 June 2016; pp. 4104–4113. [Google Scholar]
- Hartley, R.; Zisserman, A. Multiple View Geometry in Computer Vision, 2nd ed.; Cambridge University Press: Cambridge, UK, 2004. [Google Scholar]
- Raumonen, P.; Kaasalainen, M.; Åkerblom, M.; Kaasalainen, S.; Kaartinen, H.; Vastaranta, M.; Holopainen, M.; Disney, M.; Lewis, P. Fast Automatic Precision Tree Models from Terrestrial Laser Scanner Data. Remote Sens. 2013, 5, 491–520. [Google Scholar] [CrossRef] [Scilit]
- Hackenberg, J.; Spiecker, H.; Calders, K.; Disney, M.; Raumonen, P. SimpleTree—An Efficient Open Source Tool to Build Tree Models from TLS Clouds. Forests 2015, 6, 4245–4294. [Google Scholar] [CrossRef] [Scilit]
- Disney, M.; Burt, A.; Wilkes, P.; Armston, J.; Duncanson, L. Weighing Trees with Lasers: Advances, Challenges and Opportunities. Interface Focus 2018, 8, 20170048. [Google Scholar] [CrossRef] [Scilit]
- Miller, J.; Morgenroth, J.; Gomez, C. 3D Modelling of Individual Trees Using a Handheld Camera: Accuracy of Height, Diameter and Volume Estimates. Urban For. Urban Green. 2015, 14, 932–940. [Google Scholar] [CrossRef] [Scilit]
- Lau, A.; Bentley, L.P.; Martius, C.; Shenkin, A.; Bartholomeus, H.; Raumonen, P.; Malhi, Y.; Jackson, T.; Herold, M. Quantifying Branch Architecture of Tropical Trees Using Terrestrial LiDAR and 3D Modelling. Trees 2018, 32, 1219–1231. [Google Scholar] [CrossRef] [Scilit]
- Hartley, R.J.L.; Jayathunga, S.; Morgenroth, J.; Pearse, G.D. Tree Branch Characterisation from Point Clouds: A Comprehensive Review. Curr. For. Rep. 2024, 10, 360–385. [Google Scholar] [CrossRef] [Scilit]
- Jolliffe, I.T.; Cadima, J. Principal Component Analysis: A Review and Recent Developments. Philos. Trans. R. Soc. A 2016, 374, 20150202. [Google Scholar] [CrossRef] [Scilit]
- Zhou, Q.-Y.; Park, J.; Koltun, V. Open3D: A Modern Library for 3D Data Processing. arXiv 2018, arXiv:1801.09847. [Google Scholar] [CrossRef] [Scilit]
- Ester, M.; Kriegel, H.-P.; Sander, J.; Xu, X. A Density-Based Algorithm for Discovering Clusters in Large Spatial Databases with Noise. In Proceedings of the Second International Conference on Knowledge Discovery and Data Mining (KDD-96), Portland, OR, USA, 2–4 August 1996; pp. 226–231. [Google Scholar]
- ANSI A300 Committee. ANSI A300 (Part 1): Standard Practices (Pruning); Tree Care Industry Association: Londonderry, NH, USA, 2001. [Google Scholar]
- ANSI A300 Committee. ANSI A300 (Part 3): Supplemental Support Systems; Tree Care Industry Association: Londonderry, NH, USA, 2006. [Google Scholar]
- International Society of Arboriculture. Best Management Practices: Tree Pruning; International Society of Arboriculture: Champaign, IL, USA, 2019. [Google Scholar]
- International Society of Arboriculture. Best Management Practices: Tree Support Systems; International Society of Arboriculture: Champaign, IL, USA, 2014. [Google Scholar]
- Goodfellow, J.W. Utility Tree Risk Assessment: Best Management Practices; International Society of Arboriculture: Champaign, IL, USA, 2020. [Google Scholar]
- International Society of Arboriculture. Basic Tree Risk Assessment Form; International Society of Arboriculture: Champaign, IL, USA, 2013. [Google Scholar]
- International Society of Arboriculture. Appendix 7: Tree Risk Assessment Process; International Society of Arboriculture: Champaign, IL, USA, 2017. [Google Scholar]
- Health and Safety Authority (HSA). Code of Practice for Managing Safety and Health in Forestry Operations; HSA: Dublin, Ireland, 2023.
- EAS 04:2025; European Tree Assessment Standard. European Arboricultural Standards: Bad Honnef, Germany, 2025.
- Gené-Mola, J.; Sanz-Cortiella, R.; Rosell-Polo, J.R.; Morros, J.-R.; Ruiz-Hidalgo, J.; Vilaplana, V.; Gregorio, E. Fuji-SfM dataset: A collection of annotated images and point clouds for Fuji apple detection and location using structure-from-motion photogrammetry. Data Brief 2020, 30, 105591. [Google Scholar] [CrossRef] [Scilit]
- Umeyama, S. Least-Squares Estimation of Transformation Parameters Between Two Point Patterns. IEEE Trans. Pattern Anal. Mach. Intell. 1991, 13, 376–380. [Google Scholar] [CrossRef] [Scilit]
- Klein, R.W.; Koeser, A.K.; Hauer, R.J.; Hansen, G.; Escobedo, F.J. Risk Assessment and Risk Perception of Trees: A Review of Literature Relating to Arboriculture and Urban Forestry. Arboric. Urban For. 2019, 45, 26–38. [Google Scholar] [CrossRef] [Scilit]
- ISO 31000:2018; Risk Management—Guidelines. International Organization for Standardization (ISO): Geneva, Switzerland, 2018.
- ANSI A300 Committee. ANSI A300 (Part 9): Tree Risk Assessment; Tree Care Industry Association: Londonderry, NH, USA, 2017. [Google Scholar]
- Mokroš, M.; Výbošťok, J.; Tomaštík, J.; Grznárová, A.; Valent, P.; Slavík, M.; Merganič, J. High Precision Individual Tree Diameter and Perimeter Estimation from Close-Range Photogrammetry. Forests 2018, 9, 696. [Google Scholar] [CrossRef] [Scilit]
- Roberts, J.W.; Koeser, A.K.; Abd-Elrahman, A.H.; Hansen, G.; Landry, S.M.; Wilkinson, B.E. Terrestrial photogrammetric stem mensuration for street trees. Urban For. Urban Green. 2018, 35, 66–71. [Google Scholar] [CrossRef] [Scilit]
- Mulverhill, C.; Coops, N.C.; Tompalski, P.; Bater, C.W.; Dick, A.R. The utility of terrestrial photogrammetry for assessment of tree volume and taper in boreal mixed wood forests. Ann. For. Sci. 2019, 76, 83. [Google Scholar] [CrossRef] [Scilit]
- Iglhaut, J.; Cabo, C.; Puliti, S.; Piermattei, L.; O’Connor, J.; Rosette, J. Structure from Motion Photogrammetry in Forestry: A Review. Curr. For. Rep. 2019, 5, 155–168. [Google Scholar] [CrossRef] [Scilit]
- Kędra, K.; Barbeito, I.; Dassot, M.; Vallet, P.; Gazda, A. Single-image photogrammetry for deriving tree architectural traits in mature forest stands: A comparison with terrestrial laser scanning. Ann. For. Sci. 2019, 76, 5. [Google Scholar] [CrossRef] [Scilit]
- Šleglová, K.; Hrdina, M.; Surový, P. Discovering Tree Architecture: A comparison of the performance of 3D Digitizing and Close-Range Photogrammetry. Remote Sens. 2025, 17, 202. [Google Scholar] [CrossRef] [Scilit]
- Veteran Trees: A Guide to Good Management (IN13). Natural England—Access to Evidence. Available online: https://publications.naturalengland.org.uk/publication/75035 (accessed on 21 December 2025).
- Ancient Tree Forum. Guidance on Managing Ancient and Other Veteran Trees. Available online: https://www.ancienttreeforum.org.uk/ancient-trees/protecting-ancient-and-veteran-trees/ancient-tree-care-management/ (accessed on 21 December 2025).
- Fröhlich, A.; Przepióra, F.; Drobniak, S.; Mikusiński, G.; Ciach, M. Public Safety Considerations Constrain the Conservation of Large Old Trees and Their Crucial Ecological Heritage in Urban Green Spaces. Sci. Total Environ. 2024, 948, 174919. [Google Scholar] [CrossRef] [Scilit]
- Greek Ombudsman. Official Correspondence to the Ministry of Interior: “Rational Pruning of Trees within the Urban Fabric” [English Translation of Greek Title]; document no. 295603/25937; Greek Ombudsman: Athens, Greece, 2022. (In Greek)
- Geotechnical Chamber of Greece, Eastern Central Greece Branch. Official Correspondence: “Rational Pruning of Trees in Urban Areas” [English Translation of Greek Title]; protocol no. 277; Geotechnical Chamber of Greece, Eastern Central Greece Branch: Athens, Greece, 2021. (In Greek) [Google Scholar]
- Tinkham, W.T.; Woolsey, G.A. Influence of Structure from Motion Algorithm Parameters on Metrics for Individual Tree Detection Accuracy and Precision. Remote Sens. 2024, 16, 3844. [Google Scholar] [CrossRef] [Scilit]
- Forest Products Laboratory. Wood Handbook—Wood as an Engineering Material. General Technical Report FPL–GTR–190; U.S. Department of Agriculture, Forest Service, Forest Products Laboratory: Madison, WI, USA, 2010. [Google Scholar]
- Niklas, K.J. Plant Biomechanics: An Engineering Approach to Plant Form and Function; University of Chicago Press: Chicago, IL, USA, 1992. [Google Scholar]

Disclaimer/Publisher’s Note: The statements, opinions and data contained in all publications are solely those of the individual author(s) and contributor(s) and not of MDPI and/or the editor(s). MDPI and/or the editor(s) disclaim responsibility for any injury to people or property resulting from any ideas, methods, instructions or products referred to in the content. |
© 2026 by the authors. Licensee MDPI, Basel, Switzerland. This article is an open access article distributed under the terms and conditions of the Creative Commons Attribution (CC BY) license.