Abstract
Modelling the spatial distribution of plants is one of the indirect methods for predicting the properties of plants and can be defined based on the relationship between the spatial distribution of vegetation and environmental variables. In this article, we introduce a new method for the spatial prediction of the dominant trees and species, through a combination of environmental and satellite data. Based on the basal area factor (BAF) frequency for each tree species in a total of 518 sample plots, the dominant tree species were determined for each plot. Also, topographical maps of primary and secondary properties were prepared using the digital elevation model (DEM). Categories of soil and the climate maps database of the Doctor Bahramnia Forestry Plan were extracted as well. After pre-processing and processing of spectral data, the pixel values at the sample locations in all the independent factors such as spectral and non-spectral data, were extracted. The modelling rates of tree and shrub species diversity using data mining algorithms of 80% of the sampling plots were taken. Assessment of model accuracy was conducted using 20% of samples and evaluation criteria. Random forest (RF), support vector machine (SVM) and k-nearest neighbor (k-NN) algorithms were used for spatial distribution modelling of dominant species groups using environmental and spectral variables from 80% of the sample plots. Results showed physiographic factors, especially altitude in combination with soil and climate factors as the most important variables in the distribution of species, while the best model was created by the integration of physiographic factors (in combination with soil and climate) with an overall accuracy of 63.85%. In addition, the results of the comparison between the algorithms, showed that the RF algorithm was the most accurate in modelling the diversity.
1. Introduction
The forests of Iran cover an area of about 12.4 million ha, comprising 7.4% of the country’s area [1]. Of the five vegetation regions, the most important according to forest density, canopy cover and diversity, is the Hyrcanian (Caspian) region [2]. In forest ecosystems, trees and shrubs are living either independently (individually) or in association with each other, where some species are dominant over other species based on different biotic and non-biotic factors, comprising a stand with an area larger than 0.5 hectare or group species with an area smaller than 0.5 hectare.
Forest stand types or dominant trees and shrubs species mapping is one of the most important ways to manage and protect plant communities. Information about dominant tree species is required to assess forest resilience and vulnerability to any threat, for instance, drought and pathogens [3]. Investigating and using other methods with less cost and time can be an alternative approach for field mapping. One of the alternative ways of mapping is the use of environmental data which are spatially related with forest tree grouped species or stands. Plant spatial distribution modelling is one of the indirect methods for predicting the properties of plants and can be defined as the relationship between the spatial distribution of vegetation and environmental variables. Recognition of the relationship between environmental factors and the plant species distribution plays an important role in environmental planning and ecosystem management [4,5]. Therefore, the appearance and stability of each plant species is generally influenced by environmental factors and the relationship between them and one or more environmental factors that have the greatest impact on their establishment.
In recent decades, airborne or space-borne remote sensing (RS) images, have been given the ability to record the electromagnetic radiation of vegetation at various wavelengths. Tree species identification using remote sensing is a classic topic in forestry [6] The RS data with different spatial, spectral, and radiometric resolutions are presented as another alternative way for estimating and modelling vegetation attributes [2]. The estimated results were often differentiated according to chosen algorithms and studied area conditions [7]. However, some studies have already addressed the challenges in accurate tree species classification; Shataee et al. [8] and Mohammadi et al. [9] reported that using only spectral data could not provide useful information. Despite the emergence of very high resolution (VHR) sensors and their significance in the classification of dominant tree species, the limited number of spectral bands did not permit precise species discrimination [10]. Several other studies also investigated the possibility of using airborne hyperspectral imagery [11,12,13] LiDAR data or even a combination of multiple other techniques, for instance, auxiliary (environmental) data for prediction of tree species [14,15,16]. It is clear that differences in biochemical properties of different tree species and structural parameters of trees such as the texture and surface of the leaves, are better preserved using hyperspectral information, allowing continuous sampling of the electromagnetic spectrum. Moreover, LiDAR-based information about canopy structure to hyperspectral responses is also crucial for improving tree species classification of dominant tree species [17]. However, the operational use of these kind of data is still a challenging task, mainly because of their high cost and limited availability.
To overcome the above limitations, we attempted a different and more radical approach toward the prediction of dominant tree species, through a combination of satellite and auxiliary (environmental) data. Spatial distribution is directly dependent on both competition and environmental conditions such as the solar radiation, climate, water, topography and available nutrients. If these factors and their behaviors in relation to the distribution of species could be determined, it will be possible to achieve the prediction of dominant tree and shrub species distribution models [18]. Therefore, it is possible to investigate spatial distribution of these features by the environmental variables [19,20]. Until now, many studies have been conducted to predict the distribution of vegetation with physiographic, climate or soil factors. In many studies, physiographic factors have been reported as the most influential and were used to classify and predict vegetation characteristics as well as species distribution at different scales [21]. For instance, the use of elevation and slope [22,23], aspect [23,24] and secondary topography variable of potential solar radiation [22,24] were reported as the most important factors influencing the distribution of tree species. Additionally, edaphic factors such as soil type, moisture, soil temperature and soil nutrient availability to plants, are the most important factors affecting the distribution of tree species [25,26,27]. On the other hand, climatic factors can increase, decrease, or change the distribution of tree species depending on the species type. Several studies that investigated the relationship between climatic factors with the distribution of tree species, identified rain [28,29] and temperature [23,29] as the most important factors affecting the plant communities.
Also, previous studies have shown that the use of auxiliary data in combination with spectral data can improve the prediction results [30,31]. The use of high and very high spatial resolution satellite imagery (such as QuickBird IKONOS and Landsat) can result in high-precision imputation, especially for tree species and plot estimation [2]. Also, many studies concluded that, adding satellite-based spectral data in combination with environmental data can improve the prediction of qualitative and quantitative characteristics of the forests. Mohammadi et al. [31] showed an improvement in the classification results of forest types by combining spectral and auxiliary data by determining the prior probability and creating spatial models of occurrence of forest types. With their results, many studies verified the potential for classification improvements by adding auxiliary data. As an example, Wheatley et al. [32] used topographic data with Landsat thematic mapper (TM) images to improve the accuracy of land cover maps. Also, Saatchi et al. [33] used the moderate-resolution imaging spectroradiometer (MODIS), quick scatterometer (QSCAT), the shuttle radar topography mission (SRTM), and the tropical rainfall measuring mission (TRMM) together with elevation and solar radiation data to model the potential distribution of tree species and diversity. In addition, Wang et al. [34] combined TM and auxiliary data, including digital elevation model (DEM), slope and moisture percentage in vegetation classification. Hernández Stefanoni et al. [35] combined geostatistical modelling and RS data to improve tropical species richness mapping. In another study, Adhikari et al. [36] investigated the possibility of spatial modelling of Ilex Khasiana P., using 16 environmental parameters, while Riemer Sørensen et al. [37] modelled the distribution of 10 commercial palm species using climatic, topographic, and spectral data, as well as a combination of them.
In the past two decades, parametric algorithms such as multiple linear and non-linear regressions, have been popular methods for estimating forest characteristics using non-spectral and spectral data [38,39]. Recently, non-parametric algorithms have been used for the prediction and estimation of forest attributes, because of some advantages they have over parametric algorithms, i.e., flexibility and the ability to describe non-linear dependencies, the fact that they are free from the assumption of any given probability distribution, and the fact that the observations are assumed to be independent of each other [40,41,42]. So far, non-parametric algorithms such as the generalized linear model (GLM), artificial neural networks (ANN), random forest (RF), support vector machine (SVM), and the k-nearest neighbor (k-NN), are used to predict the biological properties of forests [43]. The non-parametric machine learning techniques, have demonstrated superior performances over classic regression analysis for estimating forest attributes. The non-parametric models are more efficient than parametric models due to the possibility of using more than one independent variable simultaneously and also because there is no need for the data to be normally distributed. Among the non-parametric algorithms; the RF, SVM and k-NN are three of many machine learning algorithms that demonstrated good performance in forest attribute estimations [2]. Thus, in the present study, these three commonly used data mining classifier algorithms are used for tree species prediction.
1.1. k-Nearest Neighbor
The k-NN method is one of the simplest and most popular data-mining algorithms used for classification and regression. k-NN is widely used for the estimation of forest description using various topographic and remote-sensing data [44,45,46,47,48,49]. In k-NN implementations, three factors should be determined including the number of k, the type of distance measured and weights for nearest neighbors.
1.2. Support Vector Machine Classification
This algorithm is suitable for both classification and regression techniques based on statistical learning theory [50]. Generally, SVMs focus on the boundary between classes and map the input space created by independent variables using a non-linear transformation according to a kernel function. Linear, polynomial radial basis function (RBF) and sigmoid are the most commonly used kernel types. The RBF is the most popular kernel, which is used in SVMs [51,52]. According to our literature review, SVM has been used for forest classification [53,54,55]. In their work, Sheeren et al. [10] found SVM, among various non-parametric techniques, to be the best classifier with very close results to other classifiers among them (k-NN and RF).
1.3. Random Forest
RF is a new algorithm to the field of data mining and is designed to produce accurate predictions that do not overfit the data [56,57]. RF can also be used for regression-type problems (to predict a continuous dependent variable) and classification problems (to predict a categorical dependent variable). Implementation of RF depends on the regularization of decision tree and stopping parameters. The decision tree model parameters include the maximum number of trees that must be grown in the forest and the number of variables (k predictor or independent variables in each node for predicting depend values) that are randomly selected in each node [58]. Alternatively, choosing a small number of predictor variables may downgrade prediction performance, because this can exclude variables that may account for most of the variability and trends in the data [58]. The stopping parameters or control parameters are used to stop running the algorithm when satisfactory results have been achieved [2]. In some studies, such as Shataee et al. [2] and Garzón et al. [59] the RF has been used for the prediction of forest attributes.
The main aim of this study was to investigate the possibility of using high resolution satellite images derived from QuickBird with non-parametric algorithms, to estimate the distribution of tree species and also to investigate the effect of the environmental factors upon tree group species. Our literature review showed that no study has been carried out on the application of machine-learning algorithms (k-NN, SVM or RF algorithms) using QuickBird data for the prediction of distribution of tree species groups in the Hyrcanian forest. Therefore, for the purposes of this study, three of the most commonly used non-parametric machine-learning methods were applied for the first time to classify the spatial distribution of forest tree species as grouped (forest stand types) by climate, topography, soil data and a combination of them with the spectral data of QuickBird, in the Dr. Bahramnia forestry plan site in the Golestan province, in northeastern Iran. Overall, we wanted to study how helpful the combination between spectral and non-spectral data can be, in increasing the accuracy of the species distribution modelling (SDM).
2. Materials and Methods
2.1. Study Area
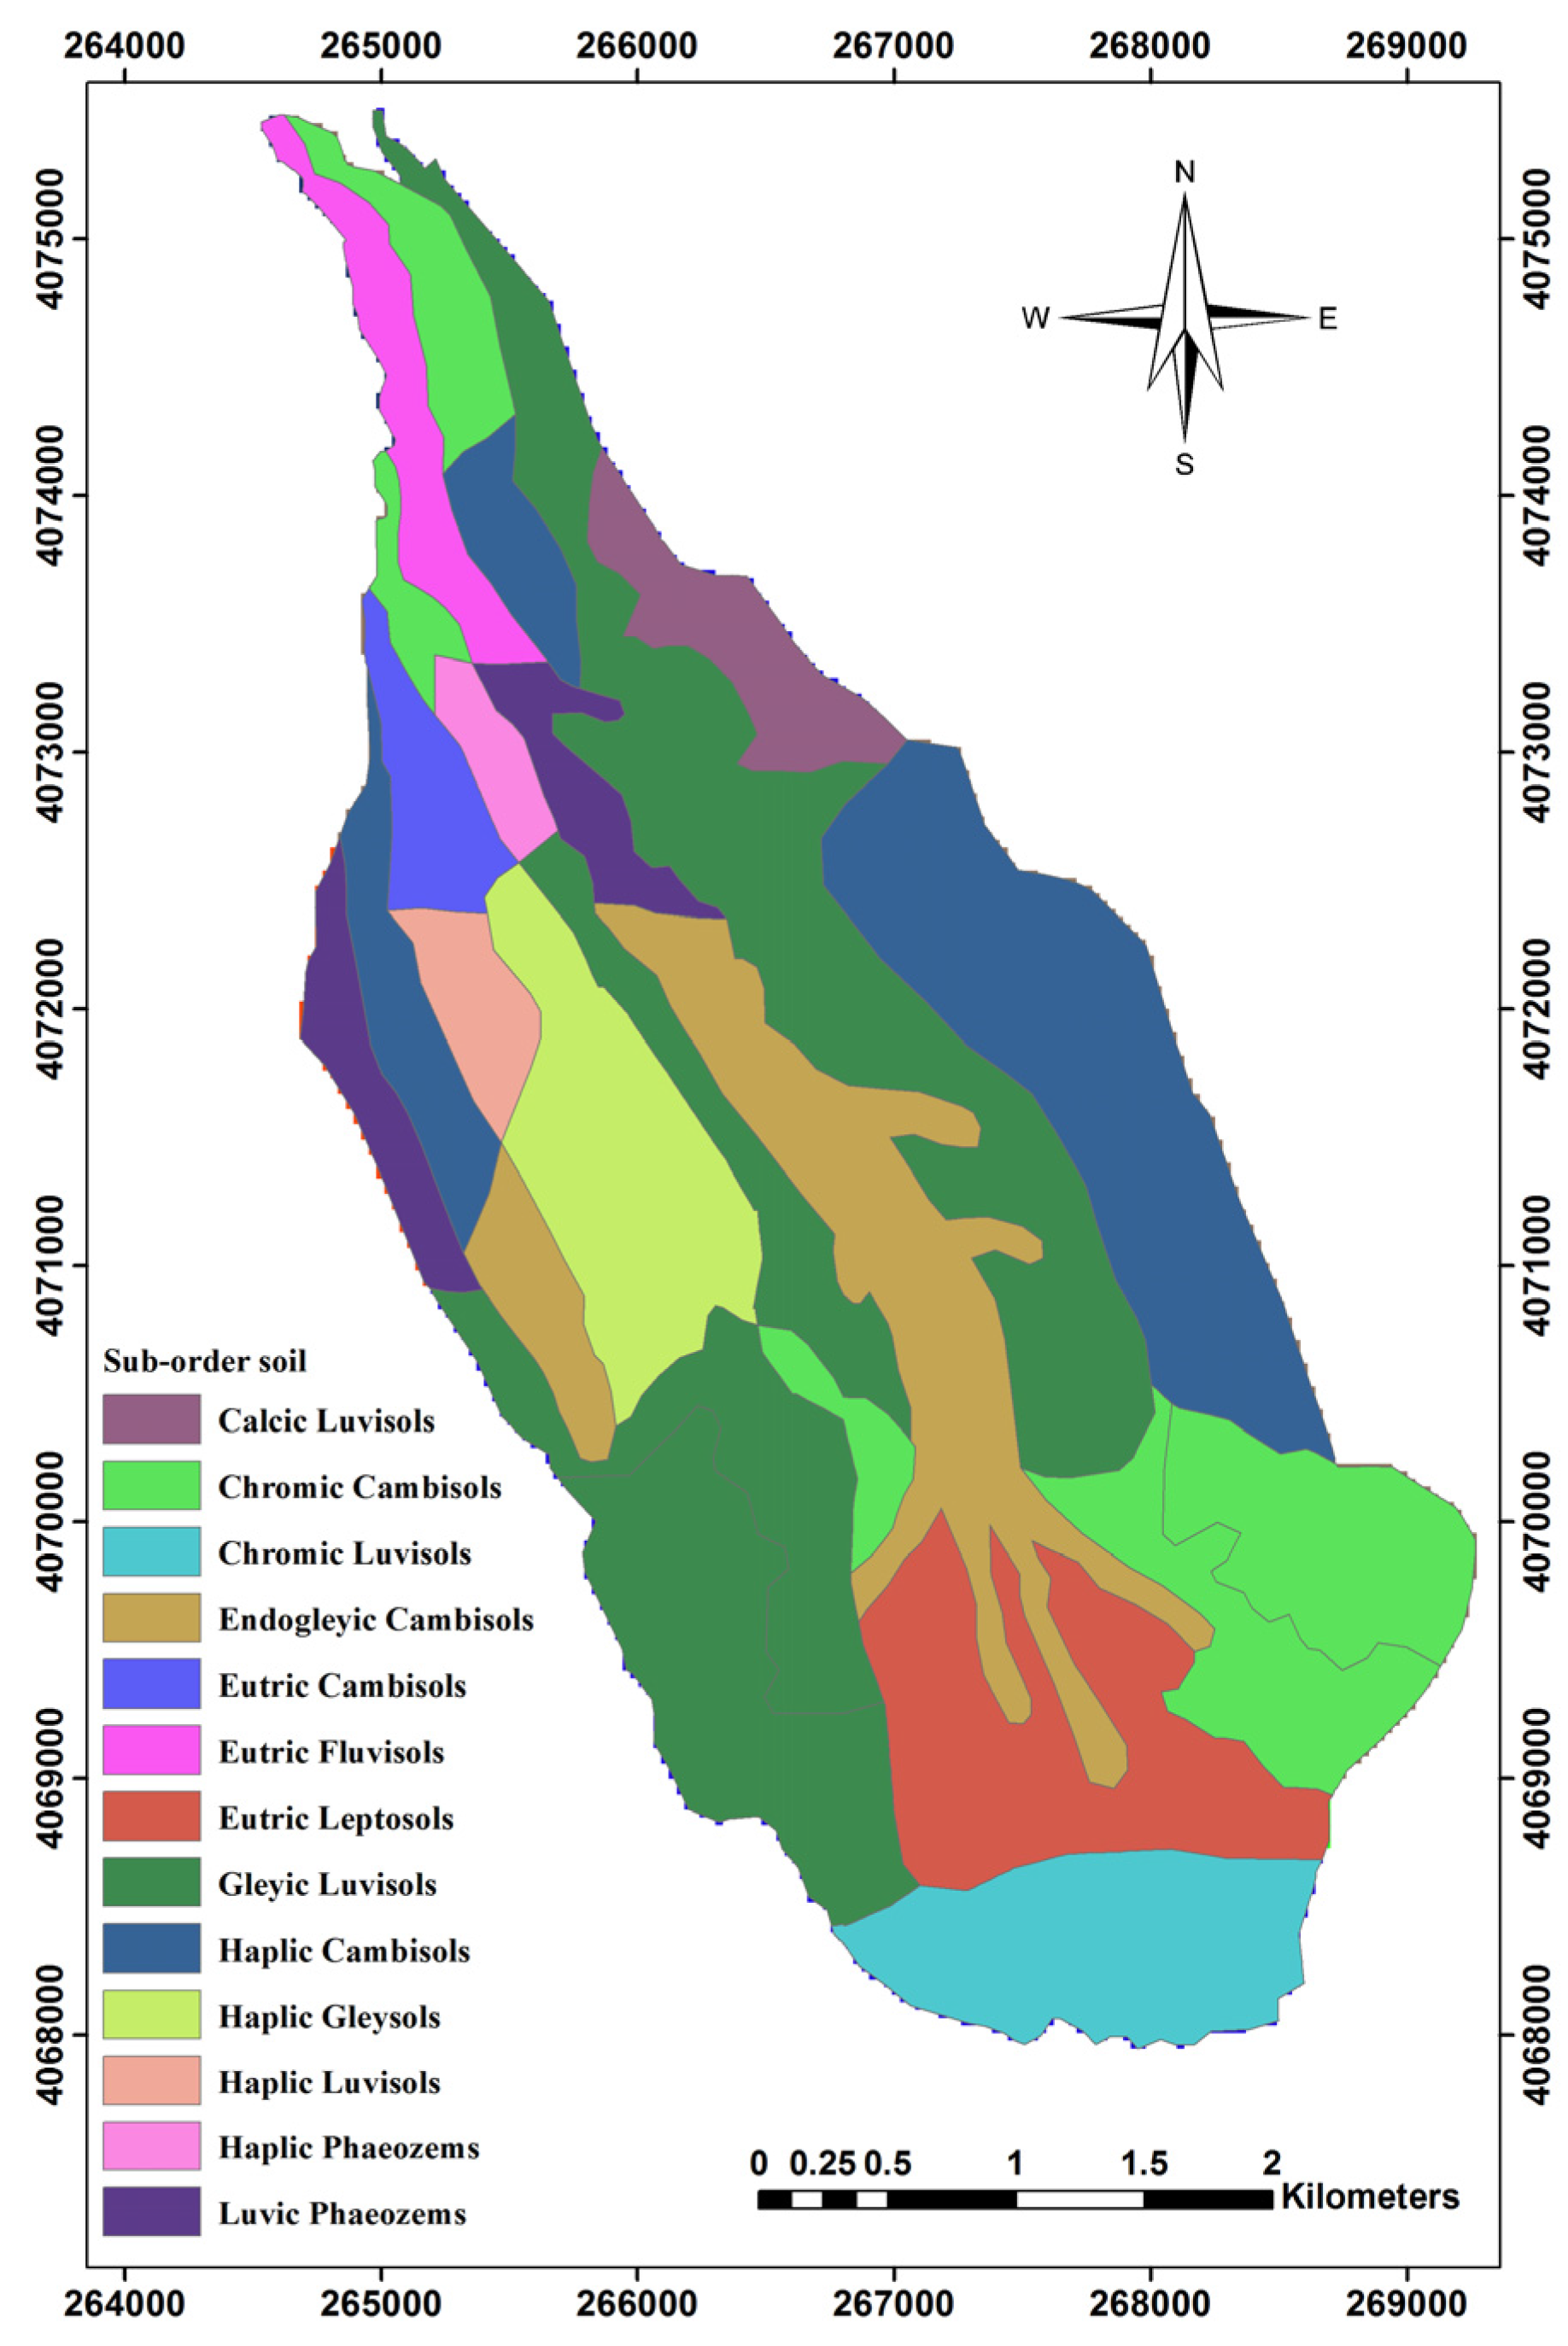
The study area is located south-west of Gorgan city in Golestan province in Iran (36°43′ N to 36°46′ N and 54°21′ E to 54°24′ E). The projection which was used in both Figure 1 and Figure 2 was UTM WGS 1984 zone 40 N. The total area is 1714 hectares, where the green markers indicate the sample plots as seen in Figure 1. The elevation of the study area ranges from 220 to 1012 m, the slope range is between 0 and 80% and the soil type is characterized as brown and grey-brown (Figure 2). The average precipitation is 649 mm. In regards to aspect, 45% of the total area is facing to the west, 42% to the north, 10% to the east and 3% to the south. Regarding slope, 81% of the study area was between 0% and 30%, 18% between 31% and 60% and 1% above 61%. Information for different species is presented in Table 1.
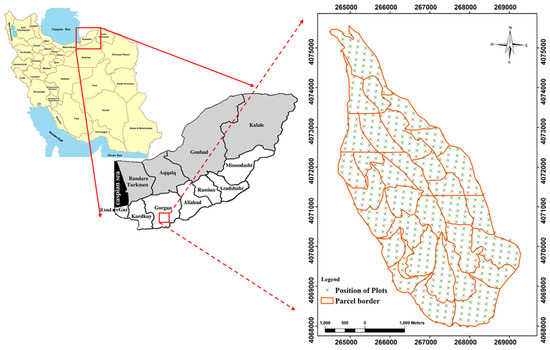
Figure 1.
Location of the research area in Dr. Bahramnia’s forestry district, Golestan province in northern Iran.

Figure 2.
Classification of Sub-order types of soil within the study area.

Table 1.
Statistical table displays the species distribution based on inventory data.
2.2. Field Survey
To determine the dominant trees, we used the information of measured trees from 518 permanent sample plots with a radius of 17.5 m, plotted in a systematic network of 150m × 200 m grids. The geographic position of plot centers and forest attributes such as diameter, height, crown diameter, name of species and tree health status were recorded on inventory forms. We included all trees with diameters greater than 10 cm for measuring the basal area. Based on the basal area factor (BAF) for every species in each plot, we were able to extract and specify the dominant tree species. Thus, any species with a basal area frequency above 50% in a plot, was selected as the dominant species. In addition, plots that did not contain a particular species group (basal area frequency of all species was lower than 50%) were excluded from the analysis, because they can cause uncertainty in tree species identification.
2.3. Environmental Data
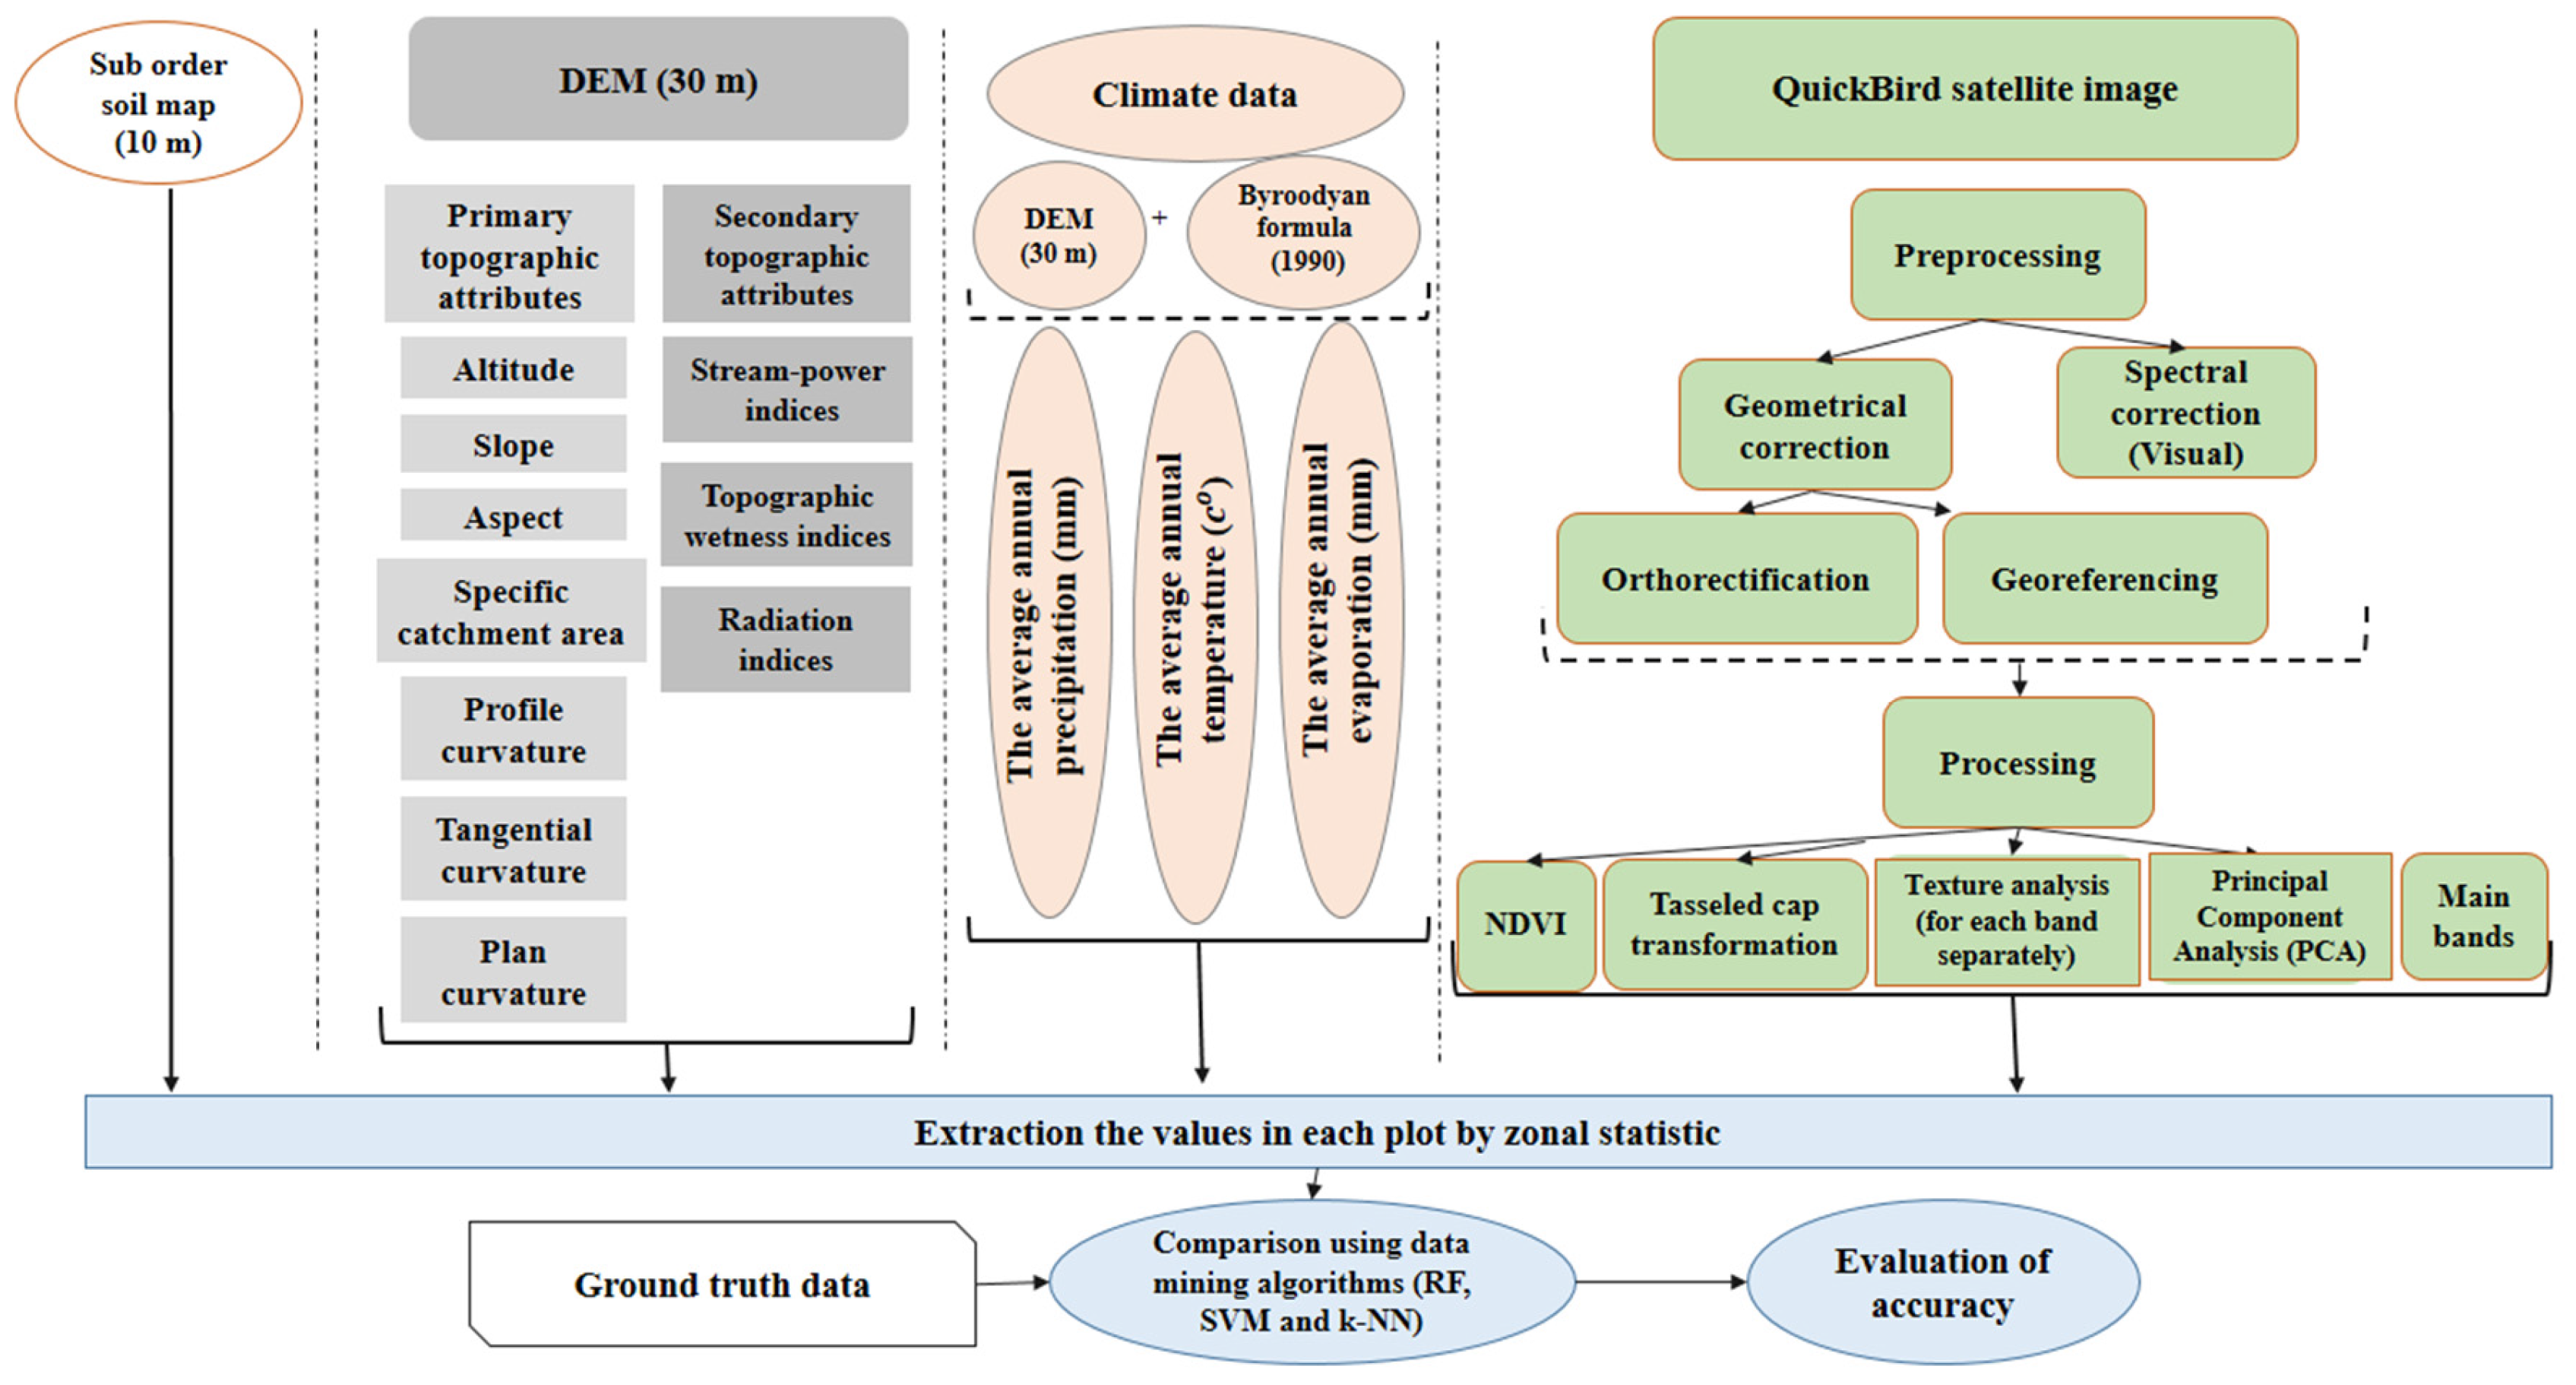
We then constructed a DEM (cell size = 30 m) for the study area by using the topographic map (1/25,000 scale with 10 m contour interval). To evaluate the DEM quality, we first applied the hillshade tool in order to create a shaded relief from the DEM, by considering the illumination source angle and shadows to be able to visually identify large errors (noise and sudden change in values). Then, we used the contour tool in ArcGIS 10.1 software (ESRI, Redlands, LA, USA), to recreate the contours from the DEM (15 m contour interval) and finally compared the original contours with new contours which came from the interpolation.
Using a variety of software such as ArcGIS V.9.3 (ESRI, Redlands, LA, USA, 2008), and terrain analysis system (TAS V.1.0), (University of Western Ontario, Ontario, Canada, 2003), we used the DEM to construct primary and secondary topographic characteristic maps (Table 2 and Table 3) and climatic maps such as average annual precipitation (Equation (1)), average annual temperature (Equation (2)) and average annual evaporation (Equation (3)). These equations were derived based on information provided by metrological stations during two decades [60]:
where Y is the average annual precipitation (mm) and X is representing the elevation.
where T is the average annual temperature () and X is representing the elevation.
where ETP is the average annual evaporation (mm) and X is representing the elevation.
Table 2.
Primary topographic attributes that were computed by terrain analysis from digital elevation model (DEM) data in this study. Sources: [61,62,63].
Table 3.
Secondary topographic attributes that were computed by terrain analysis from DEM data in this study. Sources: [61,62,63].
The zonal statistic algorithm was used for extracting the sub-order soil factor (Table 4) from [64] and other layers such as topographic and climatic factors, by using a buffer layer around the center of plots (17.5 m radius).
Table 4.
Characteristics of Sub-order types of soil.
2.4. QuickBird Data
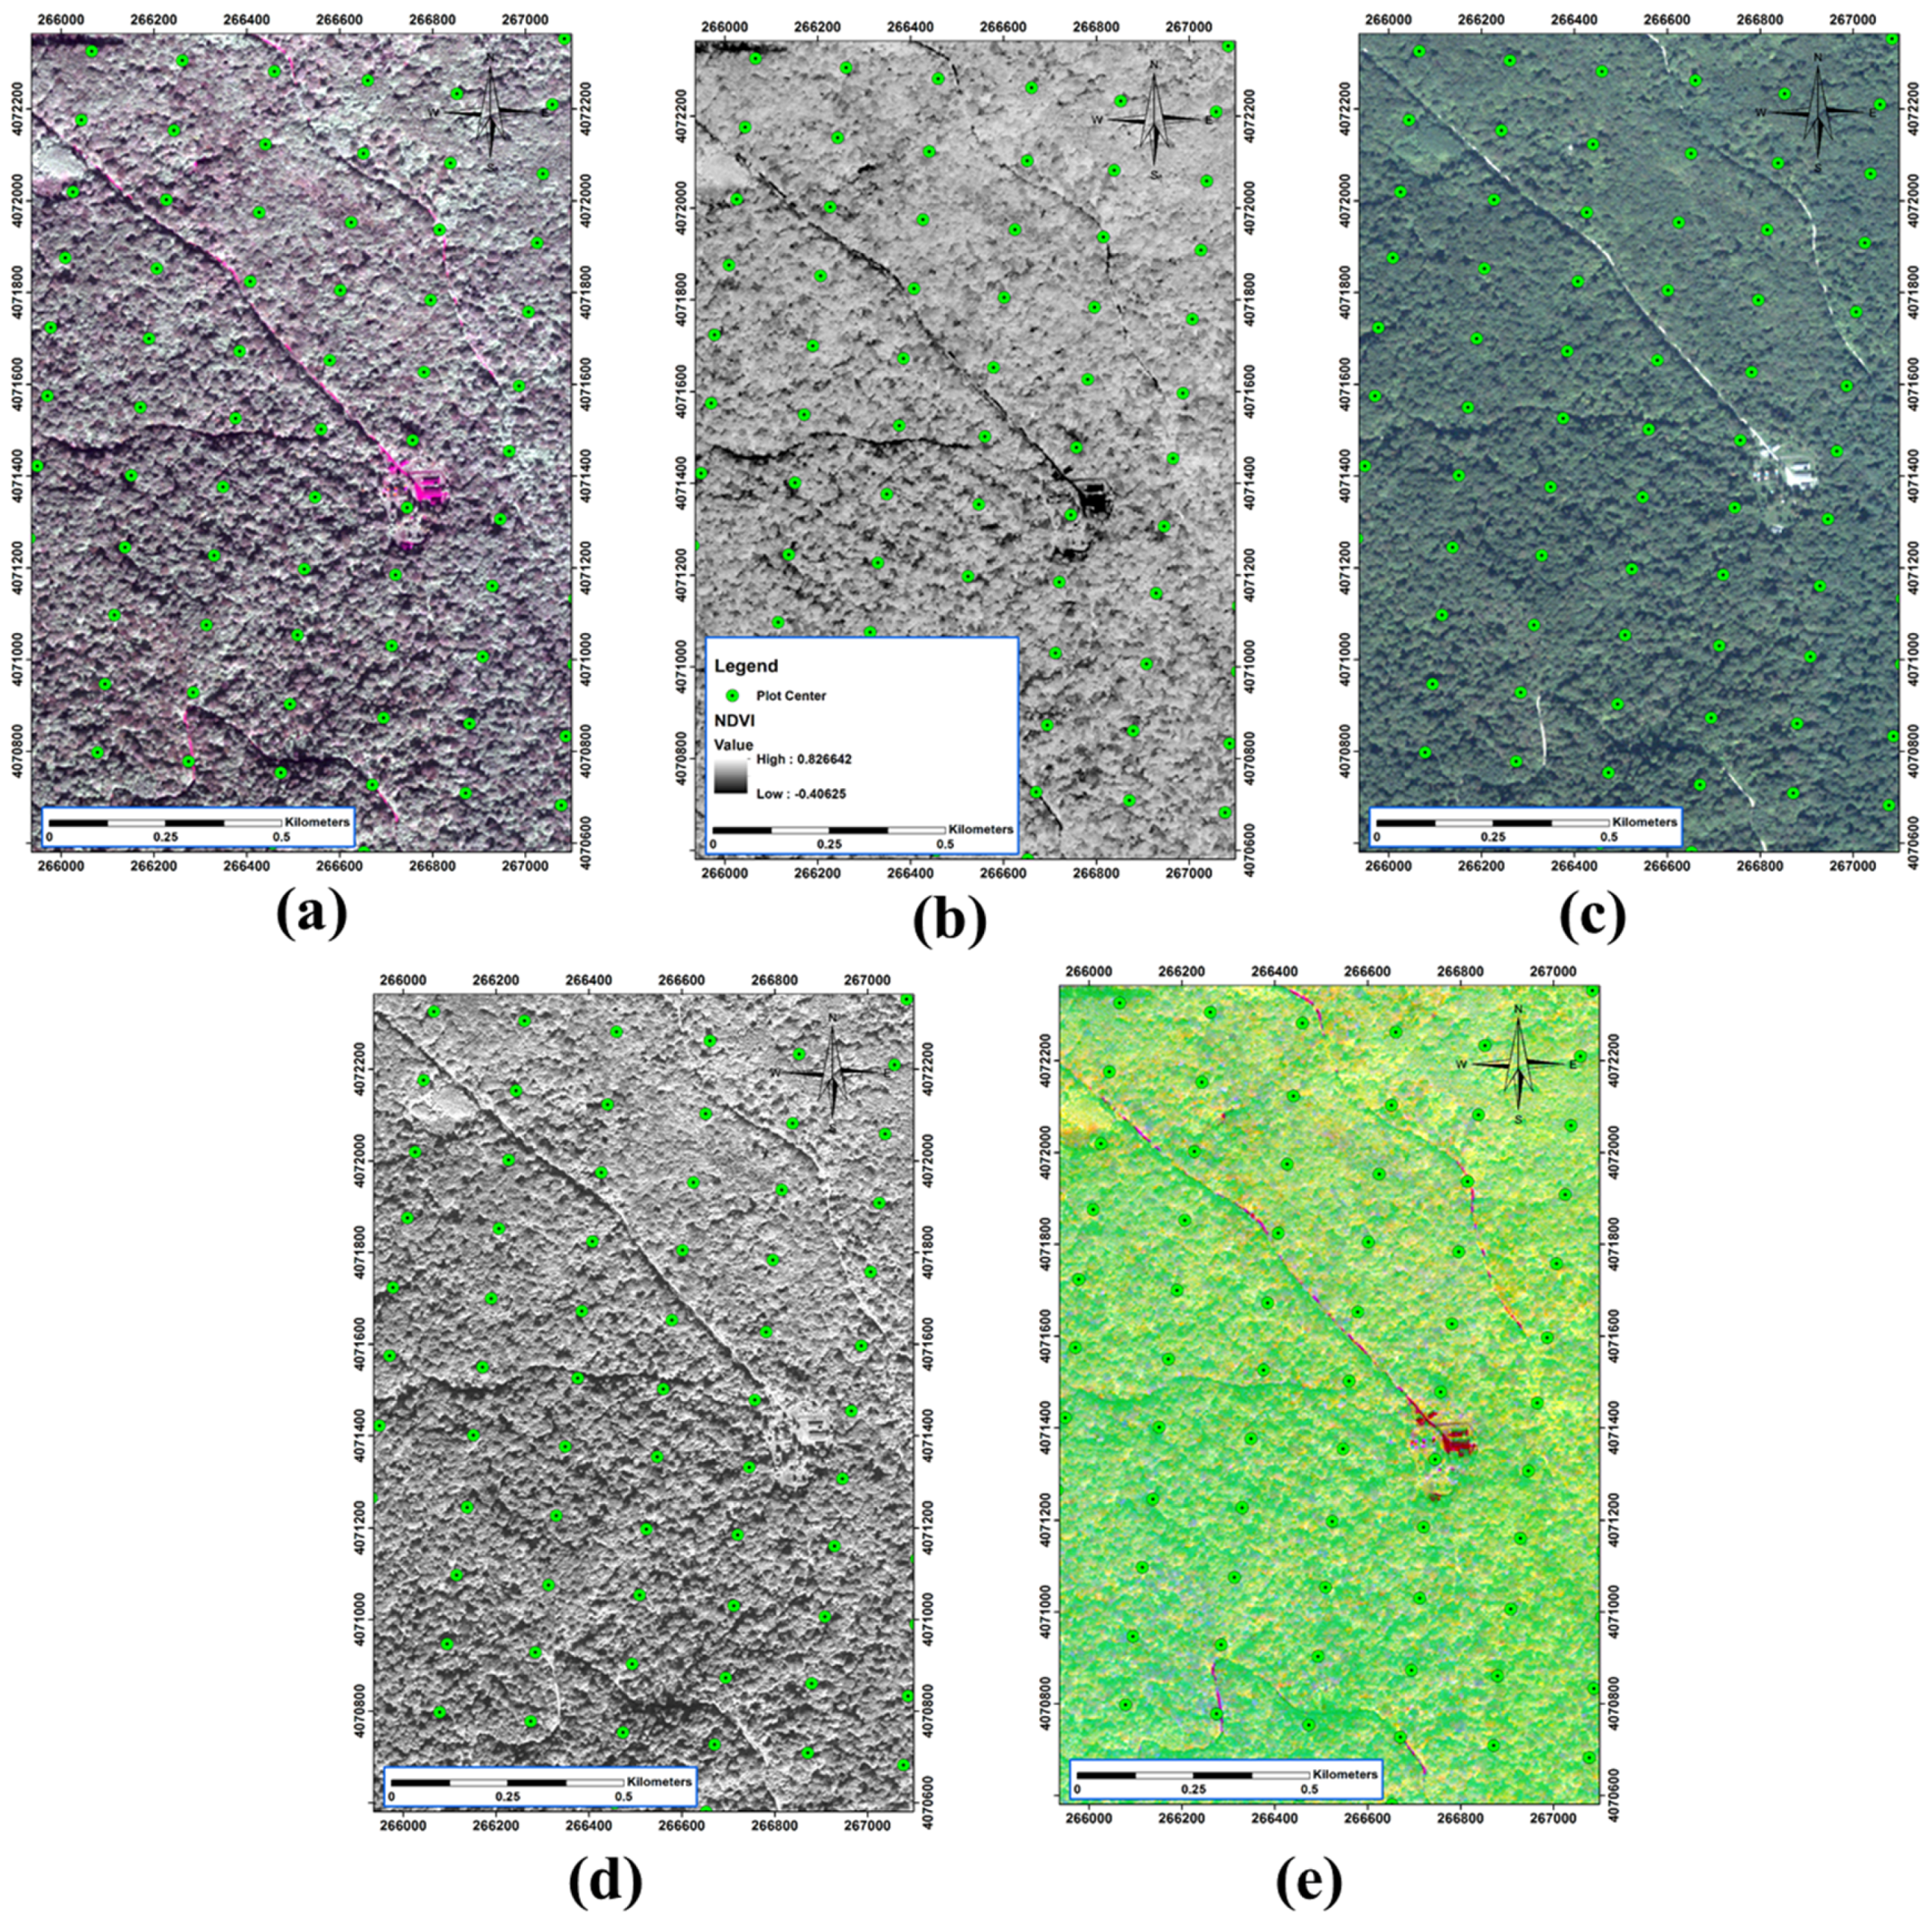
QuickBird was a high-resolution, commercial earth observation satellite, owned by Digital Globe launched in 2001 and decayed in January 2015. QuickBird used Ball Aerospace’s Global Imaging System 2000. The satellite collected panchromatic (black and white) imagery at 61 cm resolution and multispectral imagery resolution of 2.44 m at 450 km, and up to 1.63 m at 300 km, respectively as shown in Figure 3. In this study, a window of QuickBird image from 8 October 2008 has been used in four multi-spectral bands with 2.4 m spatial resolution and one panchromatic band with 60 cm spatial resolution. The quantization radiometric level of images was 11 bits [65].
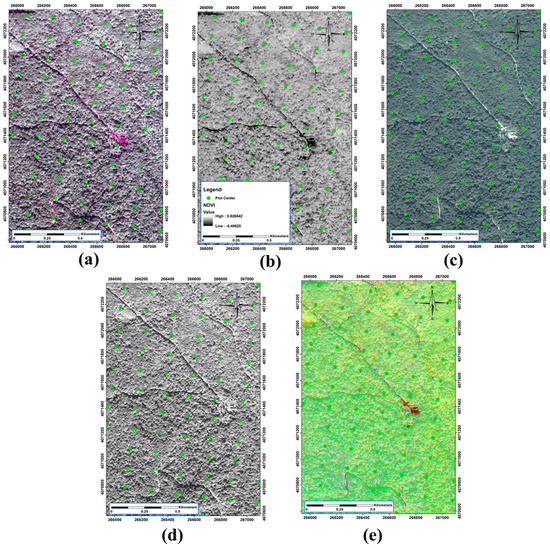
Figure 3.
Illustration of some of the satellite outputs. (a) tasseled cap; (b) normalized difference vegetation index (NDVI); (c) multispectral image; (d) panchromatic image; (e) principal component analysis (PCA) band 1.
2.5. Pre-Processing and Processing of Spectral Data
In the first step, geometric correction was done using DEM with 10 m accuracy in order to eliminate the effect of displacement caused by the topography, using the quadratic equation and nearest neighbor sampling. The geo-referencing mean square error was less than one meter for multi-spectral bands and less than 40 cm for the panchromatic band. Processing of satellite images such as principal component analysis (PCA), tasseled cap transformation (brightness, greenness and moistness) (Table 5), normalized difference vegetation index (NDVI) and texture analysis was performed in order to enhance the spectral differences between tree species.
Table 5.
Conversion coefficient of tasseled cap for QuickBird images.
In this study, 13 texture analysis variables were used, such as mean, variance, entropy, contrast, heterogeneity, homogeneity, angular second moment, correlation, gray-level difference vector (GLDV) Angular second moment, GLDV entropy, GLDV mean, GLDV contrast and inverse difference with kernel window size 12 × 12 for RGB and infrared (IR). While 50 × 50 kernel size was used for the panchromatic band. Overall, 75 RS data layers were included in this study with other non-spectral layers.
2.6. Extracting Data
The whole structure of layer preparation in this work is shown in Figure 4. To extract data, the zonal statistic algorithm in ArcGIS 10.1 software was used to extract the mean of non-spectral and spectral values for each plot, by using a buffer layer around the center of plots with a radius of 17.5 m.
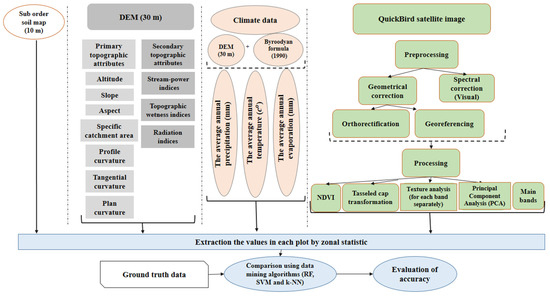
Figure 4.
Data processing workflow illustrates the structure and order of layer preparation and different categories of layers which are used in our study.
Spatial distribution of forest species group modelling was done by grouping variables of topographic, climate, soil, and spectral RS data as a single group or combined using RF, k-NN and SVM algorithms, on 80% of the plots. Algorithm performances were evaluated by using 20% of unused plots in the modelling process by overall accuracy, user, and producer accuracy indicators.
2.7. Randomly Stratified Sample Splitting Method
In all statistical analyses that need to have prototype samples, i.e., training, test and validation data sets, the sample should be uniform and representative of all the data [66]. Therefore, the plots were first stratified based on their frequency distributions in different internal categories and then randomly divided into two training and validation sets. In other words, they had a sufficient distribution range in terms of their frequency in whole classes. This sample splitting method can be called a randomly stratified sample splitting [2] (Table 6). To achieve this, the values of plots based on basal area were stratified into categories that are currently being used for classification or mapping of discrete variables in forest management, and the frequency of plots was computed for each category. The training and validation samples were randomly selected as 80% for training plots and 20% for validation of the modelling in each category.
Table 6.
Number of train and test plots in each class.
2.8. Implementation of Machine Learning Methods
k-Nearest Neighbor. In k-NN implementations, the number of k-NNs, the type of distance measure and the weighting for nearest neighbors are three important parameters. Determination of k is very important in terms of calculation time and producing unbiased results.
According to McRobert [67] a 1–20 range of k is the best option in terms of using the k-NN algorithm. He also stated that a higher k value may lead to lower noise effect during calculation, however, this requires taking a larger number of samples. It is important to mention that in the case of a higher k value, the pixel-level results will average towards the mean [68], leading to a higher bias and less precision. In most of the studies, the optimal k was reported to be between 5 and 10 [69,70,71]. However, in some other studies, such as [48] with k between 1 and 35 and [67] with k between 1 and 50, k values decreased the bias of the modelling process.
A smaller k often leads to a higher variance and less stable results [72]. Therefore, the optimal k is dependent on the data and goals of the estimation [73]. In addition, for an efficient comparison of distance measures in the k-NN algorithm, four distance measuring methods are available in Statistica software (StatSoft. Inc., Tulsa, OK, USA), including Euclidean, squared Euclidean, city block (Manhattan) and Chebychev. In this study, after a primary test on the results of different distance measurement methods and k values (between 5 and 50), weighted squared Euclidean distance, (k = 50) was used for modelling with the k-NN algorithm and its results were compared with each other.
Support Vector Machine Regression. The prerequisite for SVR to achieve better results, is the appropriate determination of the parameters that play key roles in achieving higher accuracy and better performance [74]. The specified grid search using v-fold cross-validation [52] is the most commonly used method to identify suitable parameters, i.e., epsilon (ε) and capacity (C) with fixed gamma that would produce high-accuracy results. A brief description of the proposed methods is summarized in [52]. In this study, RBF kernel was examined in a fixed number of gamma that are calculated based on 1/number of independent variables [75]. For selecting the best parameters, 10-fold cross-validation with 1000 iterations were used for minimizing the error function [76]. Chang and Lin et al. [75] used a specified grid search method to determine the best capacity and epsilon rates. The specified grid search included a range of capacity from 1 to 40, which is equal to the range of input variables [77] and epsilon values from 0.1 to 0.5.
Random Forest. For a high quality of RF classification performance, the decision tree model and stopping parameters should be regularized. For determination of the optimal tree number, 2000 initial trees, were used to produce a graph, showing the average squared error rates against each number of trees for training and test samples. RF is a powerful analytical tool for the exploration of data and verification of the optimal number of trees. By interpreting the graph, the optimal number of trees is found based on a tree number that produces a stable error. Then, the RF implementation was again repeated by using this optimal number of trees and other fixed parameters. In addition, default rates of stopping and splitting parameters were used to stop the process of growing trees, when stopping conditions were reached. The stopping parameters for all estimations included a minimum of one child node and a maximum of 100 nodes to stop growing the trees in 10 iterations for calculating the mean error and a 5% decrease in the training error.
3. Results and Discussion
Table 6 contains the numbers of training and test samples and indicates that the Fagus orientalis L., Carpinus betulus L., and Parrotia persica are the most frequent and dominant species. After modelling with each of the group variables individually as well as combined, the overall producer and user accuracies of the classes were presented in Table 7. The RF algorithm had a slightly higher performance (higher overall accuracy compared to the SVM and k-NN algorithm in almost all group variables). The best overall accuracy was obtained using a combination of topography, soil and climate factors (63.85%) by the RF algorithm, as shown in Table 7. Also, the results showed that modelling based on basal area frequencies for the species of Carpinus betulus L, Fagus orientalis L. and Parrotia persica, had the highest accuracy in classification compared to other species shown in Table 6. This may be due to greater frequency of training and test samples for these species groups.
Table 7.
The classification accuracy assessment of tree and shrub species groups by using Random forest (RF), support vector machine (SVM) and k-nearest neighbor (k-NN) algorithms.
3.1. Topographic Variables
The results (Table 7) showed that use of primary and secondary topographic variables derived from DEM could have a better result for two dominant group species—Fagus orientalis L. and Carpinus betulus L.—compared to any other species. Generally, the use of primary and secondary topographic variables can produce better results for modelling the distribution of a group or community, than for the distribution of individual tree species [78]. In other words, the spatial distribution of species communities are more dependent on the environmental conditions compared to the spatial presence of single trees or species. For example, one tree species such as Fagus orientalis L., can be presented in an extended geographical area, but as a community, it can only be present in limited areas. Topographical factors play a significant role in many environmental processes since they can create different microclimate conditions that could affect the habitats of species. In general, topography is one of the most important factors affecting species composition and distribution [79].
Elevation changes can cause ecological changes such as the air pressure, change of the amount of ultraviolet light, type and amount of rainfall, fluctuations in relative humidity and absolute humidity. Hence, these factors could also affect the composition and distribution of tree species. Based on the results, elevation between topographic variables had the highest effect on the spatial distribution of tree species. According to the RF results, elevation was introduced as the most important factor in the process of modelling. Our results corroborated previous studies [22,26,36,80,81] when we tried to examine the relationship between elevation and the spatial occurrence of species. However, our results contradicted the results of Wheatley et al. [32].
Also, primary topographic features such as slope and aspect had lower correlations with the spatial distribution of tree species and are in accordance with the results of Wheatley et al. [32], but opposed the results of other studies [23,24,27,80]. Similar biological characteristics of dominant species, as well as human interference, for example silvicultural treatments, management and utilization of forests, can lead to an ineffective relationship between slope-aspect parameters and the spatial distribution of tree species. Moreover, in our study, 80% of the area was in range of 0% to 30% slope; this homogeneity can reduce the effectiveness of the slope factor. In addition, about 90% of the total area has north and west aspects, due to the wide area in each direction, dominant species groups (Fagus orientalis L., Parrotia persica, and Carpinus betulus L.) are distributed in both directions and can result in the reduction of the coefficient of the aspect layer in modelling.
Following the elevation parameter, solar radiation was the most important and influential independent variable in predicting the spatial distribution of species groups. The importance of solar radiation in the growing season on species spatial distribution was agreeable with the results of [22,24,26], but opposed the results of Wheatley et al. [32]. Wheatley et al. [22] proposed that using ground variables for mapping regions with homogenous elevation is the main reason for this contradiction. Spatial prediction of tree species, for the species which had limited ecological range (i.e., Fagus orientalis L.) were more correspondent in reality, compared to species which had wider distribution [82]. However, distribution of plants cannot be completely restricted by the topographic characteristics. This is because some species are resistant to various conditions, and they have wider ecological domains and higher ecological tolerance.
3.2. Climate
The results which predicted the spatial distribution of tree species using the climatic variables group showed that all three variables—temperature, evapo-transpiration and rainfall—were significant parameters in modelling the distribution of tree species, and agreed with the results of [25,33]. Also, our results agreed with many other studies with regards to the importance of temperature [23,25] and rainfall [23,28,37], in modelling the distribution of tree group species.
3.3. Sub-Order Soil
In general, Soil type is one of the most important factors in the development of plants. The physical, chemical, and biological properties of soil affected the distribution and establishment of plants. Previous studies [25,83,84] emphasized the importance of soil characteristics in species distribution.
3.4. Spectral Data
Using spectral data in modelling had lower accuracy (54.21%) in all algorithms compared to non-spectral data (Table 7). The result showed that applying spectral data as auxiliary data cannot improve the accuracies. The results of modelling with QuickBird spectral data proved that—with main bands and the texture analysis, such as mean and greenness—they were the best satellite data in modelling according to the importance factors obtained from RF analysis results [33,85]. Mean texture analysis of all bands had the highest importance coefficient in the distribution modelling of tree species groups, which agreed with [63], demonstrating the power of data obtained from the texture analysis of high-resolution images in presentation of the forest qualitative and quantitative characteristics.
Overall, according to Table 7, forest species group modelling, based on the frequency of the basal area, showed that topography variables had the best results (overall accuracy of 62.67%) compared to soil or climate variables. However, a combination of topography and soil variables improved the overall accuracy to 63.85%, but the combination of three variables, namely topography, soil and climate, could not improve the overall accuracy (60.24%). Finally, in this study, the synthesis of spectral data with the data from topography, climate and soil did not improve the results (overall accuracy of 61.44% using the SVM).
4. Conclusions
In remote sensing studies, it is common that a combination of spectral information of different objects can cause errors in sampling; in other words, uncertainty in samples. In our study, we experienced a similar problem because of the uncertainty of a few samples, in which the percentage of dominant tree species was close to 50%. To solve this problem, we tested our models by using plots in which the frequency of dominant trees was more than 75%, but still it could not significantly increase the accuracy of the models. Besides, we had to eliminate some tree species whose frequency was ranging between 50% and 75% per plot. Consequently, we decided to ignore the uncertainty of samples and the errors that they can cause.
In most studies, spectral data serve as the basis and non-spectral data are used as the auxiliary. However, the combined use of spectral and non-spectral data in this study showed much higher accuracies than modelling with only spectral data. Our results correspond to results of previous studies [8,33,34,36,37,86]. Integrating auxiliary data with data obtained from RS increases the modelling accuracy and contravenes with the results of [32].
In dense forests such as those found in the Hyrcanian region in the north-east part of Iran, spectral data can only be representative of the reflectances of dominant tree species in the upper part of the forest canopy and cannot provide spectral information regarding species, which may be encountered lower in the canopy. Therefore, the integration of non-spectral data with spectral data has caused an increase in classification accuracy of Fagus orientalis L., which is the dominant species in the canopy (over 90%). Consequently, inadequate accuracy of the exact location of the measured samples could be one of the reasons for reducing the effect of spectral data. High-resolution satellite images are sensitive to low errors in the spatial coordinates recorded by GPS devices.
Regarding the comparison analysis between the algorithms that we used, the classification accuracy of tree species by the RF algorithm could achieve higher results in terms of accuracy than the SVM and k-NN algorithms. Also, the RF algorithm was shown to provide generally higher accuracy and validity of the user and producer accuracy indicators than the SVM and k-NN algorithms. The capability of the RF algorithm in determining the weight coefficients of the independent variables without pruning the tree structure, increased the classification accuracy of the algorithm. On the contrary, the k-NN and SVM algorithms are not able to recognize the importance of each variable and they consider the same weight for all the independent variables in the modelling process. Moreover, RF results had the highest user accuracy compared to other algorithms. This means that understanding of the RF algorithm in change of tree species in each region is more reliable.
According to Yanoviak et al. [87], the RF algorithm compared to ANN and the decision tree methods, had higher modelling accuracy for the distribution of pine. In addition, according to Kernes et al. [88] tree models had a better understanding of the relationship and the boundaries, than logistic regression models for predicting the shrub cover spatial shifting. Also, according to [89], RFs are often used in very large geographical areas and when the number of samples in classes is unbalanced, the RF algorithm can be used with an acceptable level of accuracy for classification in such instances and it can be one of the factors for superiority over the SVM and k-NN. Naidoo et al. [90] studied the possibility of modelling savanna tree species in the Kruger national park in South Africa, using integrated hyperspectral, light detection and ranging (LiDAR) data and the RF algorithm and their results showed that the RF model produced 87% accuracy.
In general, data mining algorithms could not provide the desired accuracy in the mapping distribution of tree species. Various factors, such as lithology, geology, and human activities affect the distribution of tree species, however, these effects have not been considered in this study. Furthermore, recorded data plots with low accuracy (error in sampling) may reduce the classification accuracy of the distribution of tree species [36].
In conclusion, our results showed that topography, soil, and climate variables, influenced the distribution of tree species. However, topographic variables were the most important factors affecting the distribution of tree species. Combining spectral data with auxiliary data did not improve classifications results.
Acknowledgments
This research was supported by the projects of the Internal Grant Agency (IGA) of Faculty of Forestry and Wood Sciences, Czech University of Life Sciences (CULS) in Prague (No. B07/15) and (No. A14/16) and the research project of Ministry of Agriculture of Czech Republic (Grant No. QJ1520187). The authors would also like to acknowledge substantial help from Adam Dziadula of the Czech University of Life Sciences (CULS), for his contribution to the language review of the article.
Author Contributions
Azadeh Abdollahnejad designed the experiment and analyzed the data. Dimitrios Panagiotidis wrote the manuscript, helped on data interpretation and collaborated on the literature research, discussion and conclusion. Shaban Shataee helped on satellite data acquisition and ground data collection. Shaban shataee and Peter Surový supervised the project and the manuscript and granted the project.
Conflicts of Interest
The authors declare no conflict of interest.
References
- Food and Agriculture Organization. Forests and the Forestry Sector. Available online: http://www.fao.org/forestry/site/23747/en/Iran (accessed on 21 December 2009).
- Shataee, S.; Kalbi, S.; Fallah, A.; Pelz, D. Forest attribute imputation using machine-learning methods and ASTER data: Comparison of k-NN, SVR and RF regression algorithms. Int. J. Remote Sens. 2012, 19, 6254–6280. [Google Scholar] [CrossRef]
- Guyot, V.; Castagneyrol, B.; Vialatte, A.; Deconchat, M.; Selvi, F.; Bussotti, F.; Jactel, H. Tree diversity limits the impact of an invasive forest pest. PLoS ONE 2015, 10, e0136469. [Google Scholar] [CrossRef] [PubMed]
- Austin, M.P. Spatial prediction of species distribution: On interface between ecological theory and statistical modelling. Ecol. Model. 2002, 157, 101–118. [Google Scholar] [CrossRef]
- Ferrier, S.; Watson, G.; Pearce, J.; Drielsma, M. Extended statistical approaches to modelling spatial pattern in biodiversity in northeast New South Wales. I. Species-level modelling. Biodiv. Conserv. 2002, 11, 2275–2307. [Google Scholar] [CrossRef]
- Boyd, D.S.; Danson, F.M. Satellite remote sensing of forest resources: Three decades of research development. Prog. Phys. Geogr. 2005, 29, 1–26. [Google Scholar] [CrossRef]
- Salajanu, D.M.; Jacobs, D. Predicting Spatial Distribution of Privet (ligustrum spp.) In South Carolina from MODIS and forest Inventory Plot data. In Proceedings of the 17th Willam T. Memorial Remote Sensing Symposium, Denver, CO, USA, 1–20 November 2008.
- Shataee, S.H. Course Seeks Maps of Forest Types Using Satellite Data (Case Study Kheyroud Kenar Noushahr). Ph.D. Thesis, Faculty of Forestry, Tehran, Iran, 2003. [Google Scholar]
- Mohammadi, J.; Shataee, S.H.; Babanezhad, M. Estimation of forest stand volume, tree density and biodiversity using Landsat ETM + Data, comparison of linear and regression tree analyses. Procedia Environ. Sci. 2011, 7, 299–304. [Google Scholar] [CrossRef]
- Sheeren, D.; Fauvel, M.; Josipovic, V.; Lopes, M.; Planque, C.; Willm, J.; Dejoux, J.F. Tree species classification in temperate forests using Formosat-2 satellite image time series. Remote Sens. 2016, 8, 734. [Google Scholar] [CrossRef]
- Féret, J.B.; Asner, G.P. Tree species discrimination in tropical forests using airborne imaging spectroscopy. IEEE Trans. Geosci. Remote Sens. 2012, 51, 73–84. [Google Scholar] [CrossRef]
- Ghiyamat, A.; Shafri, H.Z.; Mahdiraji, G.A.; Shariff, A.R.M.; Mansor, S. Hyperspectral discrimination of tree species with different classifications using single- and multiple-endmember. Int. J. Appl. Earth Obs. Geoinf. 2013, 23, 177–191. [Google Scholar] [CrossRef]
- George, R.; Padaliab, H.; Kushwahab, S.P. Forest tree species discrimination in western Himalaya using EO-1 Hyperion. Int. J. Appl. Earth Obs. Geoinf. 2014, 28, 140–149. [Google Scholar] [CrossRef]
- Dalponte, M.; Bruzzone, L.; Gianelle, D. Tree species classification in the Southern Alps based on the fusion of very high geometrical resolution multispectral/hyperspectral images and LiDAR data. Remote Sens. Environ 2012, 123, 258–270. [Google Scholar] [CrossRef]
- Engler, R.; Waser, L.T.; Zimmermann, N.E.; Schaub, M.; Berdos, S.; Ginzler, C.; Psomas, A. Combining ensemble modeling and remote sensing for mapping individual tree species at high spatial resolution. For. Ecol. Manag. 2013, 310, 64–73. [Google Scholar] [CrossRef]
- Ghosh, A.; Fassnacht, F.E.; Joshia, P.K.; Koch, B. A framework for mapping tree species combining hyperspectral and LiDAR data: Role of selected classifiers and sensor across three spatial scales. Int. J. Appl. Earth Obs. Geoinf. 2014, 26, 49–63. [Google Scholar] [CrossRef]
- Holmgren, J.; Persson, A.; Soderman, U. Species identification of individual trees by combining high resolution LiDAR data with multi-spectral images. Int. J. Remote Sens. 2008, 29, 1537–1552. [Google Scholar] [CrossRef]
- Guisan, A.; Zimmermann, N.E. Predictive habitat distribution models in ecology. Ecol. Model. 2000, 135, 147–186. [Google Scholar] [CrossRef]
- Kint, V.; Van Meirvence, M.; Nachtergale, L.; Gendens, G.; Lust, N. Spatial methods for quantifying forest stand structures development. A comparison between nearest neighbor indices and variogram analysis. For. Sci. 2003, 49, 36–49. [Google Scholar]
- Hunter, J.T. Factors affecting range size differences for plant species on rock outcrops in eastern Australia. Divers. Distrib. 2003, 9, 211–220. [Google Scholar] [CrossRef]
- Wilson, M.F.G.; O’Connell, B.; Brown Connell, B.; Brown, C.; Guinan, J.C.; Grehan, A.G. Multiscale terrain analysis of multibeam bathymetry data for habitat mapping on the continental slope. Mar. Geod. 2007, 30, 3–35. [Google Scholar] [CrossRef]
- Ejtehadi, H.; Sepehry, A.; Horvath, F. Separability of forest vegetation type using environmental variables including elevation, slop, aspect and direct incoming solar radiation: A GIS application. In Proceedings of the 5th Conference on Geographic Information System, National Cartographic Center (NCC), Tehran, Iran, 10 May 1998.
- Garzona, M.; Blazekb, B.; Netelerb, M.; Sanchez de Diosa, R.; Sainz Olleroa, H.; Furlanellob, C. Predicting habitat suitability with machine learning models: The potential area of Pinus sylvestris L. in the Iberian Peninsula. Ecol. Model. 2006, 197, 383–393. [Google Scholar] [CrossRef]
- Ghanbari, F.; Shataee, S.H.; Mohseni, A.; Habashi, H. Using a logistic regression model to predict the spatial characteristics of topography and forest type (case study of a forest series Shastklath Gorgan). J. Res. For. Poplar Res. 2011, 19, 27–41. [Google Scholar]
- Mellert, K.H.; Fensterer, V.; Küchenhoff, H.; Reger, B.; Kölling, C.; Klemmt, H.J.; Ewald, J. Hypothesis-driven species distribution models for tree species in the Bavarian Alps. J. Veg. Sci. 2011, 22, 635–646. [Google Scholar] [CrossRef]
- Peffer, K.; Pebesma, E.J.; Burrough, P.A. Mapping alpine vegetation using vegetation observation and topographic Attributes. Lands. Ecol. 2003, 18, 759–776. [Google Scholar] [CrossRef]
- Navroudi, B.H.; Namiranian, M.; Mohanjer, M.M.; Azizi, P. Effect of aspect and altitude above sea level on the amount of volume of natural Rashstanhay. Iran. J. Nat. Resour. 2000, 53, 201–215. (In Persian) [Google Scholar]
- Mehdinya, T.; Ejtehadi, H.; Sepehri, A. Physiographic variables and the correlation between rainfall and vegetation communities present in the watershed of the Babol, Mazandaran province using geographic information systems. J. Agric. Sci. Nat. Resour. 2006, 13, 107–199. (In Persian) [Google Scholar]
- Wong, C.S.C.; Li, X.; Thornton, I. Urban environmental geochemistry of trace metals. Environ. Pollut. 2006, 142, 1–16. [Google Scholar] [CrossRef] [PubMed]
- Shataee, S.H. Improved classification of forest types by combining spectral data and help establish a method to determine the probability of occurrence of classes of models. Nat. Mapp. Agency 2004, 83, 1–6. [Google Scholar]
- Mohammadi, J.; Shataee, S.H.; Yaghmaee, F.; Mahiney, A. Modelling forest stand volume and tree density using Landsat ETM+ data. Int. J. Remote Sens. 2010, 7, 2959–2975. [Google Scholar] [CrossRef]
- Wheatley, J.M.; Wilson, J.P.; Redmond, R.L.; Ma, Z.; Dibenedetto, J. Automated land cover mapping using Landsat thematic mapper images and topographic attributes. In Terrain Analysis, Principles and Applications; Wilson, J.P., Gallant, J.C., Eds.; John Wiley and Sons: Hoboken, NJ, USA, 2000. [Google Scholar]
- Saatchi, S.; Buermann, W.; Steege, H.; Mori, S.; Smith, B. Modelling distribution of Amazonian tree species and diversity using remote sensing measurements. Remote Sens. Environ. 2008, 112, 2000–2017. [Google Scholar] [CrossRef]
- Wang, X.P.; Tan, Z.Y.; Fang, J.Y. Climatic Control on Forests and Tree Species Distribution in the Forest Region of Northeast China. J. Integrative Plant Biol. 2006, 48, 778–789. [Google Scholar] [CrossRef]
- Hernández-Stefanoni, J.L.; Gallardo-Cruz, J.A.; Meave, J.A.; Dupuy, J.M. Combining geostatistical models and remotely sensed data to improve tropical tree richness mapping. Ecol. Indic. 2011, 11, 1046–1056. [Google Scholar] [CrossRef]
- Adhikari, D.; Barik, S.K.; Upadhaya, K. Habitat distribution modelling for reintroduction of Ilex khasiana Purk, a critically endangered tree species of northeastern India. Ecol. Eng. 2012, 40, 37–43. [Google Scholar] [CrossRef]
- Riemer-Sørensen, S.; Parkinson, D.; Davis, T.M. Simultaneous constraints on the number and mass of rekativistic species. Astrophys. J. 2013, 30, 763. [Google Scholar]
- Hall, R.J.; Skakun, R.S.; Arsenault, E.J.; Case, B.S. Modelling forest stand structure attributes using Landsat ETM+ data: Application to mapping of aboveground biomass and stand volume. For. Ecol. Manag. 2006, 225, 378–390. [Google Scholar] [CrossRef]
- Gebreslasie, M.T.; Ahmed, F.B.; Aardt, J. Estimating plot-level forest structural attributes using high spectral resolution ASTER satellite data in even-aged Eucalyptus plantations in southern KwaZulu-Natal, South Africa. South. For. 2008, 70, 1–10. [Google Scholar]
- Hyvonen, P. The Updating of Forest Resource Data for Management Planning for Privately Owned Forests in Finland. Ph.D. Thesis, Faculty of Forestry, Joensuu, FL, USA, 2007. [Google Scholar]
- McRobert, R.; Tomppo, E.; Finley, A.; Heillinen, J. Estimating aerial means and variances of forest attributes using the k-nearest neighbor’s technique and satellite imagery. Remote Sens. Environ. 2007, 111, 466–480. [Google Scholar] [CrossRef]
- Sironen, S.; Kangas, A.; Maltamo, M. Comparison of different non-parametric growth imputation methods in the presence of correlated observations. Forestry 2010, 83, 39–51. [Google Scholar] [CrossRef]
- Franklin, J.; Mc Cullough, P.; Gray, C. Terrain variables used for predictive mapping of vegetation communities in southern California. In Terrain Analysis, Principles and Applications; Wilson, J.P.L., Gallent, J.C., Eds.; John Wiley & Sons: Hoboken, NJ, USA, 2000. [Google Scholar]
- Franco-Lopez, H.; Ek, A.R.; Bauer, M.E. Estimation and mapping of forest stand density, volume, and cover type using the k-nearest neighbor’s method. Remote Sens. Environ. 2001, 77, 251–274. [Google Scholar]
- Katila, M.; Tomppo, E. Selecting estimation parameters for the Finnish multisource national forest inventory. Remote Sens. Environ. 2001, 76, 16–32. [Google Scholar] [CrossRef]
- Ohmann, J.L.; Gregory, M.J. Predictive mapping of forest composition and structure with direct gradient analysis and nearest neighbor imputation in coastal Oregon, U.S.A. Can. J. For. Res. 2002, 32, 725–741. [Google Scholar] [CrossRef]
- Makela, H.; Pekkarinen, A. Estimation of forest stands volumes by Landsat TM imagery and stand-level field-inventory data. For. Ecol. Manag. 2004, 196, 245–255. [Google Scholar] [CrossRef]
- Finley, A.O.; McRobert, R.E.; Ek, A.R. Applying an efficient k-nearest neighbor search to forest attribute imputation. For. Sci. 2006, 52, 130–135. [Google Scholar]
- Tatjana, K.; Suppan, F.; Schneider, W. The impact of relative radiometric calibration on the accuracy of k-NN predictions of forest attributes. Remote Sens. Environ. 2007, 110, 431–437. [Google Scholar]
- Walton, J.T. Sub pixel urban land cover estimation: Comparing cubist, random forests, and support vector regression. Photogramm. Eng. Remote Sens. 2008, 74, 1213–1222. [Google Scholar] [CrossRef]
- Cortez, P.; Morais, A. A data mining approach to predict forest fires using meteorological data. In Proceedings of the EPIA 2007—Portuguese Conference on Artificial Intelligence, Guimarães, Portugal, 3–7 December 2007.
- Durbha, S.S.; King, R.L.; Younan, N.H. Support vector machines regression for retrieval of leaf area index from multiangle imaging spectroradiometer. Remote Sens. Environ. 2007, 107, 348–361. [Google Scholar] [CrossRef]
- Zhang, R.; Ma, J. An improved SVM method P-SVM for classification of remotely sensed data. Int. J. Remote Sens. 2008, 29, 6029–6036. [Google Scholar] [CrossRef]
- Shafri, H.Z.M.; Ramle, F.S.H. A comparison of support vector machine and decision tree classifications using satellite data of Langkawi islands. Inf. Technol. J. 2009, 8, 64–70. [Google Scholar] [CrossRef]
- Ostapowicz, K.; Lakes, T.; Kozak, J. Modelling of land cover change using support vector machine. In Proceedings of the 13th AGILE International Conference on Geographic Information Science, Guimarães, Portugal, 10–14 May 2010.
- Breiman, L. Random Forests. Mach. Learn 2001, 45, 5–32. [Google Scholar] [CrossRef]
- Breiman, L. Using Models to Infer Mechanisms. IMS Wald Lecture 2. Available online: http://www.stat.berkeley.edu/~breiman/wald2002–2.pdf (accessed on 19 September 2002).
- Statistica. Electronic Text Book, Stat Soft Inc. Available online: http://www.Statsoft.com (accessed on 20 November 2010).
- Garzón, M.B.; Dios, R.S.; Ollero, H.S. Effects of climate change on the distribution of Iberian tree species. Appl. Veg. Sci. 2008, 11, 169–178. [Google Scholar] [CrossRef]
- Byroodyan, M. Weather and Climatology (Ghare Sou River watershed studies). Agric. Publ. 1990, 13, 300. (In Persian) [Google Scholar]
- Beven, K.J.; Kirkby, M.J. A physically based, variable contributing area model of basin hydrology. Hydrol. Sci. Bull. 1979, 24, 43–69. [Google Scholar] [CrossRef]
- Moore, I.D.; Gessler, P.E.; Nielsen, G.A.; Petersen, G.A. Terrain attributes: Estimation methods and scale effects. In Modelling Change in Environmental Systems; Jakeman, A.J., Beck, M.B., McAleer, M., Eds.; Wiley: London, UK, 1993; pp. 189–214. [Google Scholar]
- Wilson, J.P.; Gallant, J.C. Terrain Analysis: Principles and Applications; John Wiley and Sons: Hoboken, NJ, USA, 2000. [Google Scholar]
- Kardgar, N. Accuracy Assessment of Soil Maps in Dr. Bahramnia Forestry Plan Bahramnia (Section A). Master’s Thesis, Faculty of Forestry, Tehran, Iran, 2012. [Google Scholar]
- DigitalGlobe. QuickBird Satellite Imagery Products. Product Guide. Available online: http://www.glcf.umd.edu/library/guide/QuickBird_Product_Guide.pdf (accessed on 1 May 2006).
- Keller, F. Evaluation, Connectionist and Statistical Language Processing. Lecture. Available online: http://www.coli.unisaarland.de/~crocker/Teaching/Connectionist/lecture114up.pdf (accessed on 7 July 2010).
- McRobert, R.E. Diagnostic tools for nearest neighbor techniques when used with satellite imagery. Remote Sens. Environ. 2009, 113, 489–499. [Google Scholar] [CrossRef]
- Nilsson, M. Estimation of Forest Variables Using Satellite Image Data and Airborne LiDAR. Ph.D. Thesis, Faculty of Forest Science, Umeå, Sweden, 1997. [Google Scholar]
- Reese, H.; Nilsson, M.; Sandstrom, P.; Olsson, H. Applications using estimates of forest parameters derived from satellite and forest inventory data. Comput. Electr. Agric. 2002, 37, 37–55. [Google Scholar] [CrossRef]
- Gu, H.Y.; Dai, L.M.; WU, G.; Xu, D.; Wang, S.Z.; Wang, H. Estimation of forest volumes by integrating Landsat TM imagery and forest inventory data. Sci. Chin. Ser. E Technol. Sci. 2006, 49, 54–62. [Google Scholar] [CrossRef]
- Kutzer, C. Potential of the k-NN Method for Estimation and Monitoring Off-Reserve Forest Resources in Ghana. Ph.D. Thesis, Faculty of Forest and Environmental Sciences, Albert-Ludwigs Universität, Freiburg im Breisgau, Germany, 2008. [Google Scholar]
- Kozma, L. k-Nearest Neighbor Algorithm (k-NN). Helsinki University of Technology Special Course in Computer and Information Science. Available online: http://www.lkozma.net/knn2.pdf (accessed on 20 February 2008).
- Larose, D.T.; Larose, C.D. k-Nearest neighbor algorithm. In Discovering Knowledge in Data: An Introduction to Data Mining, 2nd ed.; John Wiley & Sons, Inc.: Hoboken, NJ, USA, 2014; pp. 1–316. [Google Scholar]
- Wang, Y.; Wang, J.X.; Du, W.; Wang, C.C.; Liang, Y.C.; Zhou, C.G.; Huang, L. Immune particle swarm optimization for support vector regression on forest fire prediction. Int. Symp. Neural Netw. Adv. Neural Netw. 2009, 5552, 382–390. [Google Scholar]
- Chang, C.C.; Lin, C.J. LIBSVM: A library for support vector machines (Taipei: Department of Computer Science, National Taiwan University). Available online: http://www.csie.ntu.edu.tw/~cjlin/papers/libsvm.pdf (accessed on 4 March 2013).
- Schölkopf, B.; Smola, A.; Muller, K.R. Nonlinear component analysis as a kernel eigen value problem. Neural Comput. 1998, 10, 1299–1319. [Google Scholar] [CrossRef]
- Mattera, D.; Haykin, S. Support vector machines for dynamic reconstruction of a chaotic system. In Workshop in Advances in Kernel Methods: Support Vector Learning; Schölkopf, B., Burges, C.J.C., Smola, A.J., Eds.; MIT Press: Cambridge, MA, USA, 1999. [Google Scholar]
- Zimmermann, N.E.; Kienast, F. Predictive mapping of alpine grassland in Switzerland: Species versus community approach. J. Veg. Sci. 1999, 10, 469–482. [Google Scholar] [CrossRef]
- Mohammadi, J. Pedometery (Geographic Information Systems), 1st ed.; Pelk Publication: Tehran, Iran, 2006; pp. 1–637. [Google Scholar]
- Guoyu, L. Topography related spatial distribution of dominant tree species in a tropical seasonal rain forest in China. For. Ecol. Manag. 2011, 262, 1507–1513. [Google Scholar]
- Urli, M.; Delzon, S.; Eyermann, A.; Couallier, V.; García-Valdés, R.; Zavala, M.A.; Porté, A.J. Inferring shifts in tree species distribution using asymmetric distribution curves: A case study in the Iberian mountains. INRA Sci. Impact 2013, 25, 147–159. [Google Scholar] [CrossRef]
- Chahouki, M.A.Z.; Ahvazi, L.K.; Azarnivand, H. Comparison of three modelling approaches for predicting plant species distribution in mountainous scrub vegetation (Semnan rangelands, Iran). Pol. J. Ecol. 2012, 60, 277–289. [Google Scholar]
- McKenney, D.W.; Pedlar, J.H. Spatial models of site index based on climate and soil properties for two boreal tree species in Ontario, Canada. For. Ecol. Manag. 2003, 175, 497–507. [Google Scholar] [CrossRef]
- Stephenson, C.M.; Mackenzie, M.L.; Edwards, C.; Travis, J.M.J. Modelling establishment probabilities of an exotic plant, Rhododendron ponticum, invading a heterogeneous woodland landscape using logistic regression with spatial autocorrelation. Ecol. Model. 2006, 193, 747–758. [Google Scholar] [CrossRef]
- Shataee, S.H. Course Booklet Remote Sensing; Faculty of Forestry, Gorgan University of Agricultural Sciences and Natural Resources: Gorgan, Iran, 2005. [Google Scholar]
- Hernández, P.A.; Franke, I.; Herzog, S.K.; Pacheco, V.; Paniagua, L.; Quintana, H.L.; Soto, A.; Swenson, J.J.; Tovar, C.; Valqui, T.H.; et al. Predicting species distributions in poorly-studied landscapes. Biodivers. Conserv. 2008, 17, 1353–1366. [Google Scholar] [CrossRef]
- Yanoviak, S.P.; Gora, E.M.; Fredley, J.; Bitzer, P.M.; Muzika, R.M.; Carson, W.P. Direct effects of lightning in temperate forests: A review and preliminary survey in a hemlock–hardwood forest of the northern United States. Can. J. For. Res. 2015, 45, 1258–1268. [Google Scholar] [CrossRef]
- Kernes, B.K.; Ohmann, J.L. Evaluation and prediction of shrub cover in coastal Oregen forests (USA). Catena 2004, 55, 341–365. [Google Scholar]
- Freeman, E.A.; Moisen, G.G.; Frescino, T.S. Evaluating effectiveness of down-sampling for stratified designs and unbalanced prevalence in Random Forest models of tree species distributions in Nevada. Ecol. Model. 2012, 233, 1–10. [Google Scholar] [CrossRef]
- Naidoo, L.; Mathieu, R.; Main, R.; Kleynhans, W.; Wessels, K.; Asner, P.G.; Leblon, B. The assessment of data mining algorithms for modelling Savannah Woody cover using multi-frequency (X-, C- and L-band) synthetic aperture radar (SAR) datasets. In Proceedings of the 2014 IEEE Geoscience and Remote Sensing Symposium, Quebec City, QC, Canada, 14 July 2014.
© 2017 by the authors. Licensee MDPI, Basel, Switzerland. This article is an open access article distributed under the terms and conditions of the Creative Commons Attribution (CC BY) license ( http://creativecommons.org/licenses/by/4.0/).