Polymeric Nanoparticle Associated with Ceftriaxone and Extract of Schinopsis Brasiliensis Engler against Multiresistant Enterobacteria

Abstract
1. Introduction
2. Materials and Methods
2.1. Materials
2.2. Plant Material
2.3. Obtaining the of S. brasiliensis Extracts
2.4. Development of Polymeric Nanoparticles
2.5. Experimental Design Box–Behnken
2.6. Physicochemical Characterization of Nanoparticles
2.6.1. Analysis of Particle Size, Polydispersity Index (PDI) and Zeta Potential (ZP)
2.6.2. Morphological Analysis of Nanoparticles
2.6.3. Fourier Transform Infrared Spectroscopy (FTIS)
2.7. Antimicrobial Activity
3. Results and Discussion
3.1. Evaluation of S. brasiliensis Extract
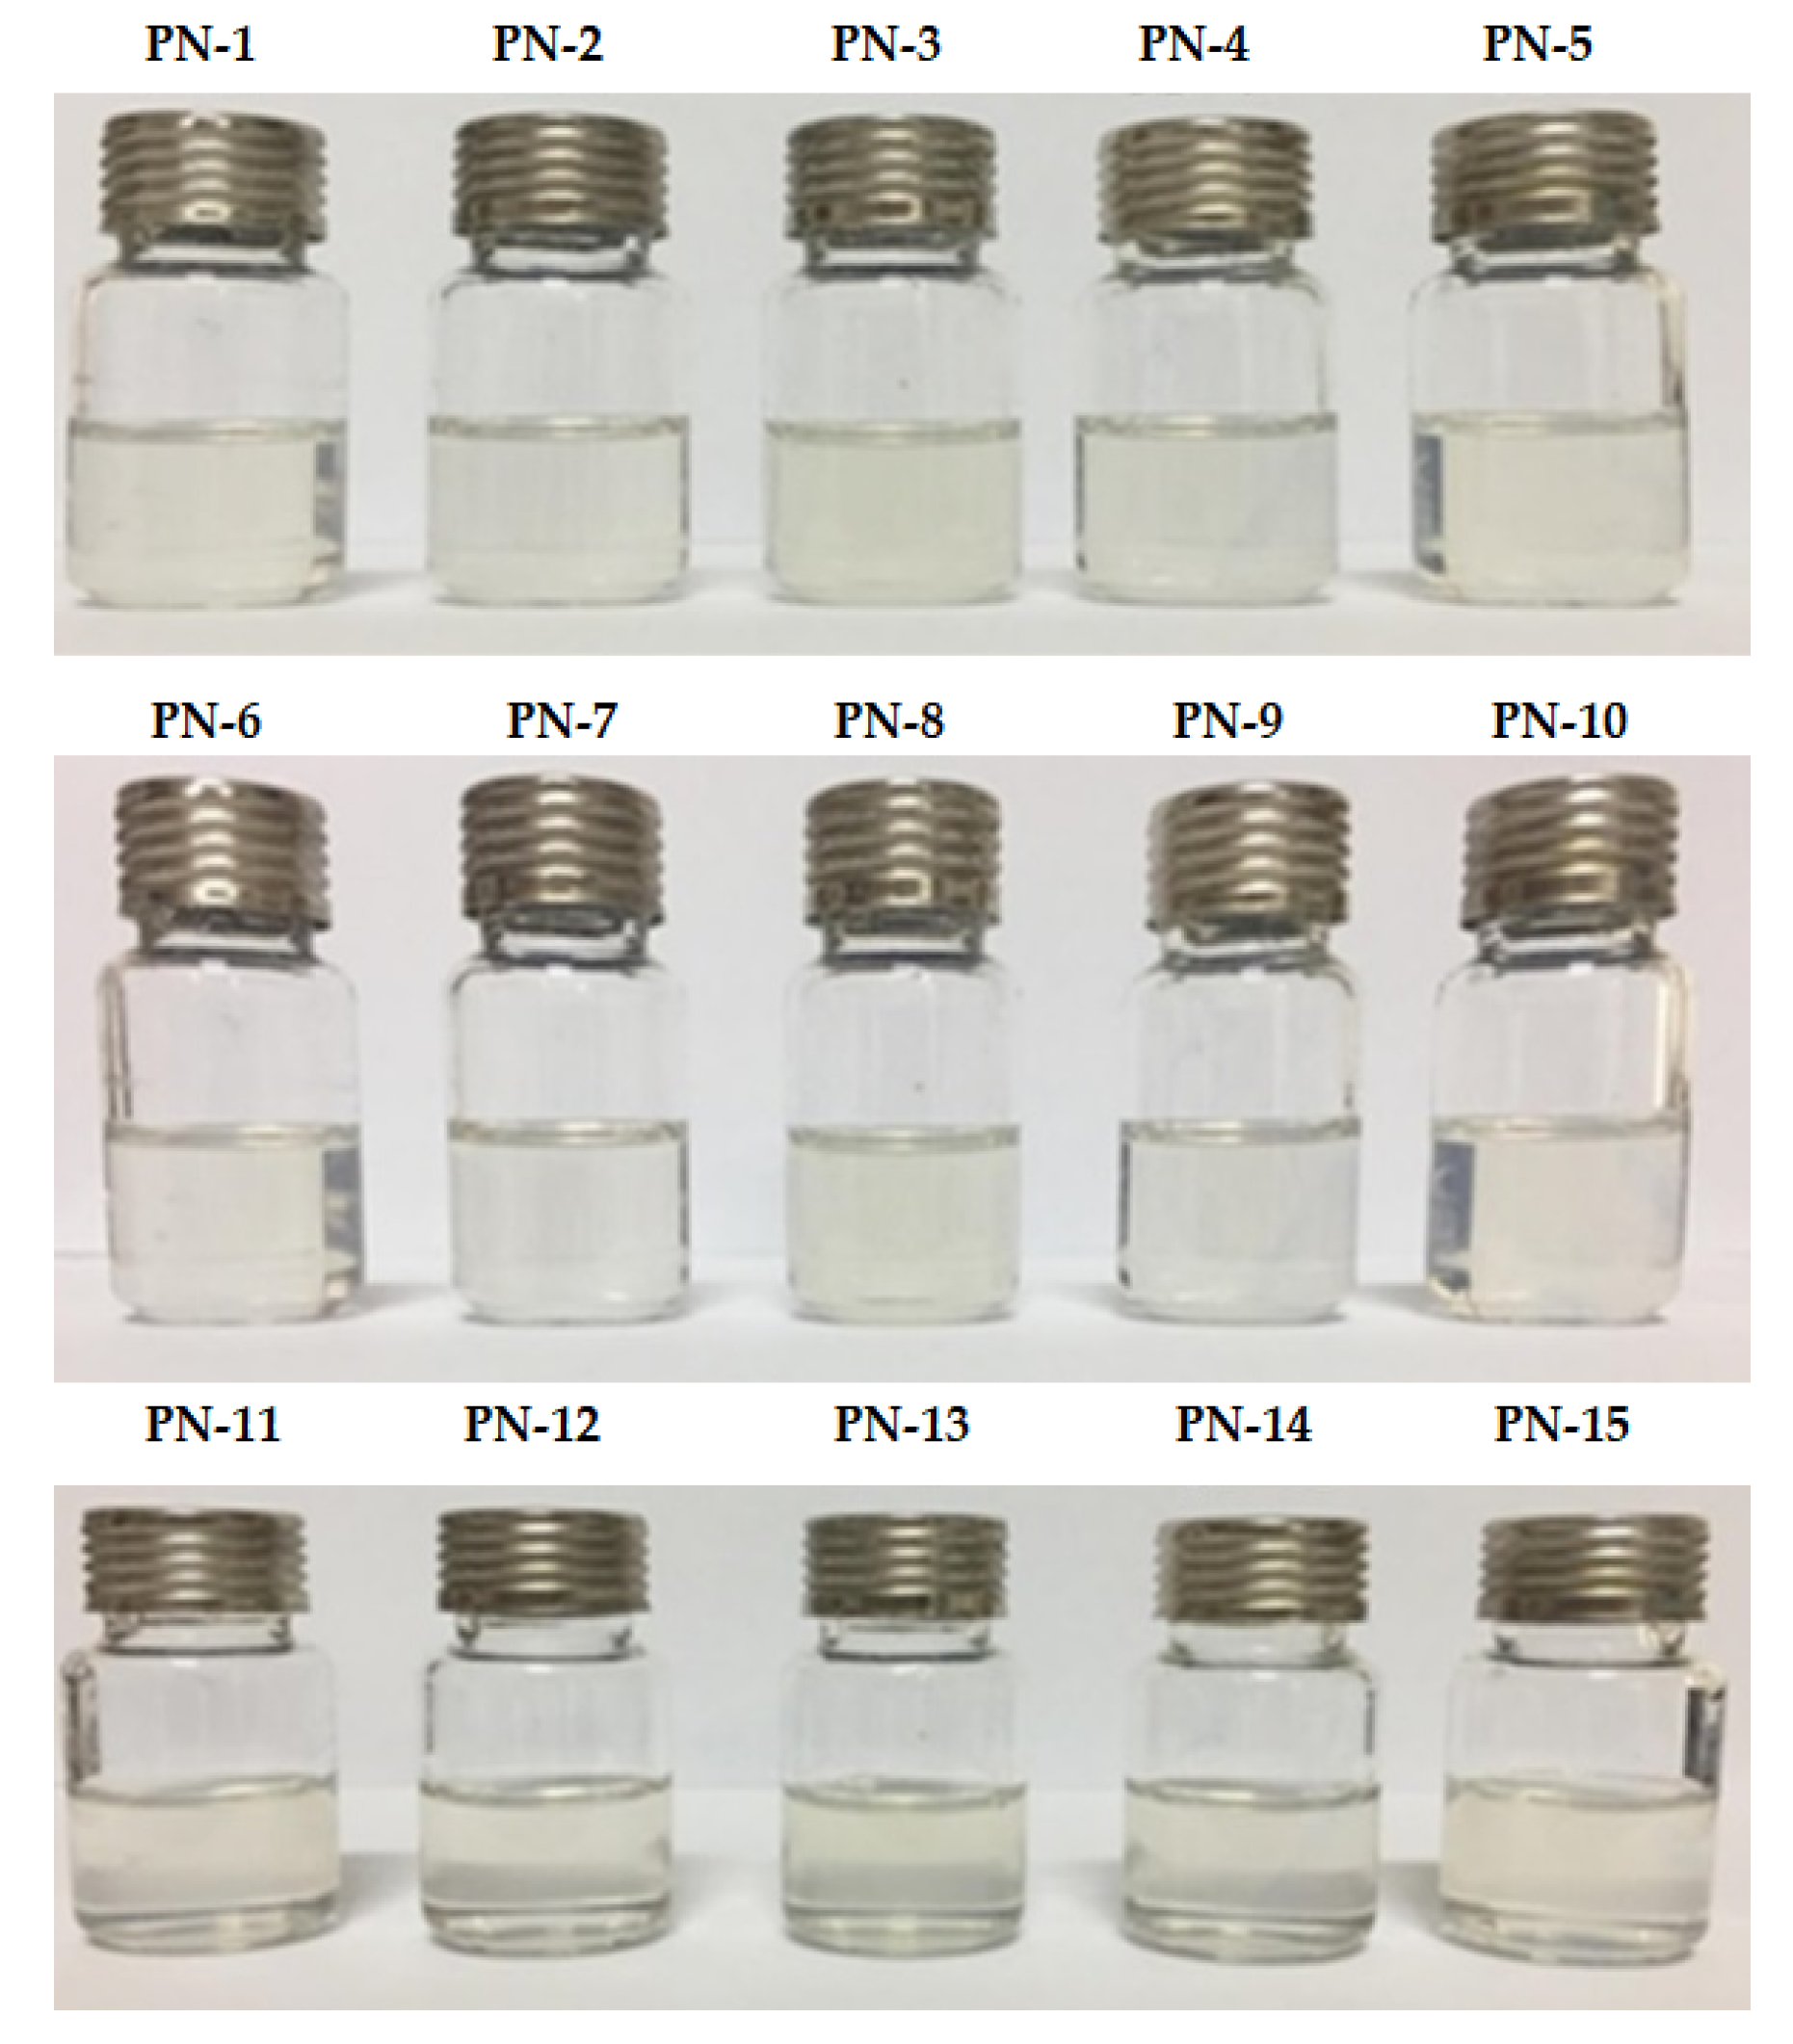
3.2. Development of Nanoparticles
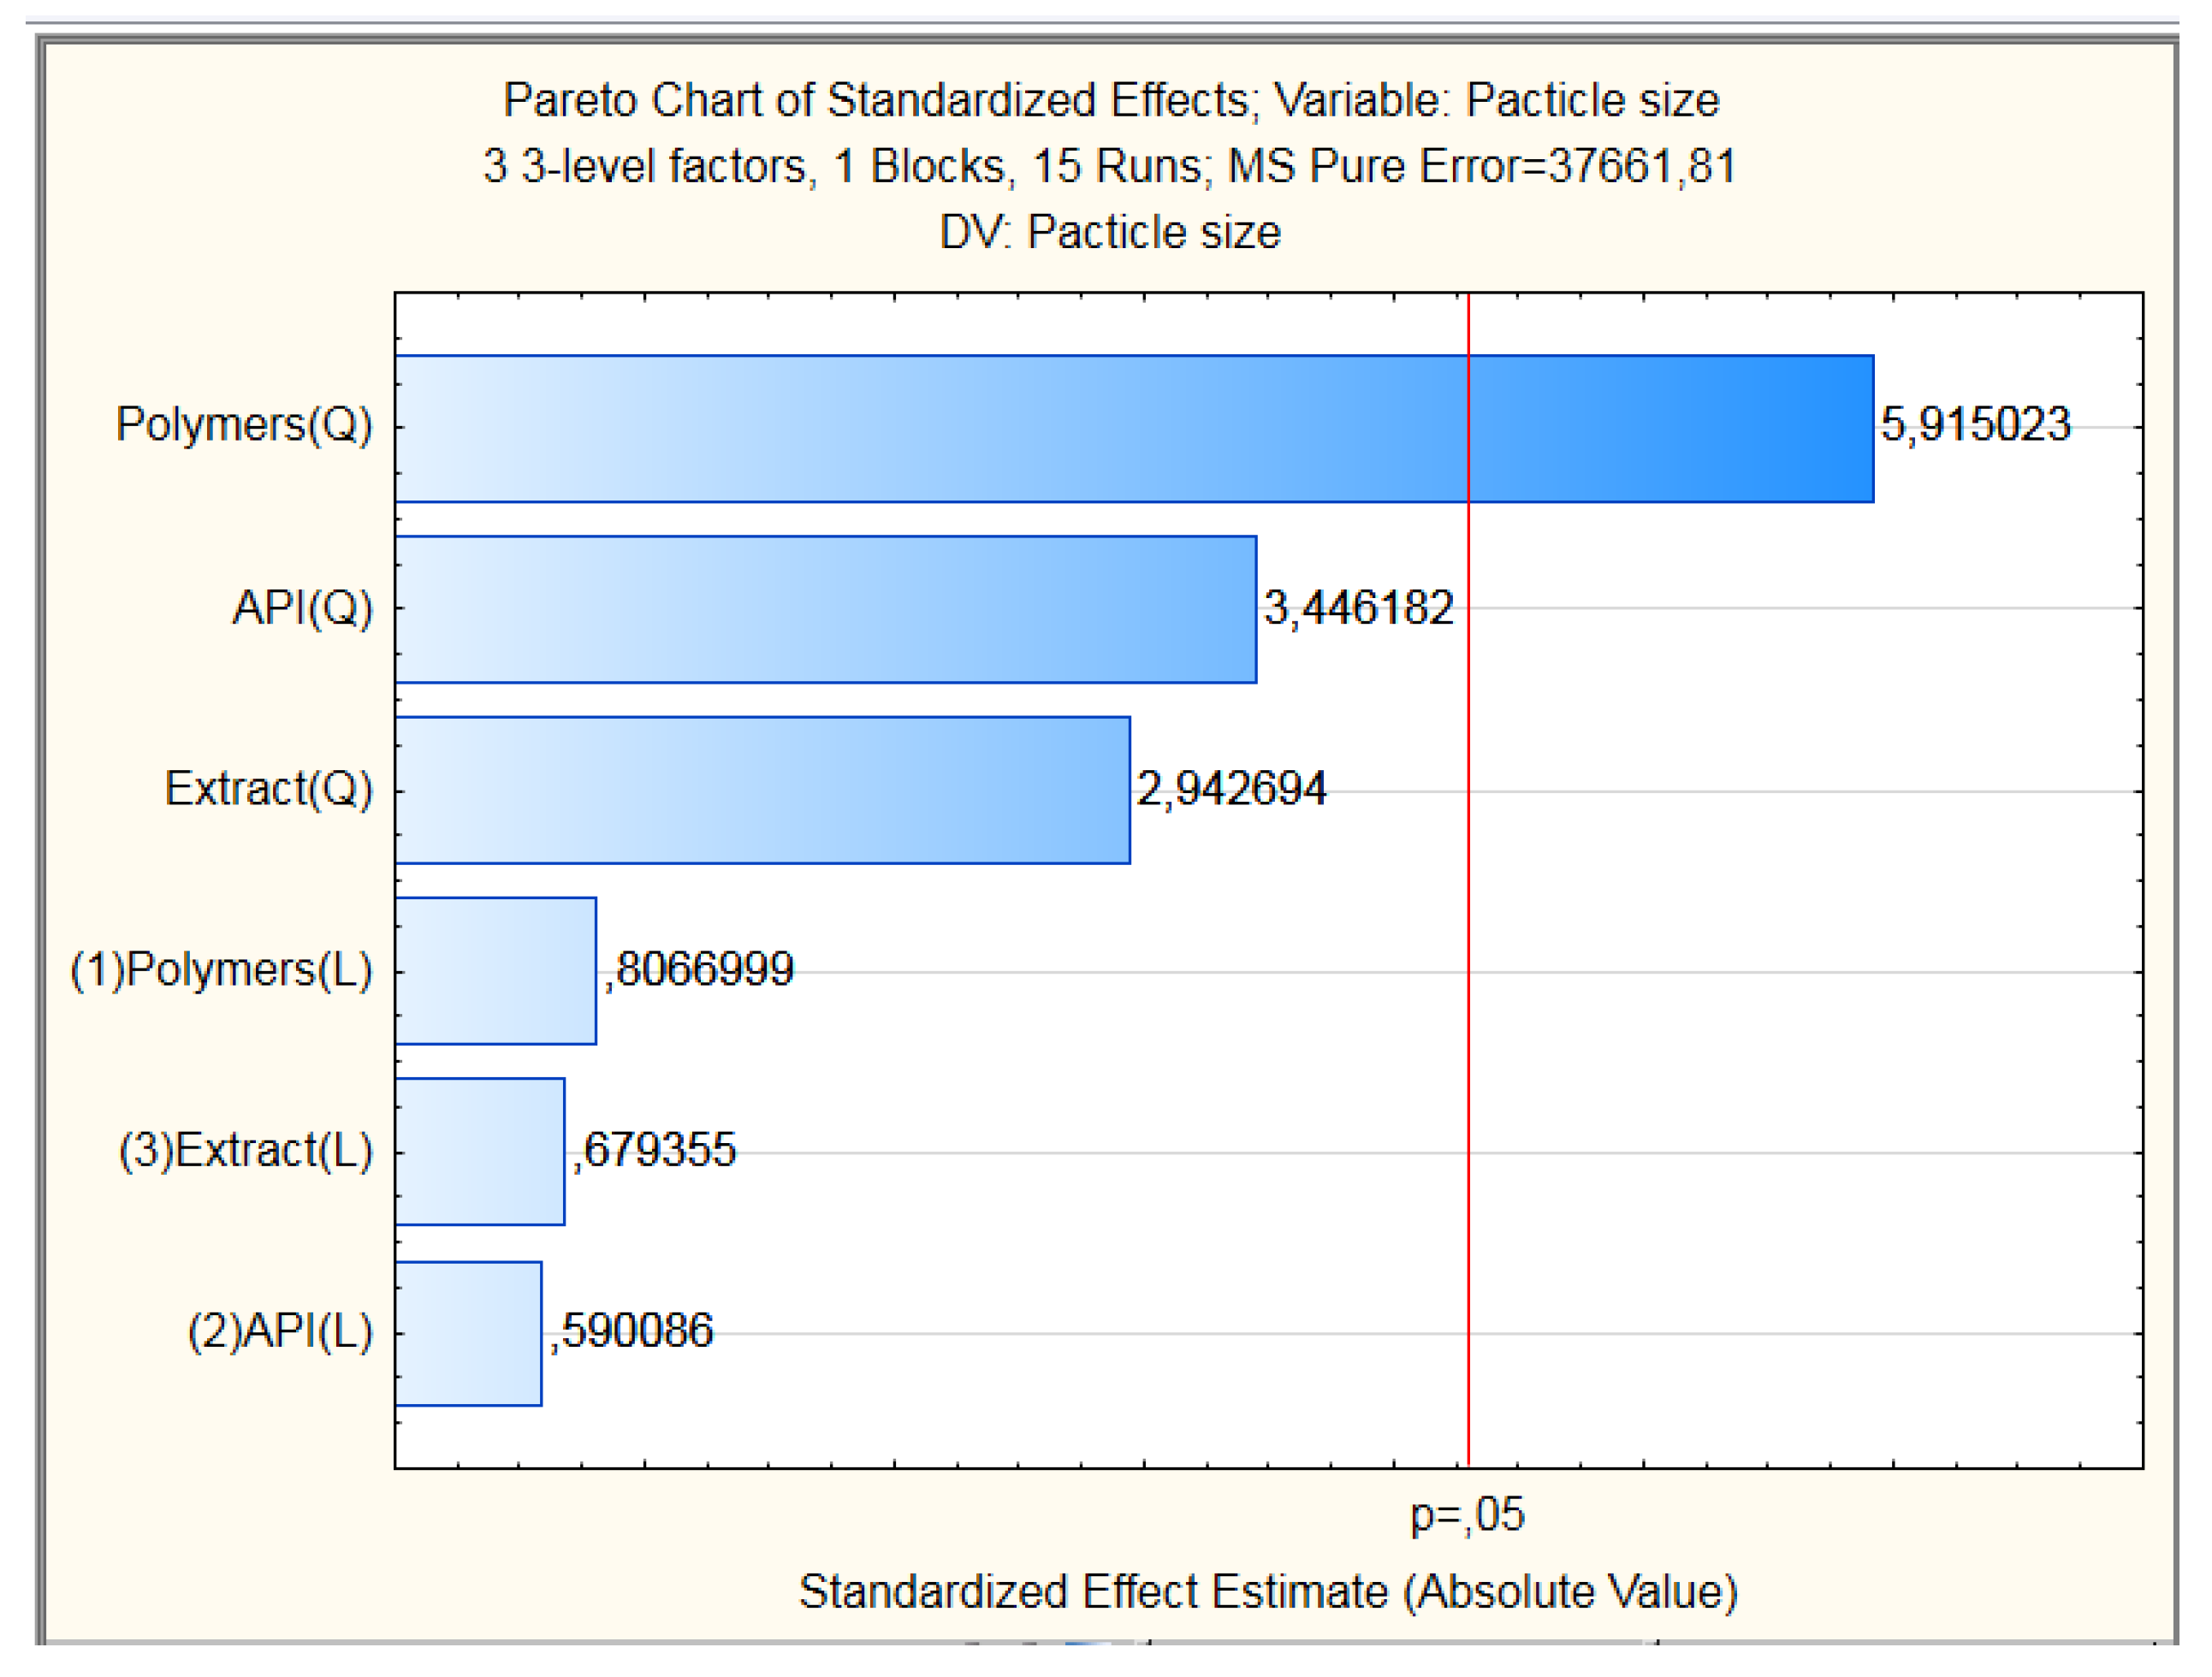
3.3. Dynamic Light Scattering, Zeta Potential, and Experimental Design
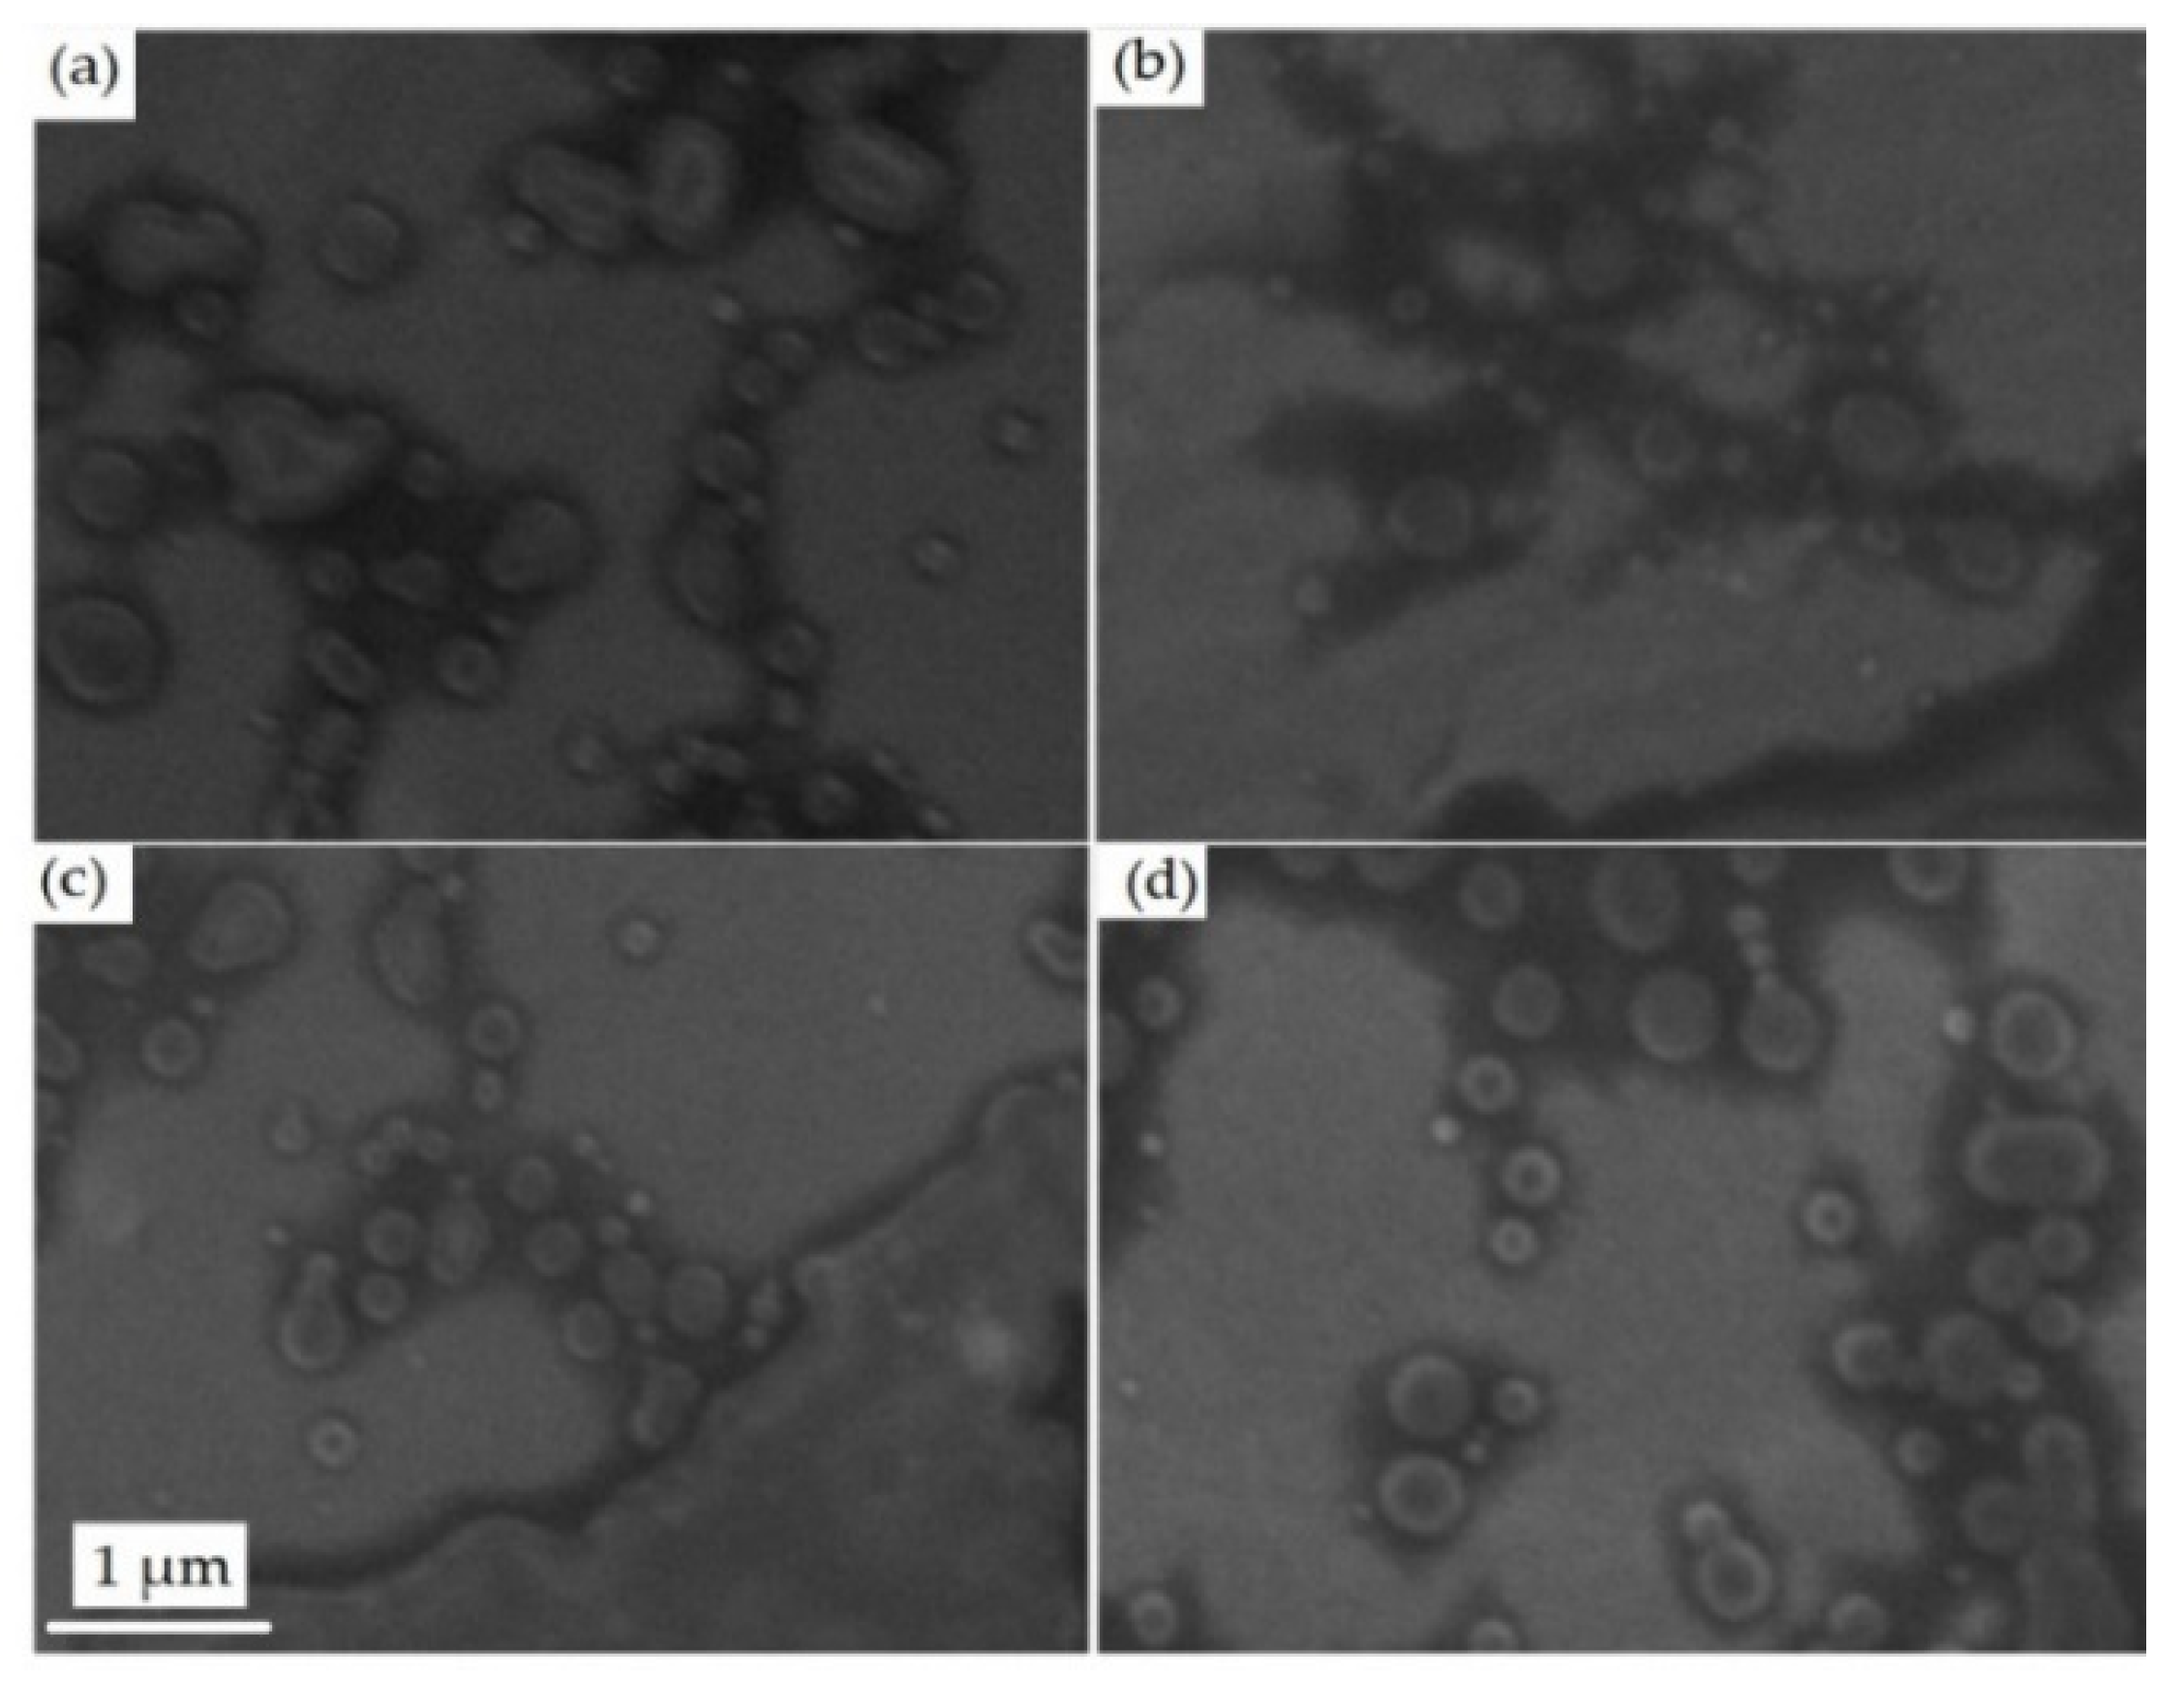
3.4. Scanning Electron Microscopy (SEM)
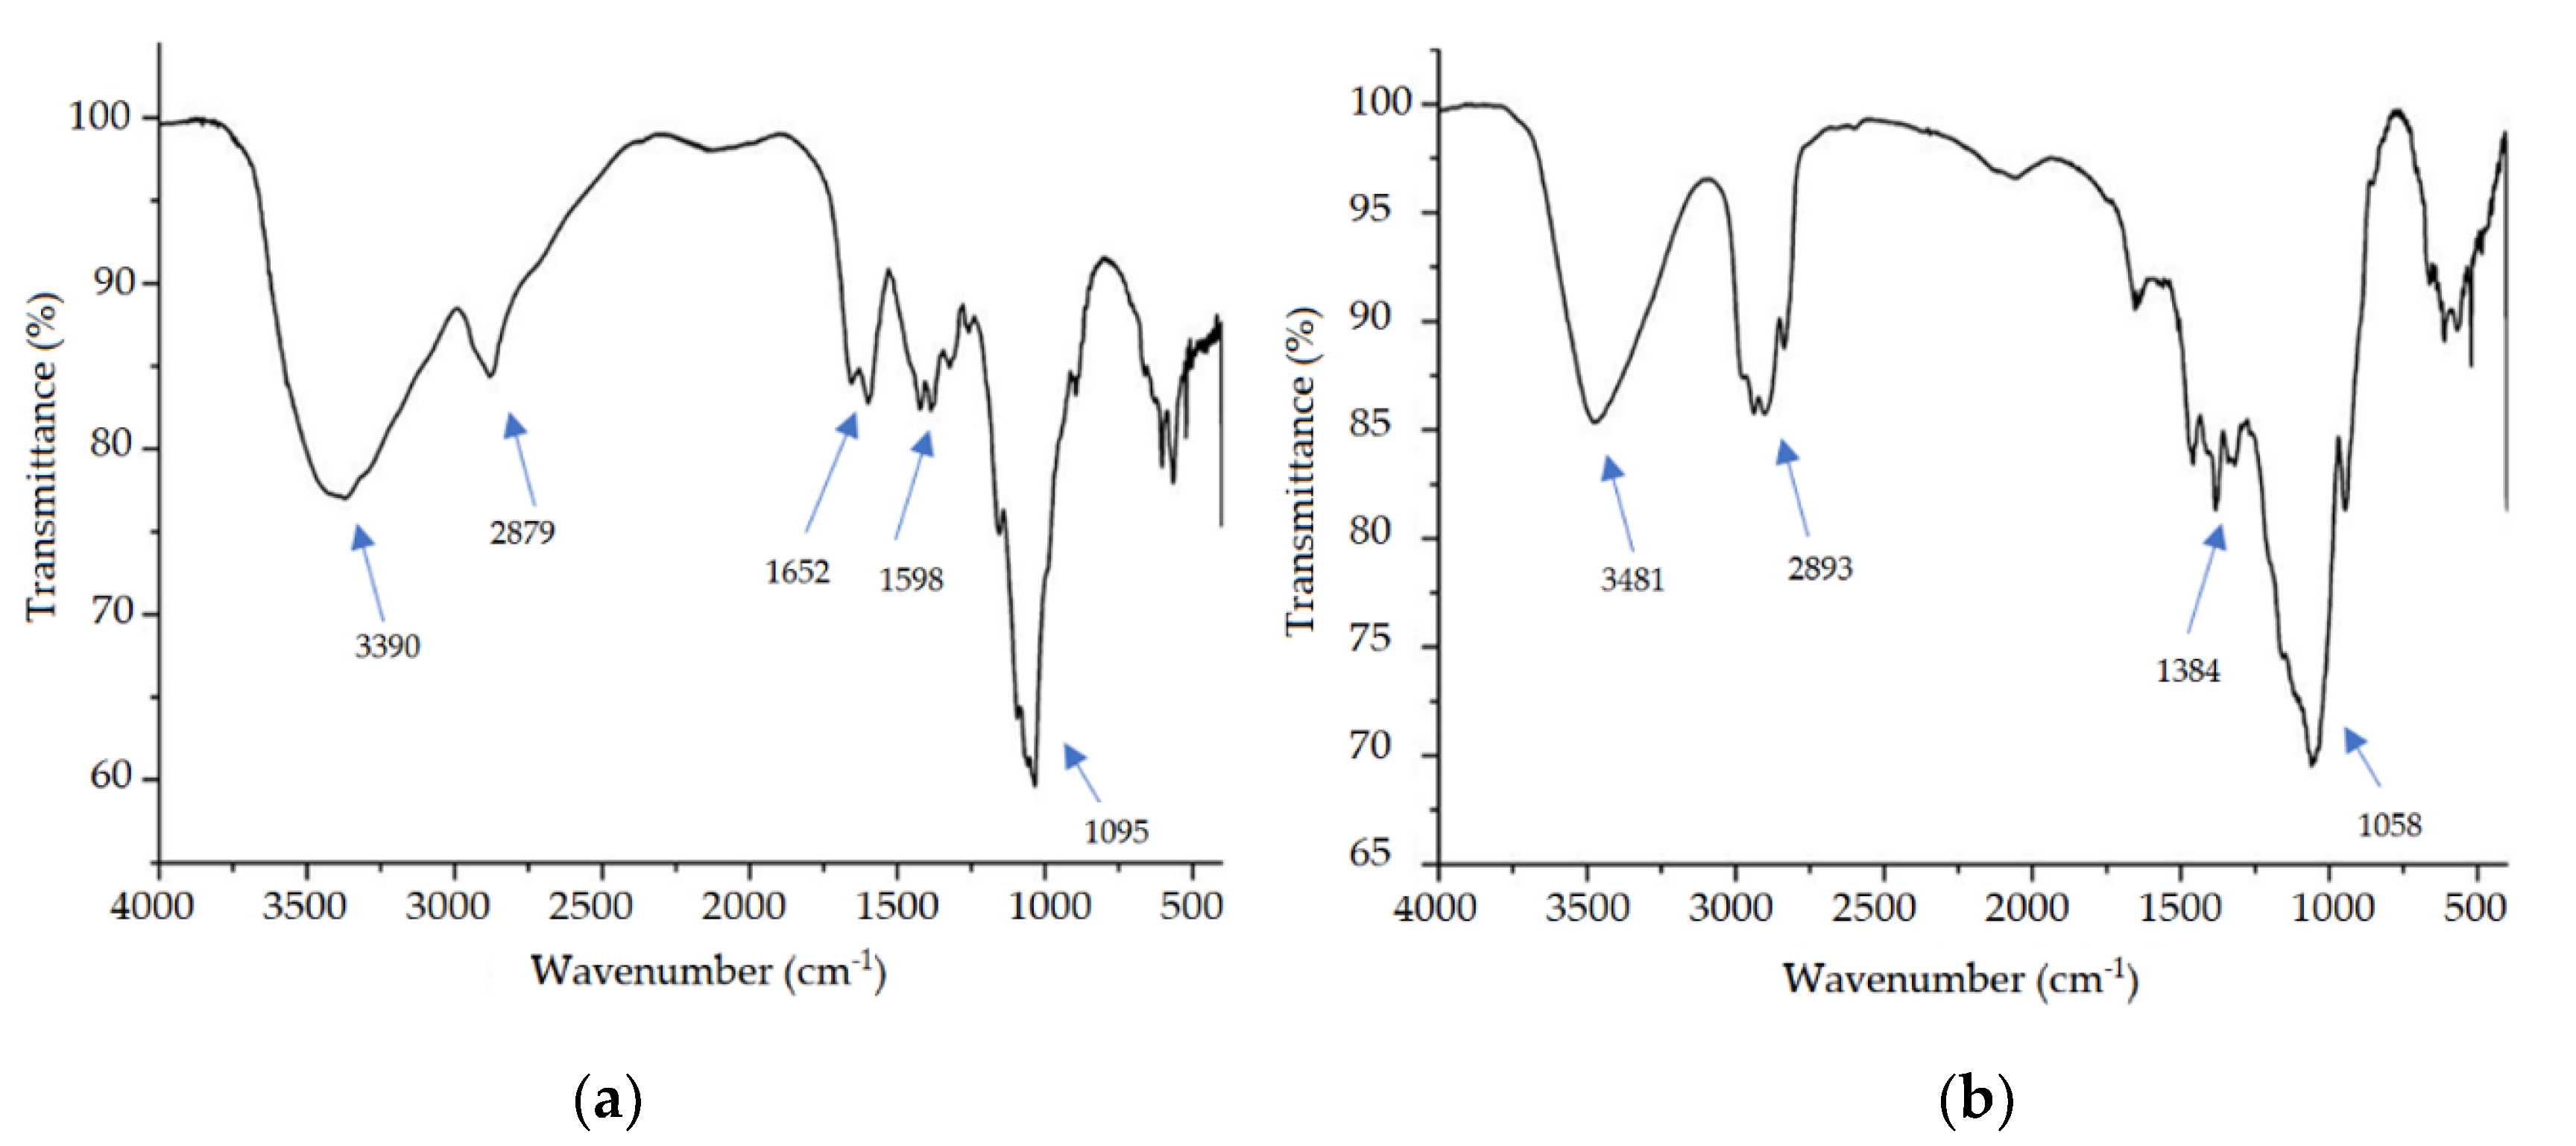
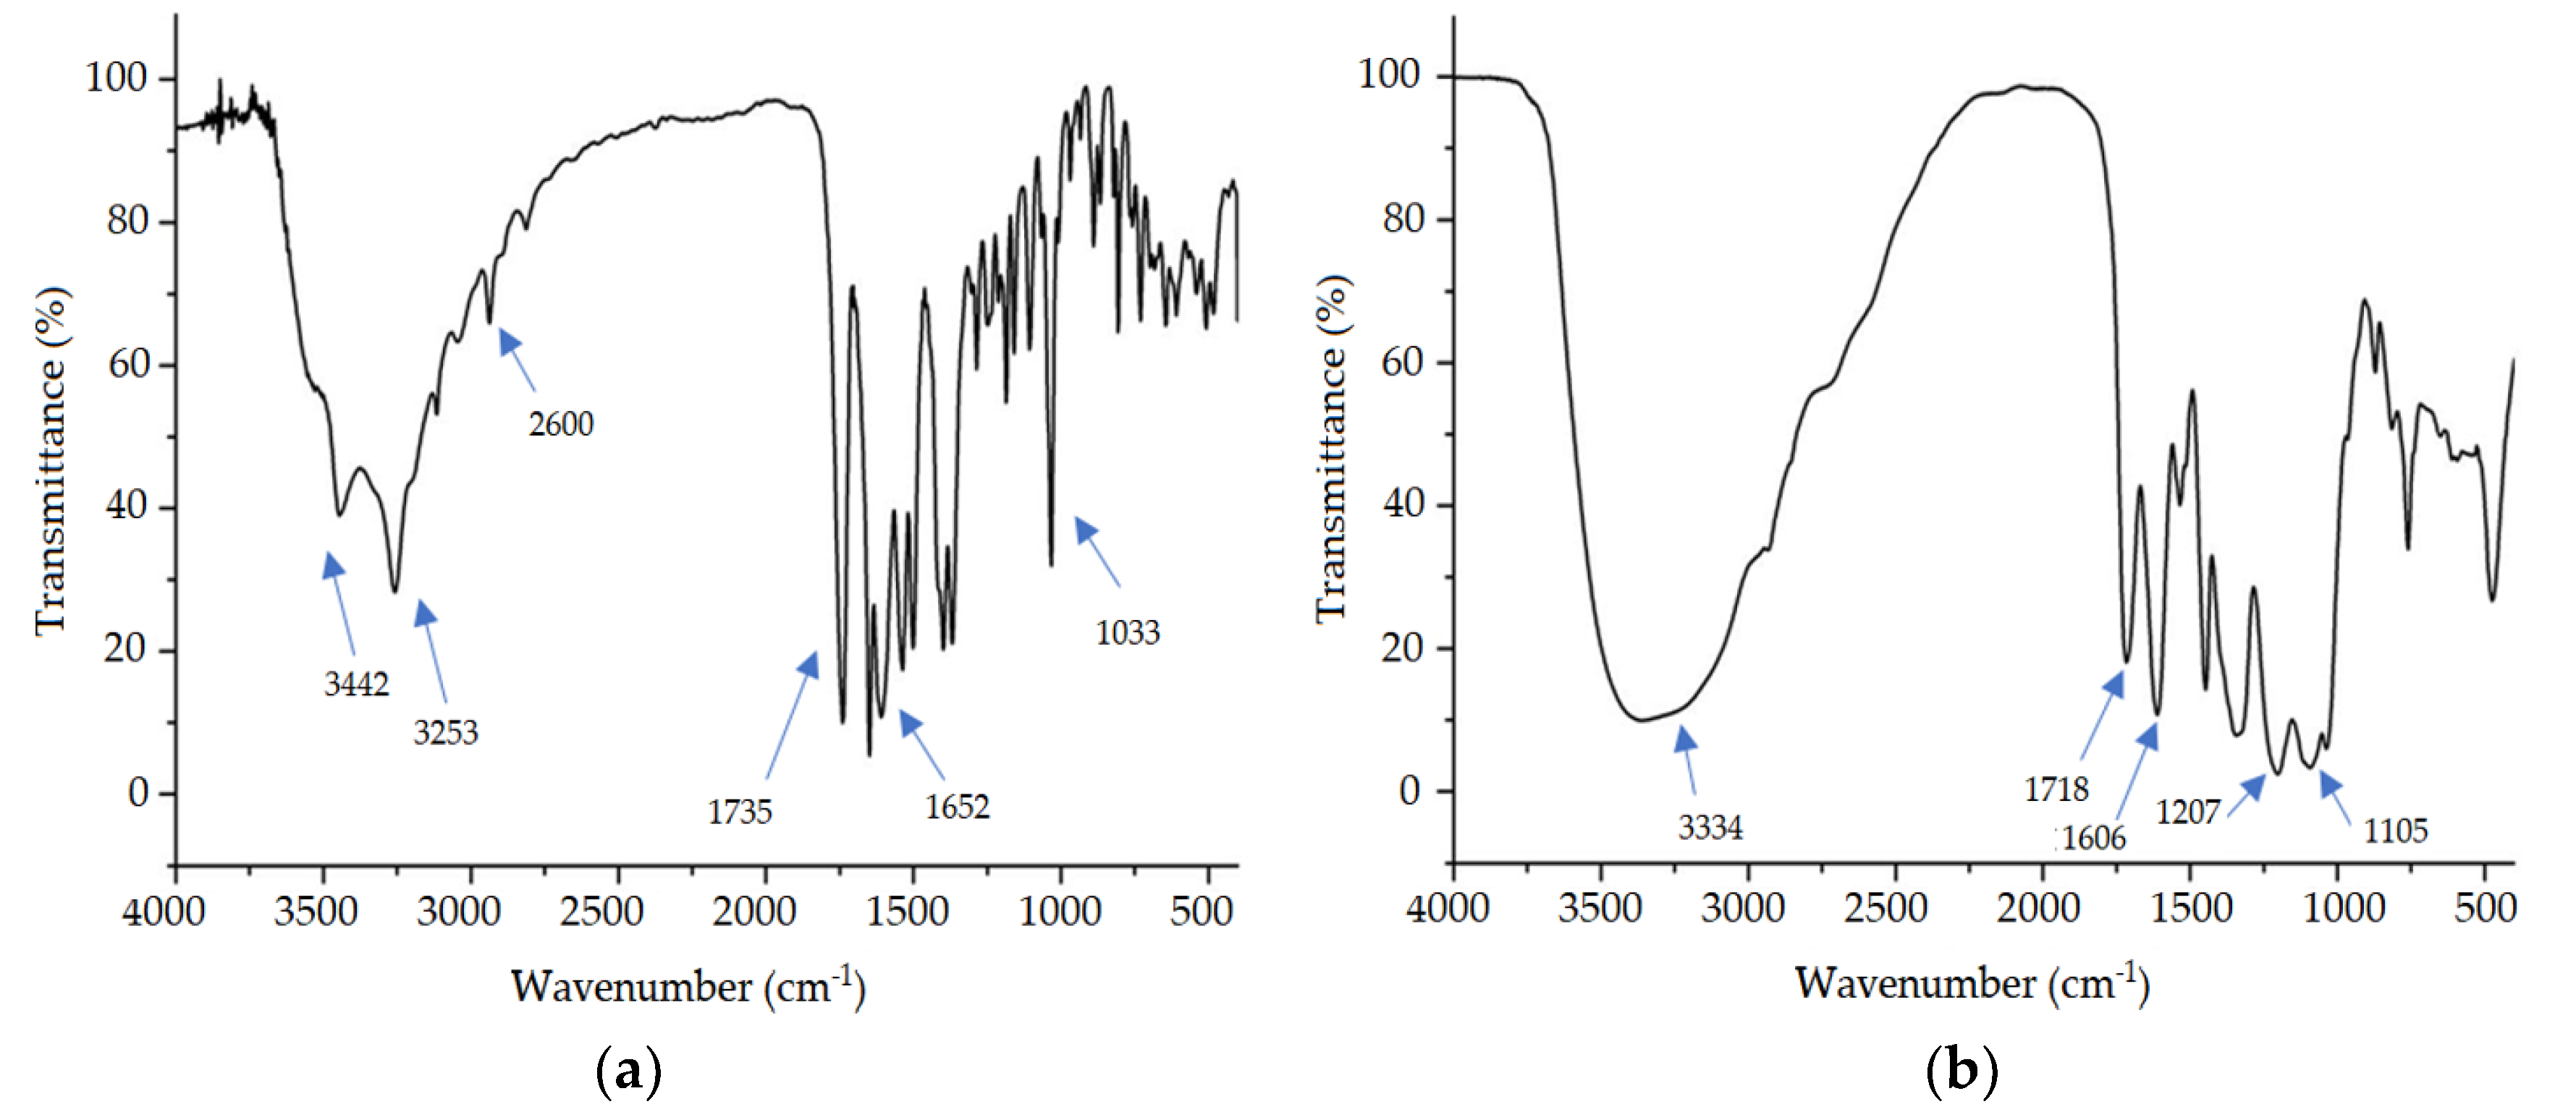
3.5. Fourier Transform Infrared Spectroscopy (FTIR)
3.6. Evaluation of the Antimicrobial Activity of S. brasiliensis and Ceftriaxone
3.7. Antimicrobial Activity of Nanoparticles
4. Conclusions
Author Contributions
Funding
Acknowledgments
Conflicts of Interest
References
- World Health Organization. No Time to Wait: Securing the Future from Drug-resistant Infections. Available online: https://www.who.int/antimicrobial-resistance/interagency-coordination-group/final-report (accessed on 17 June 2020).
- Arora, A.; Mishra, A. Antibacterial Polymers-A Mini Review. Mater. Today 2018, 5, 17156–17161. [Google Scholar] [CrossRef]
- Viroj, T. Lessons from the Antimicrobial Resistance: From global agenda to national strategic. Bull. World Health Organ. 2017, 95, 599–603. [Google Scholar]
- Shaikh, J.; Ankola, D.D.; Beniwal, V.; Singh, D.; Kumar, M.N.V.R. Nanoparticle encapsulation improves oral bioavailability of curcumin by at least 9-fold when compared to curcumin administered with piperine as absorption enhancer. Eur. J. Pharm. Sci. 2009, 37, 223–230. [Google Scholar] [CrossRef]
- Doi, Y.; Paterson, D.L. Carbapenemase-producing Enterobacteriaceae. Semin. Resp. Crit. Care 2015, 36, 74–84. [Google Scholar]
- Almugadam, B.S. Prevalence and antibiotics susceptibility patterns of carbapenem resistant Enterobacteriaceae. J. Bacteriol. Mycol. Open Access. 2018, 6, 187–190. [Google Scholar] [CrossRef][Green Version]
- Lakshminarayanan, R.; Ye, E.; Young, D.J.; Li, Z.; Loh, X.J. Recent Advances in the Development of Antimicrobial Nanoparticles for Combating Resistant Pathogens. Adv. Healthc. Mater. 2018, 7, 1–13. [Google Scholar] [CrossRef] [PubMed]
- Soontaros, S.; Leelakanok, N. Association between carbapenem-resistant Enterobacteriaceae and death: A systematic review and meta-analysis. Am. J. Infect. Control. 2019, 47, 1200–1212. [Google Scholar] [CrossRef] [PubMed]
- Shaikh, S.; Fatima, J.; Shakil, S.; Rizvi, S.M.D.; Kamal, M.A. Antibiotic resistance and extended spectrum beta-lactamases: Types, epidemiology and treatment. Saudi J. Biol. Sci. 2015, 22, 90–101. [Google Scholar] [CrossRef] [PubMed]
- Chotiprasitsakul, D.; Srichatrapimuk, S.; Kirdlarp, S.; Pyden, A.D.; Santanirand, P. Epidemiology of carbapenem-resistant Enterobacteriaceae: A 5-year experience at a tertiary care hospital. Infect. Drug Resist. 2019, 12, 461–468. [Google Scholar] [CrossRef]
- Lam, S.J.; Wong, E.H.H.; Boyer, C.; Qiao, G.G. Antimicrobial polymeric nanoparticles. Prog. Polym. Sci. 2018, 76, 40–64. [Google Scholar] [CrossRef]
- Saraiva, A.M.; Castro, R.H.A.; Cordeiro, R.P.; Peixoto Sobrinho, T.J.S.; Castro, V.T.N.A.; Amorim, E.L.C.; Xavier, H.S.; Pisciottano, M.N.C. In vitro evaluation of antioxidant, antimicrobial and toxicity properties of extracts of schinopsis brasiliensis engl. (Anacardiaceae). Afr. J. Pharm. Pharmacol. 2011, 5, 1724–1731. [Google Scholar] [CrossRef]
- Formiga, F.A.L.N.; Carneiro, V.S.M.; Souza, E.A.; Santos, R.L.; Cataõ, M.H.C.V.; Medeiros, A.C.D. In vitro evaluation of antimicrobial photodynamic therapy associated with hydroalcoholic extracts of schinopsis brasiliensis engl: New therapeutic perspectives. Photomed. Laser Surg. 2015, 33, 240–245. [Google Scholar] [CrossRef] [PubMed]
- Chaves, T.P.; Fernandes, F.H.A.; Santana, C.P.; Santos, J.S.; Medeiros, F.D.; Felismino, D.C.; Santos, V.L.; Catão, R.M.R.; Coutinho, H.D.M.; Medeiros, A.C.D. Evaluation of the interaction between the Poincianella pyramidalis (Tul.) LP Queiroz extract and antimicrobials using biological and analytical models. PLoS ONE 2016, 11, 4–7. [Google Scholar] [CrossRef] [PubMed]
- Soraya, I.; Sulaiman, C.; Basri, M.; Chan, K.W.; Ashari, S.E.; Reza, H.; Masoumi, F.; Ismail, M. In vitro antioxidant, cytotoxic and phytochemical studies of Clinacanthus nutans Lindau leaf extracts. Afr. J. Pharm. Pharmacol. 2015, 9, 861–874. [Google Scholar]
- Cardoso, M.P.; David, J.M.; David, J.P. A new alkyl phenol from Schinopsis brasiliensis. Nat. Prod. Res. 2005, 19, 431–433. [Google Scholar] [CrossRef]
- Cardoso, M.P.; Lima, L.S.; David, J.P.; Moreira, B.O.; Santos, E.O.; David, J.M.; Alves, C.Q. A new biflavonoid from Schinopsis brasiliensis (Anacardiaceae). J. Braz. Chem. 2015, 26, 1527–1531. [Google Scholar]
- Fernandes, F.H.A.; de Batista, R.S.A.; de Medeiros, F.D.; Santos, F.S.; Medeiros, A.C.D. Development of a rapid and simple HPLC-UV method for determination of gallic acid in Schinopsis brasiliensis. Rev. Bras. Farmacogn. 2015, 25, 208–211. [Google Scholar] [CrossRef]
- Fernandes, F.H.A.; Santana, C.P.; Silva, P.C.D.; Simões, M.O.d.S.; Kaneko, T.M.; Medeiros, A.C.D. Development of a sunscreen by thermal compatibility study using Schinopsis brasiliensis Engler extract as preservative. J. Therm. Anal. Calorim. 2018, 131, 753–763. [Google Scholar] [CrossRef]
- Dorati, R.; DeTrizio, A.; Spalla, M.; Migliavacca, R.; Pagani, L.; Pisani, S.; Chiesa, E.; Conti, B.; Modena, T.; Genta, I. Gentamicin Sulfate PEG-PLGA/PLGA-H nanoparticles: Screening design and antimicrobial effect evaluation toward clinic bacterial isolates. Nanomaterials 2018, 8, 37. [Google Scholar] [CrossRef]
- Gondim, B.L.C.; Oshiro-Júnior, J.A.; Fernanandes, F.H.A.; Nóbrega, F.P.; Castellano, L.R.C.; Medeiros, A.C.D. Plant Extracts Loaded in Nanostructured Drug Delivery Systems for Treating Parasitic and Antimicrobial Diseases. Curr. Pharm. Des. 2019, 25, 1604–1615. [Google Scholar] [CrossRef]
- Silva, B.L.d.; Abuçafy, M.P.; Manaia, E.B.; Junior, J.A.O.; Chiari-Andréo, B.G.; Pietro, R.C.L.R.; Chiavacci, L.A. Relationship between structure and antimicrobial activity of zinc oxide nanoparticles: An overview. Int. J. Nanomed. 2019, 14, 9395–9410. [Google Scholar] [CrossRef] [PubMed]
- Araújo, G.M.F.; Araújo, G.M.F.; Barros, A.R.A.; Barros, A.R.A.; Oshiro-Junior, J.A.; Oshiro-Junior, J.A.; Soares, L.F.; Soares, L.F.; da Rocha, L.G.; da Rocha, L.G.; et al. Nanoemulsions Loaded with Amphotericin B: Development, Characterization and Leishmanicidal Activity. Curr. Pharm. Des. 2019, 25, 1616–1622. [Google Scholar] [CrossRef]
- Silvestre, A.L.P.; Oshiro-Júnior, J.A.; Garcia, C.; Turco, B.O.; da Silva Leite, J.M.; de Lima Damasceno, B.P.G.; Soares, J.C.M.; Chorilli, M. Monoclonal antibodies carried in drug delivery nanosystems as a strategy for cancer treatment. Curr. Med. Chem. 2020, 27, 1–2. [Google Scholar] [CrossRef] [PubMed]
- Chiari-Andréo, B.G.; Abuçafy, M.P.; Manaia, E.B.; da Silva, B.L.; Rissi, N.C.; Oshiro-Júnior, J.A.; Chiavacci, L.A. Drug Delivery Using Theranostics: An Overview of its Use, Advantages and Safety Assessment. Curr. Nanosci. 2019, 16, 3–14. [Google Scholar] [CrossRef]
- Oshiro-Júnior, J.A.; Rodero, C.; Hanck-Silva, G.; Sato, M.R.; Alves, R.C.; Eloy, J.O.; Chorilli, M. Stimuli-responsive Drug Delivery Nanocarriers in the Treatment of Breast Cancer. Curr. Med. Chem. 2018, 27, 2494–2513. [Google Scholar] [CrossRef]
- Oshiro-Júnior, J.A.; Sato, M.R.; Boni, F.I.; Santos, K.L.M.; Oliveira, T.K.; Freitas, L.M.; Fontana, C.R.; Nicholas, D.; McHale, A.; Callan, J.F.; et al. Phthalocyanine-loaded nanostructured lipid carriers functionalized with folic acid for photodynamic therapy. Mater. Sci. Eng. C 2020, 108, 110462. [Google Scholar] [CrossRef] [PubMed]
- Zazo, H.; Colino, C.I.; Lanao, J.M. Current applications of nanoparticles in infectious diseases. J. Control. Release 2016, 224, 86–102. [Google Scholar] [CrossRef]
- Oswaldo, F. Farmacopeia Brasileira, 5th ed.; National Health Surveillance Agency: Brasília, Brazil, 2010; Volume 1. [Google Scholar]
- Boni, F.I.; Almeida, A.; Lechanteur, A.; Sarmento, B.; Cury, B.S.F.; Gremião, M.P.D. Mucoadhesive nanostructured polyelectrolytes complexes modulate the intestinal permeability of methotrexate. Eur. J. Pharm. Sci. 2018, 111, 73–82. [Google Scholar] [CrossRef]
- Siyawamwaya, M.; Choonara, Y.E.; Bijukumar, D.; Kumar, P.; Du Toit, L.C.; Pillay, V. A Review: Overview of Novel Polyelectrolyte Complexes as Prospective Drug Bioavailability Enhancers. Int. J. Polym. Mater. 2015, 64, 955–968. [Google Scholar] [CrossRef]
- Hao, J.; Fang, X.; Zhou, Y.; Wang, J.; Guo, F.; Li, F.; Peng, X. Development and optimization of solid lipid nanoparticle formulation for ophthalmic delivery of chloramphenicol using a Box-Behnken design. Int. J. Nanomed. 2011, 6, 683–692. [Google Scholar]
- Tan, C.; Xie, J.; Zhang, X.; Cai, J.; Xia, S. Polysaccharide-based nanoparticles by chitosan and gum arabic polyelectrolyte complexation as carriers for curcumin. Food Hydrocoll. 2016, 57, 236–245. [Google Scholar] [CrossRef]
- Griffiths, P.C.; Cattoz, B.; Ibrahim, M.S.; Anuonye, J.C. Probing the interaction of nanoparticles with mucin for drug delivery applications using dynamic light scattering. Eur. J. Pharm. Biopharm. 2015, 97, 218–222. [Google Scholar] [CrossRef] [PubMed]
- Crucho, C.I.; Barros, M.T. Polymeric nanoparticles: A study on the preparation variables and characterization methods. Mater. Sci. Eng. 2017, 1, 771–784. [Google Scholar] [CrossRef] [PubMed]
- Zaki, N.M.; Hafez, M.M. Enhanced antibacterial effect of ceftriaxone sodium-loaded chitosan nanoparticles against intracellular Salmonella typhimurium. AAPS PharmSciTech 2012, 13, 411–421. [Google Scholar] [CrossRef] [PubMed]
- Polexe, R.C.; Delair, T. Elaboration of stable and antibody functionalized positively charged colloids by polyelectrolyte complexation between chitosan and hyaluronic acid. Molecules 2013, 18, 8563–8578. [Google Scholar] [CrossRef] [PubMed]
- Jamil, B.; Habib, H.; Abbasi, S.; Nasir, H.; Rahman, A.; Rehman, A.; Bokhari, H.; Imran, M. Cefazolin loaded chitosan nanoparticles to cure multi drug resistant Gram-negative pathogens. Carbohydr. Polym. 2015, 136, 682–691. [Google Scholar] [CrossRef]
- Avadi, M.R.; Sadeghi, A.M.M.; Mohammadpour, N.; Abedin, S.; Atyabi, F.; Dinarvand, R.; Rafiee-Tehrani, M. Preparation and characterization of insulin nanoparticles using chitosan and Arabic gum with ionic gelation method. Nanomed. Nanotechnol. 2010, 6, 58–63. [Google Scholar] [CrossRef]
- Danaei, M.; Dehghankhold, M.; Ataei, S.; Hasanzadeh Davarani, F.; Javanmard, R.; Dokhani, A.; Khorasani, S.; Mozafari, M.R. Impact of particle size and polydispersity index on the clinical applications of lipidic nanocarrier systems. Pharmaceutics 2018, 10, 57. [Google Scholar] [CrossRef]
- Khan, S.A.; Schneider, M. Improvement of Nanoprecipitation Technique for Preparation of Gelatin Nanoparticles and Potential Macromolecular Drug Loading. Macromol. Biosci. 2013, 13, 455–463. [Google Scholar] [CrossRef]
- Deshmukh, K.; Ahamed, M.B.; Deshmukh, R.R.; Pasha, S.K.K.; Bhagat, P.R. Biopolymer Composites in Electronics 3–Biopolymer Composites with High Dielectric Performance: Interface. Biopolym. Compos. Electron. 2017, 3, 27–128. [Google Scholar]
- De Gonsalves, A.; Araujo, C.R.M.; Soares, N.A.; Goulart, M.O.F.; De Abreu, F.C. Diferentes Estrategias Para A Reticulaqao De Quitosana. Quim. Nova 2011, 34, 1215–1223. [Google Scholar] [CrossRef]
- Bhattacharjee, S. DLS and zeta potential–What they are and what they are not? J. Control. Release 2016, 235, 337–351. [Google Scholar] [CrossRef] [PubMed]
- Ilk, S.; Sağlam, N.; Özgen, M.; Korkusuz, F. Chitosan nanoparticles enhances the anti-quorum sensing activity of kaempferol. Int. J. Biol. Macromol. 2017, 94, 653–662. [Google Scholar] [CrossRef] [PubMed]
- Saghiri, M.A.; Asgar, K.; Lotfi, M.; Karamifar, K.; Saghiri, A.M.; Neelakantan, P.; Gutmann, J.L.; Sheibaninia, A. Back-scattered and secondary electron images of scanning electron microscopy in dentistry: A new method for surface analysis. Acta Odontol. Scand. 2012, 70, 603–609. [Google Scholar] [CrossRef] [PubMed]
- Gaumet, M.; Vargas, A.; Gurny, R.; Delie, F. Nanoparticles for drug delivery: The need for precision in reporting particle size parameters. Eur. J. Pharm. Biopharm. 2008, 69, 1–9. [Google Scholar] [CrossRef]
- Petit, T.; Puskar, L. FTIR spectroscopy of nanodiamonds: Methods and interpretation. Diam. Relat. Mater. 2018, 89, 52–66. [Google Scholar] [CrossRef]
- Vijayaraghavan, K.; Ashokkumar, T. Plant-mediated biosynthesis of metallic nanoparticles: A review of literature, factors affecting synthesis, characterization techniques and applications. J. Environ. Chem. Eng. 2017, 5, 4866–4883. [Google Scholar] [CrossRef]
- Mauricio-Sánchez, R.A.; Salazar, R.; Luna-Bárcenas, J.G.; Mendoza-Galván, A. FTIR spectroscopy studies on the spontaneous neutralization of chitosan acetate films by moisture conditioning. Vib. Spectrosc. 2018, 94, 1–6. [Google Scholar] [CrossRef]
- Tonhi, E.; Plepis, A.M.d.G. Obtenção e caracterização de blendas colágeno-quitosana. Quim. Nova 2002, 25, 943–948. [Google Scholar] [CrossRef]
- Sotelo-Boyás, M.E.; Correa-Pacheco, Z.N.; Bautista-Baños, S.; Corona-Rangel, M.L. Physicochemical characterization of chitosan nanoparticles and nanocapsules incorporated with lime essential oil and their antibacterial activity against food-borne pathogens. LWT Food Sci. Technol. 2017, 77, 15–20. [Google Scholar] [CrossRef]
- Shetty, G.R.; Rao, B.L.; Gowda, M.; Shivananda, C.S.; Asha, S.; Sangappa, Y. The preparation and characterization of silk fibroin blended with low molecular weight hydroxypropyl methylcellulose (HPMC). In AIP Conference Proceedings; AIP Publishing: Melville, NY, USA, 2018; Volume 1942, pp. 1–6. [Google Scholar]
- Shi, S.C.; Wu, J.Y.; Huang, T.F. Raman, FTIR, and XRD study of MoS2 enhanced hydroxypropyl methylcellulose green lubricant. Opt. Quantum Electron. 2016, 48, 1–9. [Google Scholar] [CrossRef]
- Manimekalai, P.; Dhanalaksmi, R.; Manavalan, R. Preparation and characterization of ceftriaxone sodium encapsulated chitosan nanoparticles. Int. J. App. Pharm. 2017, 9, 10–15. [Google Scholar] [CrossRef]
- Medeiros, A.C.D.; Alencar, L.C.B.; Castro, F.D. Schinopsis brasiliensis Engl. In Medicinal and Aromatic Plants of the World, 1st ed.; Albuquerque, U.P., Patil, U., Máthé, Á., Eds.; Springer: Dordrecht, The Netherlands, 2018; Volume 38, pp. 421–429. [Google Scholar]
- Holetz, F.B.; Pessini, G.L.; Sanches, N.R.; Cortez, A.G.; Nakamura, C.V.; Prado, B.; Filho, D. Screening Pl Medicinais 2.Pdf. Mem. Inst. Oswaldo Cruz 2002, 97, 1027–1031. [Google Scholar] [CrossRef]
- CLSI Performance standards for antimicrobial susceptibility testing. CLSI supplement M100. In Performance Standards for Antimicrobial Susceptibility Testing. CLSI supplement M100; Clinical and Laboratory Standards Institute: Wayne, PA, USA, 2018; p. 282.
- Liu, X.; Toprakcioglu, Z.; Dear, A.J.; Levin, A.; Ruggeri, F.S.; Taylor, C.G.; Hu, M.; Kumita, J.R.; Andreasen, M.; Dobson, C.M.; et al. Fabrication and Characterization of Reconstituted Silk Microgels for the Storage and Release of Small Molecules. Macromol. Rapid Commun. 2019, 40, 4–7. [Google Scholar] [CrossRef] [PubMed]
- Costa, E.M.; Silva, S.; Veiga, M.; Tavaria, F.K.; Pintado, M.M. Exploring chitosan nanoparticles as effective inhibitors of antibiotic resistant skin microorganisms–From in vitro to ex vitro testing. Carbohydr. Polym. 2018, 201, 340–346. [Google Scholar] [CrossRef]
- Abdelkader, A.; El-Mokhtar, M.A.; Abdelkader, O.; Hamad, M.A.; Elsabahy, M.; El-Gazayerly, O.N. Ultrahigh antibacterial efficacy of meropenem-loaded chitosan nanoparticles in a septic animal model. Carbohydr. Polym. 2017, 174, 1041–1050. [Google Scholar] [CrossRef] [PubMed]
- Gupta, A.; Mumtaz, S.; Li, C.H.; Hussain, I.; Rotello, V.M. Combatting antibiotic-resistant bacteria using nanomaterials. Chem. Soc. Rev. 2019, 48, 415–427. [Google Scholar] [CrossRef]
- Parisi, O.I.; Scrivano, L.; Sinicropi, M.S.; Puoci, F. Polymeric nanoparticle constructs as devices for antibacterial therapy. Curr. Opin. Pharmacol. 2017, 36, 72–77. [Google Scholar] [CrossRef] [PubMed]
- Jamil, B.; Abbasi, R.; Abbasi, S.; Imran, M.; Khan, S.U.; Ihsan, A.; Javed, S.; Bokhari, H. Encapsulation of cardamom essential oil in chitosan nano-composites: In-vitro efficacy on antibiotic-resistant bacterial pathogens and cytotoxicity studies. Front. Microbiol. 2016, 7, 1–10. [Google Scholar] [CrossRef]


| Formulations | X1 | X2 | X3 |
|---|---|---|---|
| HPMC/CS | CRO | EX | |
| (%) | (%) | (%) | |
| NP-1 | 70/30 | 1 | 2 |
| NP-2 | 70/30 | 3 | 2 |
| NP-3 | 70/30 | 2 | 1 |
| NP-4 | 70/30 | 2 | 3 |
| NP-5 | 30/70 | 1 | 2 |
| NP-6 | 30/70 | 3 | 2 |
| NP-7 | 30/70 | 2 | 1 |
| NP-8 | 30/70 | 2 | 3 |
| NP-9 | 50/50 | 1 | 1 |
| NP-10 | 50/50 | 1 | 3 |
| NP-11 | 50/50 | 3 | 1 |
| NP-12 | 50/50 | 3 | 3 |
| NP-13 | 50/50 | 2 | 2 |
| NP-14 | 50/50 | 2 | 2 |
| NP-15 | 50/50 | 2 | 2 |
| Variables | Level | ||
|---|---|---|---|
| −1 | 0 | 1 | |
| X1 | 30/70 | 50/50 | 70/30 |
| X2 | 1 | 2 | 3 |
| X3 | 1 | 2 | 3 |
| Acronym | Formulation | d.nm (nm) | PDI | ZP |
|---|---|---|---|---|
| PN1 | HPMC_CS 70/30 C-B 1/2 | 440 ± 2.13 | 0.42 ± 4.13 | 18.15 ± 11.20 |
| PN2 | HPMC_CS 70/30 C-B 3/2 | 497 ± 1.93 | 0.58 ± 10.0 | 21.10 ± 0.82 |
| PN3 | HPMC_CS 70/30 C-B 2/1 | 494 ± 0.47 | 0.50 ± 2.08 | 22.85 ± 2.16 |
| PN4 | HPMC_CS 70/30 C-B 2/3 | 486 ± 0.82 | 0.47 ± 8.41 | 23.70 ± 0.59 |
| PN5 | HPMC_CS 30/70 C-B1/2 | 546 ± 0.38 | 0.69 ± 11.00 | 22.15 ± 2.87 |
| PN6 | HPMC_CS 30/70 C-B 3/2 | 554 ± 1.04 | 0.42 ± 6.12 | 22.20 ± 2.54 |
| PN7 | HPMC_CS 30/70 C-B 2/1 | 628 ± 1.77 | 0.61 ± 12.70 | 23.70 ± 0.59 |
| PN8 | HPMC_CS 30/70 C-B 2/3 | 632 ± 1.57 | 0.47 ± 5.49 | 27.50 ± 10.10 |
| PN9 | HPMC_CS 50/50 C-B 1/1 | 776 ± 6.92 | 0.42 ± 11.30 | 23.10 ± 3.67 |
| PN10 | HPMC_CS 50/50 C-B 1/3 | 713 ± 3.54 | 0.58 ± 18.80 | 22.65 ± 2.80 |
| PN11 | HPMC_CS 50/50 C-B 3/1 | 655 ± 14.14 | 0.62 ± 24.30 | 22.10 ± 1.91 |
| PN12 | HPMC_CS 50/50 C-B 3/3 | 1094 ± 8.22 | 0.64 ± 6.23 | 22.00 ± 6.42 |
| PN13 | HPMC_CS 50/50 C-B 2/2 | 1430 ± 7.31 | 0.91 ± 5.38 | 38.95 ± 5.99 |
| PN14 | HPMC_CS 50/50 C-B 2/2 | 1660 ± 10.90 | 0.90 ± 7.43 | 26.05 ± 4.07 |
| PN15 | HPMC_CS 50/50 C-B 2/2 | 1275 ± 5.09 | 0.92 ± 9.05 | 26.05 ± 4.07 |
| Microorganism Isolated | EX | CRO |
|---|---|---|
| MIC (µg mL−1) | MIC (µg mL−1) | |
| B01 | 250 | <0.5 |
| B02 | >1000 | 1000 |
| B03 | >1000 | 500 |
| Formulations | CIM (µg mL−1)/Microorganisms Tested | ||
|---|---|---|---|
| B01 | B02 | B03 | |
| (API/Extract) | |||
| PNF | ≤0.23 | 7.5 | 15 |
| PNE | ≤0.23 | 15 | 15 |
| PN4 | ≤0.15 | 5 | 10 |
| Formulations | MBC (µg mL−1)/Microorganisms Tested | ||
|---|---|---|---|
| B01 | B02 | B03 | |
| (API/Extract) | |||
| PNF | ≤0.23 | 15 | 15 |
| PNE | ≤0.23 | 15 | 30 |
| PN4 | ≤0.15 | 5 | 10 |
© 2020 by the authors. Licensee MDPI, Basel, Switzerland. This article is an open access article distributed under the terms and conditions of the Creative Commons Attribution (CC BY) license (http://creativecommons.org/licenses/by/4.0/).
Share and Cite
de Oliveira, M.S.; Oshiro-Junior, J.A.; Sato, M.R.; Conceição, M.M.; Medeiros, A.C.D. Polymeric Nanoparticle Associated with Ceftriaxone and Extract of Schinopsis Brasiliensis Engler against Multiresistant Enterobacteria. Pharmaceutics 2020, 12, 695. https://doi.org/10.3390/pharmaceutics12080695
de Oliveira MS, Oshiro-Junior JA, Sato MR, Conceição MM, Medeiros ACD. Polymeric Nanoparticle Associated with Ceftriaxone and Extract of Schinopsis Brasiliensis Engler against Multiresistant Enterobacteria. Pharmaceutics. 2020; 12(8):695. https://doi.org/10.3390/pharmaceutics12080695
Chicago/Turabian Stylede Oliveira, Maísa Soares, João Augusto Oshiro-Junior, Mariana Rillo Sato, Marta Maria Conceição, and Ana Cláudia Dantas Medeiros. 2020. "Polymeric Nanoparticle Associated with Ceftriaxone and Extract of Schinopsis Brasiliensis Engler against Multiresistant Enterobacteria" Pharmaceutics 12, no. 8: 695. https://doi.org/10.3390/pharmaceutics12080695
APA Stylede Oliveira, M. S., Oshiro-Junior, J. A., Sato, M. R., Conceição, M. M., & Medeiros, A. C. D. (2020). Polymeric Nanoparticle Associated with Ceftriaxone and Extract of Schinopsis Brasiliensis Engler against Multiresistant Enterobacteria. Pharmaceutics, 12(8), 695. https://doi.org/10.3390/pharmaceutics12080695