In this section, we present results of our models for all the four tasks and compare our models with those rendered in [
9]. We first consider results of our single label classification models on cross validation in
Section 3.1. Then we present results of our single label classification models, but this time on test data, in
Section 3.2. Thereafter, we consider results of our multi-label classification model in comparison with previous models in
Section 3.3. Lastly, we consider drug repurposing opportunities as predicted by our models in
Section 3.4.
3.1. Single Label Classification Results for Cross Validation
Table 3 provides a summary of validation and test results for the three single label tasks. If we consider the results on cross validation from that table, it is observed that the average metrics of our GCN based models are higher compared with the other models—IMG + CNN and MFP + RF. GCN based models outperformed the other models in all categories and in all metrics considered, except on average precision score for the three-task subgroup. The good results obtained from GCN models could be attributed to the fact that the information about the molecules’ bonds and atoms is well captured and learned in graph-based methods than perhaps from images or fingerprints as accentuated in [
15].
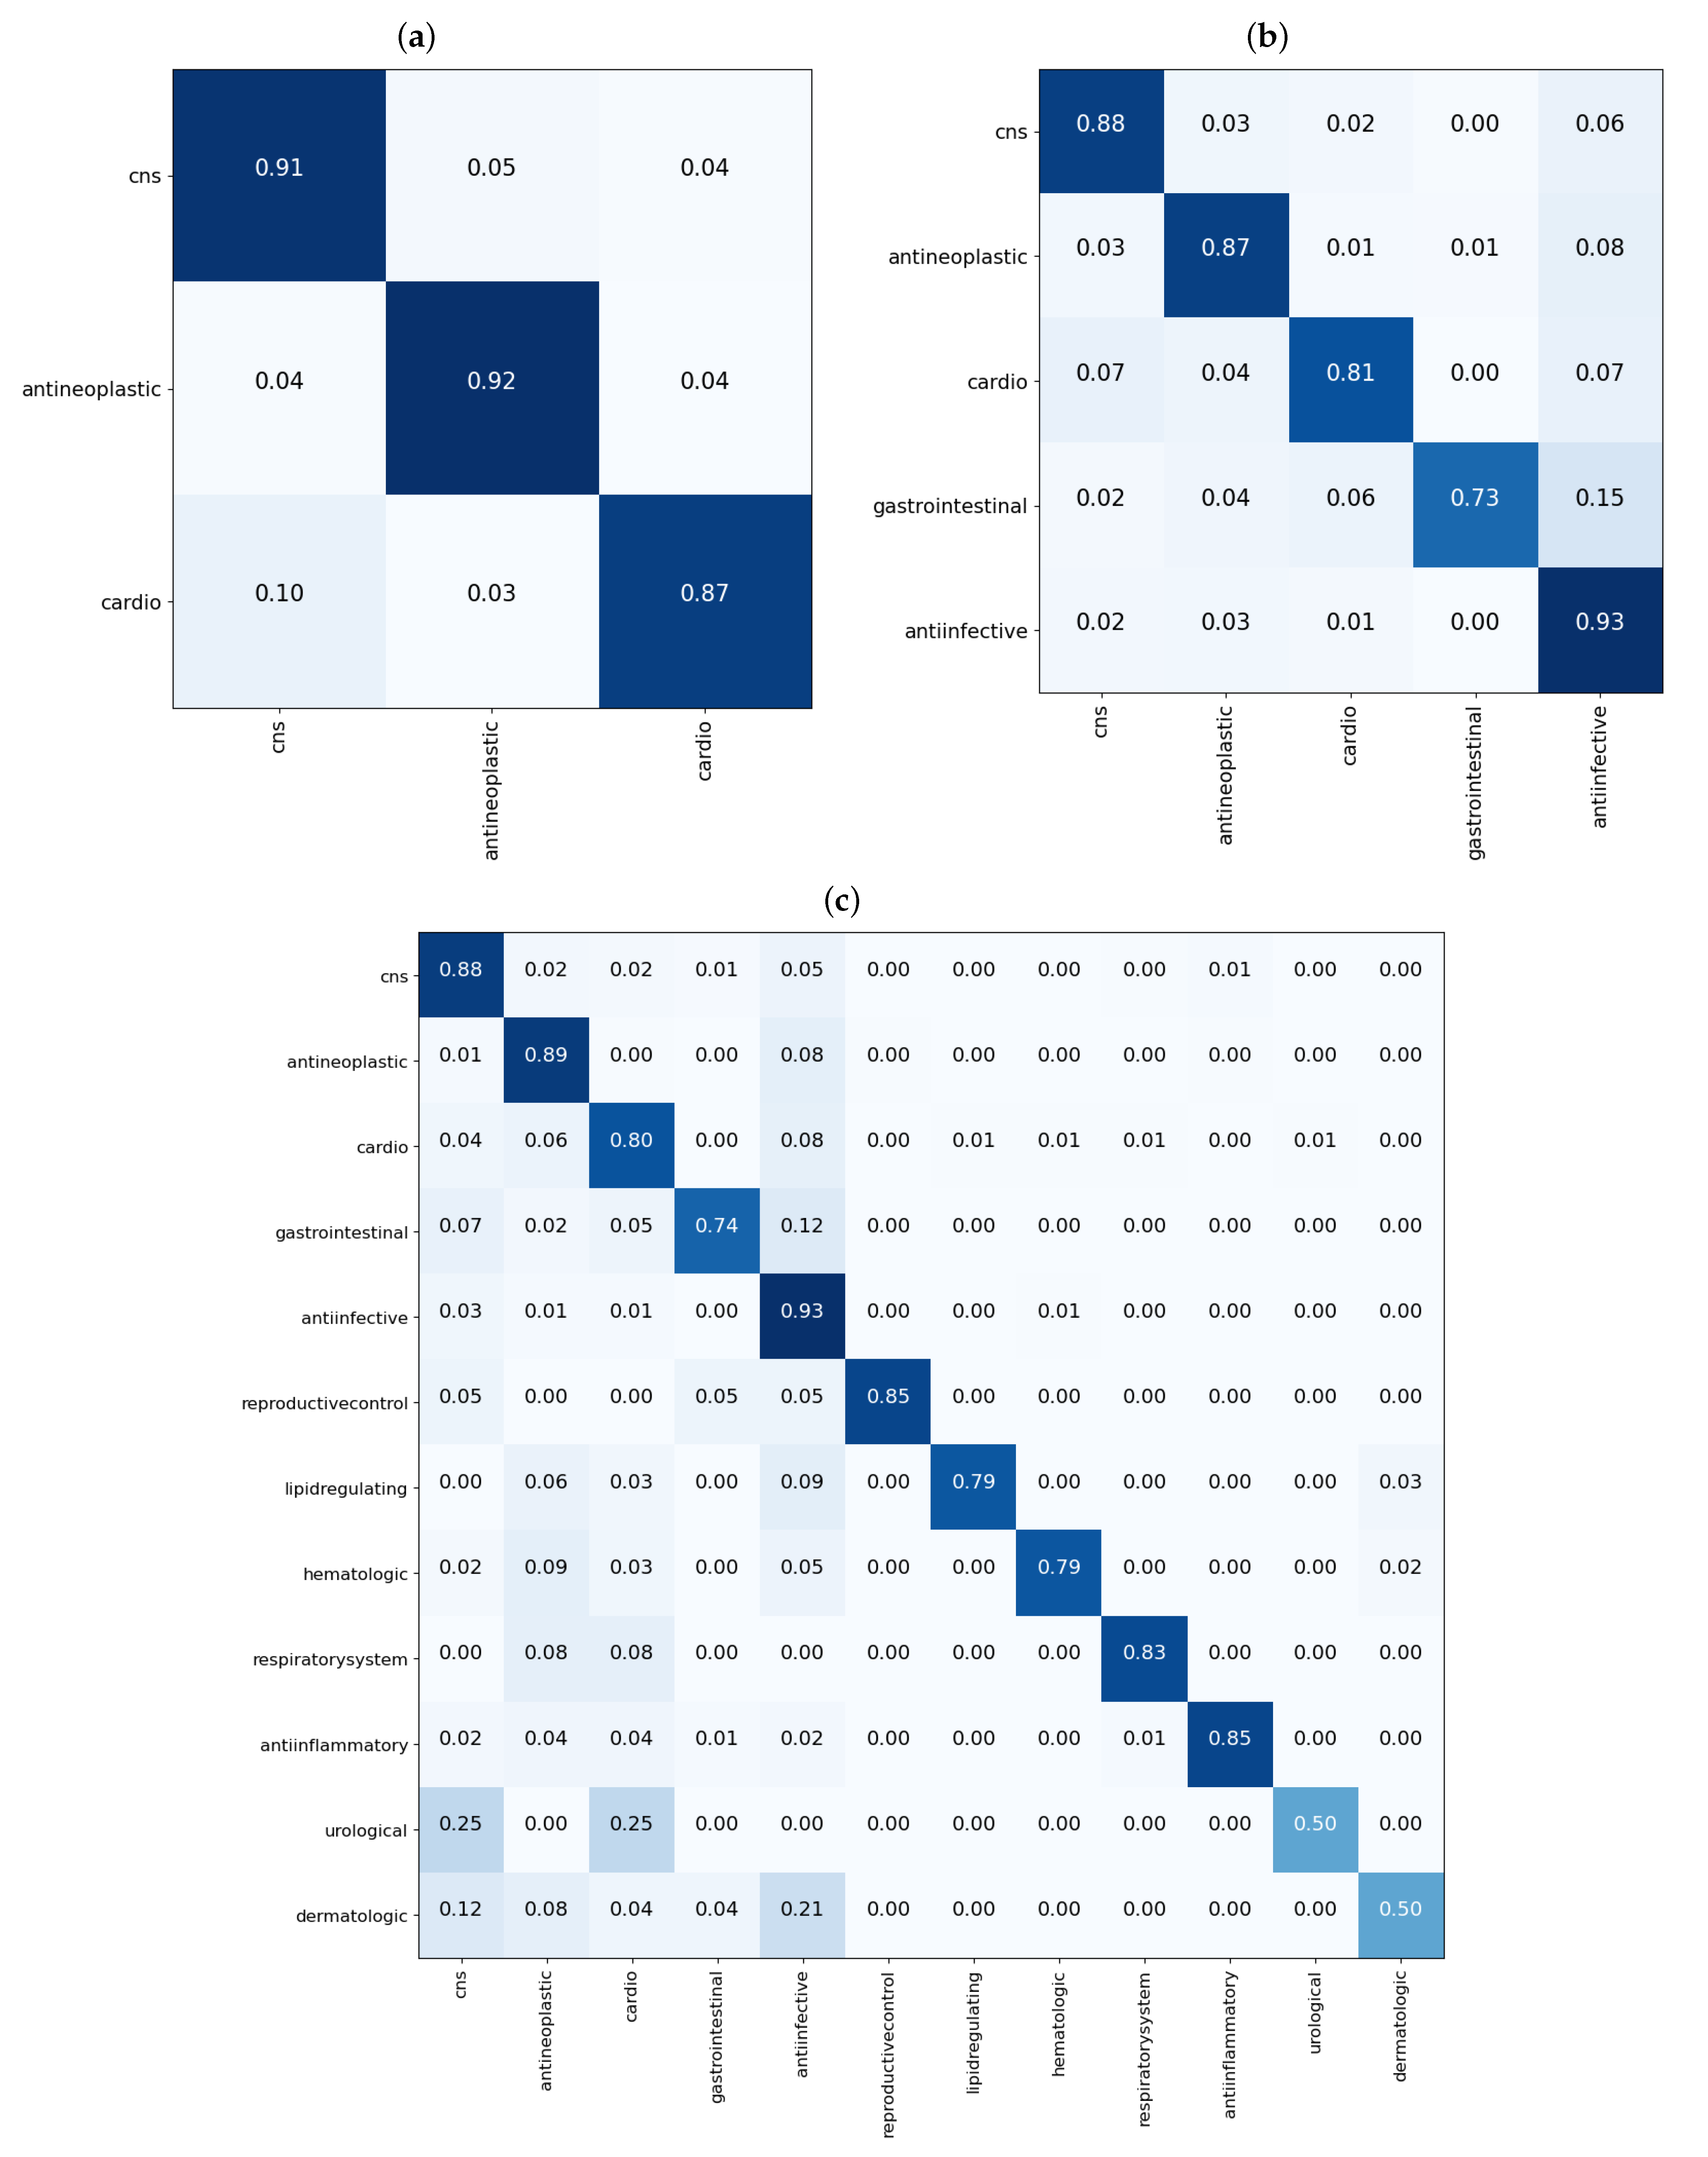
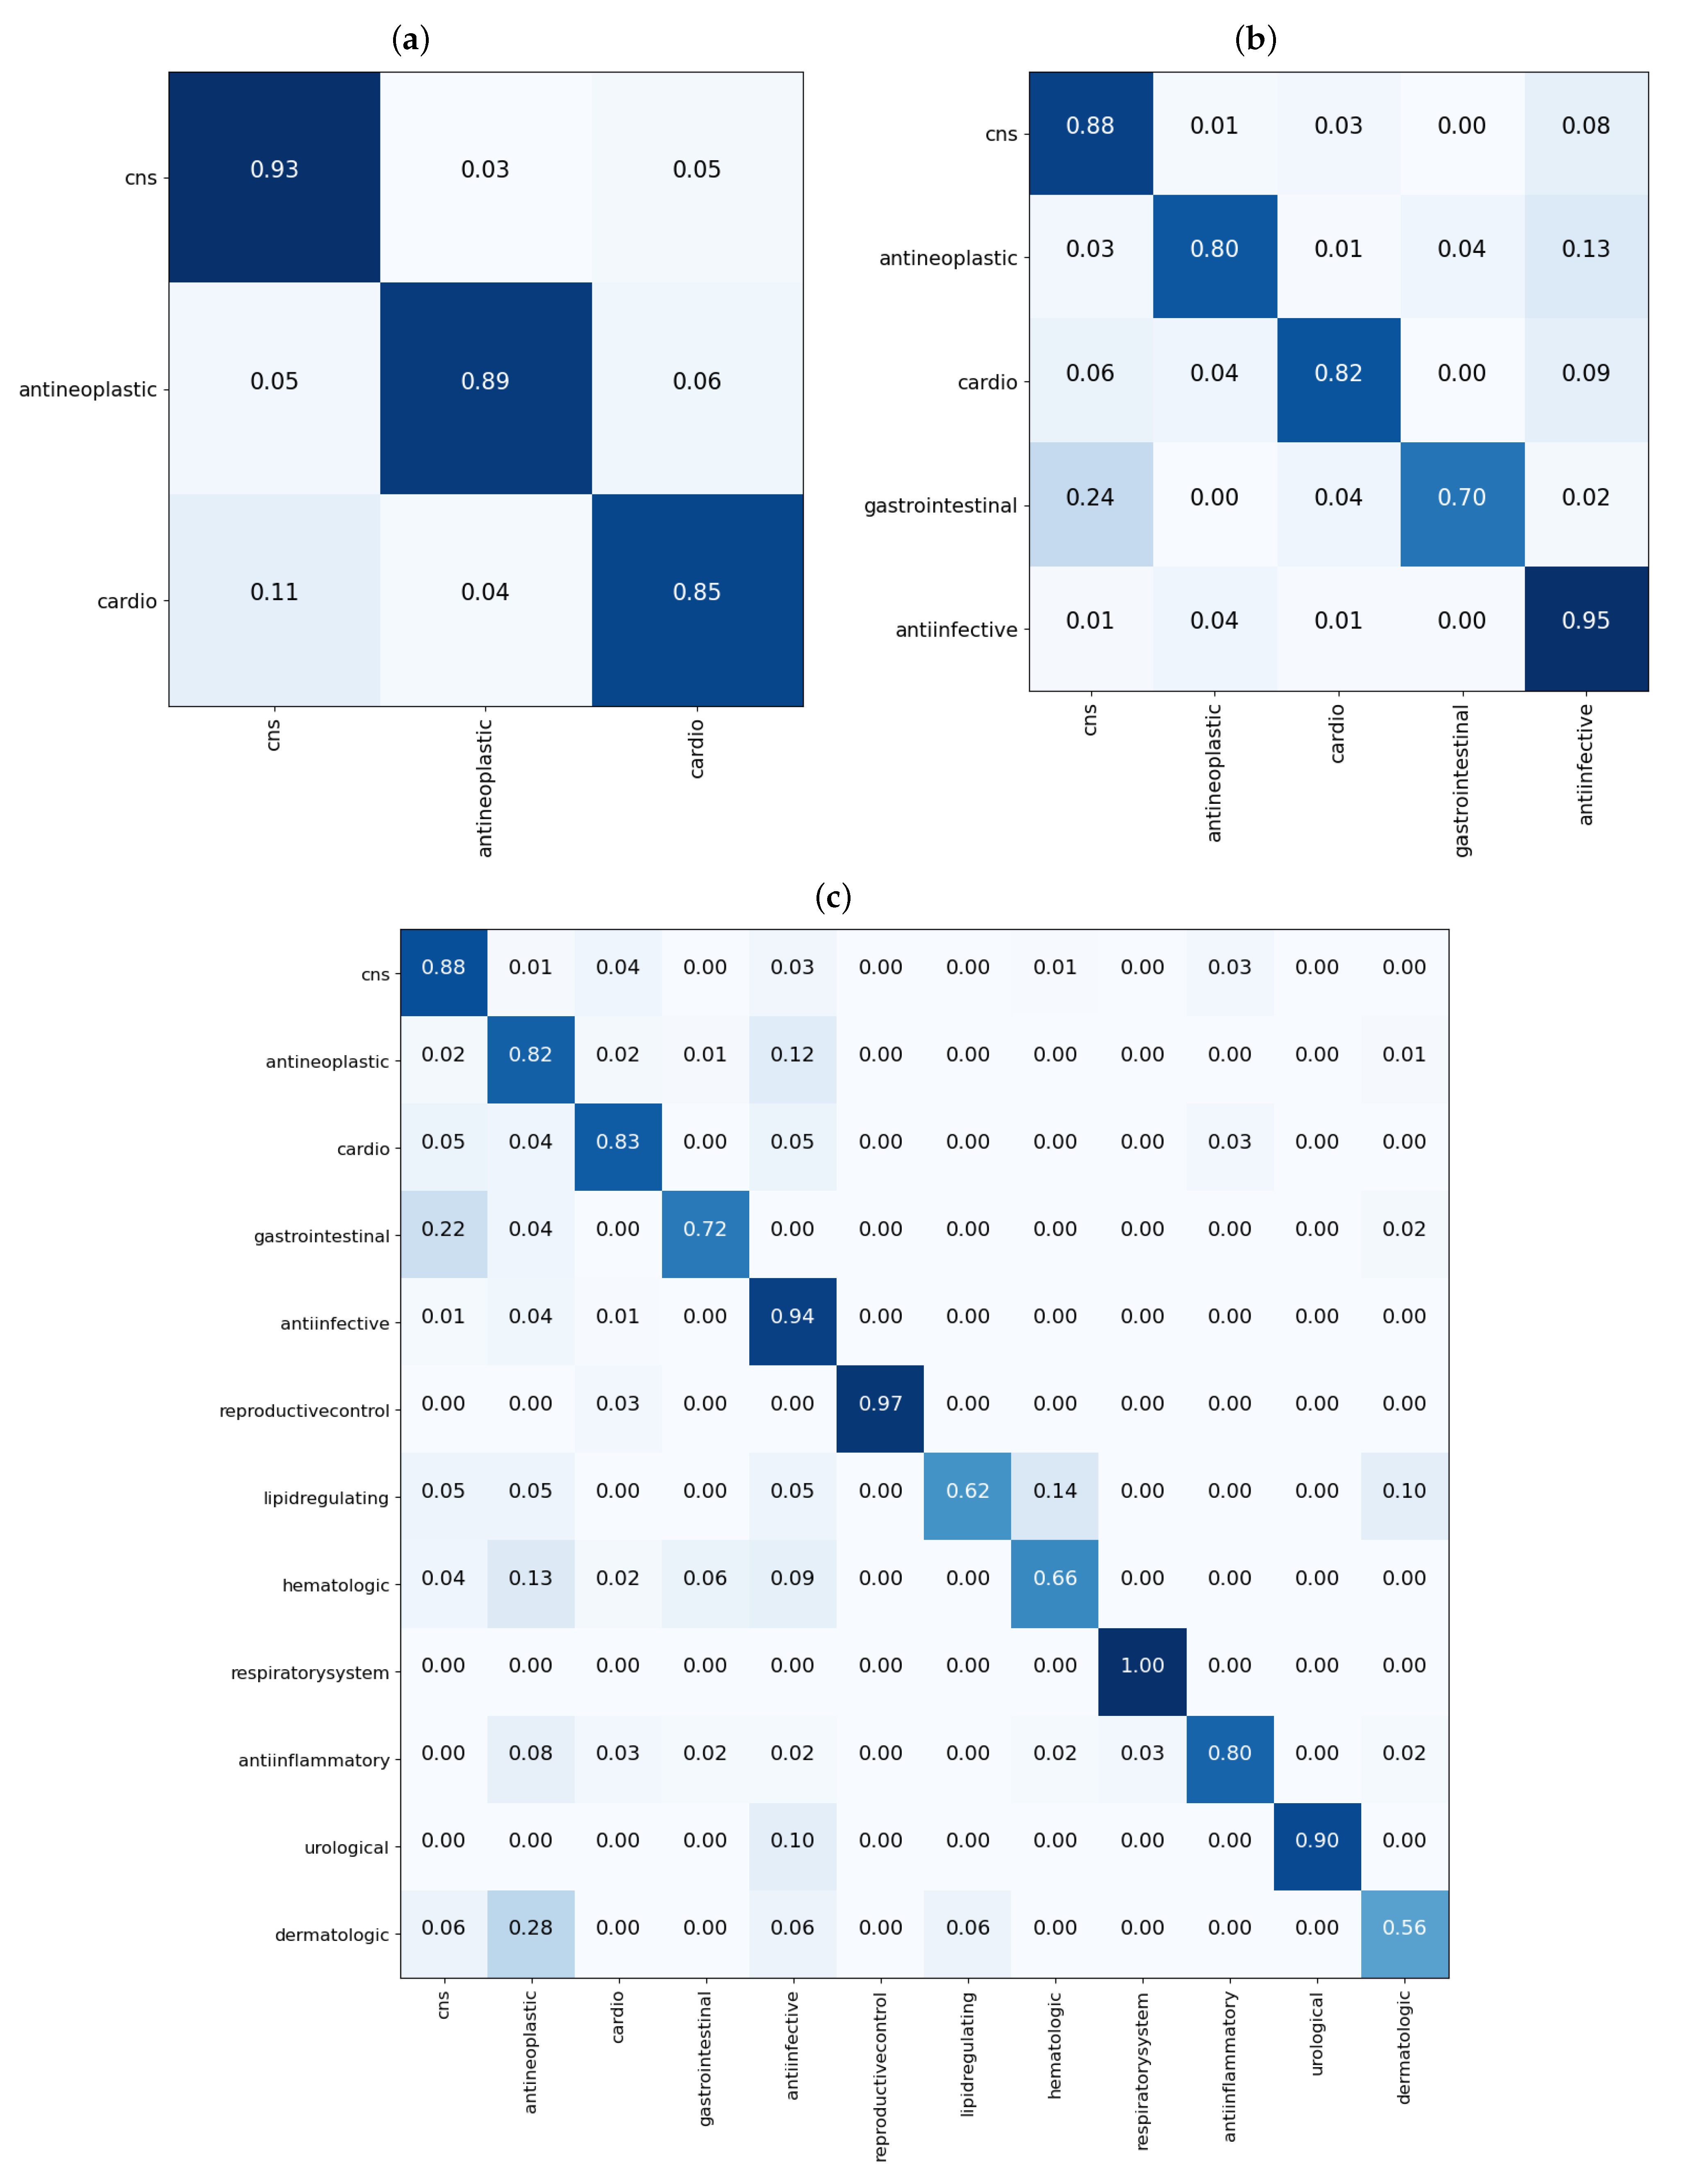
From the results shown in the confusion matrices of
Figure 3, we can see that our models yield good results on cross validation. In the three-task subgroup (
Figure 3a), antineoplastic agents were predicted more accurately
followed by central nervous system agents
and then cardiovascular agents at
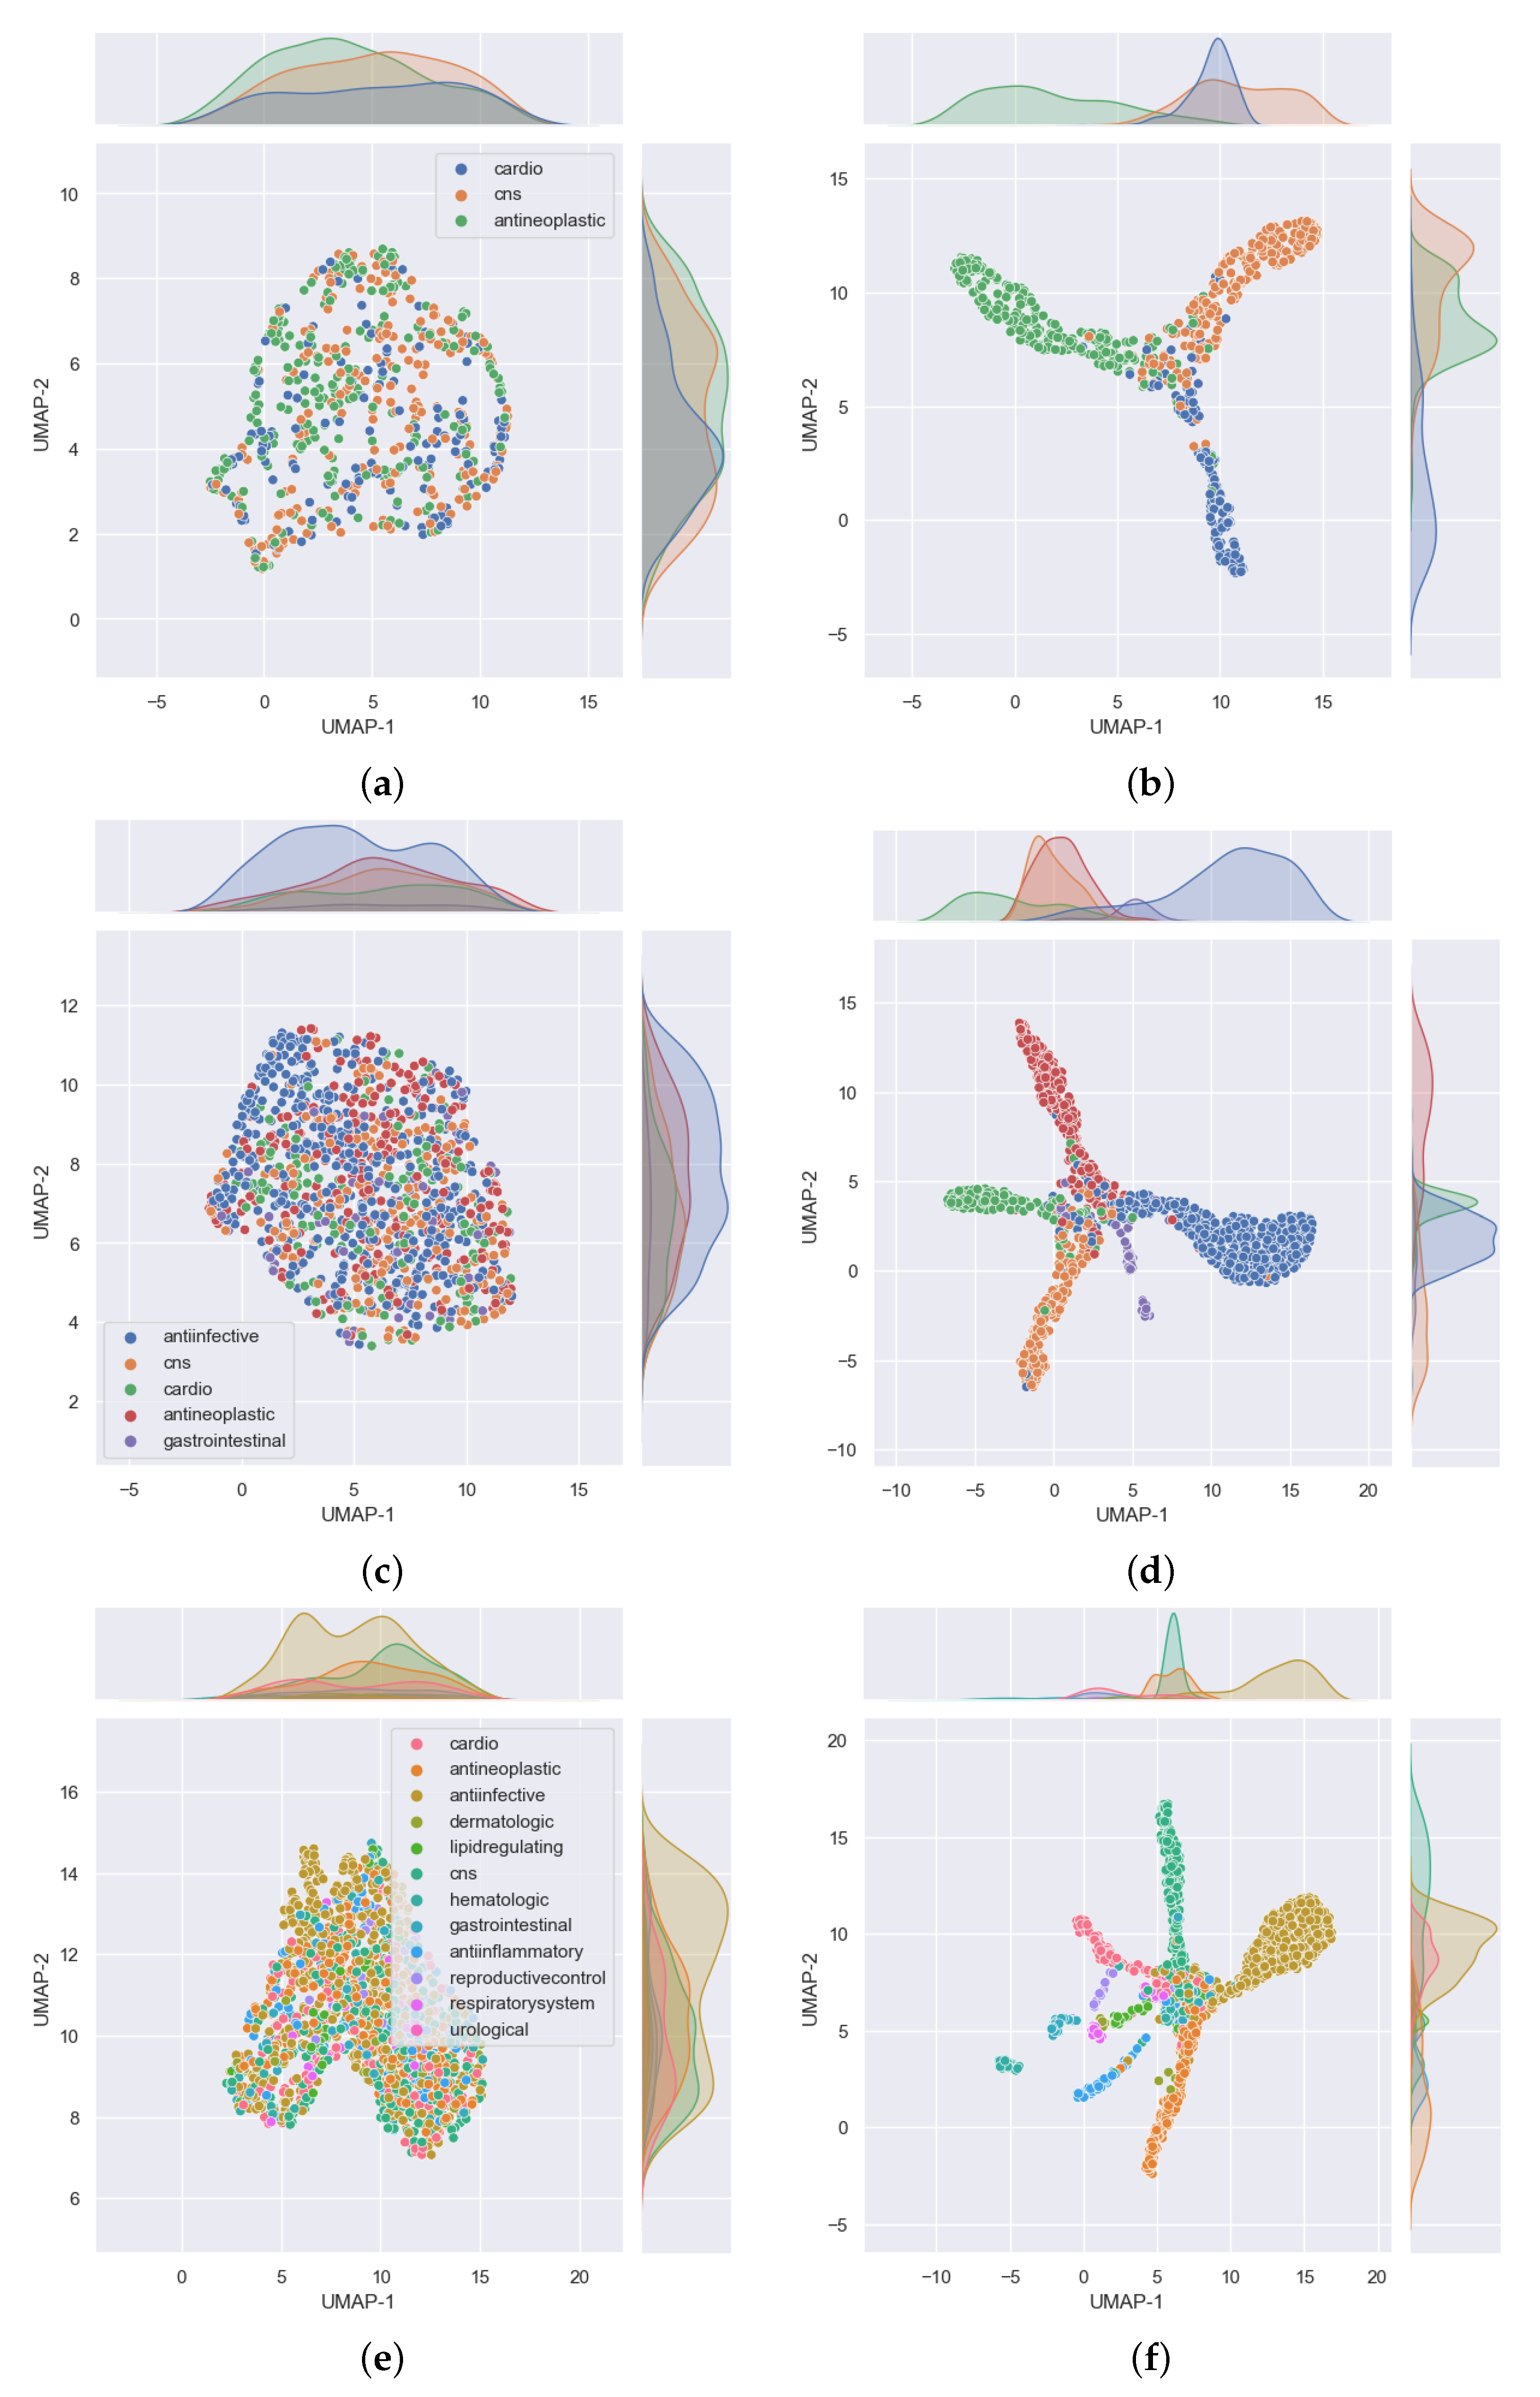
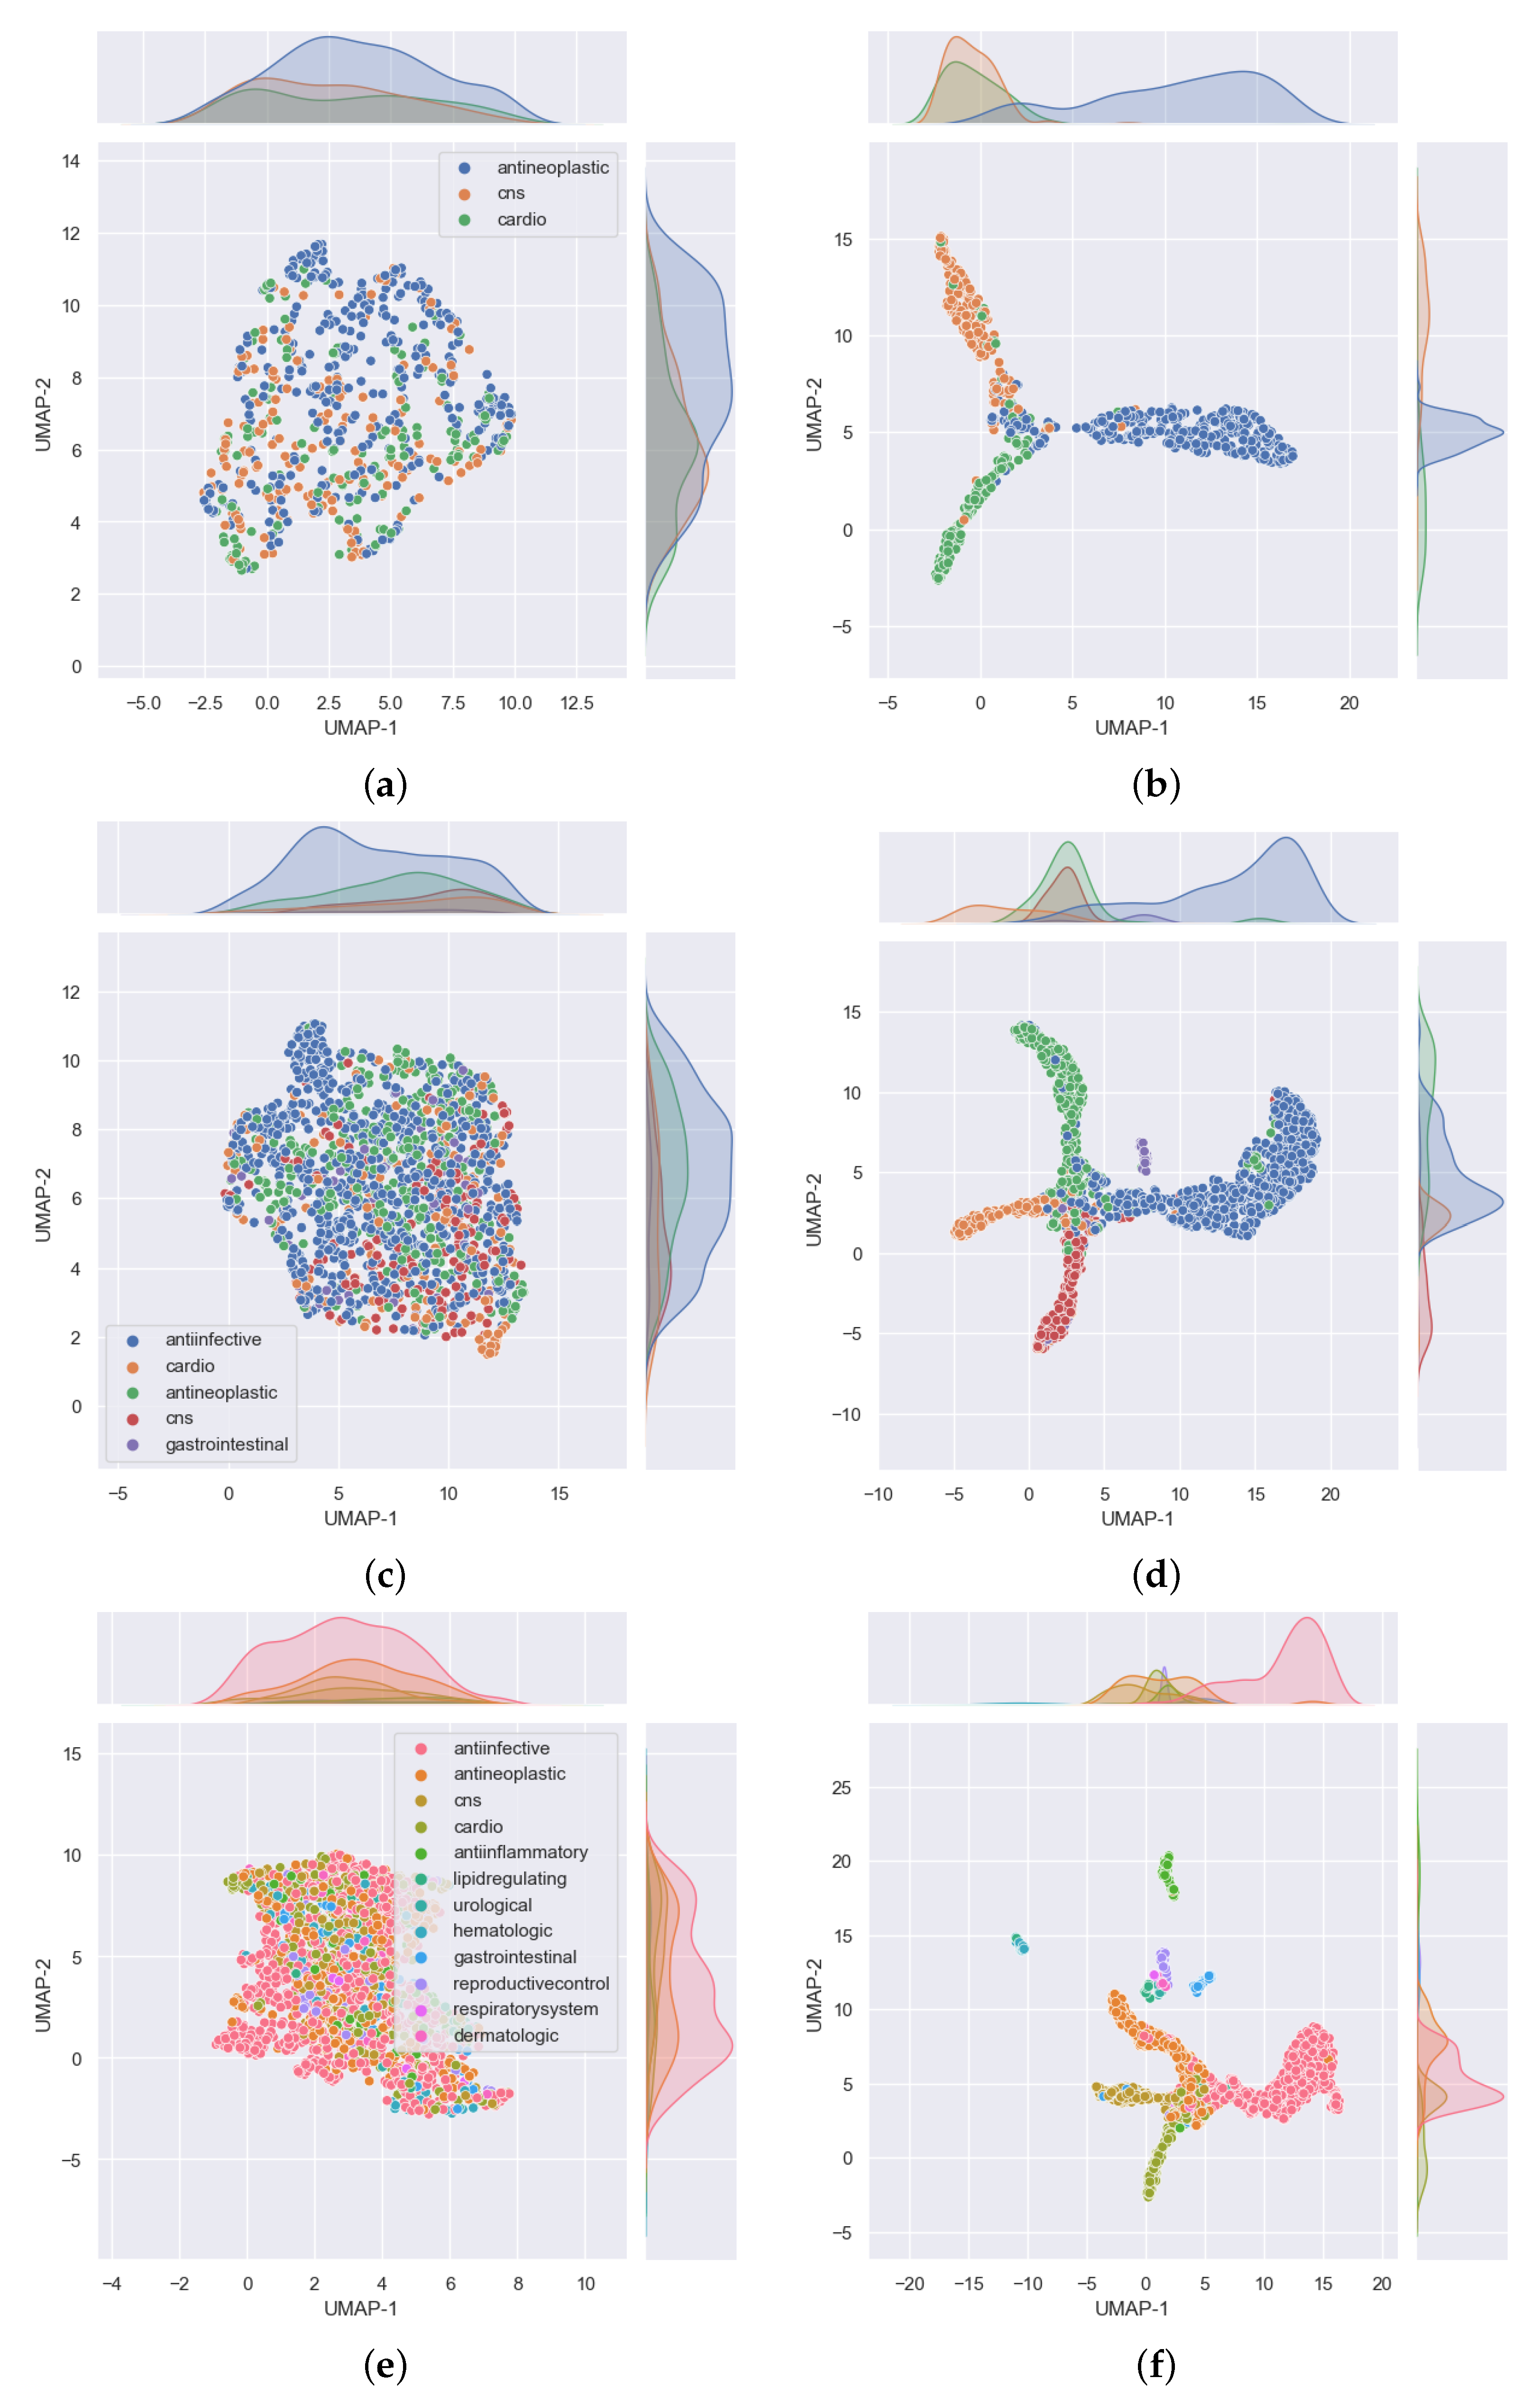
. Cardiovascular agents were the least well predicted, probably because they were the smallest set in this task with only 788 compounds compared with 1177 for antineoplastic and 1139 for central nervous system agents. The disparity in the numbers can further be observed in
Figure 4. In that figure,
Figure 4a shows the distribution of the data that was used for validation. It can be seen that, for the most part, the drugs in each class are evenly distributed, but the data are imbalanced among the three classes. There are many more antineoplastic and central nervous system agents as there are cardiovascular agents. Similar disparities will become more apparent in the 5- and 12-task subgroups. However, it is important to note that, after passing this data into our model, the model clearly classifies the drugs into three classes with an accuracy of over 90%, as shown in
Table 3 (under the GCN Val column). The good performance of the model is further evidenced in
Figure 4b, where we can see drugs belonging to each of the three MeSH classes clustered closer together as determined by the model.
In the five-task subgroup, whose results are summarized in the confusion matrix of
Figure 3b, anti-infective agents were predicted more accurately
. A total of 2398 compounds belonging to this group were used for cross validation (
Table 1). In contrast, there was a total of 258 drug compounds belonging to the gastrointestinal group for this task. Gastrointestinal agents were the least well predicted, with an accuracy of
. As with the three-task subgroup, central nervous system agents and antineoplastic agents, which are relatively equal in numbers, yielded similar accuracies of 88 and
, respectively. Moreover, as in the three-task subgroup, the cardiovascular group achieved an accuracy of
which is lower than that of either the CNS or antineoplastic groups. Again, there are some disparities in the numbers of drugs belonging to each class that have been used for this task, as observed in
Figure 4. In that figure, the distribution of the data that were used for validation is presented in
Figure 4c. As before, despite the data being imbalanced, the model clearly classifies the drugs into the five MeSH classes, with an accuracy of over
, as shown in
Table 3 (under the GCN Val column). The good performance of the model is further evidenced in
Figure 4d, where it is clear to see drugs belonging to each of the five MeSH classes distributed closer to each other after modeling.
Much like in the five-task subgroup, results of the 12-task subgroup presented in
Figure 3c indicate that the 2398 anti-infective agents were predicted more accurately (
). In contrast, the set of 26 urological agents only yielded an accuracy of
, presumably because they were very few. Perhaps the most difficult group to predict was the dermatological agents. With a total number of 115 compounds belonging to this group, only
of those used for validation in the fifth fold were correctly predicted. In addition,
(≈5) of drugs used for validation in the fifth fold were wrongly predicted as belonging to anti-infective agents. Reminiscent of the previous two task subgroups, the disparity in the numbers of drugs belonging to each class are more prominent in the 12-task subgroup, evident in
Figure 4e,f where
Figure 4e shows the distribution of the data. It can be seen that, for the most part, the drugs in each class are evenly distributed and the data is highly imbalanced. As noted earlier, urological agents are much less compared with the other classes. However, it is important to note that, after passing this data into our model, the model is able to classify the drugs into the 12 MeSH classes with an accuracy of over
, as shown in
Table 3 under the GCN Val column. The good performance of the model is further evidenced in
Figure 4f, where we can see 12 clusters representing the 12 MeSH classes emerging after modeling.
3.2. Single Label Classification Results on Test Data
This section provides results showing the performance of our single label classification models on the test dataset.
From the results shown in the confusion matrices of
Figure 5, we can see that our models yield good results on the test data as well. Results of the three-task subgroup, which are presented in
Figure 5a, indicate that central nervous system agents were predicted more correctly
than the other two classes. Akin to the cross validation results, cardiovascular agents were the least well predicted
. Overall, the performance of the model on test data is comparable to that obtained from cross validation in this task subgroup. As an example, the test accuracy for this task is about
, as shown in
Table 3 (under the GCN Test column), compared to a validation accuracy of
(under the GCN Val column).
Figure 6a shows the distribution of the data that was used for testing in the three-task subgroup. It is observed that the drugs in each class are fairly evenly distributed on both axes without any conspicuous outliers, but there are many more antineoplastic agents (342) as there are cardiovascular (152) and central nervous system (176) agents. After passing this data into our model, the model classifies the drugs into the three MeSH classes and the majority of these appear closer to each other in the 2D space, as shown in
Figure 6b.
Performance results on test data for the 5-task subgroup are analogous with those obtained from cross validation. From
Table 3, under the GCN Val and GCN Test columns, the accuracy in both cases is about
. Moreover, checking on the confusion matrices of
Figure 3b and
Figure 5b, it is observed that
of CNS agents were correctly predicted in both cases, cardiovascular agents achieved 81 and
, respectively, whereas anti-infective agents registered 93 and
. Antineoplastic agents achieved 87 and
, in that order, while gastrointestinal agents recorded 73 and
.
Figure 6c reveals that the distribution of the data used for testing was evenly dispersed, but there were big disparities in the number of drugs among the classes. In particular, there were about 776 anti-infective agents in contrast to 46 gastrointestinal agents. This disparity is also well depicted in
Figure 6d, which shows five noticeable MeSH classes in which drugs belonging to each class appear closer to each other after the model correctly classified the majority of the drugs into their respective classes.
In the 12-task subgroup, the respiratory system agents class was perfectly predicted at
, as shown in the confusion matrix of
Figure 5c. This was also the smallest group in the test data with just eight drug compounds. The urological agents were the overall smallest dataset, with 10 drugs in the test set and 26 drug compounds used in cross validation (
Table 1). However, the model correctly predicted
of the test drugs in this class (
Figure 5c).
The overall accuracy on test data for this task is comparable to that obtained from cross validation. From
Table 3, the accuracy in either case is about
.
Figure 6e shows the distribution of the data that was used for testing. It is clear that there are many more anti-infective agents (776) than the other classes. However, the drug compounds are fairly evenly distributed along both axes. Results of distribution of the same data after passing it through our model are provided in
Figure 6f, where the majority of drugs belonging to each MeSH class are in close proximity in the 2D space as evidence of the model’s ability to classify them into the 12 MeSH classes.
3.3. Multi-Label Classification Results on Validation and Test Data
In this section, we explore the capacity of the model to predict whether a drug belongs to more therapeutic-use classes. This provides us with an opportunity to learn from the undetermined predictions that these models make so that we can act accordingly in case some drugs could be fit for repurposing.
A total of 8336 molecules were present in one or more MeSH classes compared with 6995 molecules which belonged to a single MeSH therapeutic-use class only. This represents an average of 1.2 MeSH class labels for each molecule. On the other hand, the test dataset contained 4610 drug molecules belonging to one or more MeSH classes and 1698 molecules which belonged to one MeSH class only, representing an average of 2.7 MeSH class labels for each molecule.
Metrics’ results for multi-label classification on validation and test data are presented in
Table 4. Here, too, our model performs better than IMG + CNN. In particular, the
score, which was around
when using IMG + CNN, rose to over
when our GCN base model was used.
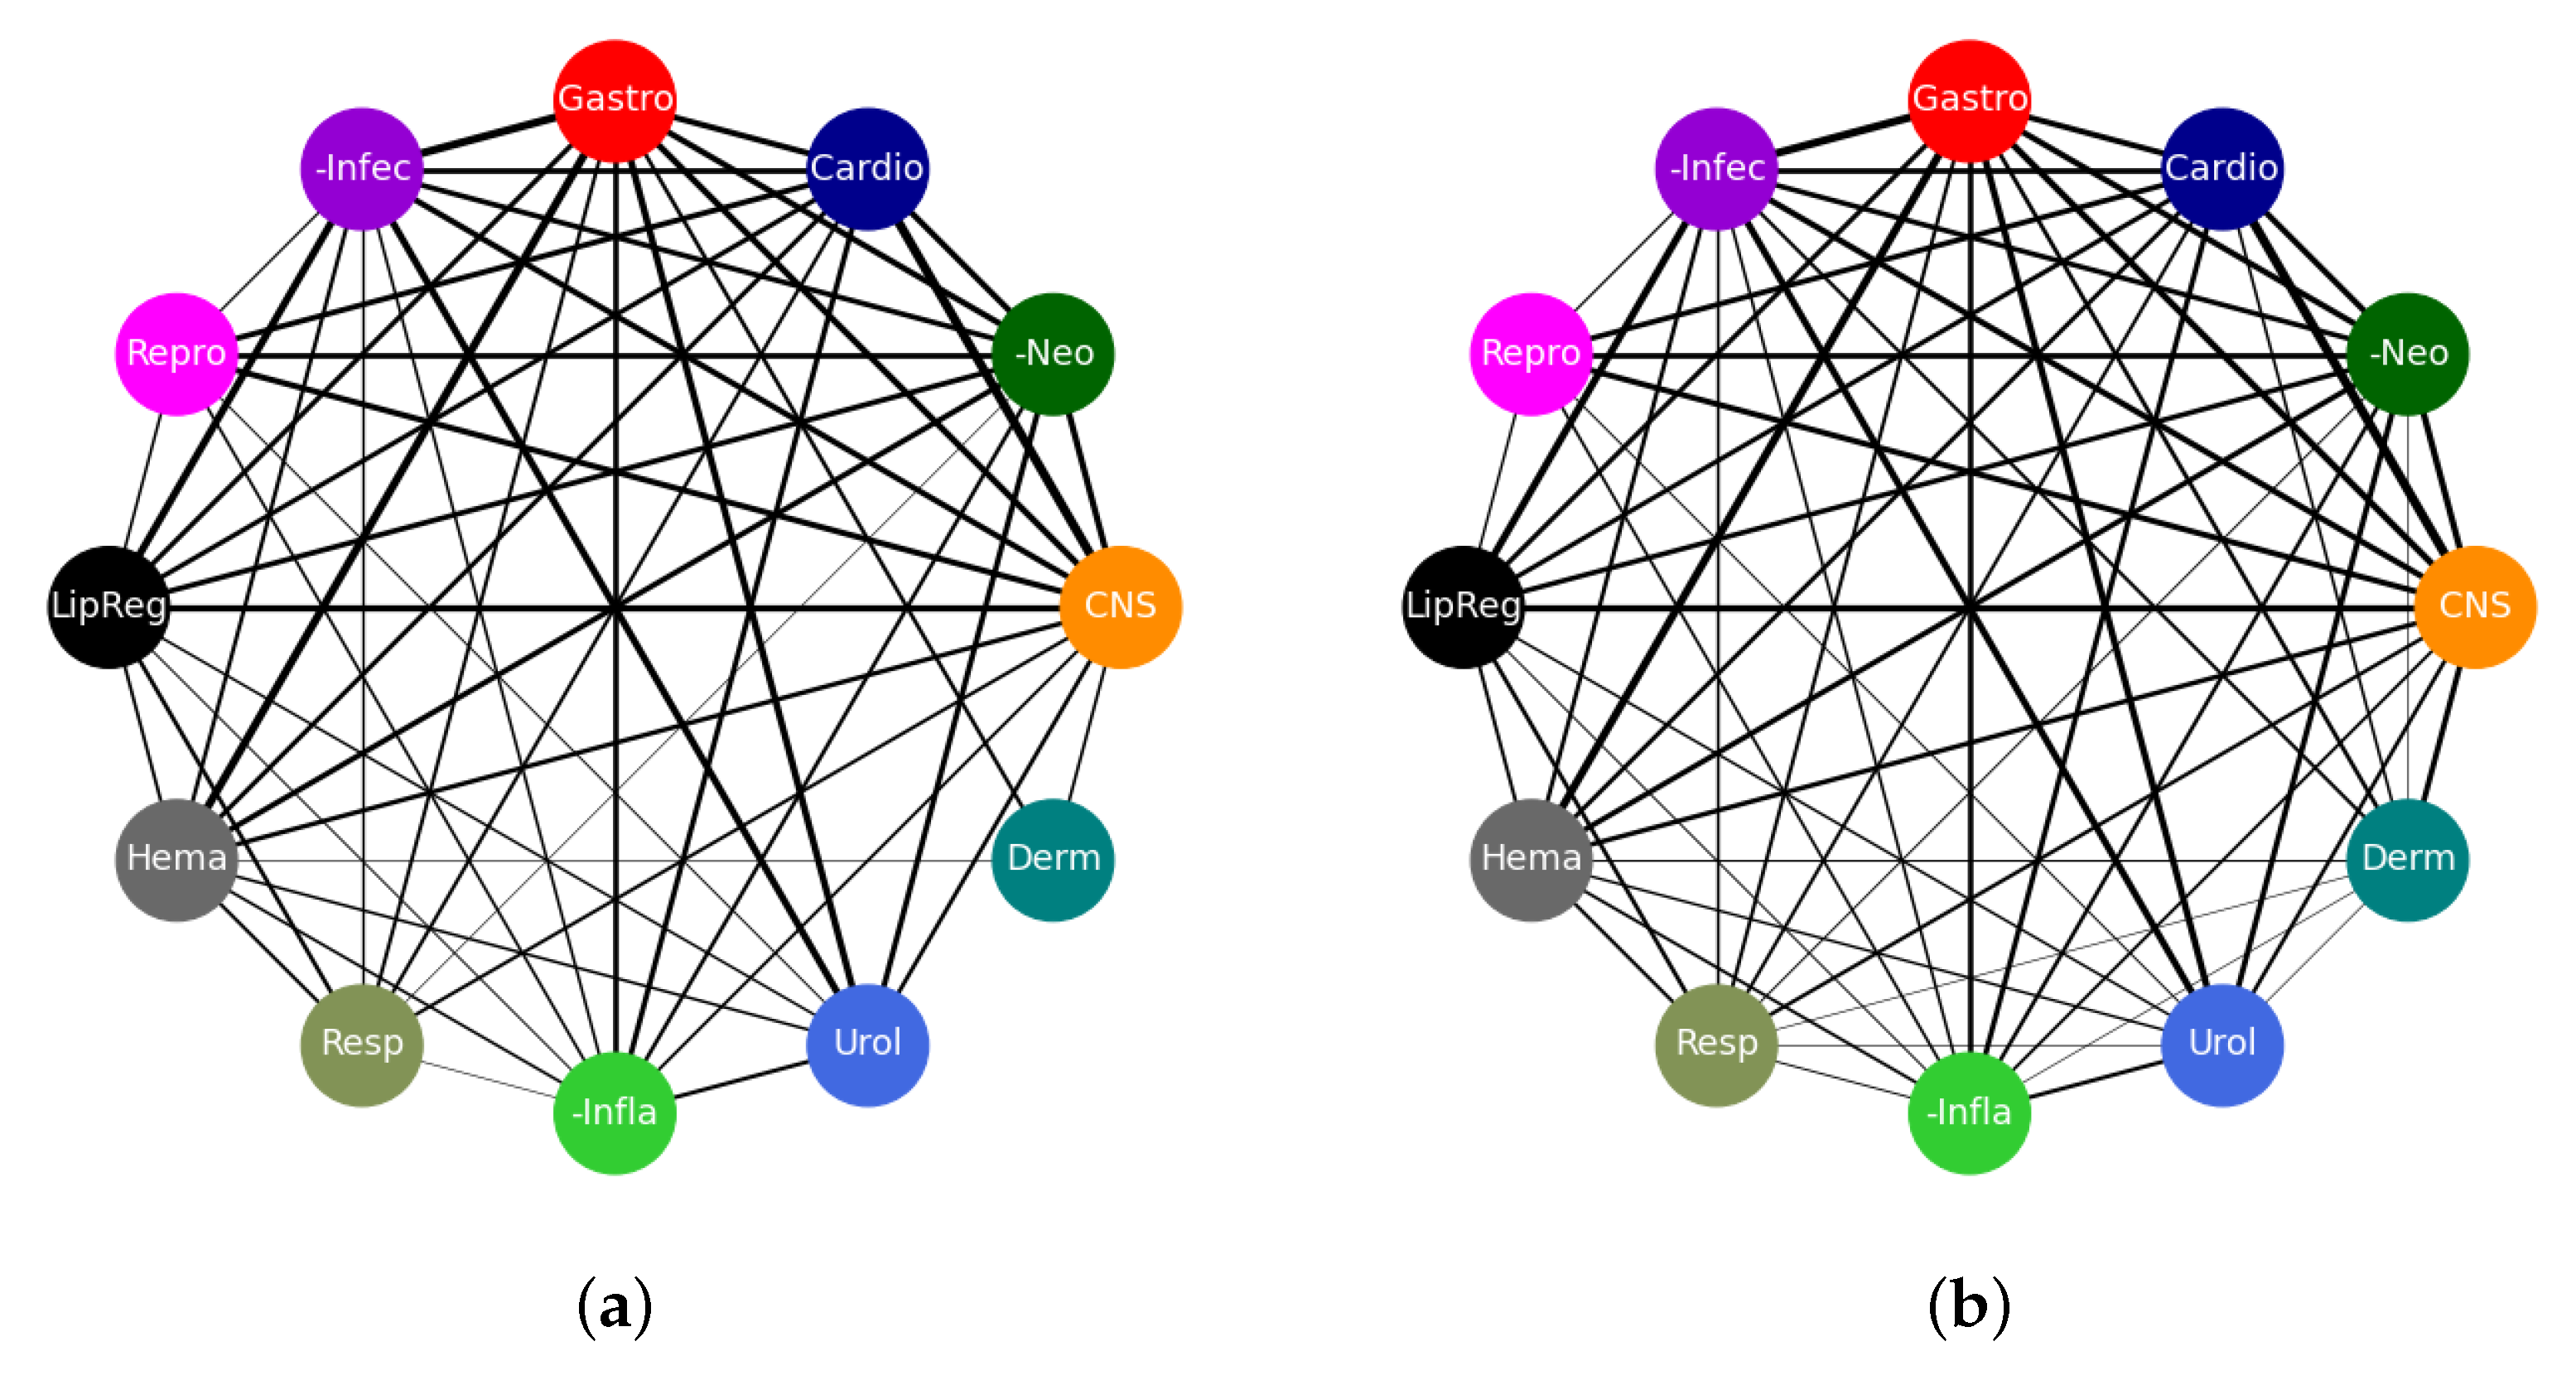
These good results are also reflected in the connectivity diagrams shown in
Figure 7. In these diagrams, a single edge represents a drug that belongs to the two classes to which that edge is attached. Thicker edges represent more drugs on that edge and, conversely, thinner edges represent fewer drugs that belong to the two connected classes. No connection between nodes means that there are no drugs that belong to both concerned nodes. The width,
w, of each edge was computed using
where
N is the number of co-occurrences of nodes on each edge. The network of
Figure 7a represents the true connections as dictated by the true class labels while the one in
Figure 7b shows a network of predictions by our model. In total, there are 4610 edges in each of the networks. A total of 4210 edges are exactly the same while 400 edges appear in one network but not the other. This shows that our model has made a majority of the predictions accurately which is in line with the results in
Table 4. The edges that appear in
Figure 7a, but not in
Figure 7b, have been thought of as those the model has failed to learn, whereas those that appear in
Figure 7b only have been considered to be areas where the model may have learnt something new and we need to verify if that is the case. This is also one area where drug candidates for repurposing could be found.
3.4. Drug Repurposing Opportunities
While it is paramount to make sure the model classifies the drugs accurately, it is also important to pay particular attention to cases where the model makes some misclassifications. In general, we tend to consider such misclassifications as an indication that the model has not learnt enough about the data. However, in some cases, it could be an indication that the model has learnt something new about the data. Such cases require that we verify the model’s results using alternative approaches. In this situation, we are going to check the literature for evidence of the predictions that the model has made but do not tally with those given in the dataset.
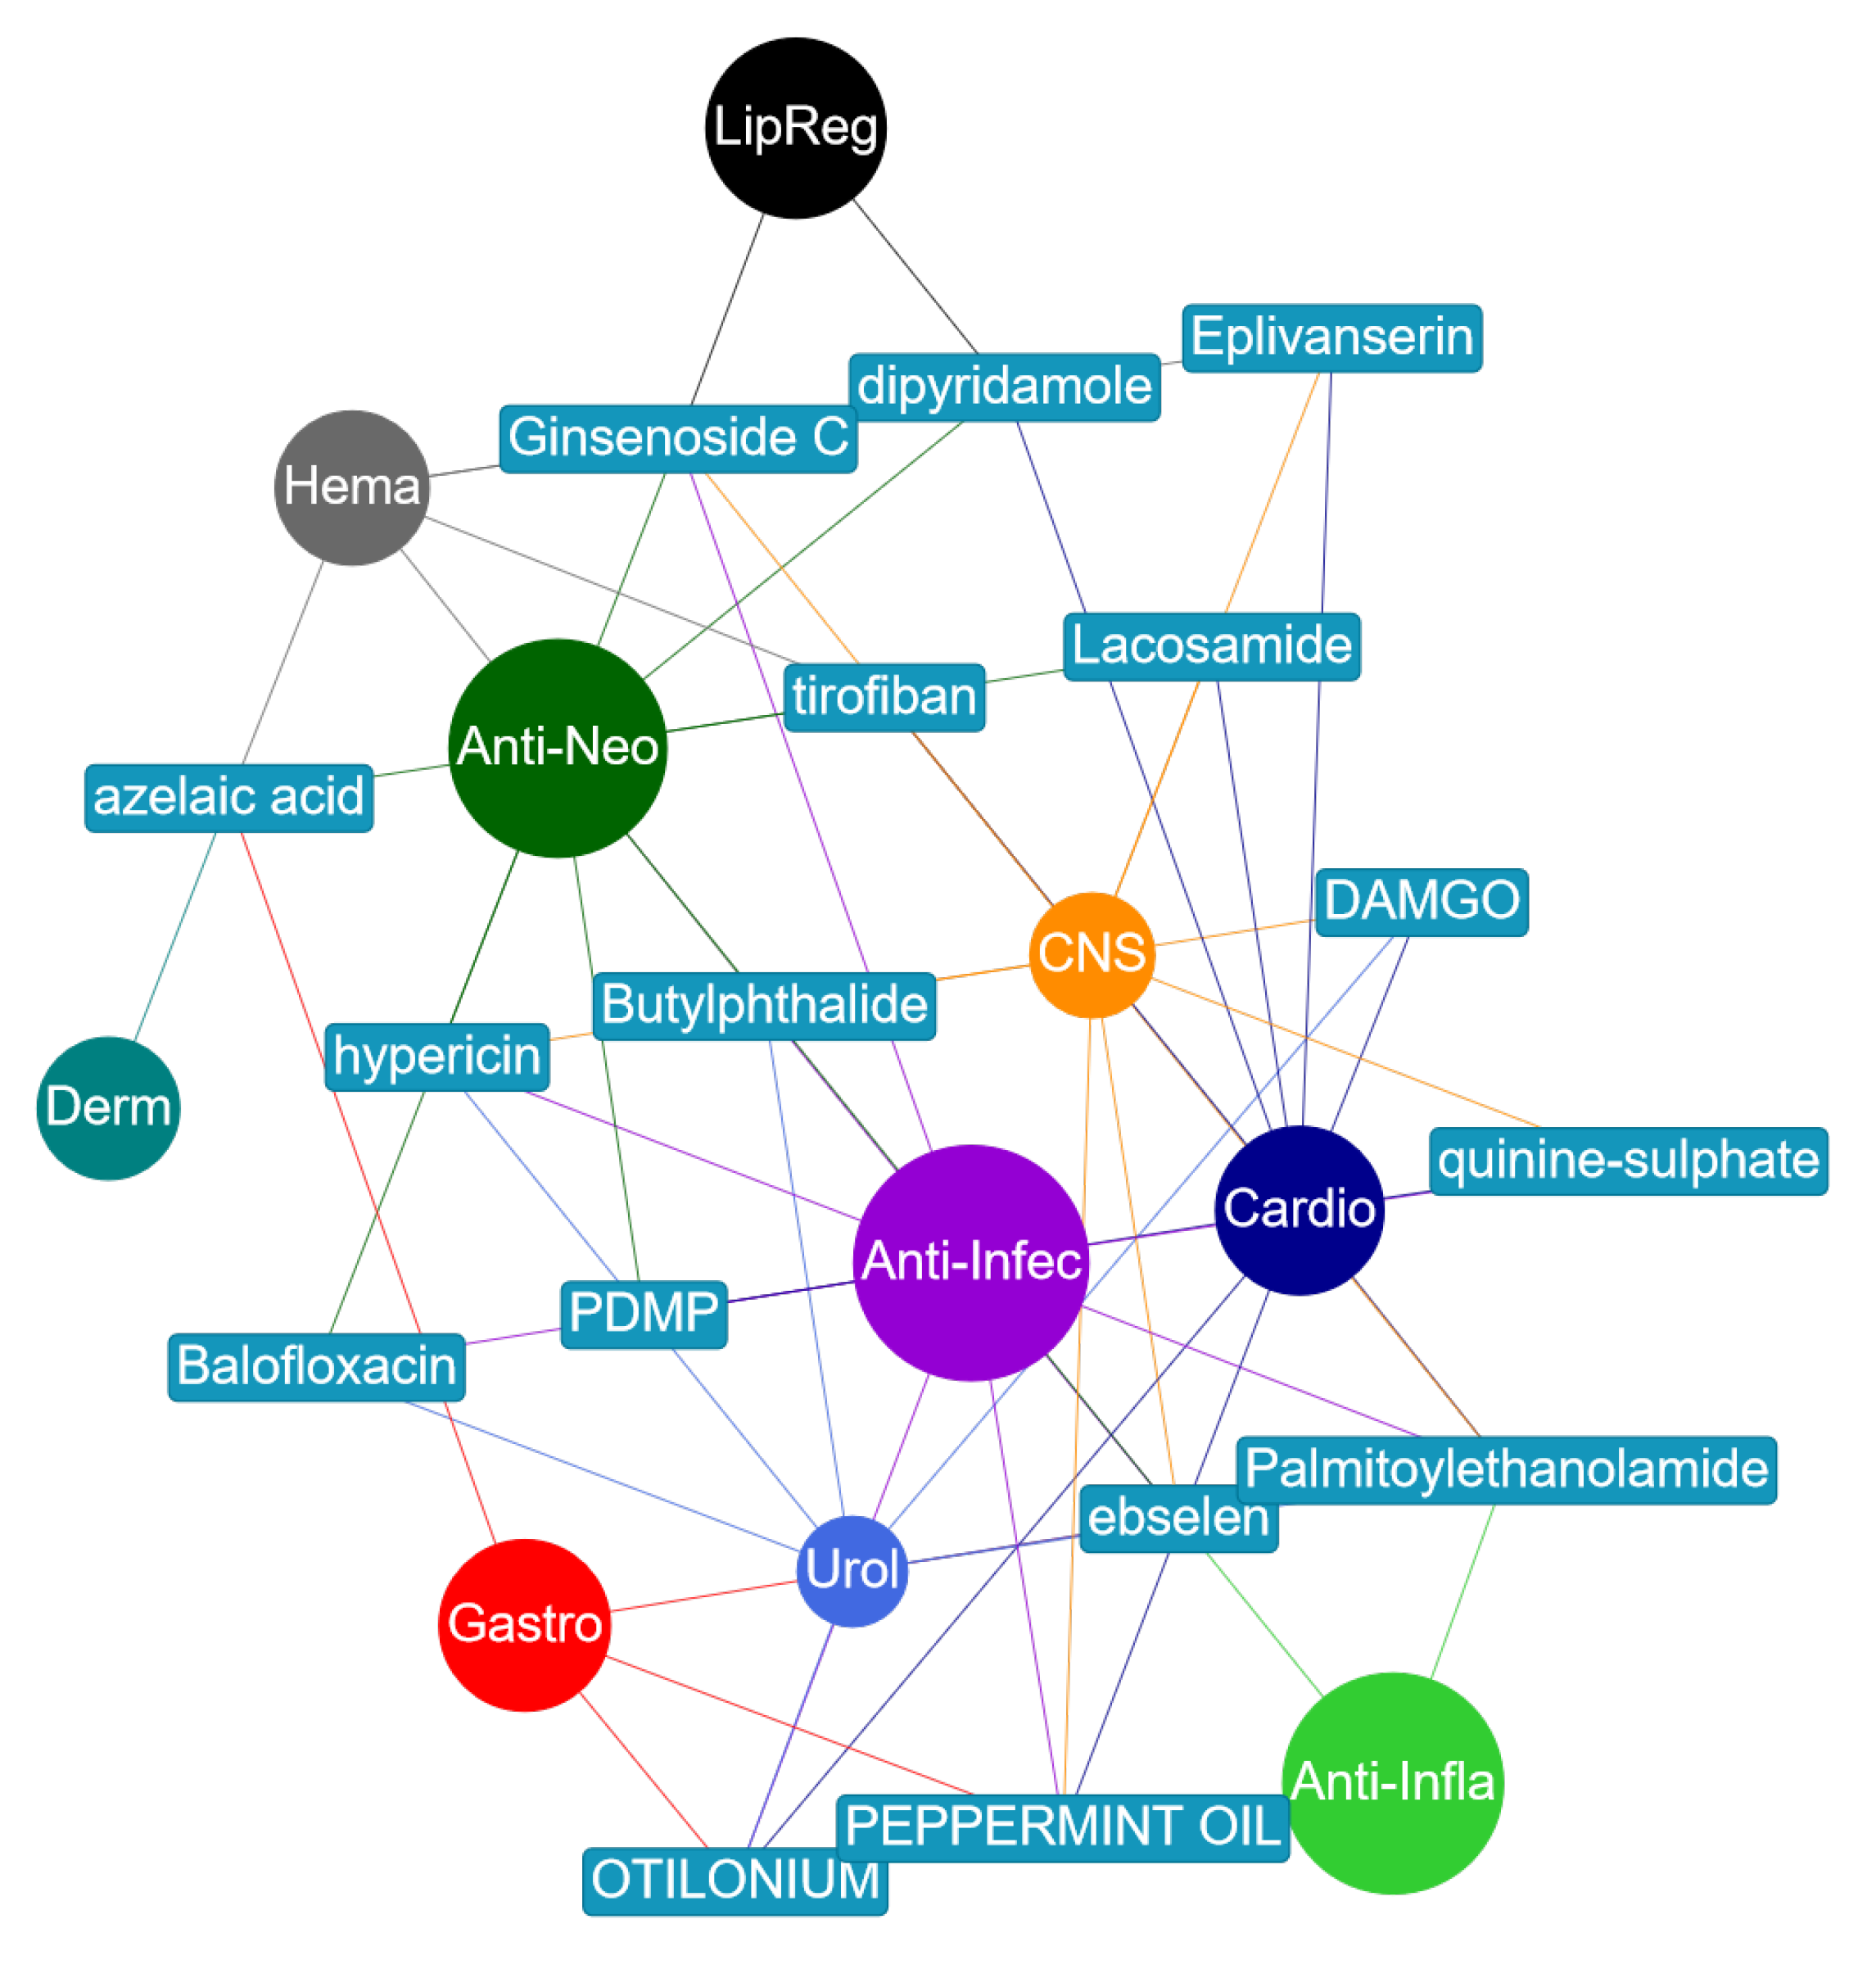
Figure 8 shows a small network of the drugs that were misclassified but have evidence in literature backing those predictions to be true. This information is also provided in
Table 5 where citations to literature that provides the evidence have been made.
For example, ginsenoside Rb2 was given as an antineoplastic and a lipid regulating agent. However, the model predicted that it was an anti-infective and a CNS agent. This compound, also known as ginsenoside C, is a ginsenoside found in
Panax ginseng. It is indicted on the Chemical Entities of Biological Interest (ChEBI) [
31] website, stub CHEBI:77152, that the compound has a role as an antiviral agent which confirms that it is an anti-infective agent. As regards the compound being a CNS agent, it was reported in [
32] that ginsenoside Rb2 greatly activated Cu,Zn-superoxide dismutase gene (SOD1) through transcription factor AP2 binding sites. SOD1 is one of the major antioxidant enzymes and its presence significantly delayed the onset of signs of motor impairment and prolonged the survival of mice suffering from Amyotrophic Lateral Sclerosis (ALS). ALS is a progressive neurodegenerative disease characterized by degeneration of motoneurons in the spinal anterior horn.
Similarly, Balofloxacin was given as an antineoplastic and anti-infective agent. The model predicted that it is also a urological agent. In [
34], Balofloxacin was found to be effective in
and
of patients with complicated urinary tract infection (UTI) assessed by the physician’s evaluations and Japanese UTI criteria, respectively.
Dipyridamole (DIP) was given as a cardiovascular and hematological agent. In a reverse screening approach to identify potential anti-cancer (antineoplastic) targets of DIP, it was noted in [
35] that DIP can increase the anti-cancer drug (5-fluorouracil, methotrexate, piperidine, vincristine) concentration in cancer cells and hence enhance the efficacy of treatment of cancer. This is in line with the model’s prediction of DIP being a potential antineoplastic agent. Furthermore, there are reported (in vitro and in vivo) results in [
36] which demonstrate that the suppression of HMGCS1 (3-hydroxy-3-methylglutaryl-CoA synthase 1) by siRNA and dipyridamole enhances the antitumor properties of trametinib in colon cancer cells. The work presented in [
37] reported that DIP inhibits lipogenic gene expression by retaining SCAP-SREBP in the endoplasmic reticulum. This is consistent with both predictions about DIP being a prospective antineoplastic and lipid regulating agent.
Likewise, hypericin was given as an anti-infective, antineoplastic, and CNS agent. The model predicted that it is also urological. Reports in [
38,
39,
40] indicate that it has been used in urological medicine as a photo diagnostic to detect non-muscle-invasive bladder cancer lesions.
Lacosamide was given as a cardiovascular and a CNS agent. The model predicted that it is also antineoplastic. This was confirmed in [
41], where results of in vitro antineoplastic effects of brivaracetam and lacosamide on human glioma cells were reported. It was further reported in [
42,
43] that lacosamide, when added to any baseline anti-epileptic drug, is effective in obtaining a high seizure reduction and seizure freedom, regardless of the tumor activity and response to antineoplastic therapies.
Further, otilonium bromide was provided as a cardiovascular and a gastrointestinal agent. However, the model predicted that it is an anti-infective and a urological agent. Recent results presented in [
44] indicate the drug could be a new antimicrobial agent to treat
Staphylococcus aureus infections more safely and efficiently. Information about it being urological has not been found yet.
Palmitoylethanolamide (PEA) was given as an anti-infective, an anti-inflammatory, and a CNS agent. The model predicted it as also being a cardiovascular agent. It was reported in [
45] that PEA evokes potent anti-inflammatory effects in cultured macrophages which translates under in vivo conditions into a strong atheroprotective effect. In addition, based on the clinical studies for testing PEA to treat pain and inflammation that were going on at the time, PEA was thought to be an interesting novel therapeutic drug for patients with cardiovascular disease. Similarly, research results reported in [
46] indicate that PEA combined to polydatin protects against cardio and vasculotoxicity of doxorubicin by promoting an anti-inflammatory phenotype, representing a new therapeutic approach to resolve doxorubicin-induced cardiotoxicity and inflammation. We have not yet found information that confirms whether PEA could be a urological agent.
Peppermint oil was given as a CNS and a gastrointestinal agent. Results from the work presented in [
47] indicated the strong antibacterial and antioxidant activities of peppermint oil. This is in line with the model’s prediction that the compound is a potential anti-infective agent. In a recent study [
48], it was shown that aromatherapy with peppermint essential oils can improve the sleep quality of cardiac patients and was recommended for cardiac patients as a non-pharmacological intervention. This agrees with the model’s prediction of it being a cardiovascular agent.
Finally, tirofiban was given as a cardiovascular and a hematologic agent. The model predicted it as a CNS and an antineoplastic agent. Tirofiban has been reported to constrain tumor cell invasive potential in HSC-3 human tongue squamous cell line [
49,
50]. It has also been reported that low-dose tirofiban treatment improves neurological deterioration outcome after intravenous thrombolysis [
51]. This is in line with the model’s second prediction that this compound could also be a CNS agent.


