Article

Evaluation of Ruthenium-Based Assemblies as Carriers of Photosensitizers to Treat Rheumatoid Arthritis by Photodynamic Therapy

by
Manuel Gallardo-Villagrán
1,2,
Lucie Paulus
2,
Jean-Louis Charissoux
3,
Sylvain Sutour
4,
Pascale Vergne-Salle
5,
David Yannick Leger
2,
Bertrand Liagre
2,*,† and
Bruno Therrien
1,*,†
1
Institut de Chimie, Université de Neuchâtel, Avenue de Bellevaux 51, CH-2000 Neuchâtel, Switzerland
2
Laboratoire PEIRENE EA 7500, Faculté de Pharmacie, Université de Limoges, 87025 Limoges, France
3
Service d’Orthopédie-Traumatologie, CHRU Dupuytren, 2 Avenue Martin Luther King, CEDEX, 87042 Limoges, France
4
Neuchâtel Platform for Analytical Chemistry (NPAC), University of Neuchâtel, Avenue de Bellevaux 51, CH-2000 Neuchâtel, Switzerland
5
Service de Rhumatologie, CHRU Dupuytren 2, 16 rue Bernard Descottes, CEDEX, 87042 Limoges, France
*
Authors to whom correspondence should be addressed.
These authors contributed equally to the work.
Pharmaceutics 2021, 13(12), 2104; https://doi.org/10.3390/pharmaceutics13122104
Submission received: 1 November 2021 / Revised: 22 November 2021 / Accepted: 3 December 2021 / Published: 7 December 2021

Abstract

:
For the first time, ruthenium-based assemblies have been used as carriers for photosensitizers in the treatment of rheumatoid arthritis by photodynamic therapy (PDT). These metallacages are totally soluble in physiological media and can transport photosensitizers (PS) in their cavity. After an incubation period, the PS is released in the cytoplasm and irradiation can take place. This strategy allows photosensitizers with low or null solubility in biological media to be evaluated as PDT agents in rheumatoid arthritis. The systems in which 21H,23H-porphine and 29H,31H-phthalocyanine are encapsulated show excellent photocytotoxicity and no toxicity in the dark. On the other hand, systems in which metalated derivatives such as Mg(II)-porphine and Zn(II)-phthalocyanine are used show good photocytotoxicity, but to a lesser extent than the previous two. Furthermore, the presence of Zn(II)-phthalocyanine significantly increases the toxicity of the system. Overall, fifteen different host–guest systems have been evaluated, and based on the results obtained, they show high potential for treating rheumatoid arthritis by PDT.

Graphical Abstract

1. Introduction

Rheumatoid arthritis (RA) is a chronic inflammatory autoimmune joint disease, leading to cartilage and bone damage, and finally disability. Occasionally, RA is complicated with extra-articular manifestations, particularly pulmonary involvement, and is associated with cardiovascular comorbidities [1]. The prevalence is 0.3% to 1%, and is 2–3 times higher in women than in men [2].
In recent years, it has become evident that RA arises based on both genetic and epigenetic components, but also has an environmental component, such as cigarette smoke, dust exposure, and particularly the effect of the microbiome [3]. Abnormalities in the cellular and humoral immune response lead to the occurrence of autoantibodies, detected many months or years before the clinical disease is apparent. These autoantibodies are rheumatoid factors (directed against the Fc fragment of immunoglobulins) and anti-citrullinated protein antibodies (ACPA) [4,5].
In RA, the synovial lining, which normally is comprised of 1–3 cell layers, becomes remarkably thickened. This is due to an invasion of macrophage-like cells and the proliferation of resident synovial fibroblasts. The degree of synovial hyperplasia correlates with the severity of cartilage erosion, resulting in inflammatory pannus formation that attaches to, and invades, joint cartilage, while osteoclast activation leads to parallel bone destruction [6]. The interaction between synovial resident cells and cells of the innate and adaptative immune system leads to the production of many pro-inflammatory cytokines (TNF-α, interleukine-1 (IL-1), IL-6), proteolytic enzymes, and inflammatory molecules [1].
Treatment algorithms involve measuring disease activity with composite indices and applying a treatment-to-target strategy, with disease modifying antirheumatic drugs (DMARDs) to maintain stringent remission or at least low disease activity and reduce articular destruction and disability [7]. There are two major classes of DMARDs, namely synthetic (sDMARDs) and biological (bDMARDs) [8].
Despite all of the advances made over the last two decades, and given that remission or at least low disease activity are the current therapeutic goals for RA patients, a significant proportion of patients still do not reach this target. There is a need for new treatments or local treatments to control some resistant synovitis.
In recent years, promising results have been achieved using non-invasive treatments such as anti-tumor necrosis factor drugs [9], Janus kinase inhibitors [10], and photodynamic therapy (PDT) [11]. The latter involves a photoactive compound, termed the photosensitizer (PS), which is excited by suitable light radiation. Subsequently, the excitation energy gives rise to radical oxygen species (ROS) from oxygen present in the medium [12,13]. ROS show a high cytotoxicity, but also a short lifetime and reduced radius of action [14], so it is possible to treat the inflamed zone without affecting the surrounding tissue, avoiding damage to healthy structures. Accordingly, PDT could be an effective solution for cases of RA with refractory synovitis and failure of local steroid injection.
Since the late 1990s, PDT began to demonstrate its potential as a less invasive treatment for RA. Trauner and colleagues [15] reported the in vivo efficacy of this technique in rabbits with an antigen-induced arthritis model, using benzoporphyrin derivative monoacid ring A (one of the first-generation PSs) and intra-articular irradiation. Later, with the new generation PSs, in vivo results remained promising, such as the use of ATX-S10.Na (II) in collagen antibody-induced arthritis in mice [16]. Recently, it has been reported that the combined use of photothermal therapy and PDT using Cu7.2S4 nanoparticles under NIR laser in mice, improves anti-inflammatory effects and reduces cartilage and bone damage [17].
The simplicity of the technique makes PDT an ideal treatment to alleviate the pain or disability caused by RA. Unfortunately, even considering the enormous potential of PDT, conventional PSs often have some drawbacks mainly related to their chemical and structural features, as well as undesirable side effects in some cases, such as light hypersensitivity [18]. Most recent studies have focused on solving the poor solubility of PSs in biological media using soluble carriers [19] such as nanoparticles or by adding a soluble functional group in the PS structure [20]. We believe that it may be possible to solve the poor water solubility of PSs using another approach: ruthenium-based carriers (Figure 1). These organometallic complexes are soluble in biological media and have an inner cavity in which a PS can be lodged. Such metallacages have already been tested in vitro on cancer cells, demonstrating their potential in cells [21,22].
For the first time, we showed that such carriers can be used as PDT agents in fibroblast-like synoviocyte cells (FLS) from RA patients. We also demonstrated that commercially available PSs (Figure 2), namely 21H,23H-porphine (G1), Mg(II)-porphine (G2), 29H,31H-phthalocyanine (G3), and zinc(II)-phthalocyanine (G4), can be encapsulated in the cavity of the metallacages and, after being released, become effective PSs against RA. We have hosted these basic PSs in different ruthenium-based assemblies, showing the importance of the carrier in delivering the PS. The in vitro evaluation of these PS-metallacages in human RA FLS cells is promising. The anti-proliferative assays are excellent, providing new avenues for the treatment of RA by PDT.

2. Materials and Methods

2.1. Synthesis of Compounds

Despite the fact that the hosts M1-M6 (Figure 3) and the guests G1-G4 are known, several host–guest systems are new, except for G1M2, G1M3, G2M1, G2M4, and G2M6. The complexes [Ru2(p-cymene)2(2,5-dioxydo-1,4-benzoquinonato)Cl2], [Ru2(p-cymene)2(5,8-dioxydo-1,4-naphthoquinonato)Cl2], [Ru2(p-cymene)2(6,11-dioxydo-5,12-naphthacenedionato)Cl2] [23], and the ligands 2,4,6-tris(pyridin-4-yl)-1,3,5-triazine [24], 1,3,5-tris{2-(pyridin-4-yl)vinyl} benzene [25], and 1,2,4,5-tetrakis{2-(pyridine-4-yl)vinyl} benzene [26] were prepared following reported methods. The metallacages M1 and M4 with G1 inside [21], M4 with G3 and G4, M5 and M6 with G1, G3, and G4 [27] were synthesized according to the literature. The photosensitizers G1 and G2 were synthesized as reported in the literature [28], while G3 and G4 were bought from Sigma-Aldrich. Dichloromethane, diethyl ether, methanol, d3-acetonitrile, and d6-DMSO were purchased from Sigma-Aldrich and used as received. NMR spectra were measured on a Bruker Avance Neo Ascend 600 MHz spectrometer. The acquired spectra were processed using the Mnova NMR software package (v.14.2.0, MestReLab Research, Santiago de Compostela, Spain). The 1H and 13C resonances of the deuterated solvents were used as internal references. The following abbreviations are used for describing the signals in the NMR spectra: s (singlet), d (doublet), m (multiplet), br (broad), q (quaternary). All described in vitro experiments were carried out under aseptic conditions. 3-(4,5-Dimethylthiazol-2-yl)-2,5-diphenyltetrazolium bromide (MTT) and L-glutamine were purchased from Sigma-Aldrich (St. Louis, MO, USA). Dimethyl sulfoxide (DMSO) was bought from Acros Organics (Geel, Belgium). All solvents, reagents, and products described above were used without prior treatments or purifications. IR spectra of the compounds were performed on a Frontier Perkin Elmer spectrometer (600–4000 cm−1), Thermo Fisher Scientific, Waltham, MA, USA. Fluorescence spectra were performed on a FLS980 spectrometer from Edinburgh instruments (550–800 nm) using 5,10,15,20-tetraphenylporphin (TPP) as an internal reference in toluene and the compounds were dissolved in DMSO (10 nM concentration). UV-vis spectra were acquired on a SI Analytics model UvLine 9400 (Xenon lamp) spectrophotometer, using 1.5 mL polystyrene cuvettes (wavelength range 280–800 nm) and diluting the compounds in DMSO (10 µM and 10 nM).
Synthesis of G1M2. In a 250 mL round bottom flask, 50.0 mg (0.069 mmol) of [Ru2(p-cymene)2(5,8-dioxydo-1,4-naphthoquinonato)Cl2] and 35.5 mg (0.138 mmol) of AgCF3SO3 were dissolved in 20 mL of MeOH and stirred for 2 h at room temperature. Next, silver chloride was filtered off. To the remaining solution, 14.6 mg (0.046 mmol) of 2,4,6-tri(pyridin-4-yl)-1,3,5-triazine and 7.1 mg (0.023 mmol) of G1 were added, and the solution was refluxed and stirred for 18 h. The solvent was then removed at reduced pressure, and the resulting oily, dark green solid was dissolved in 20 mL of CH2Cl2. The solution was concentrated to approximately 3 mL, and 5 mL of Et2O was added dropwise. The resulting precipitate was filtered and dried under vacuum. Yield 52% (45 mg). 1H NMR (CD3CN, 25 °C, 600 MHz): δ 9.17 (d, 3JHH = 6.0 Hz, 12H, CHnaphce), 8.44 (d, 3JHH = 4.1 Hz, 12H, CHnaphce), 8.24 (d, 3JHH = 6.3 Hz, 12H, CHpy), 8.00 (s, 4H, CHporphine), 6.89 (s, 8H, CHporphine), 5.91 (d, 3JHH = 6.4 Hz, 12H, CHpy), 5.87 (d, 3JHH = 5.9 Hz, 12H, CHcym), 5.57 (d, 3JHH = 5.8 Hz, 12H, CHcym), 2.95 (m, 6H, CHiPr), 1.97 (overlapped singlet, 18H, CH3), 1.32 (d, 3JHH = 7.0 Hz, 36H, CH3 iPr). 13C NMR (CD3CN, 25 °C, 150 MHz): δ 170.4 (C-O), 164.3 (Cq), 152.1 (CHpy), 140.7 (Cq), 134.6 (CHnaphce), 130.1 (CHporph), 128.4 (CHnaphce), 122.8 (Cq), 122.3 (CHpy), 120.7 (Cq), 107.9 (Cq), 104.4 (Ccym), 103.3 (CHporph), 100.3 (Ccym), 84.9 (CHcym), 83.0 (CHcym), 31.0 (CHiPr), 22.0 (CH3 iPr), 17.3 (CH3). ESI-MS, m/z, 1120 [M2+G1-3OTf]3+. UV/vis (DMSO), λ, nm (ε, M−1·cm−1): 454 (132400), 488 (117700), 567 (54300), 648 (62900). FT-IR (ATR, solid, cm−1): ν; br s (3700–3100), s (2995), s (1524), s (1516). Spectra in Supplementary Materials (Figures S1–S9).
Synthesis of G1M3. In a 250 mL round bottom flask, 50.0 mg (0.060 mmol) of [Ru2(p-cymene)2(6,11-dioxydo-5,12-naphthacenedionato)Cl2] and 31.0 mg (0.120 mmol) of AgCF3SO3 were dissolved in 20 mL of MeOH and stirred for 2 h at room temperature. Next, silver chloride was filtered off. To the remaining solution, 12.5 mg (0.040 mmol) of 2,4,6-tri(pyridine-4-yl)-1,3,5-triazine and 6.2 mg (0.020 mmol) of G1 were added, and the solution was refluxed and stirred for 18 h. The solvent was then removed at reduced pressure, and the resulting oily, dark green solid was dissolved in 20 mL of CH2Cl2. The solution was concentrated to approximately 3 mL, and 5 mL of Et2O was added dropwise. The resulting precipitate was filtered and dried under vacuum. Yield 76% (62 mg). 1H NMR (CD3CN, 25 °C, 600 MHz): δ 8.68 (s, 4H, CHporphine), 8.21 (d, 3JHH = 6.3 Hz, 12H, CHpy), 7.92 (s, 12H, CHnaph), 7.71 (s, 8H, CHporphine), 6.12 (d, 3JHH = 5.7 Hz, 12H, CHpy), 5.68 (d, 3JHH = 5.8 Hz, 12H, CHcym), 5.43 (d, 3JHH = 5.9 Hz, 12H, CHcym), 2.84 (m, 3JHH = 6.8 Hz, 6H, CHiPr), 1.99 (s, 18H, CH3), 1.33 (d, 3JHH = 6.9 Hz, 36H, CH3 iPr). 13C NMR (CD3CN, 25 °C, 150 MHz): δ 171.9 (C-O), 164.5 (Cq), 152.3 (CHpy), 140.9 (Cq), 138.9 (CHnaph), 130.9 (CHporph), 124.9 (Cq), 122.8 (CHpy), 122.5 (CHpy), 120.7 (Cq), 112.5 (Cq), 104.4 (Ccym), 103.9 (CHporph), 100.3 (Ccym), 85.0 (CHcym), 83.7 (CHcym), 31.0 (CHiPr), 21.9 (CH3 iPr), 16.8 (CH3). UV/vis (DMSO), λ, nm (ε, M−1·cm−1): 489 (53700), 573 (40200), 623 (62900). FT-IR (ATR, solid, cm−1): ν; br s (3700–3100), br s (3092), s (2992), s (2915), s (1531), s (1502). Spectra in Supplementary Materials (Figures S10–S17).
Synthesis of G2M1. In a 250 mL round bottom flask, 50 mg (0.074 mmol) of [Ru2(p-cymene)2(2,5-dioxydo-1,4-benzoquinonato)Cl2] and 37.8 (0.148 mmol) mg of AgCF3SO3 were dissolved in 20 mL of MeOH and stirred for 2 h at room temperature. Next, silver chloride was filtered off. To the remaining solution, 15.4 mg (0.049 mmol) of 2,4,6-tri(pyridin-4-yl)-1,3,5-triazine and 8.1 mg (0.025 mmol) of G2 were added, and the solution was refluxed and stirred for 18 h. The solvent was then removed at reduced pressure, and the resulting oily, dark green solid was dissolved in 20 mL of CH2Cl2. The solution was concentrated to approximately 3 mL, and 5 mL of Et2O was added dropwise. The resulting precipitate was filtered and dried under vacuum. Yield 64% (59 mg). 1H NMR (DMSO-d6, 25 °C, 600 MHz): δ 10.42 (s, 4H, CHMg-porphine), 9.61 (s, 8H, CHMg-porphine), 8.57 (m, 24H, CHpy), 5.62 (d, 3JHH = 6.1 Hz, 12H, CHcym), 5.98 (d, 3JHH = 6.1 Hz, 12H, CHcym), 5.91 (s, 6H, CHbz), 2.82 (m, 6H, CHiPr), 2.08 (s, 18H, CH3), 1.28 (d, 3JHH = 6.9 Hz, 36H, CH3 iPr). 13C NMR (DMSO-d6, 25 °C, 150 MHz): δ 184.1 (C-O), 169.4 (Cq), 154.5 (CHpy), 149.3 (Cq), 144.6 (Cq), 132.7 (CHMg-porphine), 129.2 (Cq), 126.5 (Cq), 124.8 (CHpy), 122.2 (Cq), 120.0 (Cq), 105.9 (CHMg-porphine), 103.8 (Ccym), 101.8 (CHbz), 99.7 (Ccym), 84.1 (CHcym), 81.9 (CHcym), 31.1 (CHiPr), 22.4 (CH3 iPr), 17.9 (CH3). Elemental analysis: Calcd. For C140H126F18MgN16O30Ru6S6 + 6H2O: C, 44.42; H, 3.67; N, 5.92. Found: C, 45.23; H, 4.08; N, 6.09. ESI-MS, m/z, 770 [M1+G2-4OTf]4+. UV/vis (DMSO), λ, nm (ε, M−1·cm−1): 500 (140700), 535 (130400). FT-IR (ATR, solid, cm−1): ν; s (3093), s (2977), s (2911), s (2804), s (1508). Spectra in Supplementary Materials (Figures S18–S26).
Synthesis of G2M4. In a 250 mL round bottom flask, 50 mg (0.069 mmol) of [Ru2(p-cymene)2(5,8-dioxydo-1,4-naphthoquinonato)Cl2] and 35.5 mg (0.138 mmol) of AgCF3SO3 were dissolved in 20 mL of MeOH and stirred for 2 h at room temperature. Next, silver chloride was filtered off. To the remaining solution, 16.81 mg (0.034 mmol) of 1,2,4,5-tetrakis{2-(pyridine-4-yl)vinyl} benzene and 5.7 mg (0.017 mmol) of G2 were added, and the solution was refluxed and stirred for 18 h. The solvent was then removed at reduced pressure, and the resulting oily, dark green solid was dissolved in 20 mL of CH2Cl2. The solution was concentrated to approximately 3 mL, and 5 mL of Et2O was added dropwise. The resulting precipitate was filtered and dried under vacuum. Yield 59% (52 mg). 1H NMR (CD3CN, 25 °C, 600 MHz): δ 10.02 (s, 4H, CHMg-porphine), 9.13 (s, 8H, CHMg-porphine), 8.18 (d, 3JHH = 5.1 Hz, 16H, CHpy), 7.49 (d, 3JHH = 15.1 Hz, 8H, CH=C), 7.20 (m, 40H, CHnaph, CHpy, CH=C), 6.90 (s, 4H, CHar), 5.60 (d, 3JHH = 4.46 Hz, 16H, CHcym), 5.41 (d, 3JHH = 3.1 Hz, 16H, CHcym), 2.76 (m, 3JHH = 6.9 Hz, 8H, CHiPr), 2.03 (overlapped singlet, 24H, CH3), 1.25 (d, 3JHH = 6.9 Hz, 48H, CH3 iPr). 13C NMR (CD3CN, 25 °C, 150 MHz): δ 171.4 (C-O), 152.3 (CHpy), 149.9 (Cq), 147.7 (Cq), 138.1 (CHpy), 128.6 (CH=C), 127.6 (CH=C), 123.6 (CHnaph), 122.8 (Cq), 112.1 (Cq), 104.1 (Ccym), 99.7 (Ccym), 84.7 (CHcym), 83.7 (CHcym), 31.0 (CHiPr), 21.9 (CH3 iPr), 16.9 (CH3). ESI-MS, m/z, 880 [M4+G2-5OTf]5+. UV/vis (DMSO), λ, nm (ε, M−1·cm−1): 536 (137900), 572 (80300), 610 (64600). FT-IR (ATR, solid, cm−1): ν; s (3089), s (2947), s (2911), s (2861), s (1619), (1554). Spectra in Supplementary Materials (Figures S27–S35).
Synthesis of G2M6. In a 250 mL round bottom flask, 50 mg (0.069 mmol) of [Ru2(p-cymene)2(5,8-dioxydo-1,4-naphthoquinonato)Cl2] and 35.5 mg (0.138) of AgCF3SO3 were dissolved in 20 mL of MeOH and stirred for 2 h at room temperature. Next, silver chloride was filtered off. To the remaining solution, 17.8 mg (0.046 mmol) of panel ligand 1,3,5-tris{2-(pyridin-4-yl)vinyl}benzene and 7.6 mg (0.023 mmol) of G2 were added, and the solution was refluxed and stirred for 18 h. The solvent was then removed at reduced pressure, and the resulting oily, dark green solid was dissolved in 20 mL of CH2Cl2. The solution was concentrated to approximately 3 mL, and 5 mL of Et2O was added dropwise. The resulting precipitate was filtered and dried under vacuum. Yield 61% (56 mg). 1H NMR (CD3CN, 25 °C, 600 MHz): δ 10.29 (s, 4H, CHMg-porphine), 9.41 (s, 8H, CHMg-porphine), 8.57 (d, 3JHH = 5.7 Hz, 12H, CHpy), 7.50 (s, 6H, CHar), 7.33 (d, 3JHH = 5.7 Hz, 12H, CHpy), 7.26 (s, 12H, CHnaph), 7.22 (overlapped doublet, 6H, CH=C), 6.98 (d, 3JHH = 16.1 Hz, 6H, CH=C), 5.69 (d, 3JHH = 5.9 Hz, 12H, CHcym), 5.48 (d, 3JHH = 4.2 Hz, 12H, CHcym), 2.84 (m, 3JHH = 7.0 Hz, 6H, CHiPr), 2.10 (s, 18H, CH3), 1.33 (d, 3JHH = 7.0 Hz, 36H, CH3 iPr). 13C NMR (CD3CN, 25 °C, 150 MHz): δ 171.3 (C-O), 152.3 (CHpy), 147.9 (Cq), 138.0 (CHpy), 137.0 (CHnaph), 135.1 (CHnaph), 132.5 (CHMg-Porphine), 127.4 (CH=C), 125.2 (CH=C), 123.1 (CHar), 120.6 (Cq), 112.0 (Cq), 105.9 (CHMg-porphine), 104.0 (Ccym), 99.7 (Ccym), 84.6 (CHcym), 83.5 (CHcym), 31.0 (CHiPr), 21.9 (CH3 iPr), 16.9 (CH3). Elemental analysis: Calcd. For C170H150F18MgN10O30Ru6S6 + 6CH2Cl2: C, 46.49; H, 3.62; N, 3.06. Found: C, 45.47; H, 3.51; N, 3.88. ESI-MS, m/z, 1177 [M6+G2-3OTf]3+. UV/vis (DMSO), λ, nm (ε, M−1·cm−1): 446 (150800), 536 (110500), 573 (53500), 610 (47100). FT-IR (ATR, solid, cm-1): ν; s (3101), s (2979), s (2914), s (1604), s (1522). Spectra in Supplementary Materials (Figures S36–S43).

2.2. Preparation of Human Synovial Cells

RA synoviocytes were isolated from fresh synovial biopsies obtained from four RA patients undergoing finger arthroplasty. All patients fulfilled the 1987 American Rheumatism Association criteria for RA [29]. The mean age of the patients was 67.4 ± 3.2 years (range 53–81 years). The mean disease duration was 8.7 ± 2.3 years. At the time of surgery, the disease activity score (DAS 28) was greater than 3.2. These activities were approved by local institutional review boards, and all subjects gave written informed consent. Synovia were minced and digested with 1.5 mg/mL collagenase-dispase for 3–4 h at 37 °C as previously described [30]. After centrifugation, cells were resuspended in DMEM supplemented with 10% FCS, 4.5 g/L D-glucose, 25 mM Hepes, 100 U/mL penicillin, and 100 μg/mL streptomycin (Gibco BRL) in a humidified atmosphere containing 5% (v/v) CO2 at 37 °C. After 48 h, nonadherent cells were removed. Adherent cells (macrophage-like and FLS) were cultured in complete medium, and, at confluence, cells were trypsinized and only the FLS were passed. These cells were used between passages 4 and 8, when they morphologically resembled FLS after an indirect immunofluorescence study (see Culture of human RA FLS). RA FLS were cultured 45–60 days before experimentation. This delay allowed for the elimination of all possible interactions resulting from any preoperative treatment (with nonsteroidal anti-inflammatory drugs, analgesics, disease-modifying antirheumatic drugs, or steroids).

2.3. Culture of Human RA FLS and Treatment

Between passages 4 and 8, RA FLS were trypsinized. Cell count and viability were determined, and cells were plated in culture plates or flasks (Falcon, Oxnard, CA, USA). Viability, measured by trypan blue dye exclusion [31] at the start and the end of culture, was always greater than 95%. FLS (105) from RA patients were used for an indirect immunofluorescence study [32]. The following monoclonal antibodies were used: 5B5 (anti-prolyl hydroxylase) for fibroblasts at a 1/50 dilution (Dako, Burlingame, CA, USA), JC/70A (anti-CD31), for endothelial cells at 1/50 (Dako), and RMO52 (anti-CD14) for macrophages at 1/50 (Immunotech). The negative control was a mouse antibody of the same isotype (Immunotech). Incubations were performed at room temperature for 30 min. Binding of monoclonal antibodies was visualized using fluorescein (DTAF)-conjugated goat anti-mouse antibody (Immunotech) at a 1/50 dilution.

2.4. Antiproliferative Assays

RA FLS cells were trypsinized in fresh DMEM culture medium. Homogeneous solutions were prepared in 10 mL of medium with 700,000 cells. In a 96-well plate, 100 µL of the solution (7000 cells per well) was poured and the cells were incubated for 24 h at 37 °C and 5% CO2. Subsequently, 100 µL of PS solution in increasing concentration was poured per row in the plate and incubated for 24 h in the same conditions. The compounds were dissolved in DMSO (1 mM) just before use and then added to the culture medium in the desired concentrations. The concentration of DMSO in the cell medium was never more than 0.05%. After incubation, the medium was removed and 100 µL of complete medium without red phenol was added per well. At that point, irradiation was carried out using a red-light source, CureLight®, PhotoCure ASA at 630 nm, at a dose of 40 mW/cm2 for 30 min. After the irradiation, the wells plates were put in the incubator for 18 h. After this time, 10 µL of MTT solution (5 g/L) was added and the plates were again placed inside the incubator for 4 h. Next, the media was removed and 200 µL of DMSO was added per well, stirring the plate softly for 3 min. Absorbance after the MTT assay was measured at 540 nm by a Dynex Triad Multi Mode Microplate Reader, Dynex Technologies. The assays were executed in triplicate. Cytotoxicity evaluations in the dark were carried out by repeating this entire protocol without the irradiation dose.

2.5. Protein Extraction and Western-Blot Analysis

For total protein extraction, RA FLS were washed in PBS, and the total cell pool was centrifuged at 200 g for 5 min at 4 °C and homogenized in RIPA lysis buffer (50 mM HEPES, pH 7.5, 150 mM NaCl, 1% sodium deoxycholate, 1% NP-40, 0.1% SDS, and 20 mg/mL of aprotinin) containing protease inhibitors (CompleteTM Mini, Roche Diagnostics) according to the manufacturer’s instructions. Proteins (60 µg) were separated by electrophoresis on 10% SDS–PAGE gels and transferred to polyvinylidene fluoride (PVDF) membranes (Amersham Pharmacia Biotech, Saclay, France), which were then probed with a COX-2 human primary antibody (Cayman Chemical, Bertin Pharma, Montigny le Bretonneux, France). After incubation with a secondary antibody (Dako France S.A.S., Trappes, France), blots were developed using the ECL Plus Western Blotting Detection System (Amersham Pharmacia Biotech) and G: BOX system (Syngene, Ozyme, Saint Quentin en Yvelines, France). Membranes were then reblotted with human anti-β-actin (Sigma-Aldrich, Saint Quentin Fallavier, France) used as a loading control.

2.6. Assay of COX-2 Activity

RA FLS were maintained in DMEM supplemented with 10% (v/v) FCS, 4.5 g/L D-glucose, 100 U/mL penicillin, and 100 μg/mL streptomycin. The cells were grown in a humidified incubator at 37 °C and 5% CO2. Next, 2.106 RA FLS cells were seeded in a 25 cm2 flask and incubated for 24 h. Then, the IC50 of each PS was added and the cells were incubated for 24 h. The medium was removed and a medium without red phenol was added. Immediately, cells were irradiated under the same conditions expressed in the MTT assays and incubated for 18 h. The non-irradiated cells were kept in the incubator. After this, LPS (1 µg/mL) was added to the medium of both irradiated and non-irradiated cells, and the cells were incubated for 4 h. Cells were trypsinized and the culture medium supernatant was isolated. The PGE2 levels were quantified in the culture media supernatants from treated and control cells by enzyme immunoassay using an ELISA Kit (Cayman Chemical) [33]. The results were expressed as the average of three independent experiments.

2.7. Assay of IL-1β Production

The IL-1β levels were quantified in the culture media supernatants, isolated by the same protocol described for PGE2, from treated and control cells by ELISA Kit (Thermo Fisher Scientific). The results were expressed as the average of three independent experiments.

2.8. Statistical Analysis

All quantitative results are expressed as the mean ± 3 standard deviations (SEM) of separate experiments using Excel (Microsoft Office, Version 2019). Statistical significance was evaluated by the two-tailed unpaired Student’s t-test, p-value < 0.001 (***).

3. Results and Discussion

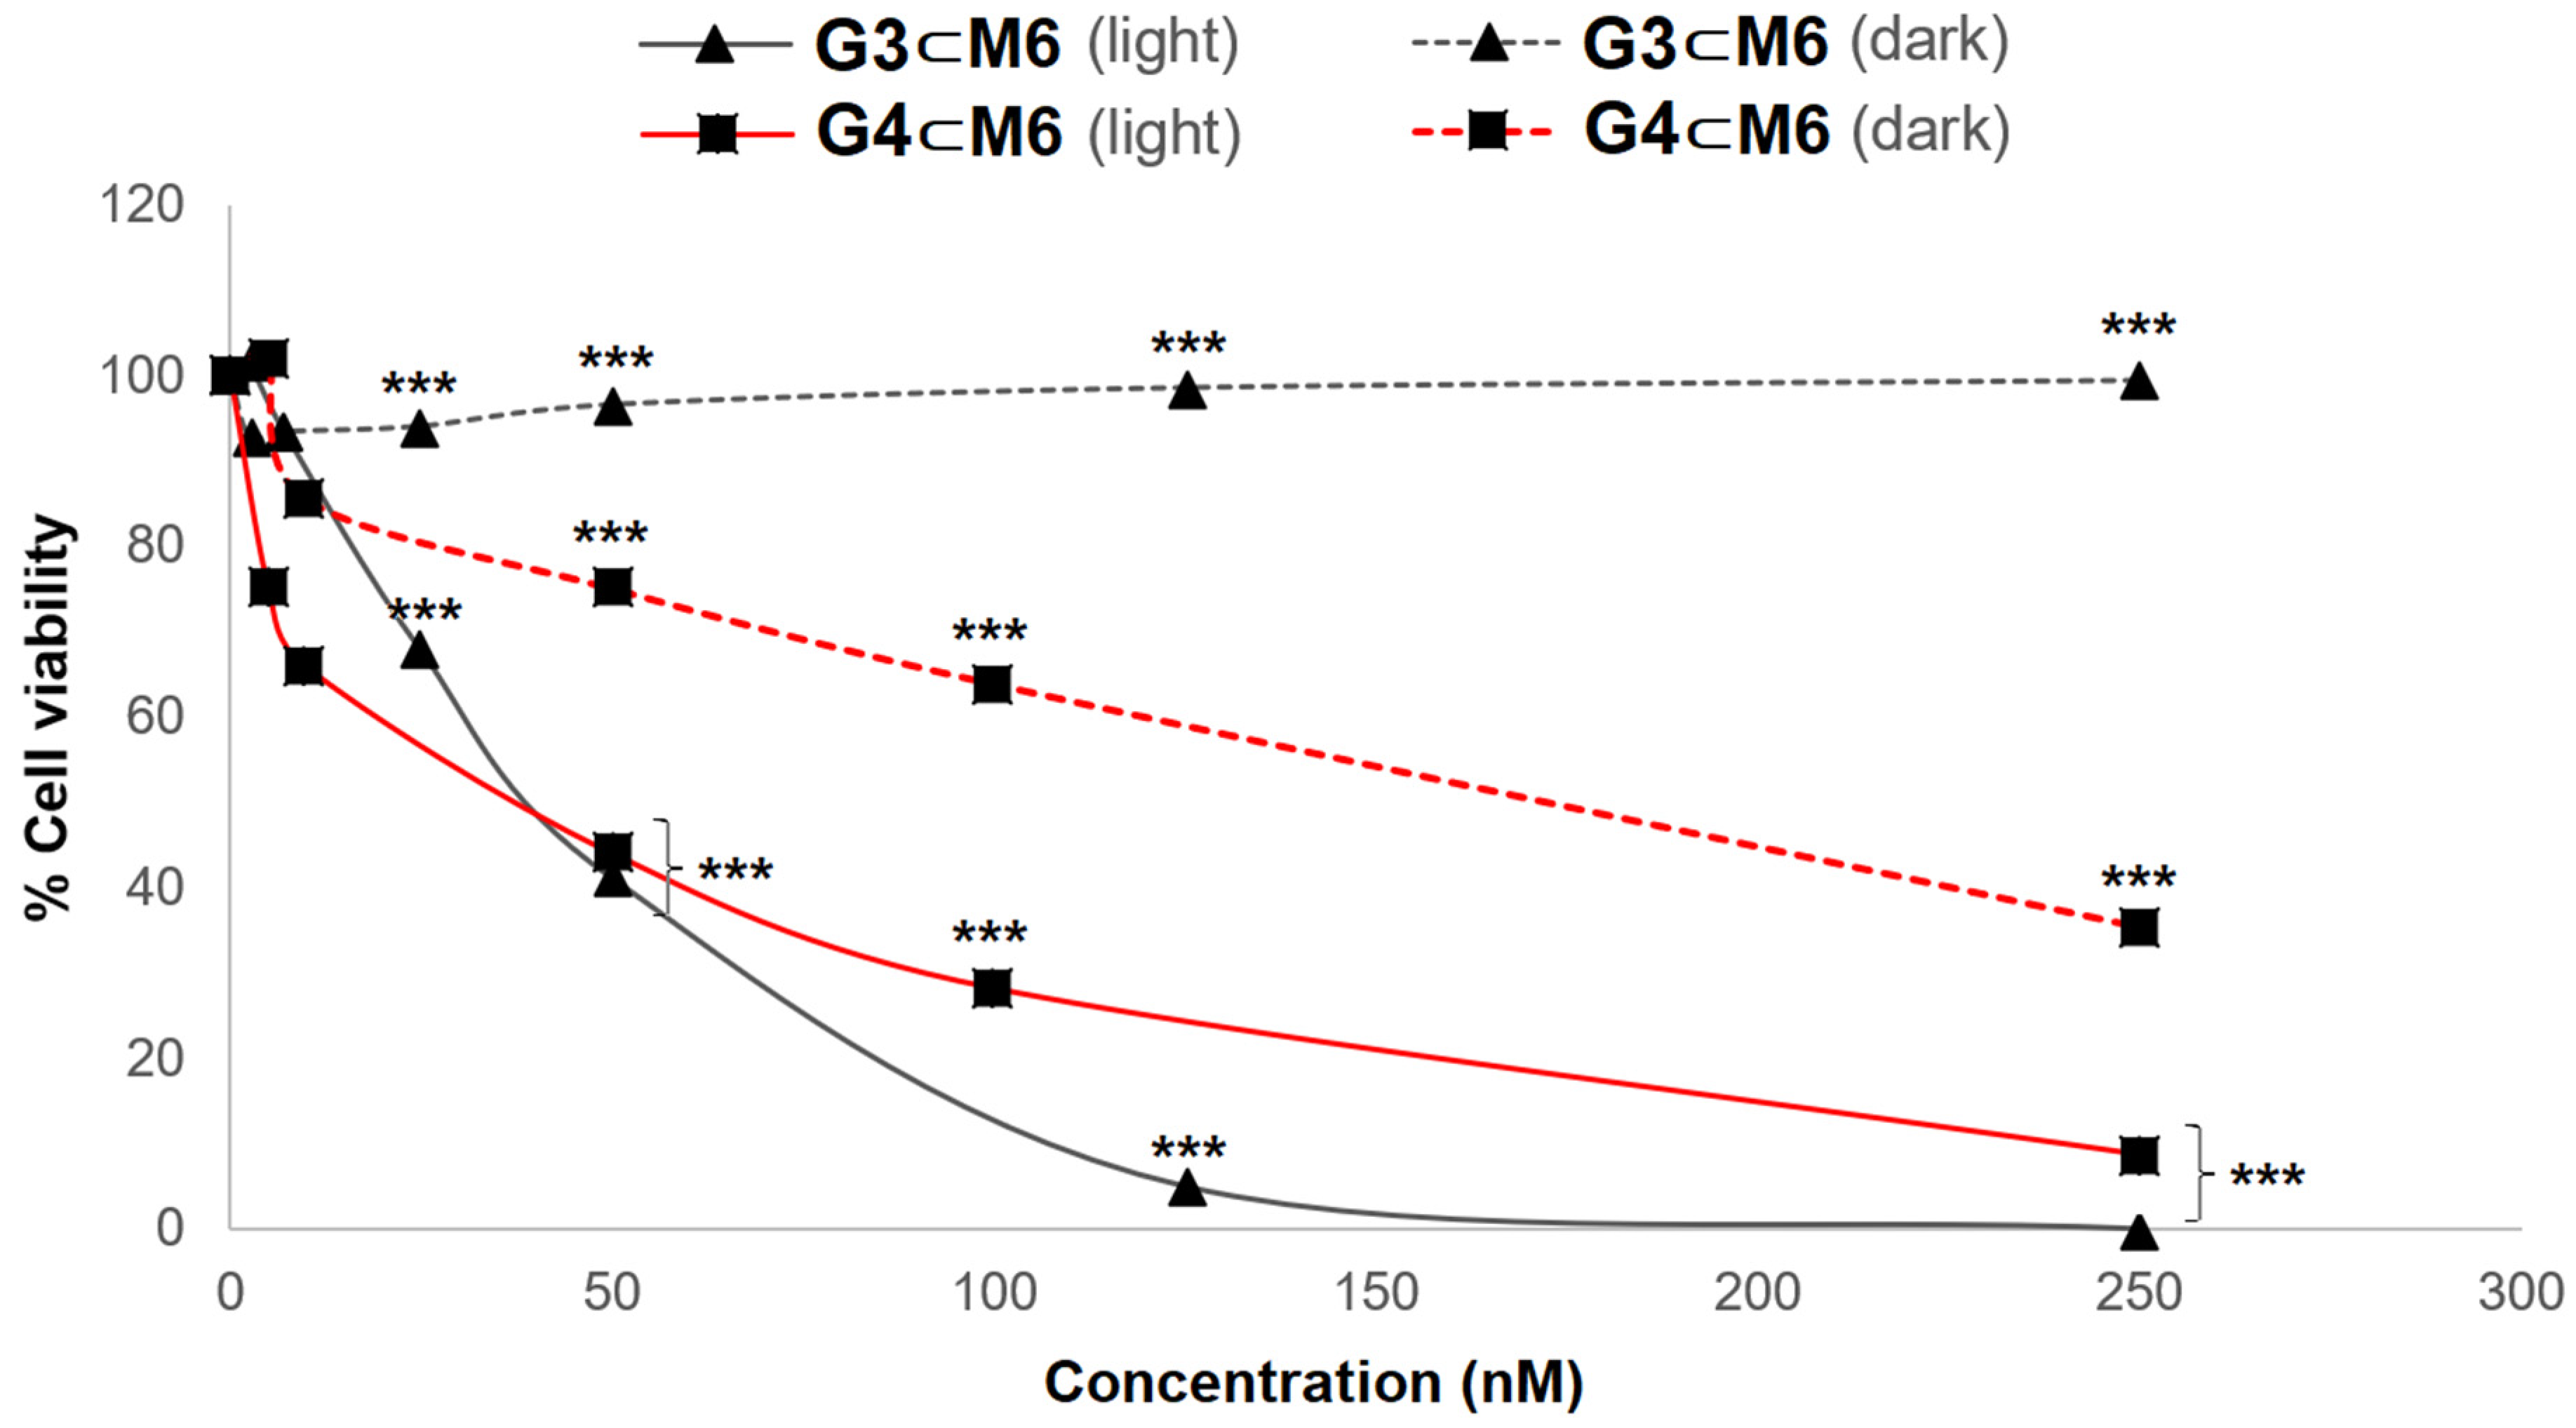
3.1. Phototoxicity Tests

Although it is the first time that these PS–metallacage systems have been tested to treat RA using PDT, two of the fifteen systems described here (Figure 3) have already been tested in cancer (HeLa, Me300, A2780, A2780cisR, and A549) [21]. Specifically, the prismatic metallacage M1 and the cubic M4, both with G1 in their internal cavity. In cancer cells, a total absence of cytotoxicity was demonstrated prior to cell internalization. Once inside the cells, the PS is released from the cage and can be irradiated giving rise to photocytotoxicity. Two mechanisms have been suggested to explain the releasing of the PS from the metallacage: (i) from a partial or total rupture of the cage; or (ii) through an aperture [21,22]. Furthermore, intracellular ruthenium contents [22] and fluorescence studies [21] have confirmed the ability of these metallacages to cross cell membranes. Fluorescence studies also reveal that, once inside the cell and after the PS leaves the cavity of the metallacage, both are positioned in different cellular areas, which did not include the nucleus.
In this work, we wanted to demonstrate the efficacy and potential of these systems in another pathology, RA, looking for a treatment that is fairly non-invasive. In addition, we have synthesized cages with structural variations to evaluate how the different elements of the metallacage influence its PDT effect (Figure 3). Moreover, we have evaluated new PSs, such as G2, G3, and G4, in addition to G1 which have been evaluated to treat RA by PDT.
First, these metallacages can be differentiated by their two main elements: the panel ligand and the dinuclear ruthenium clips. The panel ligand is a flat organic compound with three or four pyridine substituents, which give rise to prismatic or cubic cages, respectively. In this work, we used 2,4,6-tri(pyridin-4-yl)-1,3,5-triazine, 1,3,5-tris{2-(pyridin-4-yl)vinyl}benzene, or 1,2,4,5-tetrakis{2-(pyridine-4-yl)vinyl} benzene. Dinuclear arene ruthenium(II) complexes are the edges of the cage, whose two metal atoms are linked by 2,5-dioxydo-1,4-benzoquinonato, 5,8-dioxydo-1,4-naphthoquinonato, or 6,11-dioxydo-5,12-naphthacenedionato ligands (Figure 3).
The results of the photocytotoxicity tests after PDT in RA FLS were excellent (Table 1). MTT assays showed 50% inhibition concentrations (IC50) lower than those seen in cancer cells [21]. The latter was to be expected, since RA FLS are primary cells and their growth is not accelerated, unlike cancer cells. As we anticipated, the structural variation in the cages gave rise to significant differences in the PDT effect.
First, we have observed that when the size of the panel ligand is bigger, the photocytotoxicity is higher. For example, the structures of cages M2, M4, and M6 differ only by the panel ligand, 2,4,6-tri(pyridin-4-yl)-1,3,5-triazine, 1,3,5-tris{2-(pyridin-4-yl)vinyl}benzene, and 1,2,4,5-tetrakis{2-(pyridine-4-yl)vinyl} benzene, respectively. When the IC50 values obtained with porphine as the PS are compared (entries 2, 4, and 6 in Table 1), we observed that cage M2, with the smallest panel, needed a higher concentration than M4 and M6 (triple when compared to M6). This difference becomes more evident if we compare cage M1 and M5, which have panels 2,4,6-tri(pyridin-4-yl)-1,3,5-triazine and 1,3,5-tris{2-(pyridin-4-yl)vinyl}benzene, respectively. With G1 as the PS, the IC50 of M1 is six times higher than that observed in M5 (entries 1 and 5 in Table 1). This coincides with what has been reported in cancer cells [21]. A larger panel gives rise to larger apertures that facilitate the release of the PS once inside the cell, producing more ROS and, subsequently, more photocytotoxicity. This result is consistent with the other three PSs tested (Table 1).
The second of the structural elements of the cages that we can modify, the dinuclear ruthenium clip, also showed significant differences, as we expected. When the volume of the ruthenium complex is bulkier, we observed that the IC50 is lower, which translates into a better PDT effect. For instance, cages M1, M2, and M3 contain the same panel ligand and differ only in the dinuclear ruthenium “edges”, being 2,5-dioxydo-1,4-benzoquinonato, 5,8-dioxydo-1,4-naphthoquinonato, and 6,11-dioxydo-5,12-naphthacenedionato respectively. With G1 as the PS, the result obtained with M3 was four times lower than the IC50 obtained in M1 (entries 1 and 3 in Table 1), while the IC50 of M2 (entry 2 in Table 1) shows an intermediate value. These results are consistent with the structure of the metallacages, which suggest the release of the PS through an aperture [22]. Indeed, when the metallacage is smaller, the host–guest system is stabilized, making it difficult for the PS to escape, which translates into lower ROS production and a lower PDT effect. The same result, although in a lesser proportion, is observed with the other PSs tested (Table 1).
Finally, the four PSs tested have shown significant differences. First, it is worth noting the presence or absence of a metal in the center of the tetrapyrrole. In all cases, using the same cage, the PSs without a metal showed a better PDT effect (Table 1). The cause of this result is directly related to fluorescence [34]. When the PS is irradiated, part of the energy is absorbed and the PS reaches the excited singlet state. The PS can then return to the minimum energy state by releasing that energy, producing fluorescence, or the energy can pass through an intermediate excited triplet state. From this last state, the PS can return to the ground state, giving rise to phosphorescence, or interact with O2 to give rise to singlet oxygen and, in turn, ROS [12,13]. Therefore, since the derivate with Zn and Mg give rise to higher fluorescence (Figure 4), lower ROS production would be expected than their equivalents without metal. This corroborates the obtained results, that is, the presence of Mg or Zn favor fluorescence and therefore reduce ROS production and PDT efficiency. Calculating the quantum yields (Table 1), we observed the same result as expected, that is, higher quantum yield equates to less of a PDT effect.
Regarding the differences between porphine (G1) and phthalocyanine (G3), the results show that G1 works better as a PS than G3 when carried in the same metallacage (Table 1). However, the IC50 for G3 is still excellent, with both showing great potential as PSs. Surprisingly, one of the results was unexpected. When G3 or G4 is transported by the cubic metallacage (M4), no effect on RA FLS is observed (Table 1), even at the highest concentration tested. This also suggests a stronger binding affinity between the host and the guest, thus supporting that the PS is released through an aperture, rather than having a breakage of the metallacage [22].
Another excellent result is the total absence of cytotoxicity in the dark for all compounds, except for those with G4 in their cavity, which show dark toxicity (Figure 5). Therefore, this result suggests that G4 is not a good PS, although it is something we could have anticipated since other zinc tetrapyrrole derivatives have already been reported to show toxicity in the dark [35,36]. Another intriguing result comes from the metallated photosensitizers (G3 and G4) encapsulated in the 1,2,4,5-tetrakis{2-(pyridine-4-yl)vinyl} benzene derivative (M4) (entries 10 and 13, Table 1). In both systems (G3M4 and G4M4), no phototoxicity and no toxicity is observed, suggesting the absence of a photo-response from the photosensitizers in these particular cases. When compared to the other GM systems, the most plausible explanation is that the presence of Mg or Zn in the core of the PS generates a stronger interaction between the host and the guest, thus shielding the PS and blocking their release.

3.2. Inflammatory Evaluation

The synovial membrane encapsulates the joint, providing structural support, lubricating the tissues, and providing nutrients to the cartilage. FLS are part of the inner lining layer of the synovial membrane. One of the main functions of FLS is the production of cytokines [37]. One of the cytokines involved in the inflammatory response is the interleukin (IL) family. IL-1 can express cyclooxygenase-2 (COX-2), an enzyme that acts as a catalyst in the production of prostaglandin E2 (PGE2) from arachidonic acid [38,39,40,41]. PGE2 causes vasodilation in the synovial tissue, leading to inflammation in the area [42]. To evaluate in RA FLS the in vitro inflammatory activity after PDT, we decided to measure the production of PGE2 and IL-1β in the supernatant, in addition to the expression of COX-2 in both the irradiated and non-irradiated treated cells.
The determination of COX-2 expression reveals that treated RA FLS with our systems by PDT generates an overexpression of this enzyme (Figure 6), when the cells were irradiated. This result was expected, since multiple examples of COX-2 overexpression after PDT have been reported. For instance, other porphyrin-based PSs such as PpIX-polyamine [43] or Photofrin [44] increased COX-2 expression. Additionally, this not only happens with PSs based on porphyrins, but also with other PSs used in PDT [45,46]. It should be noted that most of the systems with a lower IC50 (Table 1) show less intensity in the COX-2 expression band (Figure 6). For instance, the compounds that obtained the lowest IC50, entries 4, 5, 6, 11, and 12 (Table 1), showed a COX-2 band with the lowest intensity.
As expected, an overexpression of COX-2 generates a greater production of PGE2 [43], which may lead to an increase in inflammation. That is what we see in the results obtained in the determination of PGE2 (Table 2). As with COX-2, it can be seen that when the IC50 is lower, the production of PGE2 is also lower, which again points out that reducing the required concentration of PS could reduce the adverse effects of PDT. However, it is possible to minimize the expression of COX-2 and, consequently, the production of PGE2 by using a COX-2 inhibitor, such as NS-398 during PDT treatment [43,47].
On the other hand, IL-1β is known to be a pro-inflammatory cytokine that leads to the expression of COX-2, among other functions [48]. Since our experiments showed an overexpression of COX-2 and the production of PGE2, we anticipated the presence of this cytokine as a response to the PDT treatment. Unexpectedly, the determination of IL-1β indicates that its presence after PDT is insignificant (Table 2). It is even below the standard of lower concentration and their values were not significantly different from the control samples. This indicates that, in vitro, when RA FLS are treated with our systems by PDT, IL-1β is not generating more COX-2 than what is already present in the cells, so it is not involved in the detected overexpression. However, also in synovial tissues, other cases have been reported in which IL-1β was not involved in the overexpression of COX-2 [49,50,51], indicating that other cytokines like IL-6 or IL-8 were responsible [51].

4. Conclusions

A series of photosensitizers (G) encapsulated in arene ruthenium metallacages (M) have been synthesized and characterized. The PDT effect of these host–guest systems (GM) has been evaluated on fibroblast-like synoviocyte cells (FLS). With the exception of the zinc phthalocyanine derivatives (G4M5 and G4M6), all GM compounds show no toxicity in the dark at the highest concentration tested (1.5 μM). When under light, the most photoactive compounds appear to be those with the largest cavity and the smallest guest, suggesting that the release of the photosensitizers from the host occurs without any breakage of the metallacage. However, when G4 is encapsulated in the metallacages built with 1,3,5-tris{2-(pyridin-4-yl)vinyl} benzene panels (M5 and M6), the difference between phototoxicity and toxicity is limited. On the other hand, when the metallated photosensitizers (G3 and G4) are encapsulated in the 1,2,4,5-tetrakis{2-(pyridine-4-yl)vinyl} benzene derivative (M4), no phototoxicity is observed, suggesting a strong interaction between the host and guest, which shields the photosensitizer. Nevertheless, in all systems, PDT gives rise to the overexpression of COX-2 and PGE2. However, we have also observed that when a lower concentration of the drug is used, this overexpression is significantly reduced. Surprisingly, IL-1β does not seem to be involved in this COX-2 overexpression, despite being previously reported. This indicates that other cytokines are responsible for this overexpression of COX-2. With a few exceptions, all systems show encouraging results, and further in vitro investigations should be performed and other host–guest systems evaluated in order to validate our strategy; however, we think our results show an interesting method for the treatment of RA by PDT. This work, added to those already reported in the last three decades, both in vitro and in vivo, show the inherent potential that PDT could have in the treatment of RA.

Supplementary Materials

The following are available online at https://www.mdpi.com/article/10.3390/pharmaceutics13122104/s1, Figure S1: 1H NMR spectrum of G1M2 in CD3CN at 25 °C, Figure S2: 13C NMR spectrum of G1M2 in CD3CN at 25 °C, Figure S3: 1H-1H COSY NMR spectrum of G1M2 in CD3CN at 25 °C, Figure S4: DOSY NMR spectrum of G1M2 in CD3CN at 25 °C, Figure S5: 1H-13C HSQC NMR spectrum of G1M2 in CD3CN at 25 °C, Figure S6: 1H-13C HMQC NMR spectrum of G1M2 in CD3CN at 25 °C, Figure S7: ESI-MS spectrum of G1M2, Figure S8: UV-vis absorbance spectrum of G1M2 (10 µM in DMSO), Figure S9: ATR FT-IR spectrum of G1M2, Figure S10: 1H NMR spectrum of G1M3 in CD3CN at 25 °C, Figure S11: 13C NMR spectrum of G1M3 in CD3CN at 25 °C, Figure S12: 1H-1H COSY NMR spectrum of G1M3 in CD3CN at 25 °C, Figure S13: DOSY NMR spectrum of G1M3 in CD3CN at 25 °C, Figure S14: 1H-13C HSQC NMR spectrum of G1M3 in CD3CN at 25 °C, Figure S15: 1H-13C HMQC NMR spectrum of G1M3 in CD3CN at 25 °C, Figure S16: UV-vis absorbance spectrum of G1M3 (10 µM in DMSO), Figure S17: ATR FT-IR spectrum spectrum of G1M3, Figure S18: 1H NMR spectrum of G2M1 in DMSO-d6 at 25 °C, Figure S19: 13C NMR spectrum of G2M1 in DMSO-d6 at 25 °C, Figure S20: 1H-1H COSY NMR spectrum of G2M1 in DMSO-d6 at 25 °C, Figure S21: DOSY NMR spectrum of G2M1 in DMSO-d6 at 25 °C, Figure S22: 1H-13C HSQC NMR spectrum of G2M1 in DMSO-d6 at 25 °C, Figure S23: 1H-13C HMQC NMR spectrum of G2M1 in DMSO-d6 at 25 °C, Figure S24: ESI-MS spectrum of G2M1, Figure S25: UV-vis absorbance spectrum of G2M1 (10 µM in DMSO), Figure S26: ATR FT-IR spectrum spectrum of G2M1, Figure S27: 1H NMR spectrum of G2M4 in CD3CN at 25 °C, Figure S28: 13C NMR spectrum of G2M4 in CD3CN at 25 °C, Figure S29: 1H-1H COSY NMR spectrum of G2M4 in CD3CN at 25 °C, Figure S30: DOSY NMR spectrum of G2M4 in CD3CN at 25 °C, Figure S31: 1H-13C HSQC NMR spectrum of G2M4 in CD3CN at 25 °C, Figure S32: 1H-13C HMQC NMR spectrum of G2M4 in CD3CN at 25 °C, Figure S33: ESI-MS spectrum of G2M4, Figure S34: UV-vis absorbance spectrum of G2M4 (10 µM in DMSO), Figure S35: ATR FT-IR spectrum spectrum of G2M4, Figure S36: 1H NMR spectrum of G2M6 in CD3CN at 25 °C, Figure S37: 13C NMR spectrum of G2M6 in CD3CN at 25 °C, Figure S38: 1H-1H COSY NMR spectrum of G2M6 in CD3CN at 25 °C, Figure S39: 1H-13C HSQC NMR spectrum of G2M6 in CD3CN at 25 °C, Figure S40: 1H-13C HMQC NMR spectrum of G2M6 in CD3CN at 25 °C, Figure S41: ESI-MS spectrum of G2M6, Figure S42: UV-vis absorbance spectrum of G2M6 (10 µM in DMSO), Figure S43: ATR FT-IR spectrum spectrum of G2M6.

Author Contributions

Conceptualization, M.G.-V., B.L., and B.T.; Methodology, M.G.-V., L.P., J.-L.C., and S.S.; Validation, D.Y.L., B.L., and B.T.; Writing—original draft preparation, M.G.-V. and P.V.-S.; Writing—review and editing, B.L. and B.T. All authors have read and agreed to the published version of the manuscript.

Funding

This research was funded by European Union’s Horizon 2020 under the Marie Sklodoska-Curie, grant agreement no. 764837.

Institutional Review Board Statement

Not applicable.

Informed Consent Statement

Informed consent was obtained from all subjects involved in the study. Written informed consent has been obtained from the patients to publish this paper.

Data Availability Statement

Not applicable.

Acknowledgments

We thank all of the people involved in the project POLYTHEA, funding by European Union’s Horizon 2020 under the Marie Sklodowska-Curie grant agreement no. 764837. M.G.-V. thanks Stéphanie Leroy-Lhez, Johann Bouclé, and Nidia Maldonado-Carmona for access to fluorescence equipment and for their great help, and Daniel Stares and Christoph A. Schalley for their excellent work in mass spectrometry.

Conflicts of Interest

The authors declare no conflict of interest.

References

  1. Smolen, J.S.; Aletaha, D.; McInnes, I.B. Rheumatoid arthritis. Lancet 2016, 388, 2023–2038. [Google Scholar] [CrossRef]
  2. Roux, C.H.; Saraux, A.; Le Bihan, E.; Fardellone, P.; Guggenbuhl, P.; Fautrel, B.; Masson, C.; Chary-Valckenaere, I.; Cantagrel, A.; Juvin, R.; et al. Rheumatoid arthritis and spondyloarthropathies: Geographical variations in prevalence in France. J. Rheumatol. 2007, 34, 117–122. [Google Scholar]
  3. Scherer, H.U.; Häupl, T.; Burmester, G.R. The etiology of rheumatoid arthritis. J. Autoimmun. 2020, 110, 102400. [Google Scholar] [CrossRef] [PubMed]
  4. Kerkman, P.F.; Fabre, E.; van der Voort, E.I.; Zaldumbide, A.; Rombouts, Y.; Rispens, T.; Wolbink, G.; Hoeben, R.C.; Spits, H.; Baeten, D.L.; et al. Identification and characterization of citrullinated antigen-specific B cells in peripheral blood of patients with rheumatoid arthritis. Ann. Rheum. Dis. 2016, 75, 1170–1176. [Google Scholar] [CrossRef] [PubMed]
  5. Aletaha, D.; Alasti, F.; Smolen, J.S. Rheumatoid factor, not antibodies against citrullinated proteins, is associated with baseline disease activity in rheumatoid arthritis clinical trials. Arthritis Res. Ther. 2015, 17, 229. [Google Scholar] [CrossRef] [Green Version]
  6. McInnes, I.B.; Schett, G. The pathogenesis of rheumatoid arthritis. N. Engl. J. Med. 2011, 365, 2205–2219. [Google Scholar] [CrossRef] [Green Version]
  7. Smolen, J.S.; Landewé, R.B.; Bijlsma, J.W.; Burmester, G.R.; Dougados, M.; Kerschbaumer, A.; McInnes, I.B.; Sepriano, A.; van Vollenhoven, R.F.; de Wit, M.; et al. EULAR recommendations for the management of rheumatoid arthritis with synthetic and biological disease-modifying antirheumatic drugs: 2019 update. Ann. Rheum. Dis. 2020, 79, 685–699. [Google Scholar] [CrossRef] [Green Version]
  8. Smolen, J.S.; van der Heijde, D.; Machold, K.P.; Aletaha, D.; Landewé, R. Proposal for a new nomenclature of disease-modifying antirheumatic drugs. Ann. Rheum. Dis. 2014, 73, 3–5. [Google Scholar] [CrossRef]
  9. Ma, X.; Xu, S. TNF inhibitor therapy for rheumatoid arthritis. Biomed. Rep. 2013, 1, 177–184. [Google Scholar] [CrossRef] [Green Version]
  10. Dowty, M.E.; Lin, T.H.; Jesson, M.I.; Hegen, M.; Martin, D.A.; Katkade, V.; Menon, S.; Telliez, J.B. Janus kinase inhibitors for the treatment of rheumatoid arthritis demonstrate similar profiles of in vitro cytokine receptor inhibition. Pharmacol. Res. Perspect. 2019, 7, e00537. [Google Scholar] [CrossRef] [Green Version]
  11. Gallardo-Villagrán, M.; Leger, D.Y.; Liagre, B.; Therrien, B. Photosensitizers used in the photodynamic therapy of rheumatoid arthritis. Int. J. Mol. Sci. 2019, 20, 3339. [Google Scholar] [CrossRef] [Green Version]
  12. Dougherty, T.J.; Gomer, C.J.; Henderson, B.W.; Jori, G.; Kessel, D.; Korbelik, M.; Moan, J.; Peng, Q. Photodynamic therapy. J. Natl. Cancer Inst. 1998, 90, 889–905. [Google Scholar] [CrossRef] [Green Version]
  13. Agostinis, P.; Berg, K.; Cengel, K.A.; Foster, T.H.; Girotti, A.W.; Gollnick, S.O.; Hahn, S.M.; Hamblin, M.R.; Juzeniene, A.; Kessel, D.; et al. Photodynamic therapy of cancer: An update. CA Cancer, J. Clin. 2011, 61, 250–281. [Google Scholar] [CrossRef]
  14. Hopper, C. Photodynamic therapy: A clinical reality in the treatment of cancer. Lancet Oncol. 2000, 1, 212–219. [Google Scholar] [CrossRef]
  15. Trauner, K.B.; Gandour-Edwards, R.; Bamberg, M.; Shortkroff, S.; Sledge, C.; Hasan, T. Photodynamic synovectomy using benzoporphyrin derivative in an antigen-induced arthritis model for rheumatoid arthritis. Photochem. Photobiol. 1998, 67, 133–139. [Google Scholar] [CrossRef]
  16. Miyazawa, S.; Nishida, K.; Komiyama, T.; Nakae, Y.; Takeda, K.; Yorimitsu, M.; Kitamura, A.; Kunisada, T.; Ohtsuka, A.; Inoue, H. Novel transdermal photodynamic therapy using ATX-S10· Na (II) induces apoptosis of synovial fibroblasts and ameliorates collagen antibody-induced arthritis in mice. Rheumatol. Int. 2006, 26, 717. [Google Scholar] [CrossRef] [PubMed]
  17. Lu, Y.; Li, L.; Lin, Z.; Wang, L.; Lin, L.; Li, M.; Zhang, Y.; Yin, Q.; Li, Q.; Xia, H. A new treatment modality for rheumatoid arthritis: Combined photothermal and photodynamic therapy using Cu7. 2S4 nanoparticles. Adv. Healthc. Mater. 2018, 7, 1800013. [Google Scholar] [CrossRef] [PubMed]
  18. Koderhold, G.; Jindra, R.; Koren, H.; Alth, G.; Schenk, G. Experiences of photodynamic therapy in dermatology. J. Photochem. Photobiol. Biol. 1996, 36, 221–223. [Google Scholar] [CrossRef]
  19. Búzová, D.; Kasák, P.; Miškovský, P.; Jancura, D. Solubilization of poorly soluble photosensitizer hypericin by polymeric micelles and polyethylene glycol. Gen. Physiol. Biophys. 2013, 32, 201–208. [Google Scholar] [CrossRef] [PubMed]
  20. Yang, X.; Bai, J.; Qian, Y. The investigation of unique water-soluble heptamethine cyanine dye for use as NIR photosensitizer in photodynamic therapy of cancer cells. Spectrochim. Acta A 2020, 228, 117702. [Google Scholar] [CrossRef]
  21. Schmitt, F.; Freudenreich, J.; Barry, N.P.; Juillerat-Jeanneret, L.; Süss-Fink, G.; Therrien, B. Organometallic cages as vehicles for intracellular release of photosensitizers. J. Am. Chem. Soc. 2012, 134, 754–757. [Google Scholar] [CrossRef] [Green Version]
  22. Barry, N.P.E.; Zava, O.; Dyson, P.J.; Therrien, B. Excellent Correlation between Drug Release and Portal Size in Metalla-Cage Drug-Delivery Systems. Chem. Eur. J. 2011, 17, 9669–9677. [Google Scholar] [CrossRef] [PubMed] [Green Version]
  23. Barry, N.P.; Edafe, F.; Therrien, B. Anticancer activity of tetracationic arene ruthenium metalla-cycles. Dalton Trans. 2011, 40, 7172–7180. [Google Scholar] [CrossRef] [Green Version]
  24. Xu, F.; Zhu, X.H.; Shen, Q.; Lu, J.; Li, J.Q. Catalytic cyclotrimerization of arylnitriles using the novel samarium (II) complexes as catalysts. Chin. J. Chem. 2002, 20, 1334–1339. [Google Scholar] [CrossRef]
  25. Amoroso, A.J.; Thompson, A.M.C.; Maher, J.P.; McCleverty, J.A.; Ward, M.D. Di-, tri-, and tetranucleating pyridyl ligands which Facilitate multicenter magnetic exchange between paramagnetic molybdenum centers. Inorg. Chem. 1995, 34, 4828–4835. [Google Scholar] [CrossRef]
  26. Wang, L.; Tao, X.T.; Yang, J.X.; Yu, W.T.; Ren, Y.; Xin, Q.; Liu, Z.; Jiang, M.H. Synthesis, structure and two-photon absorption properties of a new multi-branched compound, 1, 2, 4, 5-tetrakis (4-pyridylvinyl) benzene. J. Solid State Chem. 2004, 177, 4293–4299. [Google Scholar] [CrossRef]
  27. Freudenreich, J.; Dalvit, C.; Süss-Fink, G.; Therrien, B. Encapsulation of photosensitizers in hexa-and octanuclear organometallic cages: Synthesis and characterization of carceplex and host–guest systems in solution. Organometallics 2013, 32, 3018–3033. [Google Scholar] [CrossRef]
  28. Dogutan, D.K.; Ptaszek, M.; Lindsey, J.S. Direct synthesis of magnesium porphine via 1-formyldipyrromethane. J. Org. Chem. 2007, 72, 5008–5011. [Google Scholar] [CrossRef] [PubMed] [Green Version]
  29. Arnett, F.C.; Edworthy, S.M.; Bloch, D.A.; Mcshane, D.J.; Fries, J.F.; Cooper, N.S.; Healey, L.A.; Kaplan, S.R.; Liang, M.H.; Luthra, H.S.; et al. The American Rheumatism Association 1987 revised criteria for the classification of rheumatoid arthritis. Arthritis Rheumatol. 1988, 31, 315–324. [Google Scholar] [CrossRef]
  30. Liagre, B.; Vergne-Salle, P.; Corbiere, C.; Charissoux, J.L.; Beneytout, J.L. Diosgenin, a plant steroid, induces apoptosis in human rheumatoid arthritis synoviocytes with cyclooxygenase-2 overexpression. Arthritis Res. Ther. 2004, 6, R373. [Google Scholar] [CrossRef] [Green Version]
  31. Glant, T.T.; Jacobs, J.J.; Molnár, G.; Shanbhag, A.S.; Valyon, M.; Galante, J.O. Bone resorption activity of particulate-stimulated macrophages. J. Bone Miner. Res. 1993, 8, 1071–1079. [Google Scholar] [CrossRef]
  32. Bonnet, C.; Bertin, P.; Cook-Moreau, J.; Chable-Rabinovitch, H.; Treves, R.; Rigaud, M. Lipoxygenase products and expression of 5-lipoxygenase and 5-lipoxygenase-activating protein in human cultured synovial cells. Prostaglandins 1995, 50, 127–135. [Google Scholar] [CrossRef]
  33. Semaan, J.; Pinon, A.; Rioux, B.; Hassan, L.; Limami, Y.; Pouget, C.; Fagnère, C.; Sol, V.; Diab-Assaf, M.; Simon, A.; et al. Resistance to 3-HTMC-induced apoptosis through activation of PI3K/Akt, MEK/ERK, and p38/COX-2/PGE2 pathways in human HT-29 and HCT116 colorectal cancer cells. J. Cell. Biochem. 2016, 117, 2875–2885. [Google Scholar] [CrossRef] [PubMed]
  34. Kamkaew, A.; Lim, S.H.; Lee, H.B.; Kiew, L.V.; Chung, L.Y.; Burgess, K. BODIPY dyes in photodynamic therapy. Chem. Soc. Rev. 2013, 42, 77–88. [Google Scholar] [CrossRef] [PubMed]
  35. Lutton, J.D.; Abraham, N.G.; Drummond, G.S.; Levere, R.D.; Kappas, A. Zinc porphyrins: Potent inhibitors of hematopoieses in animal and human bone marrow. Proc. Natl. Acad. Sci. USA 1997, 94, 1432–1436. [Google Scholar] [CrossRef] [Green Version]
  36. Yang, G.; Nguyen, X.; Ou, J.; Rekulapelli, P.; Stevenson, D.K.; Dennery, P.A. Unique effects of zinc protoporphyrin on HO-1 induction and apoptosis. Am. J. Hematol. 2001, 97, 1306–1313. [Google Scholar] [CrossRef] [Green Version]
  37. Bartok, B.; Firestein, G.S. Fibroblast-like synoviocytes: Key effector cells in rheumatoid arthritis. Immunol. Rev. 2010, 233, 233–255. [Google Scholar] [CrossRef]
  38. Park, C.; Moon, D.O.; Choi, I.W.; Choi, B.T.; Nam, T.J.; Rhu, C.H.; Kwon, T.K.; Lee, W.H.; Kim, G.Y.; Choi, Y.H. Curcumin induces apoptosis and inhibits prostaglandin E2 production in synovial fibroblasts of patients with rheumatoid arthritis. Int. J. Mol. Med. 2007, 20, 365–372. [Google Scholar] [CrossRef] [Green Version]
  39. Nasry, W.H.S.; Rodriguez-Lecompte, J.C.; Martin, C.K. Role of COX-2/PGE2 mediated inflammation in oral squamous cell carcinoma. Cancers 2018, 10, 348. [Google Scholar] [CrossRef] [Green Version]
  40. Sung, M.S.; Lee, E.G.; Jeon, H.S.; Chae, H.J.; Park, S.J.; Lee, Y.C.; Yoo, W.H. Quercetin inhibits IL-1β-induced proliferation and production of MMPs, COX-2, and PGE2 by rheumatoid synovial fibroblast. Inflammation 2012, 35, 1585–1594.3. [Google Scholar] [CrossRef] [PubMed]
  41. Agostinis, P.; Breyssens, H.; Buytaert, E.; Hendrickx, N. Regulatory pathways in photodynamic therapy induced apoptosis. Photochem. Photobiol. Sci. 2004, 3, 721–729. [Google Scholar] [CrossRef]
  42. Downey, G.P.; Gumbay, R.S.; Doherty, D.E.; LaBrecque, J.F.; Henson, J.E.; Henson, P.M.; Worthen, G.S. Enhancement of pulmonary inflammation by PGE2: Evidence for a vasodilator effect. J. Appl. Physiol. 1988, 64, 728–741. [Google Scholar] [CrossRef] [PubMed]
  43. Fidanzi-Dugas, C.; Liagre, B.; Chemin, G.; Perraud, A.; Carrion, C.; Couquet, C.Y.; Granet, R.; Sol, V.; Léger, D.Y. Analysis of the in vitro and in vivo effects of photodynamic therapy on prostate cancer by using new photosensitizers, protoporphyrin IX-polyamine derivatives. Biochim. Biophys. Acta Gen. Subj. 2017, 1861, 1676–1690. [Google Scholar] [CrossRef]
  44. Luna, M.; Wong, S.; Ferrario, A.; Gomer, C.J. Cyclooxygenase-2 Expression Induced by Photofrin Photodynamic Therapy Involves the p38 MAPK Pathway. Photochem. Photobiol. 2008, 84, 509–514. [Google Scholar] [CrossRef] [PubMed]
  45. Rayar, A.M.; Lagarde, N.; Martin, F.; Blanchard, F.; Liagre, B.; Ferroud, C.; Zagury, J.F.; Montes, M.; Veitía, M.S.I. New selective cyclooxygenase-2 inhibitors from cyclocoumarol: Synthesis, characterization, biological evaluation and molecular modeling. Eur. J. Med. Chem. 2018, 146, 577–587. [Google Scholar] [CrossRef]
  46. Hendrickx, N.; Volanti, C.; Moens, U.; Seternes, O.M.; De Witte, P.; Vandenheede, J.R.; Piette, J.; Agostinis, P. Up-regulation of cyclooxygenase-2 and apoptosis resistance by p38 MAPK in hypericin-mediated photodynamic therapy of human cancer cells. J. Biol. Chem. 2003, 278, 52231–52239. [Google Scholar] [CrossRef] [PubMed] [Green Version]
  47. Ferrario, A.; Von Tiehl, K.; Wong, S.; Luna, M.; Gomer, C.J. Cyclooxygenase-2 inhibitor treatment enhances photodynamic therapy-mediated tumor response. Cancer Res. 2002, 62, 3956–3961. [Google Scholar] [PubMed]
  48. Williams, C.S.; Mann, M.; DuBois, R.N. The role of cyclooxygenases in inflammation, cancer, and development. Oncogene 1999, 18, 7908–7916. [Google Scholar] [CrossRef] [Green Version]
  49. van Dalen, S.C.M.; Blom, A.B.; Slöetjes, A.W.; Helsen, M.M.A.; Roth, J.; Vogl, T.; van de Loo, F.A.; Koenders, M.I.; van der Kraan, P.M.; van den Berg, W.B.; et al. Interleukin-1 is not involved in synovial inflammation and cartilage destruction in collagenase-induced osteoarthritis. Osteoarthr. Cartil. 2017, 25, 385–396. [Google Scholar] [CrossRef] [Green Version]
  50. Nasi, S.; Ea, H.K.; So, A.; Busso, N. Revisiting the role of interleukin-1 pathway in osteoarthritis: Interleukin-1α and-1β, and NLRP3 inflammasome are not involved in the pathological features of the murine menisectomy model of osteoarthritis. Front. Pharmacol. 2017, 8, 282. [Google Scholar] [CrossRef]
  51. Shimomura, K.; Kanamoto, T.; Kita, K.; Akamine, Y.; Nakamura, N.; Mae, T.; Yoshikawa, H.; Nakata, K. Cyclic compressive loading on 3D tissue of human synovial fibroblasts upregulates prostaglandin E2 via COX-2 production without IL-1β and TNF-α. Bone Jt. Res. 2014, 3, 280–288. [Google Scholar] [CrossRef] [PubMed] [Green Version]
Figure 1. Typical ruthenium-based assemblies used as PS carrier for cellular internalization and subsequent activation of PS by irradiation, giving rise to ROS.
Pharmaceutics 13 02104 g001
Figure 2. Photosensitizers used in this work. From left to right, 21H,23H-porphine (G1), Mg(II)-porphine (G2), 29H,31H-phthalocyanine (G3) and Zn(II)-phthalocyanine (G4).
Pharmaceutics 13 02104 g002
Figure 3. Structures of ruthenium(II) metallacages used in this work. The photosensitizer is represented by a sphere (PS), 21H,23H-porphine (G1) was inserted in M1M6, Mg(II)-porphine (G2) in M1, M4, and M6, 29H,31H-phthalocyanine (G3) and Zn(II)-phthalocyanine (G4) in M4M6.
Pharmaceutics 13 02104 g003
Figure 4. Emission spectra of M5 with G3 or G4 (left) and M6 with G1 or G2 (right), in DMSO at 25 °C (10 nM concentration).
Pharmaceutics 13 02104 g004
Figure 5. MTT assays of G3M6 (black) and G4M6 (red), in the dark (dashed line) and after irradiation (solid line). Statistical significance determined by the two-tailed unpaired Student’s t-test, p-value < 0.001 (***).
Pharmaceutics 13 02104 g005
Figure 6. Effects of the systems tested on COX-2 expression after PDT. The numbers correspond to the entries in Table 1. Cells (2 × 10⁶) were cultured in DMEM medium (FBS 10%, L-glutamine 1%, penicillin 100 U/mL, Streptomycin 100 µg/mL) for 24 h and treated with the corresponding system GM. After 24 h, the medium was replaced by a DMEM medium without red phenol, and then irradiated (RI) or not (NI) by 630 nm irradiation (40 mW/cm2, 30 min). After 18 h, LPS (1 µg/mL) was added to the medium to stimulate the expression of COX-2, and 4 h later the trypsination was carried out. COX-2 expression was determined by Western Blot and β-actin was used as a protein loading control. All experiments were done in triplicate.
Pharmaceutics 13 02104 g006
Table 1. Results of the MTT assays. Irradiation after 24 h of incubation with G ⊂ M, λ = 630 nm, 40 mW/cm2 for 30 min. IC50 values were calculated fitting the curve to a second degree polynomial ± 3 sigma deviations. The maximum concentration tested was 1.5 µM. Quantum yield (ΦF) was calculated using TPP as an internal standard in DMSO at 25 °C.
EntryG ⊂ MIC50 (nM) LightIC50 (nM) DarkΦF (%)
1G1M1211.7 ± 5.8>1500-
2G1M295.0 ± 5.9>1500-
3G1M353.6 ± 4.3>1500-
4G1M448.1 ± 9.7>1500-
5G1M535.4 ± 4.7>15000.8
6G1M631.7 ± 6.6>15001.1
7G2M1302.6 ± 5.2>1500-
8G2M4100.7 ± 5.8>1500-
9G2M691.8 ± 8.3>15002.0
10G3M4>1500>1500-
11G3M553.4 ± 4.5>15000.11
12G3M647.4 ± 6.3>1500-
13G4M4>1500>1500-
14G4M566.0 ± 2.6103.8 ± 2.91.6
15G4M664.4 ± 4.4163.8 ± 17.1-
Table 2. PGE2 and IL-1β results. The assays were performed using the protocol provided by the ELISA kit in triplicate. The data were treated as explained in this protocol. The cells tested were treated by PDT with each of the indicated compounds as described in the experimental section. The control sample was treated exactly as the cells tested, that is, 18 h after the irradiation dose, 1 µg/mL of LPS was added to the medium and the cells were incubated for 4 h, then trypsinized and the cells and supernatant were isolated. The results are expressed by the average of three independent experiments. After testing the photocytotoxic activity, we chose the systems with the greatest potential to be used in PDT against RA and evaluated their inflammatory activity. Of these fifteen systems, we obviously ruled out those that did not work (cubic cage M4 + phthalocyanines) and the systems that generated toxicity in the dark.
EntryG ⊂ MPGE2 (pg/mL)IL-1β (pg/mL)
Ctrl - 286.6 ± 0.11.8 ± 0.7
1G1M1460.8 ± 4.32.3 ± 1.2
2G1M2471.2 ± 3.41.9 ± 1.0
3G1M3445.1 ± 4.72.8 ± 0.1
4G1M4378.3 ± 14.23.2 ± 0.4
5G1M5407.4 ± 14.52.1 ± 0.2
6G1M6439.2 ± 10.11.6 ± 0.1
7G2M1476.8 ± 3.41.9 ± 0.6
8G2M4473.6 ± 7.51.4 ± 0.2
9G2M6430.6 ± 1.42.2 ± 0.2
10G3M5368.2 ± 26.52.4 ± 0.4
11G3M6425.2 ± 2.70.1 ± 0.1
Publisher’s Note: MDPI stays neutral with regard to jurisdictional claims in published maps and institutional affiliations.

