3.1. Comparison of Different Motility Pattern on the Drug Release/Disintegration of the Tablet at Different Fluid Viscosities
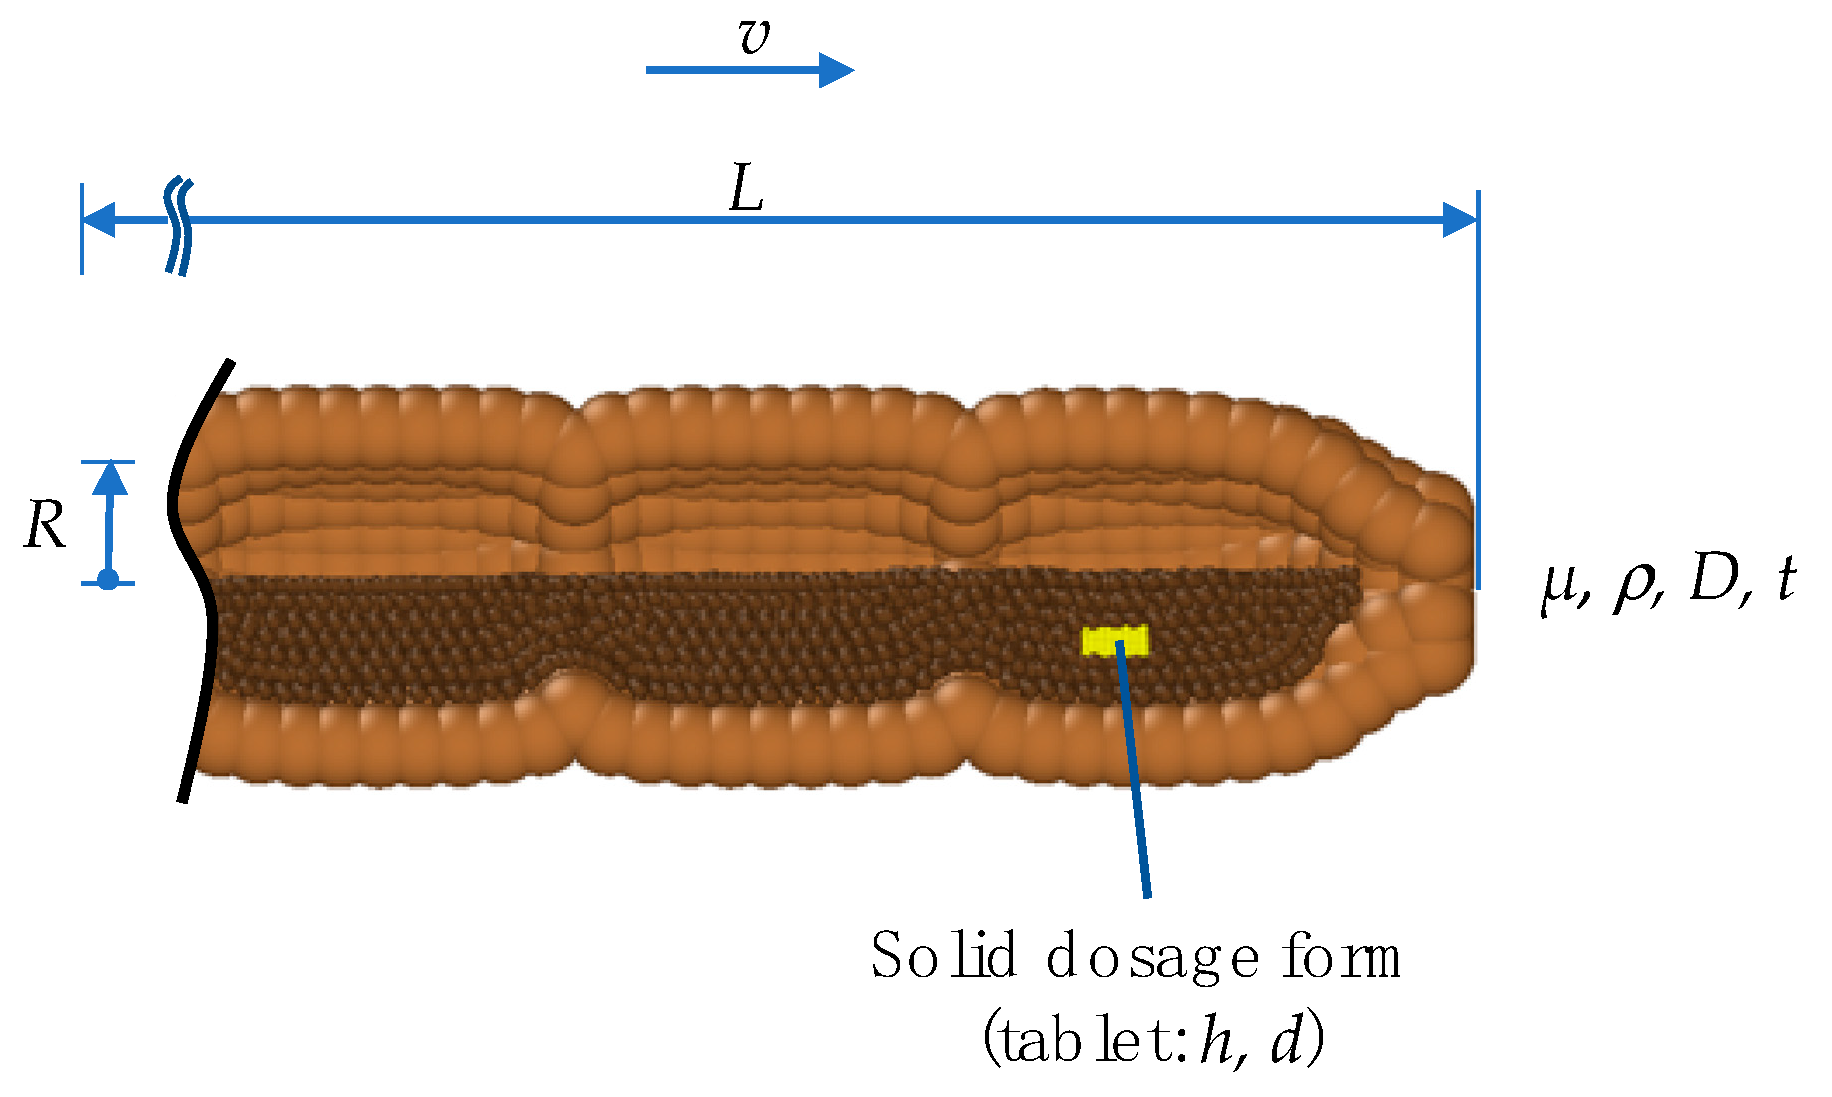
To assess the influence of the fluid viscosity on the drug release of a tablet in the colon environment, we performed all simulations at three different fluid viscosities: low viscosity (ηL = 1 mPa s), moderate viscosity (ηL = 13 mPa s) and high viscosity (ηL = 98 mPa s). In all three cases, the dissolution process of the tablet, driven by pure diffusion, is represented by a so-called ‘Static’ model. In this model, the membrane does not move at all. Accordingly, no momentum is generated that moves the fluid.
At low fluid viscosity conditions (
Figure 7), after a certain time, all motility patterns cause the fluid to move in the colon.
Figure 7.
Comparison of the drug release profile of the different models at low fluid viscosity conditions as well as the comparison of the shear stress/shear rate acting on the tablet.
Figure 7.
Comparison of the drug release profile of the different models at low fluid viscosity conditions as well as the comparison of the shear stress/shear rate acting on the tablet.
Until
t = 18 min, in all models, the drug release of the tablet is driven almost by pure diffusion as the drug release profile has the same progression as the ‘Static’ model. The slope of the ‘CPPW’ model is not as steep as in the other models since the tablet is pushed to the surface and, thus, is not in complete contact with the fluid. From
t = 18 min on, the shear stress becomes a significant factor. In all models, the momentum caused by the different motility pattern is strong enough to set the fluid in motion. Even though the average shear stress does not differ significantly from model to model (see legend
Figure 7), recurring shear stress peaks enhanced drug release. Additionally, small fluid motions, such as those that occur in the ‘Baseline’ model, lead to somewhat higher advection-induced mass transfer and thus to a higher release rate of the tablet compared to the ‘Static’ model. In a low viscous fluid environment, a complete dissolution of a tablet is only achieved, in the case of the ‘Stimulant PEG’, ‘Stimulant Maltose’ motility pattern.
Figure 7 shows how the shear stress acting on the tablet increases with time as the wall motion transfers more and more momentum to the fluid. In the case of the ‘Comparison’ pattern, the tablet is pushed back and forth until
t = 15 min, where the tablet is pushed to the end next to the initial position of the tablet, where the tablet remains until the end of the simulation. Here, the tablet does not receive significant momentum from the contractions, but some fluid still flows around it which leads to an increased advection-induced mass transfer and thus to a higher drug release. The sparse shear stress peaks in the ‘CPPW’ model are observed because only one wave is travelling from one end of the colon to the other, and always in one direction. Thus, at low fluid viscosity condition, the momentum induced by the wave reaches the tablet only occasionally.
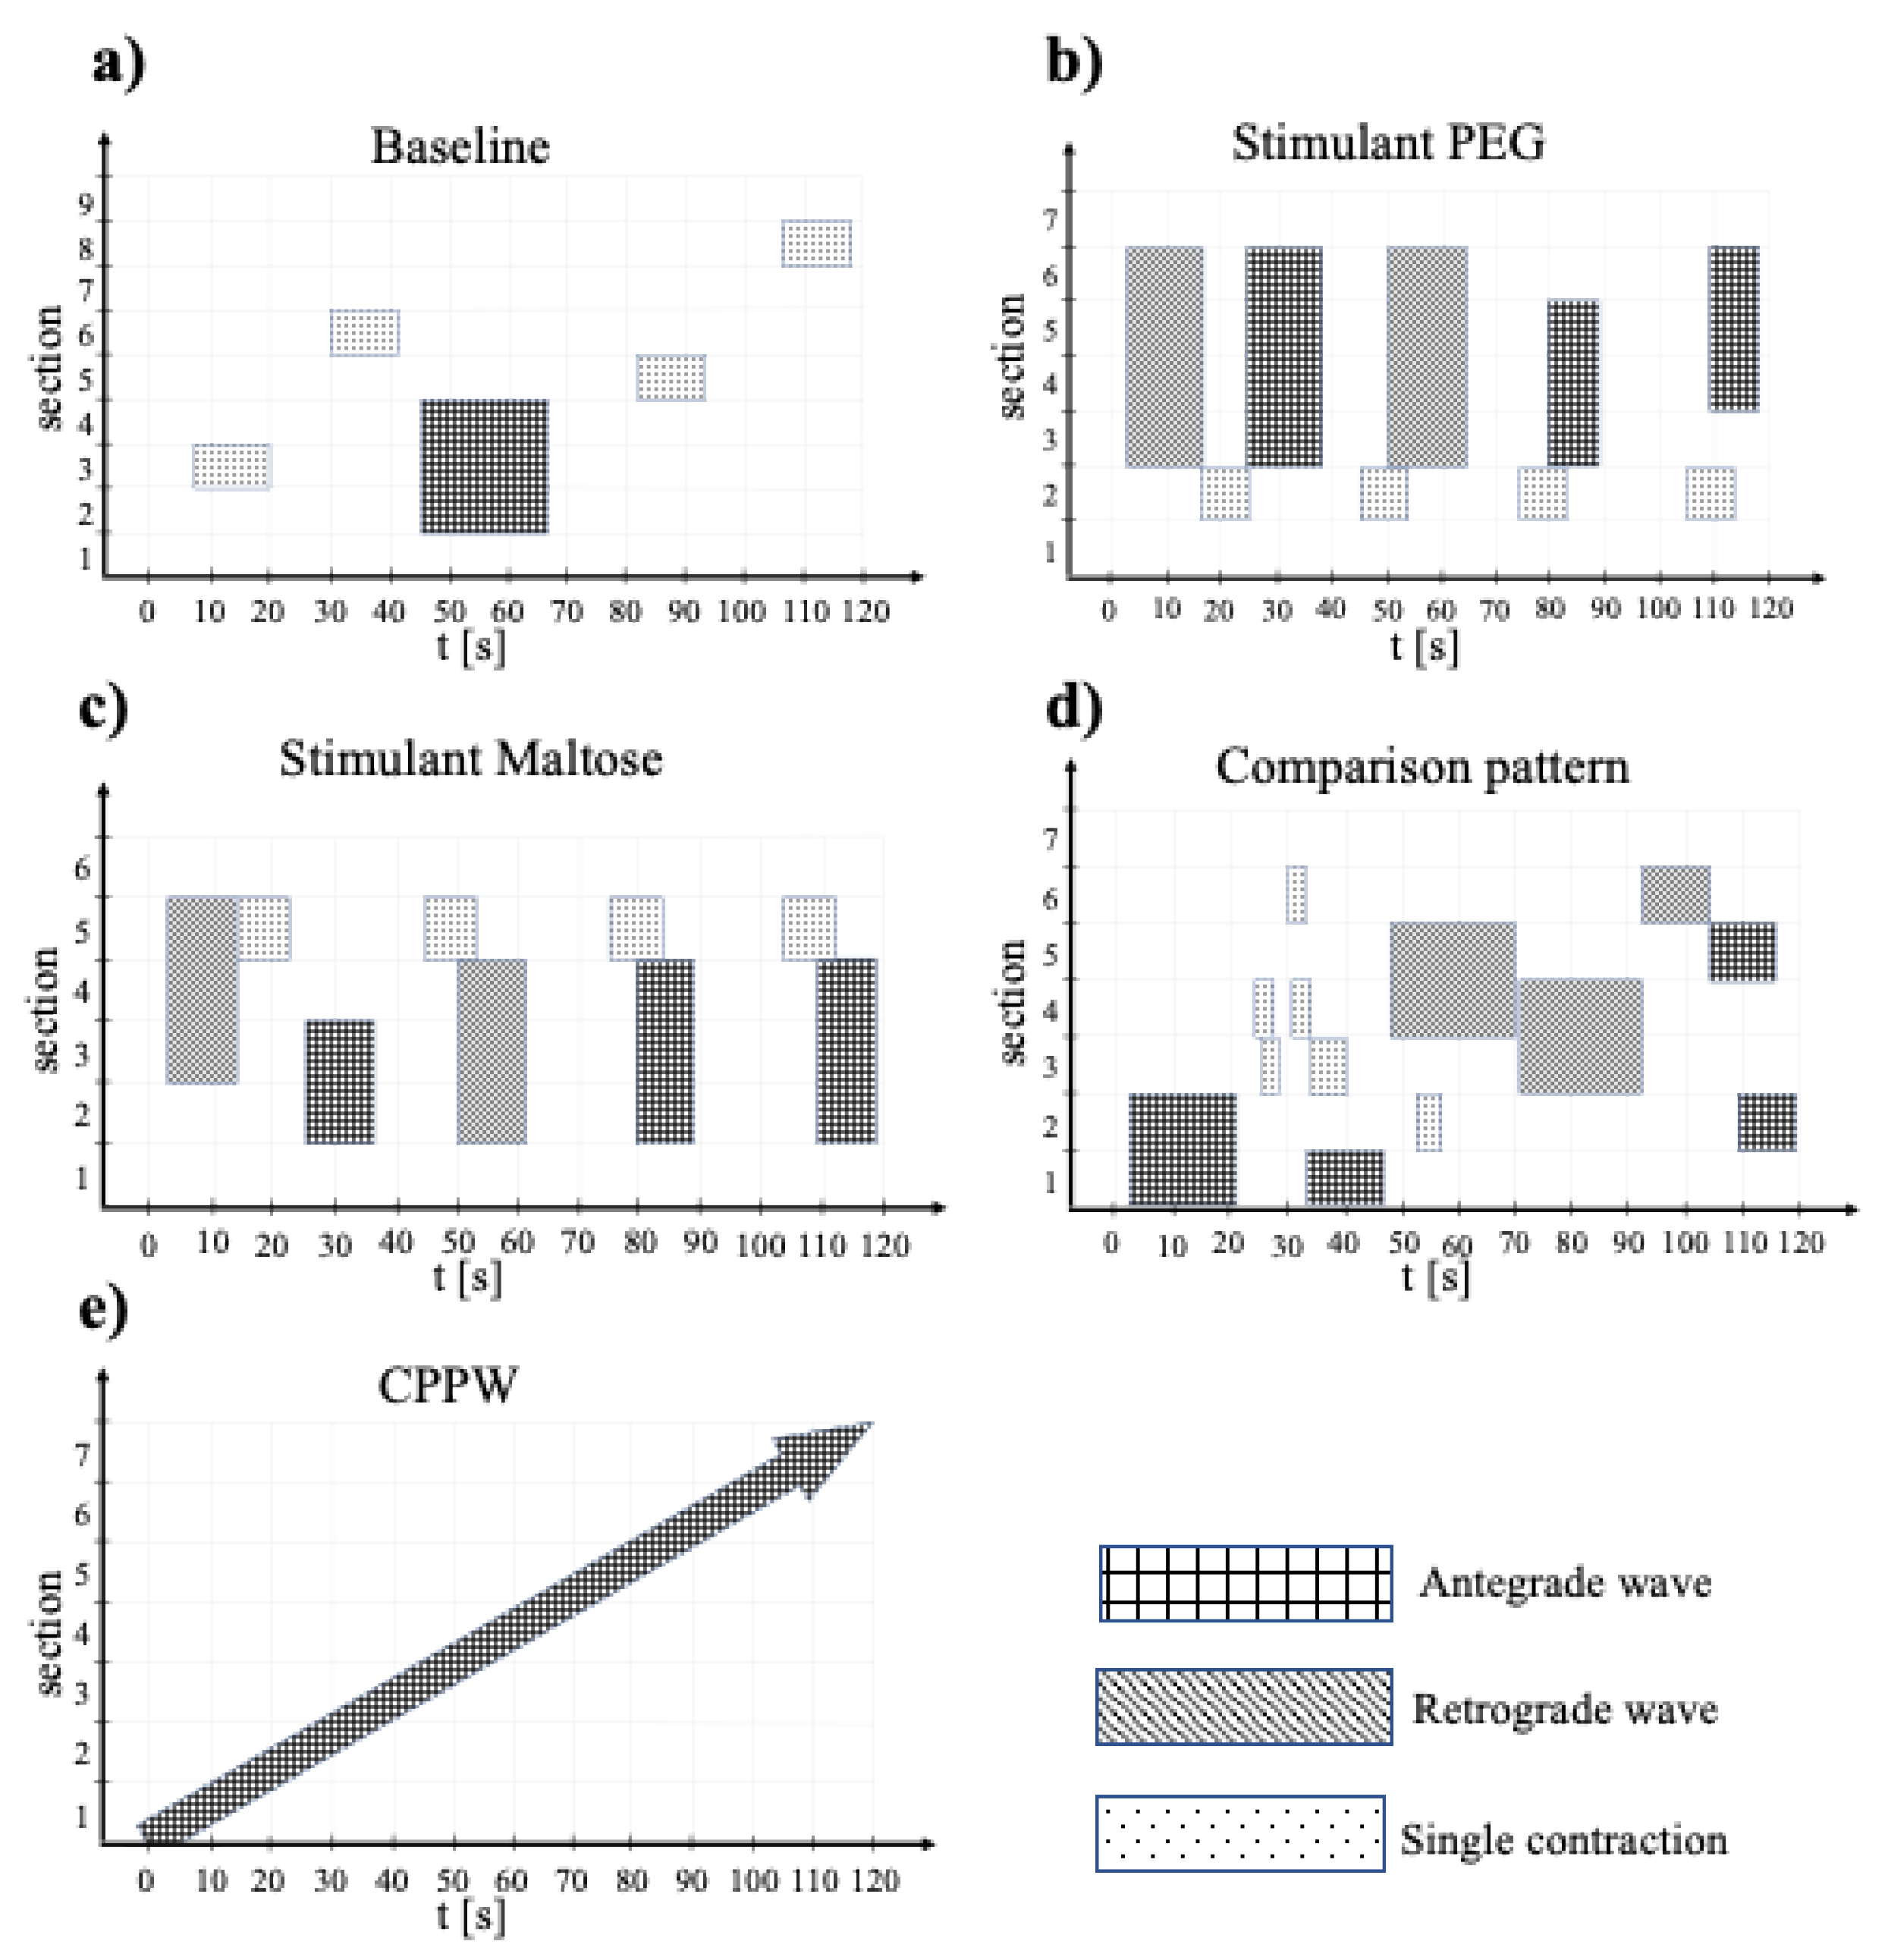
When comparing the three different motility patterns found in [
13,
14,
39], at low fluid viscosity conditions, it can be seen from
Figure 7 that the drug release profile of the ‘Stimulant PEG’ and ‘Stimulant Maltose’ model do not show significant differences (i.e., f
1 = 12.0%, f
2 = 57.7%). The drug release rate of the ‘Stimulant PEG’ model is somewhat higher than the ‘Stimulant Maltose’ model where the drug is completely released from the tablet at
t = 54 min and
t = 59 min, respectively. The release rate in the ‘Baseline’ model is much smaller than in the other two models and does not deviate much from the ‘Static’ model (i.e., f
1 = 1.6%, f
2 = 93.9%).
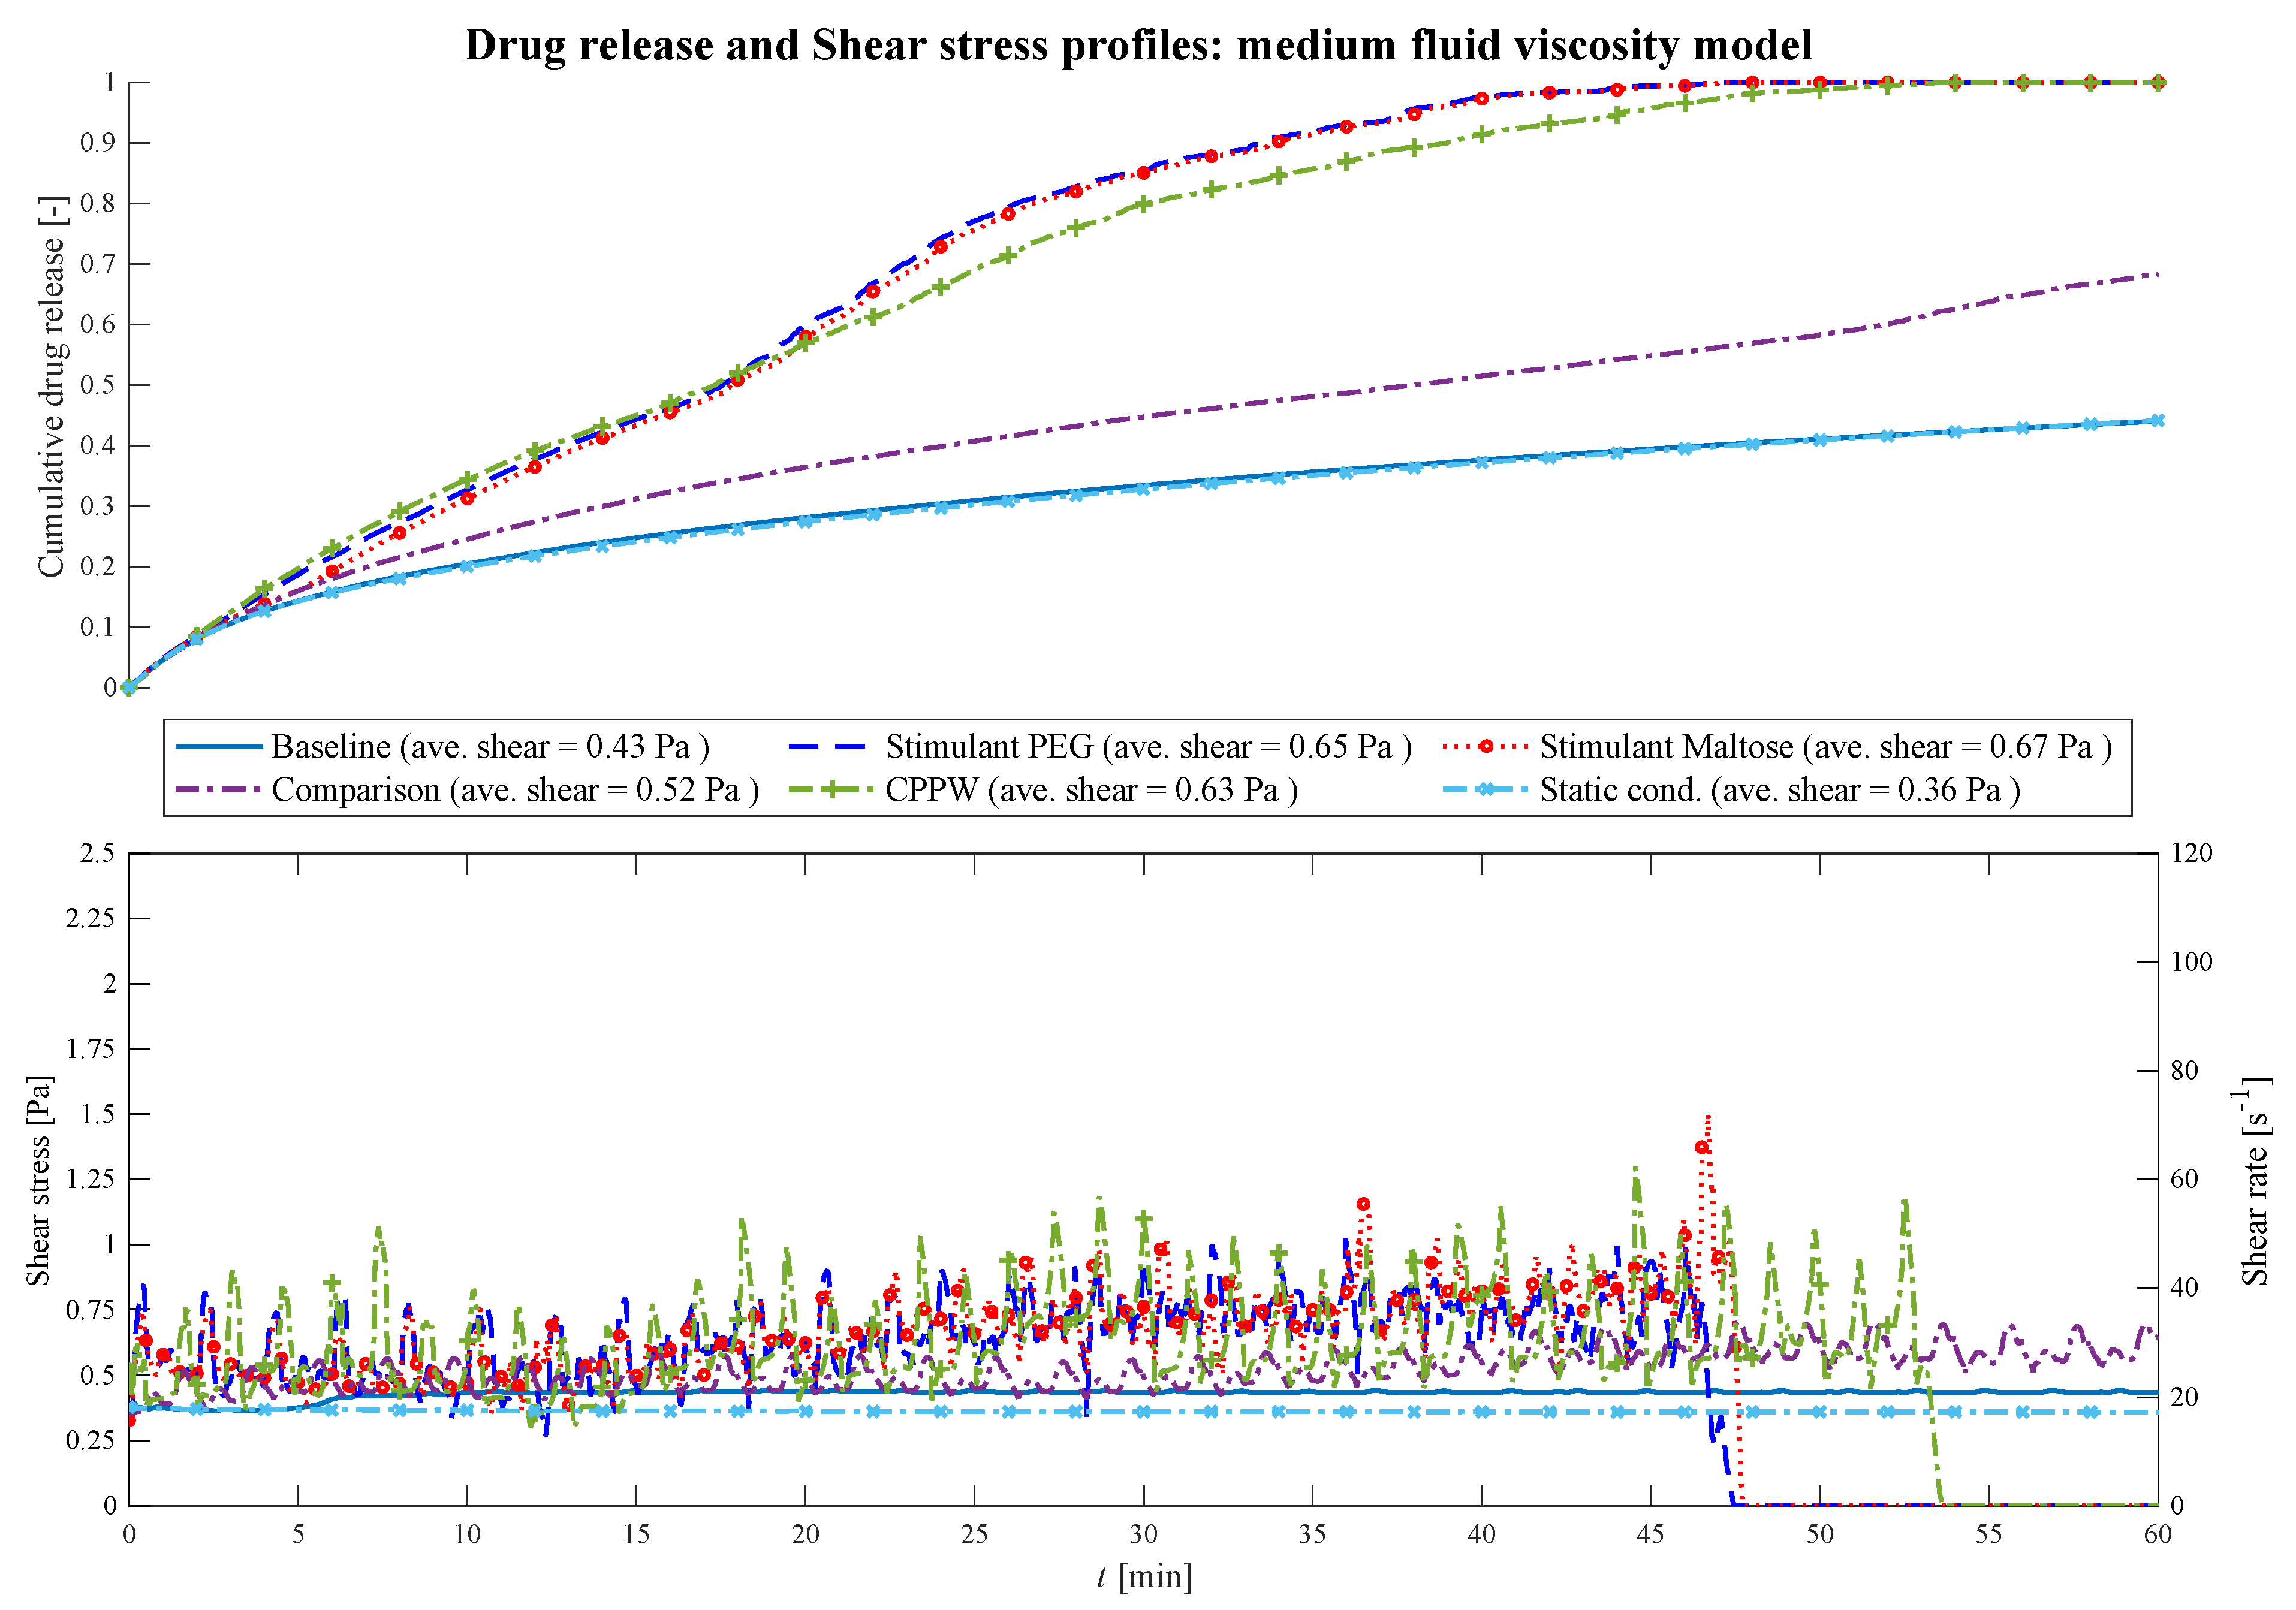
At higher viscosities (
Figure 8) the fluctuations of the shear stress decrease and the drug release profiles become similar (i.e., PEG—Maltose: f
1 = 2.5%, f
2 = 87.9%; PEG—CPPW: f
1 = 6.2%, f
2 = 68.5%; Maltose—CPPW: f
1 = 6.8%, f
2 = 69.5%; Static—Baseline: f
1 = 1.3%, f
2 = 97.8%).
Figure 8.
Comparison of the drug release profile of the different models at medium fluid viscosity conditions as well as the comparison of the shear stress/shear rate acting on the tablet.
Figure 8.
Comparison of the drug release profile of the different models at medium fluid viscosity conditions as well as the comparison of the shear stress/shear rate acting on the tablet.
The most pronounced effect is in the ‘Comparison’ model where the drug release of the tablet decreases significantly compared to the low viscosity model. Only the momentum generated from the motility patterns of the models ‘Stimulant PEG’, ‘Stimulant Maltose’ and ‘CPPW’ are strong enough to agitate the fluid sufficiently with regard to an increased advection and thus accelerated drug release rate. In all three models, the increased drug release rate leads to complete disintegration of the tablet within the simulation time (
t = 54 min). The most significant effect can be seen in the case of the ‘CPPW’. At higher viscosity, the tablet is not pushed to the surface of the fluid and remains in the fluid for the majority of the time (see
Supplementary Materials Videos S3 and S4).
The comparison of the ‘Stimulant PEG’, ‘Stimulant Maltose’ and ‘Baseline’ cases at moderate fluid viscosities shows that the ‘Stimulant PEG’ and ‘Stimulant Maltose’ model has almost the same drug release profile. In both models, the drug of the tablet is completely released at t = 48 min. Since in the ‘Baseline’ model the impulse induced by the contraction is not sufficient to move the fluid, the drug release profile shows the same progression as the ‘Static’ model.
In the case of the highest fluid viscosity used in this study (
Figure 9), the motility pattern of the ‘CPPW’ model is the only pattern capable of agitating the fluid at a high level, generating sufficient shear stress to promote the drug release process and lead to almost complete drug release of the tablet.
Figure 9.
Comparison of the drug release profile of the different models at high fluid viscosity conditions as well as the comparison of the shear stress/shear rate acting on the tablet.
Figure 9.
Comparison of the drug release profile of the different models at high fluid viscosity conditions as well as the comparison of the shear stress/shear rate acting on the tablet.
The contractions performed in the ‘Baseline’ model do not influence the drug release process. The impulse they generate is too weak to induce any influential fluid motion. At high viscosity conditions, the motility patterns in the ‘Stimulant PEG’, ‘Stimulant Maltose’ and ‘Comparison’ models result in almost the same drug release profile (i.e., Comparison—PEG: f1 = 3.1%, f2 = 89.1%; Comparison—Maltose: f1 = 2.0%, f2 = 95.1%; PEG—Maltose: f1 = 1.1%, f2 = 97.5%), even though they show partly different drug release profiles at lower viscosities.
The average shear stresses for each model and each viscosity are given in
Figure 7,
Figure 8 and
Figure 9. Across all models and viscosities, we found 120 Pa for the maximum local shear stress acting on the surface of the tablet. These values correspond very well with the shear stresses found in other studies, even though they focused on the stomach [
49,
50].
The shear rates acting on the tablet fluctuate sharply between 100 and 2170 s
−1 at low fluid viscosity, between 18 and 70 s
−1 at medium viscosity and between 5.5 and 18 s
−1 at high fluid viscosity. In the USP II, the shear rates are constant for a given location in the vessel and increase proportionally to the paddle speed [
51]. The shear rates found in the USP II at fluid conditions comparable to the ‘low viscosity model’ are in the range of 5 s
−1 at 25 rpm and 250 s
−1 at 200 rpm paddle speed [
51,
52,
53,
54]. The linear shear rate profile of the USP II is not characteristic of the colonic environment, where the motility pattern evokes sharp shear rate spikes that significantly affect the dissolution/disintegration process. Especially at low fluid viscosity, the hydrodynamic parameters (i.e., shear rate and fluid velocity) enhance the dissolution/disintegration rate.
In addition to the dissolution profile, the degree of disintegration or the disintegration time for the complete disintegration of the solid dosage form (tablet) are also important parameters influencing the drug release rate. The corresponding results of all motility patterns/models and all fluid viscosities are summarised in
Table 6.
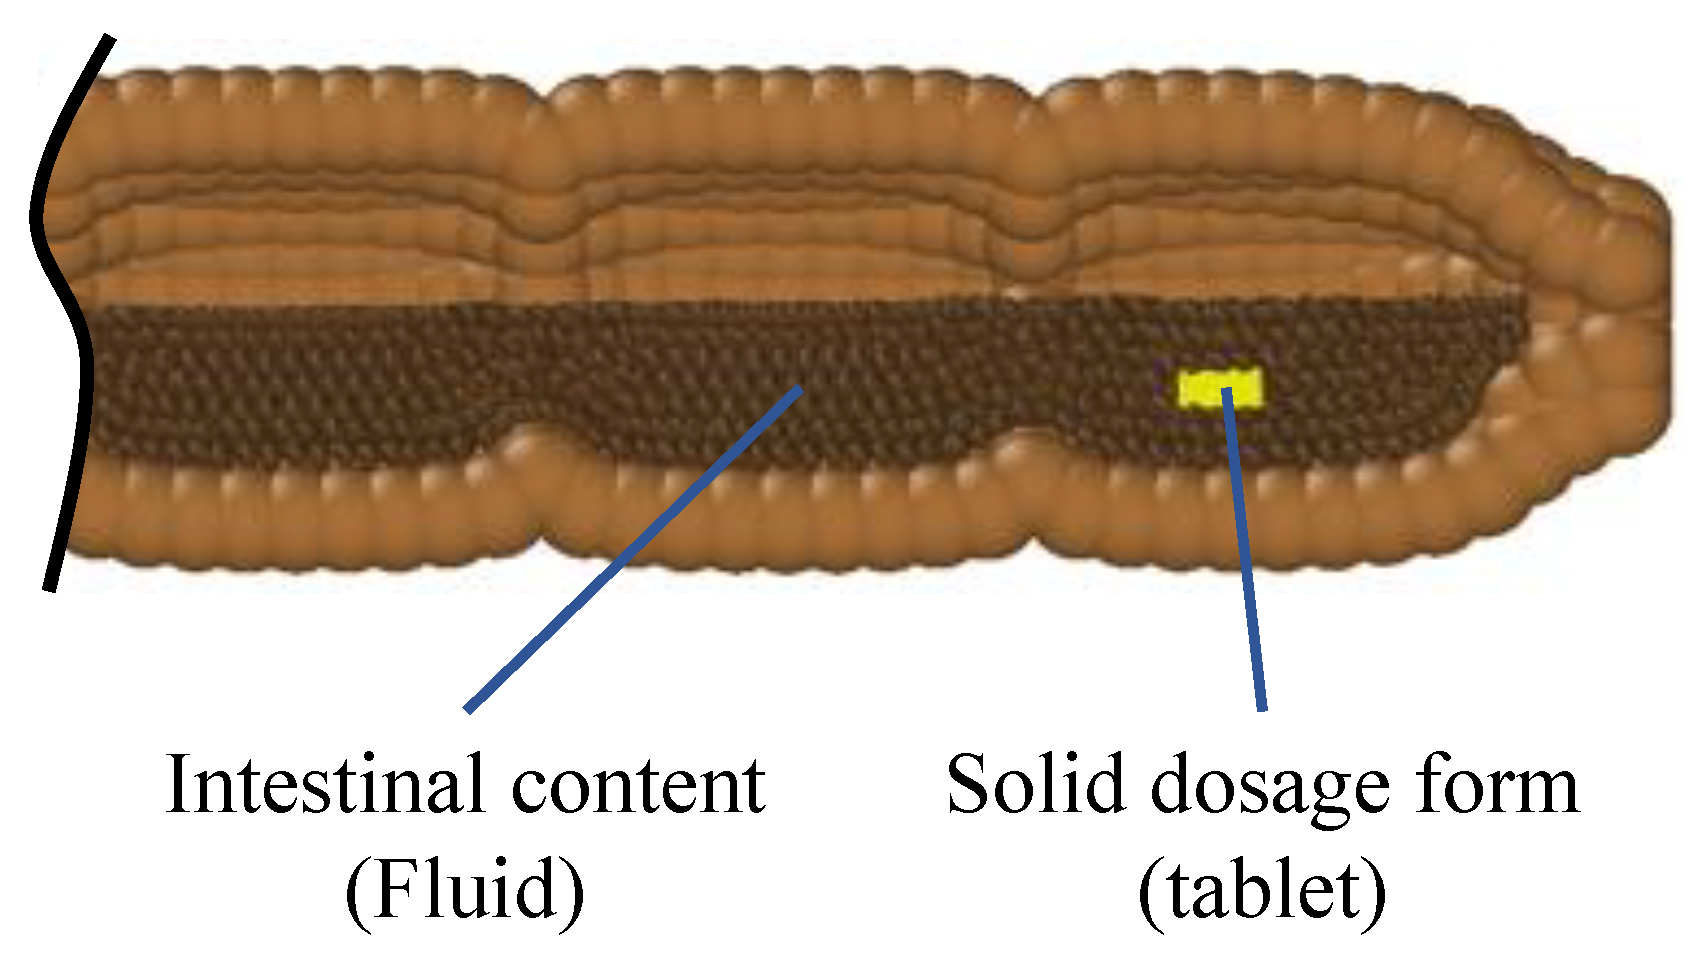
3.2. Comparison of the API Distribution along the Colon
Standard dissolution/drug release profiles, as commonly performed to access the properties of a solid dosage form, do not give any valuable information about the concentration gradient of the API along the colon. This information is important to determine the efficacy of the API in terms of drug absorption. To gain more insight into the concentration gradient along the colon, we divided the colon into six equal sections to see how the API concentration is distributed over time. Here, section one includes the initial position of the tablet and section six is at the end of the colon. The comparison and analysis of the concentration in each section and model are carried out at four different time points and the three different fluid viscosities: low viscosity, medium viscosity and high velocity.
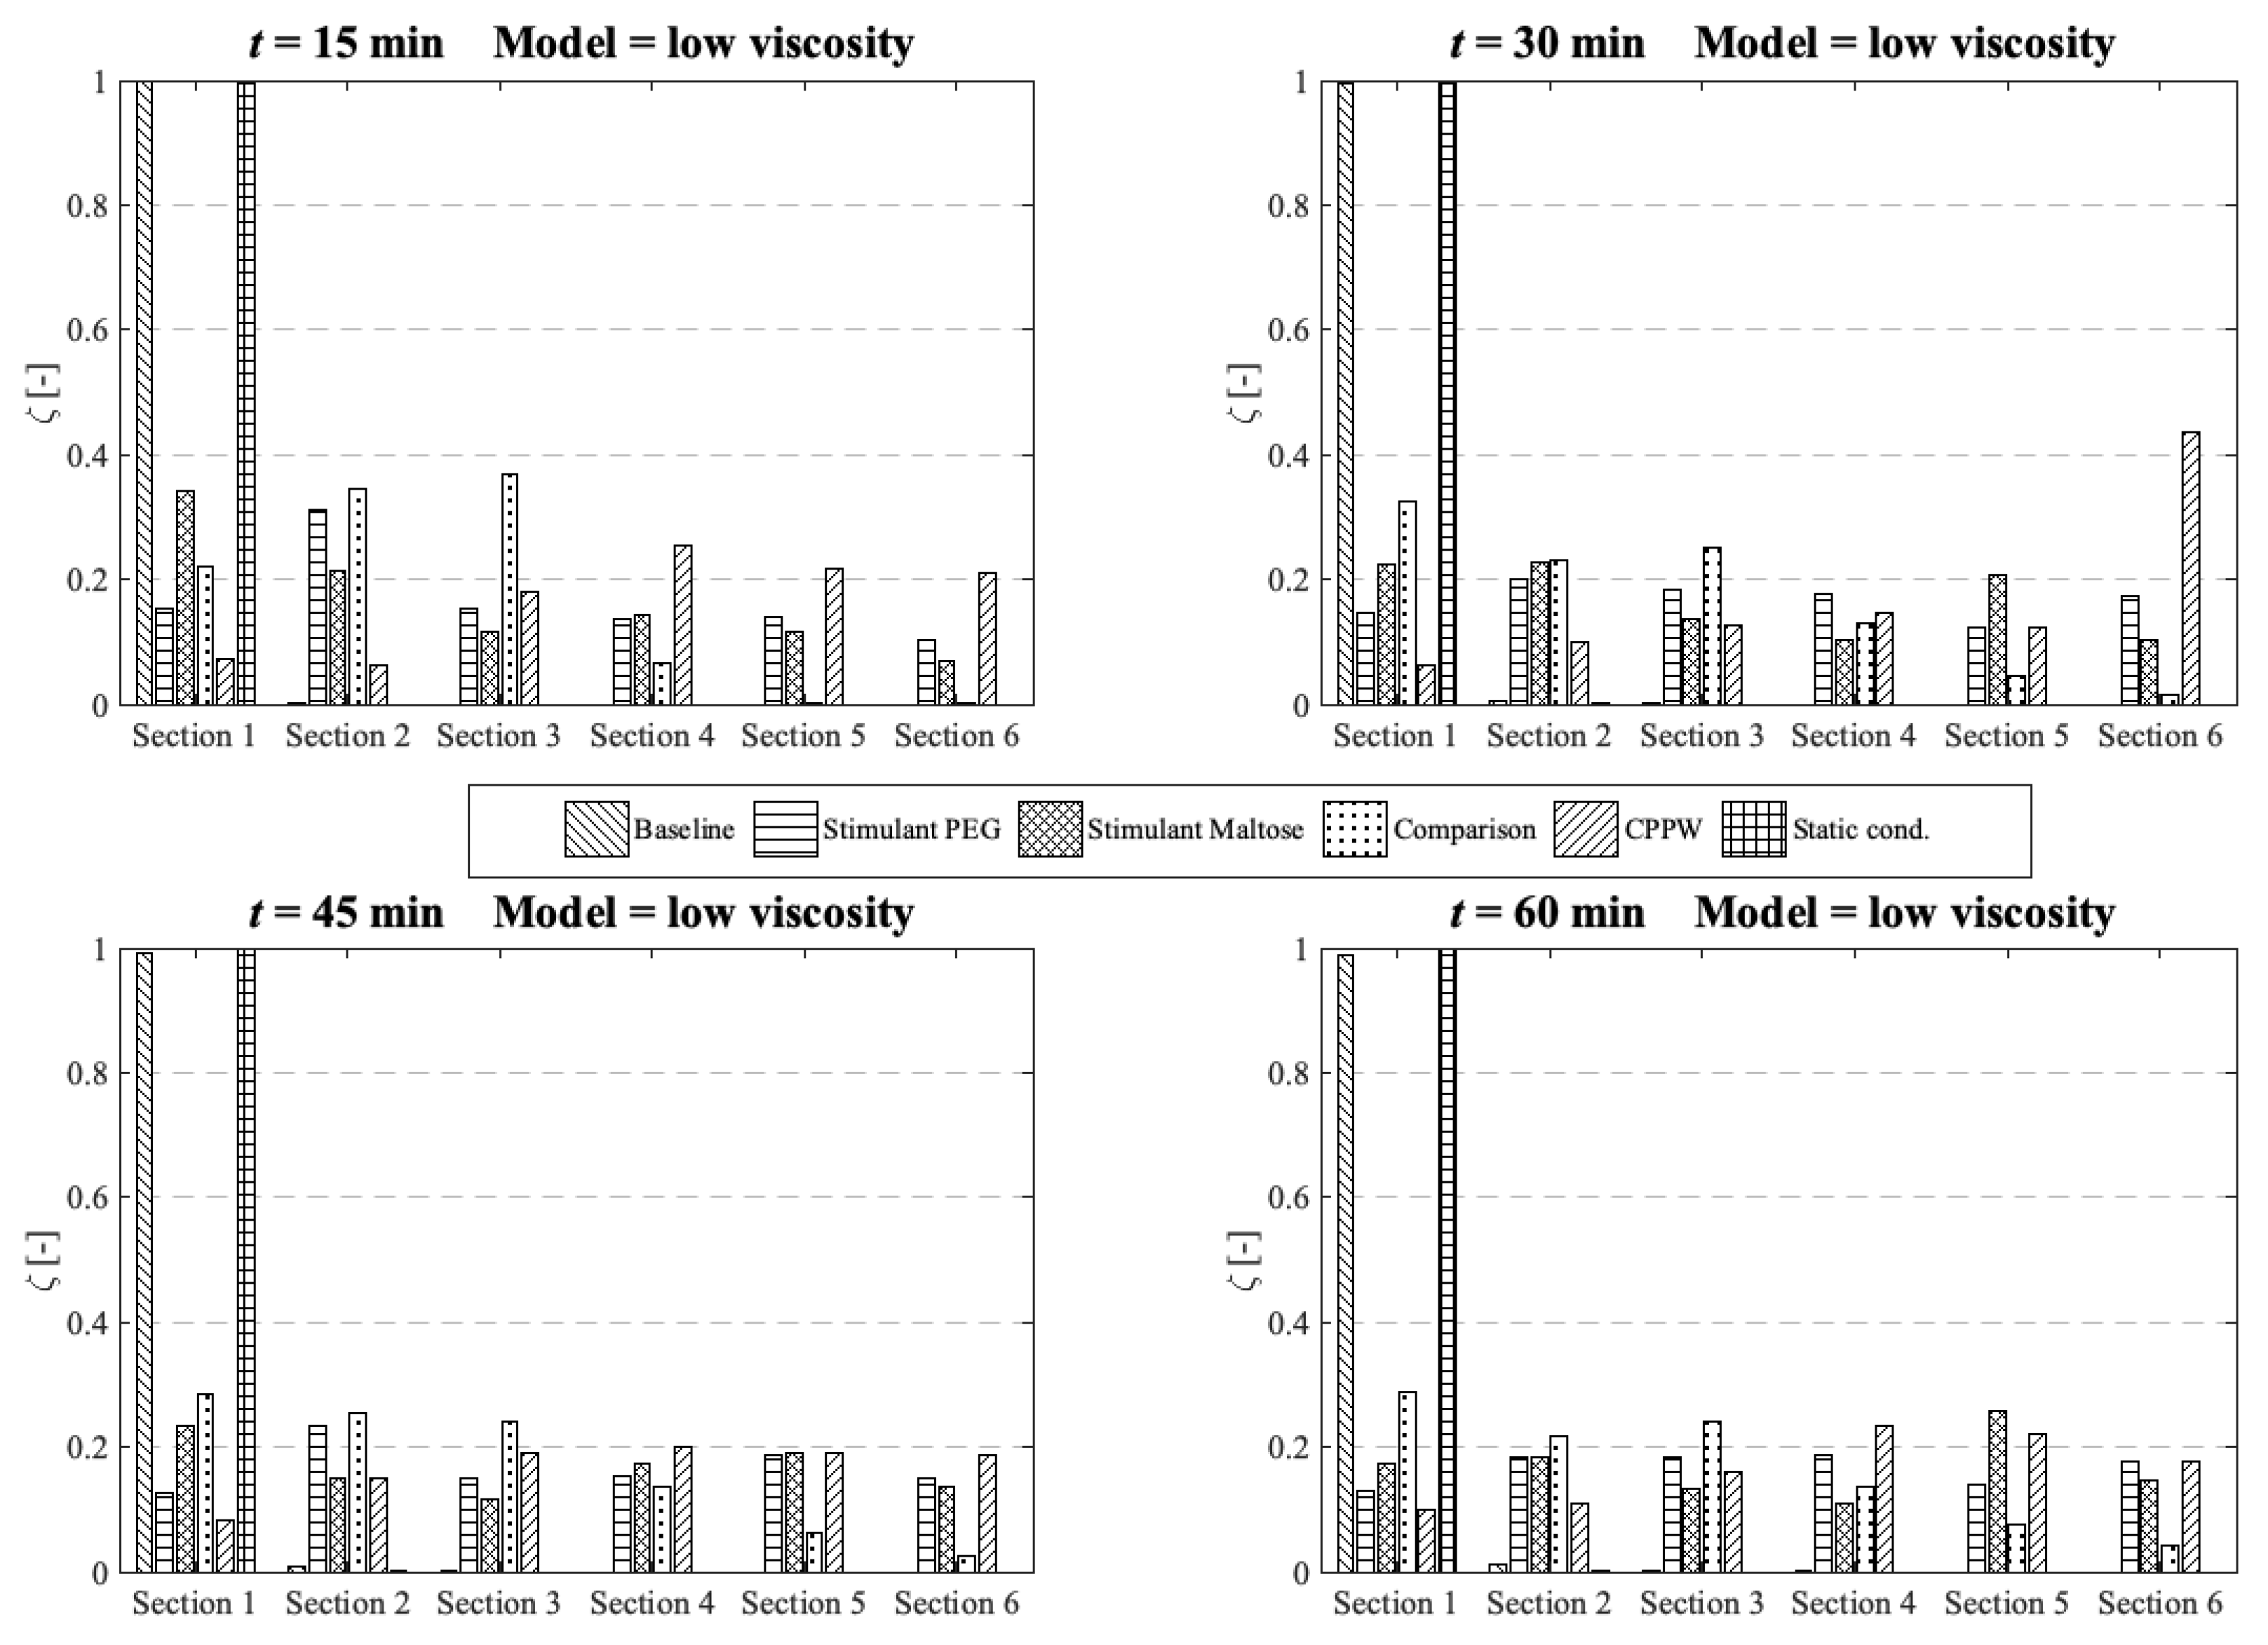
At low fluid viscosity (
Figure 10) the models: ‘Stimulant PEG’, ‘Stimulant Maltose’, ‘Comparison’ and the ‘CPPW’ model can distribute the API completely along the whole colon at
t = 60 min, but only the ‘Stimulant PEG’, ‘Stimulant Maltose’ and ‘CPPW’ models show a very uniform API distribution.
Figure 10.
Comparison of the different models in respect to the distribution of the API along the colon at four different times at low fluid viscosity conditions.
Figure 10.
Comparison of the different models in respect to the distribution of the API along the colon at four different times at low fluid viscosity conditions.
These are also the models which achieved the highest drug release from the tablet (
Figure 7). The ‘Comparison’ model is not as effective as the other three models in terms of API distribution, which means that in this model only a small part of the API reaches the last section at the end of the colon.
Since the wave in the ‘CPPW’ model only propagates in one direction (antegrade), the tablet is pushed to the end of the colon and dissolves there. Thus, the highest concentration in the course of the simulation (e.g., t = 30 min) is found at the end of the model. A backflow caused by the wave prevents the accumulation of the API at the end of the colon.
The ‘Baseline’ model is only able to transfer parts of the dissolved API into the sections one to four whereby the largest amount of dissolved API remains in the first segment.
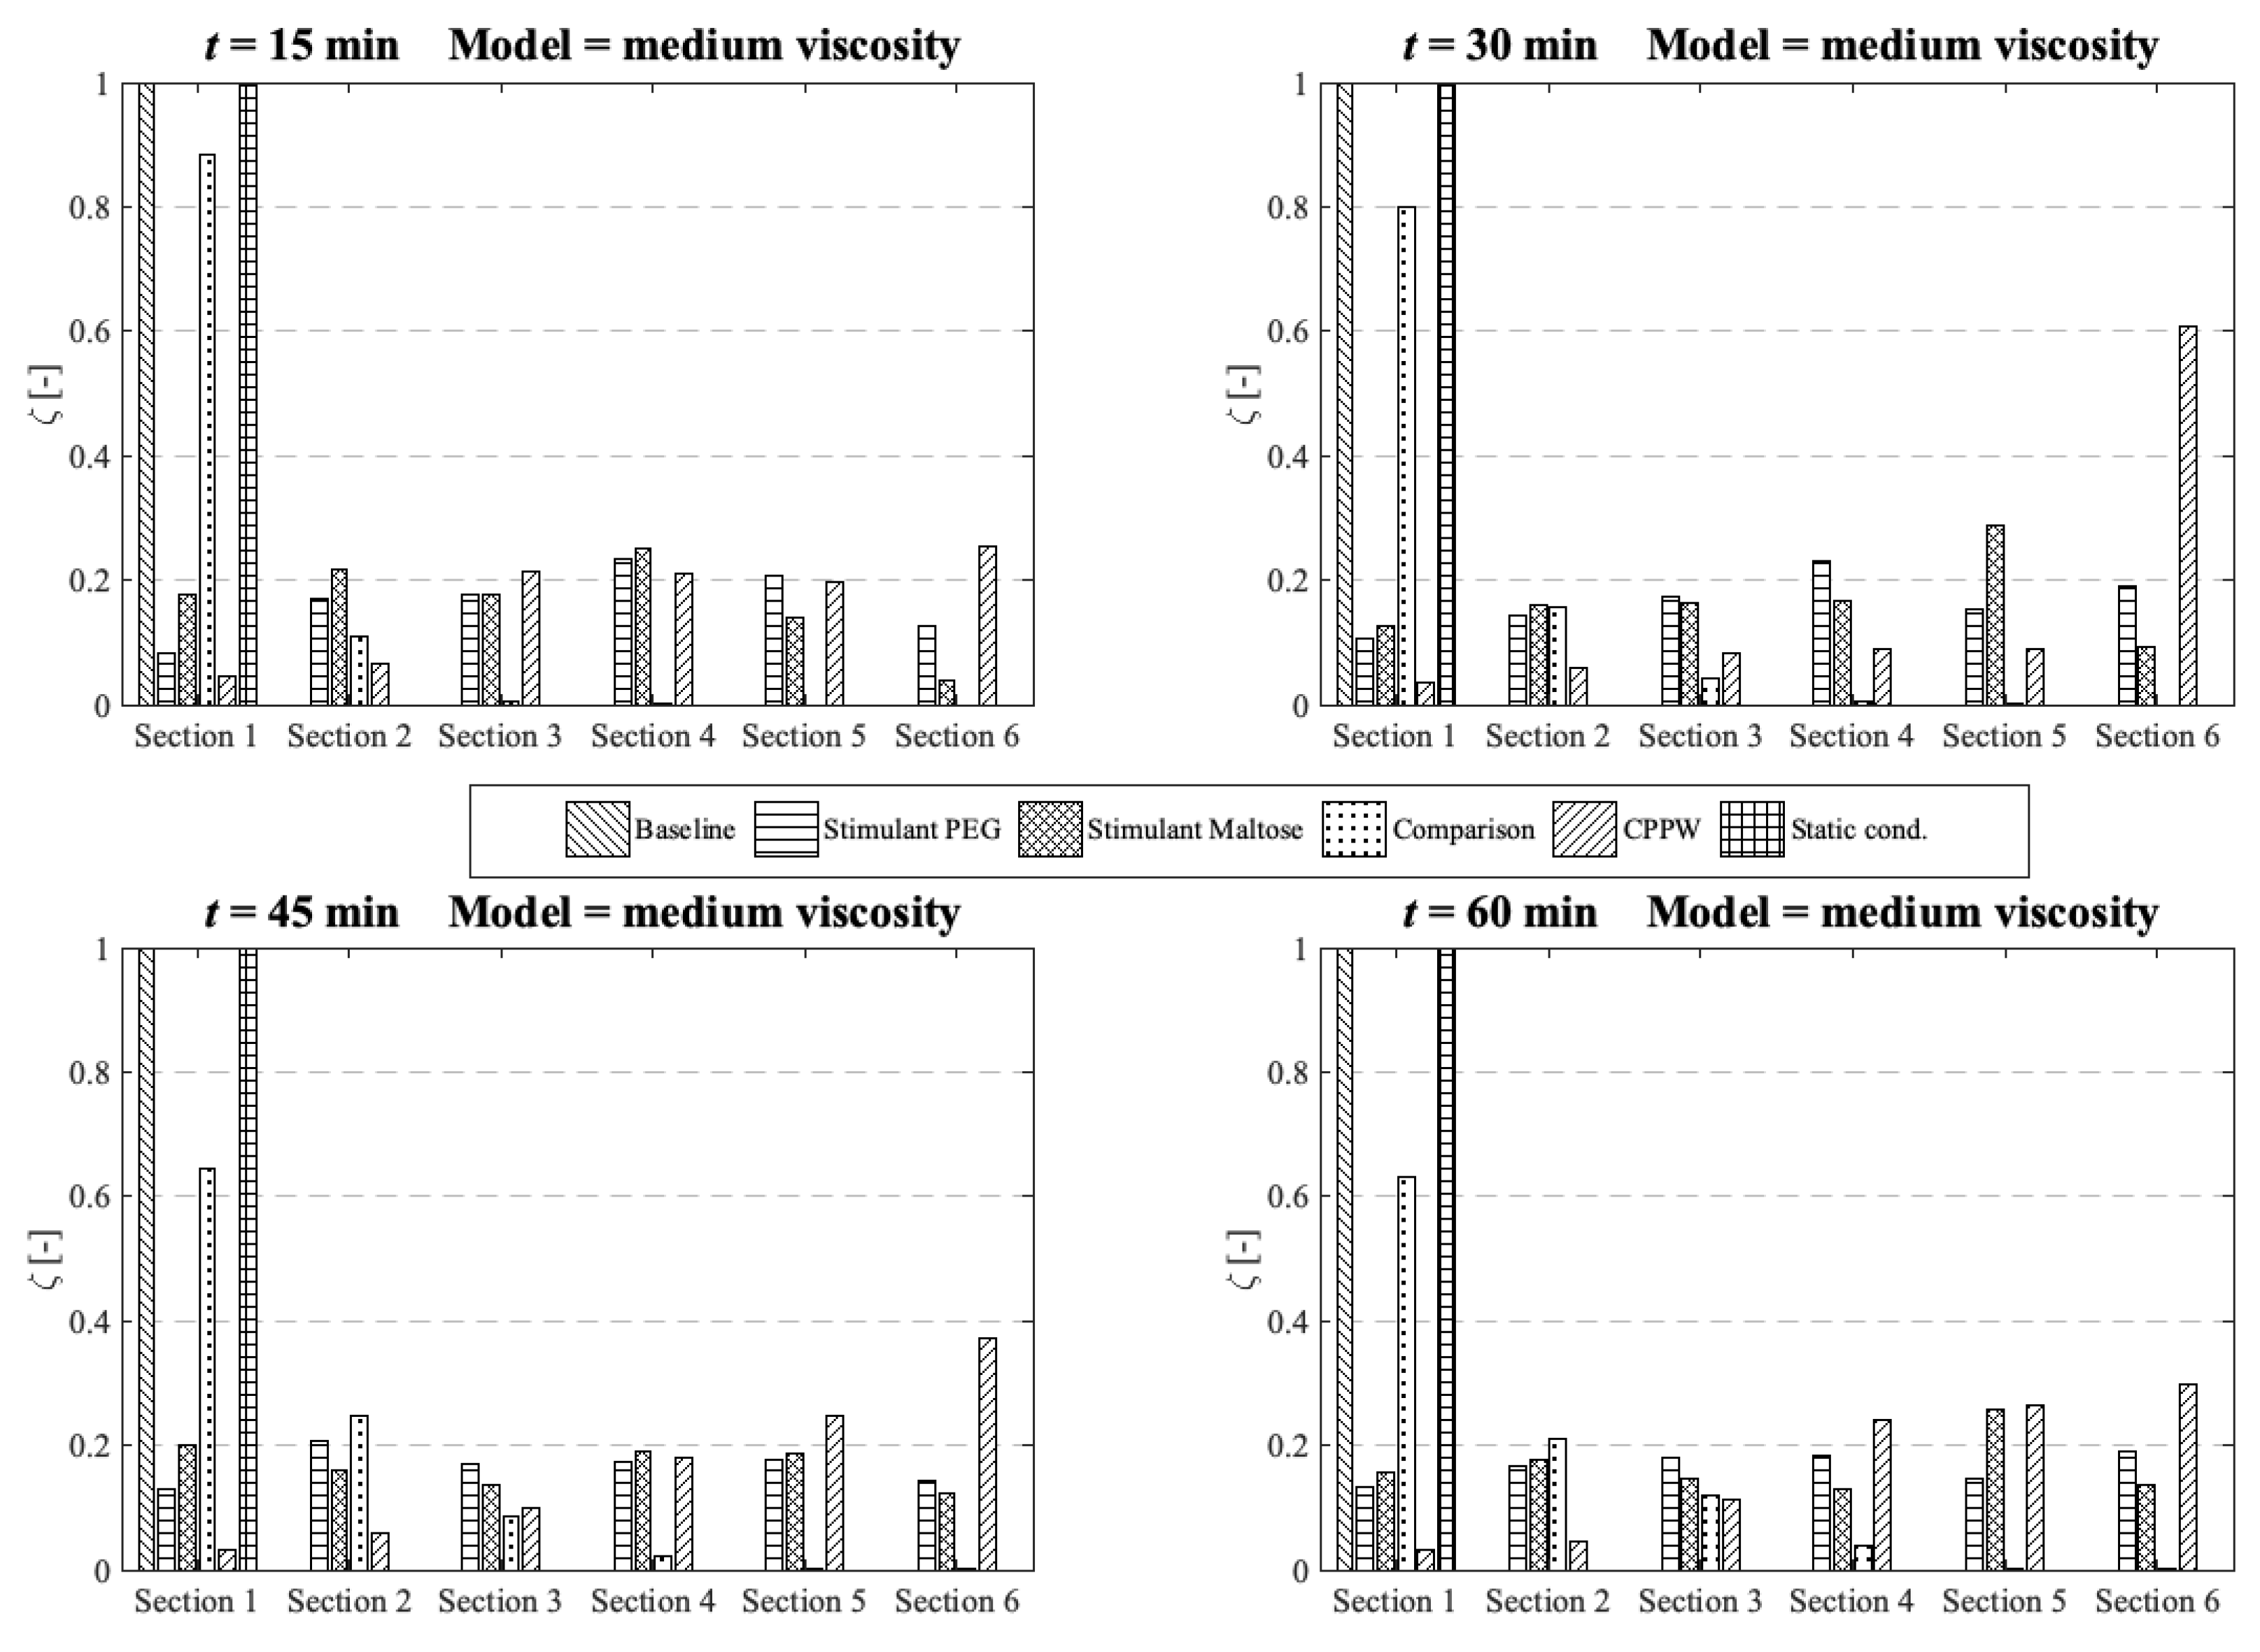
At medium fluid viscosity conditions (
Figure 11), at
t = 60 min, only the ‘Stimulant PEG’, ‘Stimulant Maltose’ and ‘CPPW’ models distribute a notable portion of API along the entire colon.
Figure 11.
Comparison of the different models in respect to the distribution of the API along the colon at four different times at medium fluid viscosity conditions.
Figure 11.
Comparison of the different models in respect to the distribution of the API along the colon at four different times at medium fluid viscosity conditions.
In terms of uniform distribution of API across all segments, only the ‘Stimulant PEG’ and ‘Stimulant Maltose’ model show good results. As already seen at low viscosity conditions, in the ‘CPPW’ model the tablet is captured by the wave and pushed to the end of the colon where it dissolves. As the reflux is less pronounced at higher fluid viscosity conditions, at t = 60 min, the API accumulates in the last three sections of the colon. Nevertheless, the reflux generated in this model influences the mixing of the intestinal contents. By extending the simulation time, the reflux would very likely lead to an even API distribution along the colon. At the end of the simulation time, the ‘Comparison’ model is capable to distribute a notable amount of dissolved API across the first four segments, whereas the largest fraction remains in the first segment. The ‘Baseline’ model is not even capable to move a fraction of the dissolved API in the neighbouring segment.
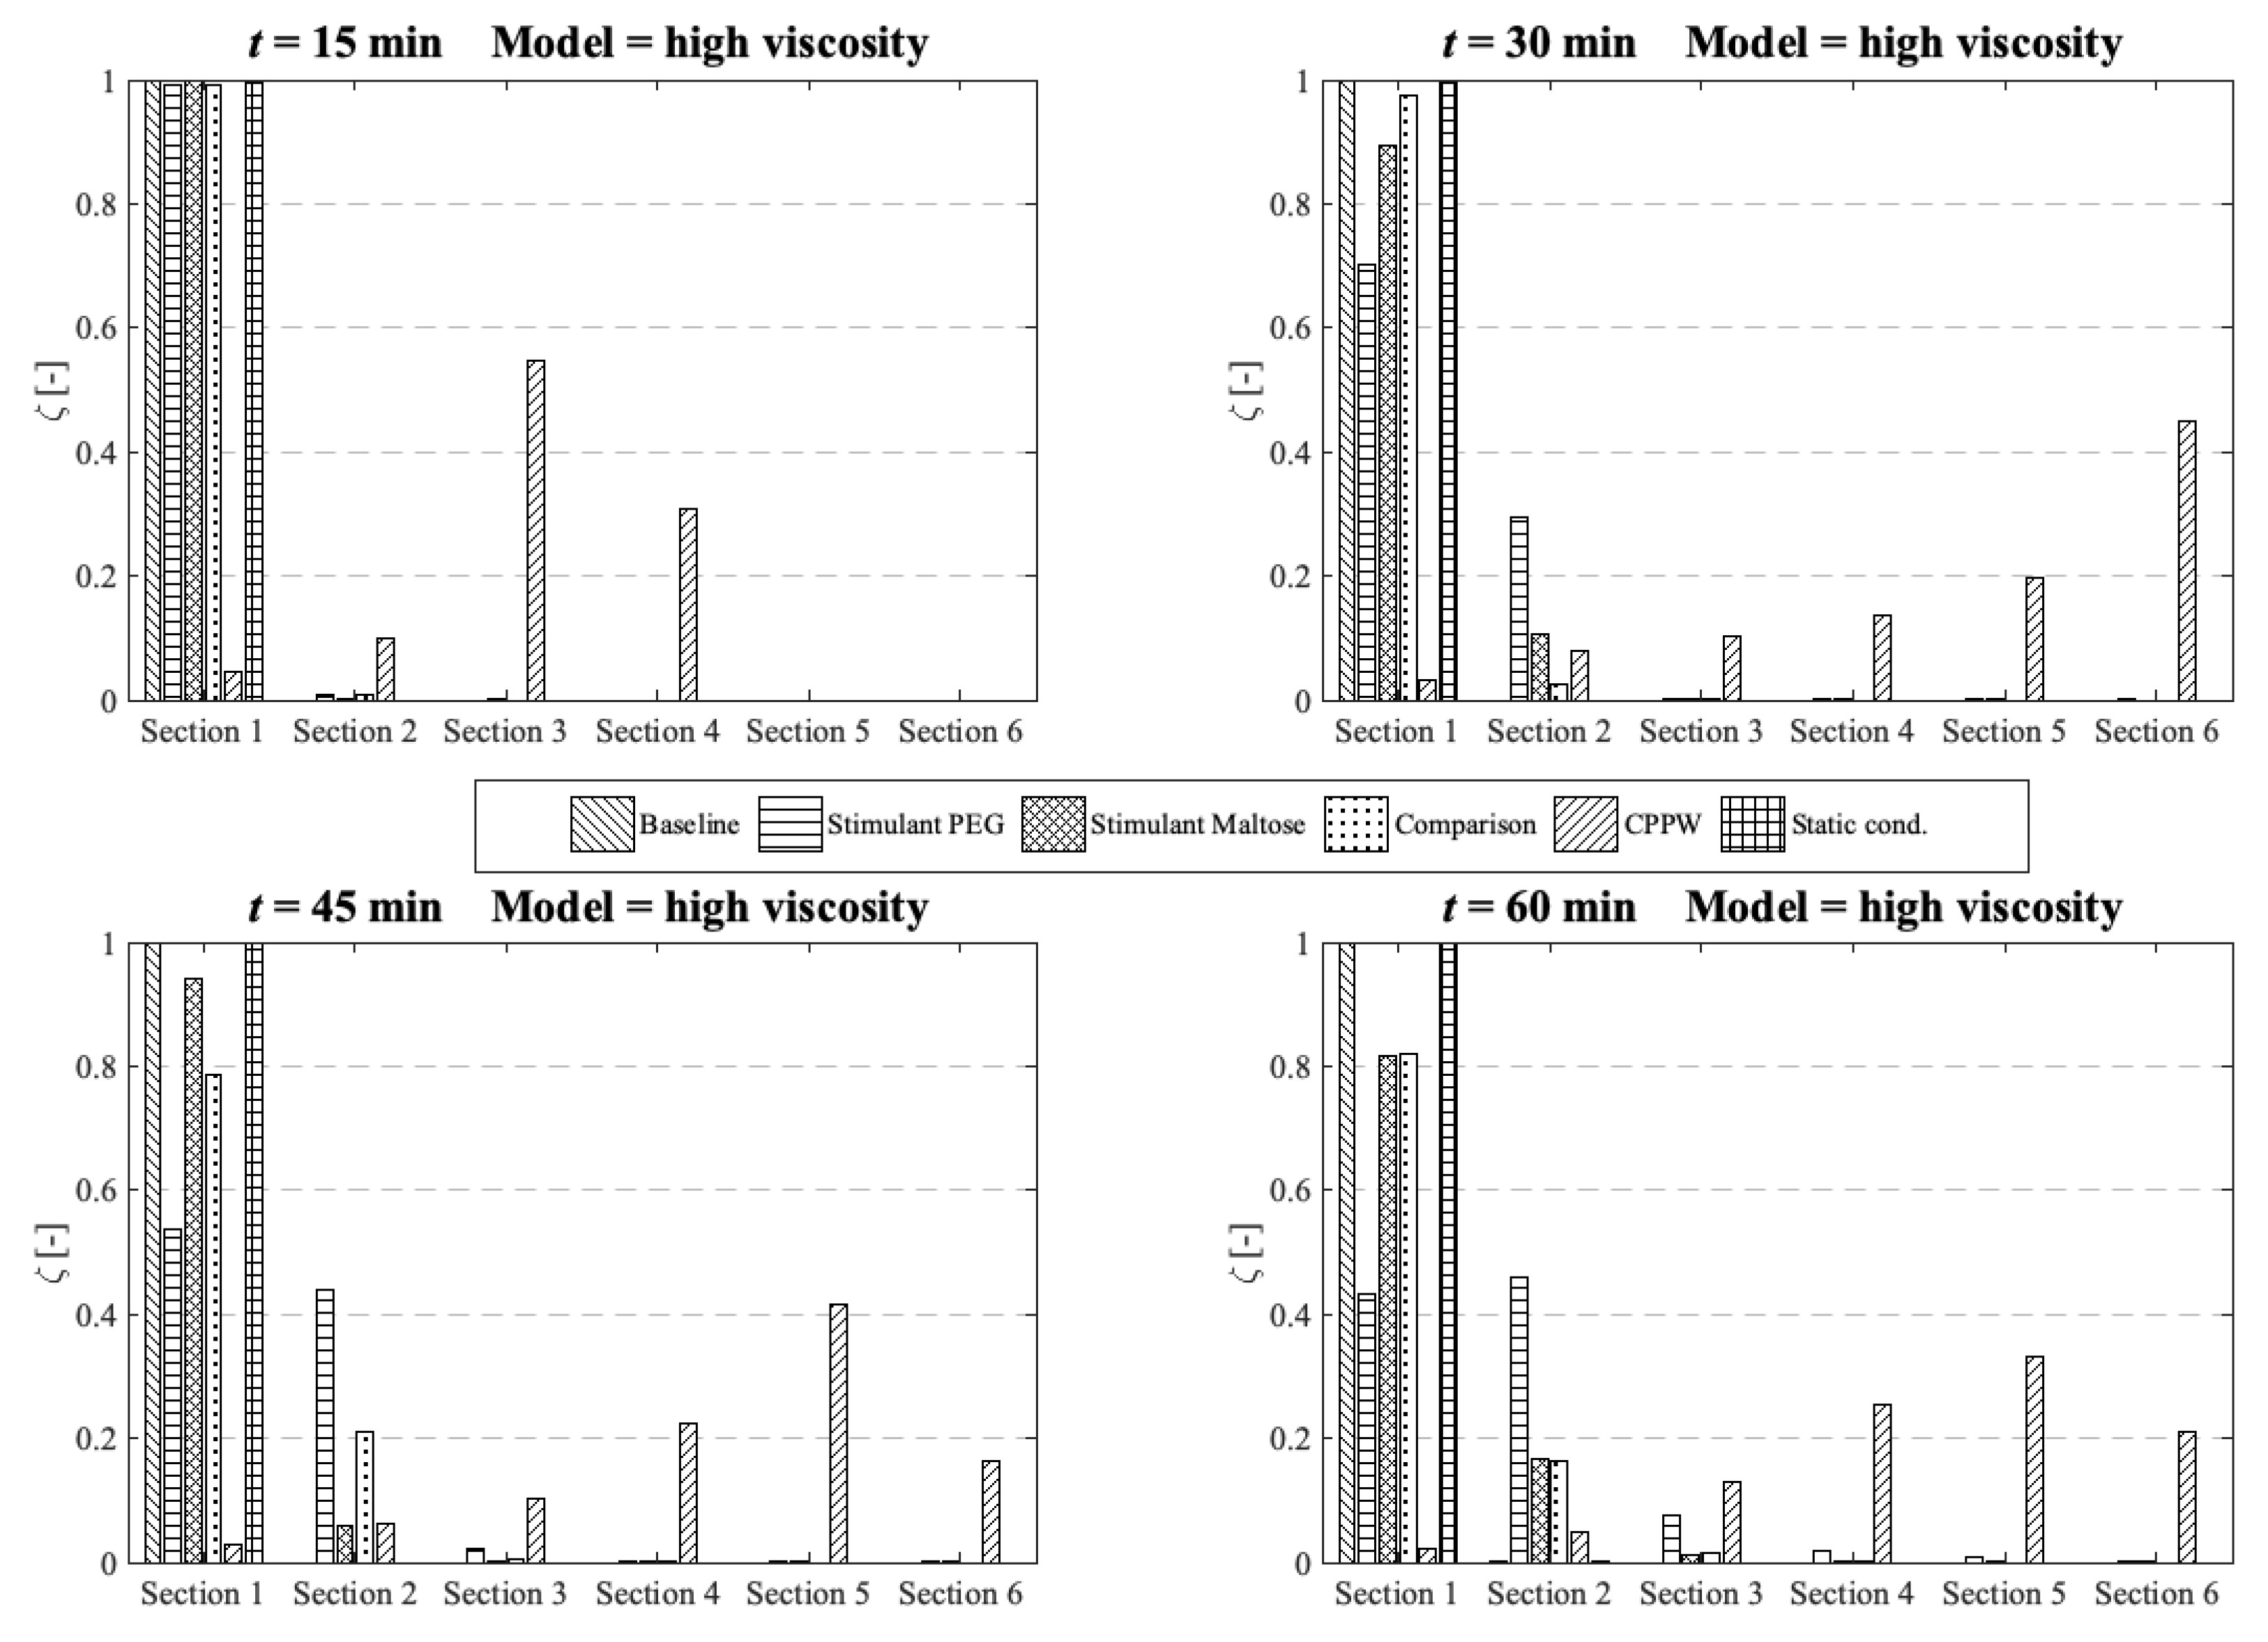
In the case of high fluid viscosity conditions (
Figure 12), only the motility pattern of the ‘CPPW’ model can distribute a significant amount of dissolved API across all segments.
Figure 12.
Comparison of the different models in respect to the distribution of the API along the colon at four different times at high fluid viscosity conditions.
Figure 12.
Comparison of the different models in respect to the distribution of the API along the colon at four different times at high fluid viscosity conditions.
As expected, the motility pattern of the ‘Baseline’ model does not distribute the dissolved API. The ‘Comparison’ model moves some dissolved API in segment two to four, but a notable amount is only found in segments one to three. The ‘Stimulant Maltose’ model is comparable with the ‘Comparison’ model with the small difference that the ‘Stimulant Maltose’ model also distributes a very small amount of API into segments five and six. The relative amount of API in sections one to three is in both models almost the same. The ‘Stimulant PEG’ model can move a significant amount of dissolved API into the second segment and still a small but noteworthy amount into the third and fourth segment. The API amount in segment five and six is very small, but still, a very small amount reaches these segments.
The results show that the effectiveness of the motility pattern in terms of API distribution along the colon is highly dependent on the viscosity of the intestinal content. Contrary to the assumption that the motility pattern with the highest average shear stress automatically indicate the fastest drug release rate, the motility pattern that provokes frequent single shear stress peaks seem to be more effective in achieving a higher drug release rate. Another important parameter in terms of tablet drug release is the position of the tablet and the motility pattern itself. To achieve a faster tablet drug release compared to pure diffusion (‘Static’ model), the tablet must be in a region in which it can be caught by the motility pattern. When we compare the three different motility patterns found in [
13,
14,
39] in terms of their performance in drug release and drug distribution, the parameters described above play a crucial role. The motility pattern shows different performances in terms of tablet drug release and also in terms of the distribution of the dissolved drug. The motility pattern of the ‘Baseline’ model is extensively ineffective compared to the other two motility pattern found. The motility patterns of the ‘Stimulant PEG’ and ‘Stimulant Maltose’, on the other hand, show very similar performances in terms of tablet drug release. The motility pattern ‘Stimulant PEG’ seems to be marginally more efficient in terms of drug distribution along the colon at higher viscosities.
The ‘Baseline’ motility pattern is the most predominant environment in a healthy human. As shown in the results, at higher fluid viscosities, the ‘Baseline’ motility pattern is not able to induce any influential fluid motion that would significantly affect the disintegration/drug release process. This biorelevant knowledge cannot be easily assessed with compendial disintegration/dissolution apparatuses which makes the in silico model valuable. From the results, it can deduce that care should be taken for the formulation design to mitigate prolong and/or partial disintegration/drug release.
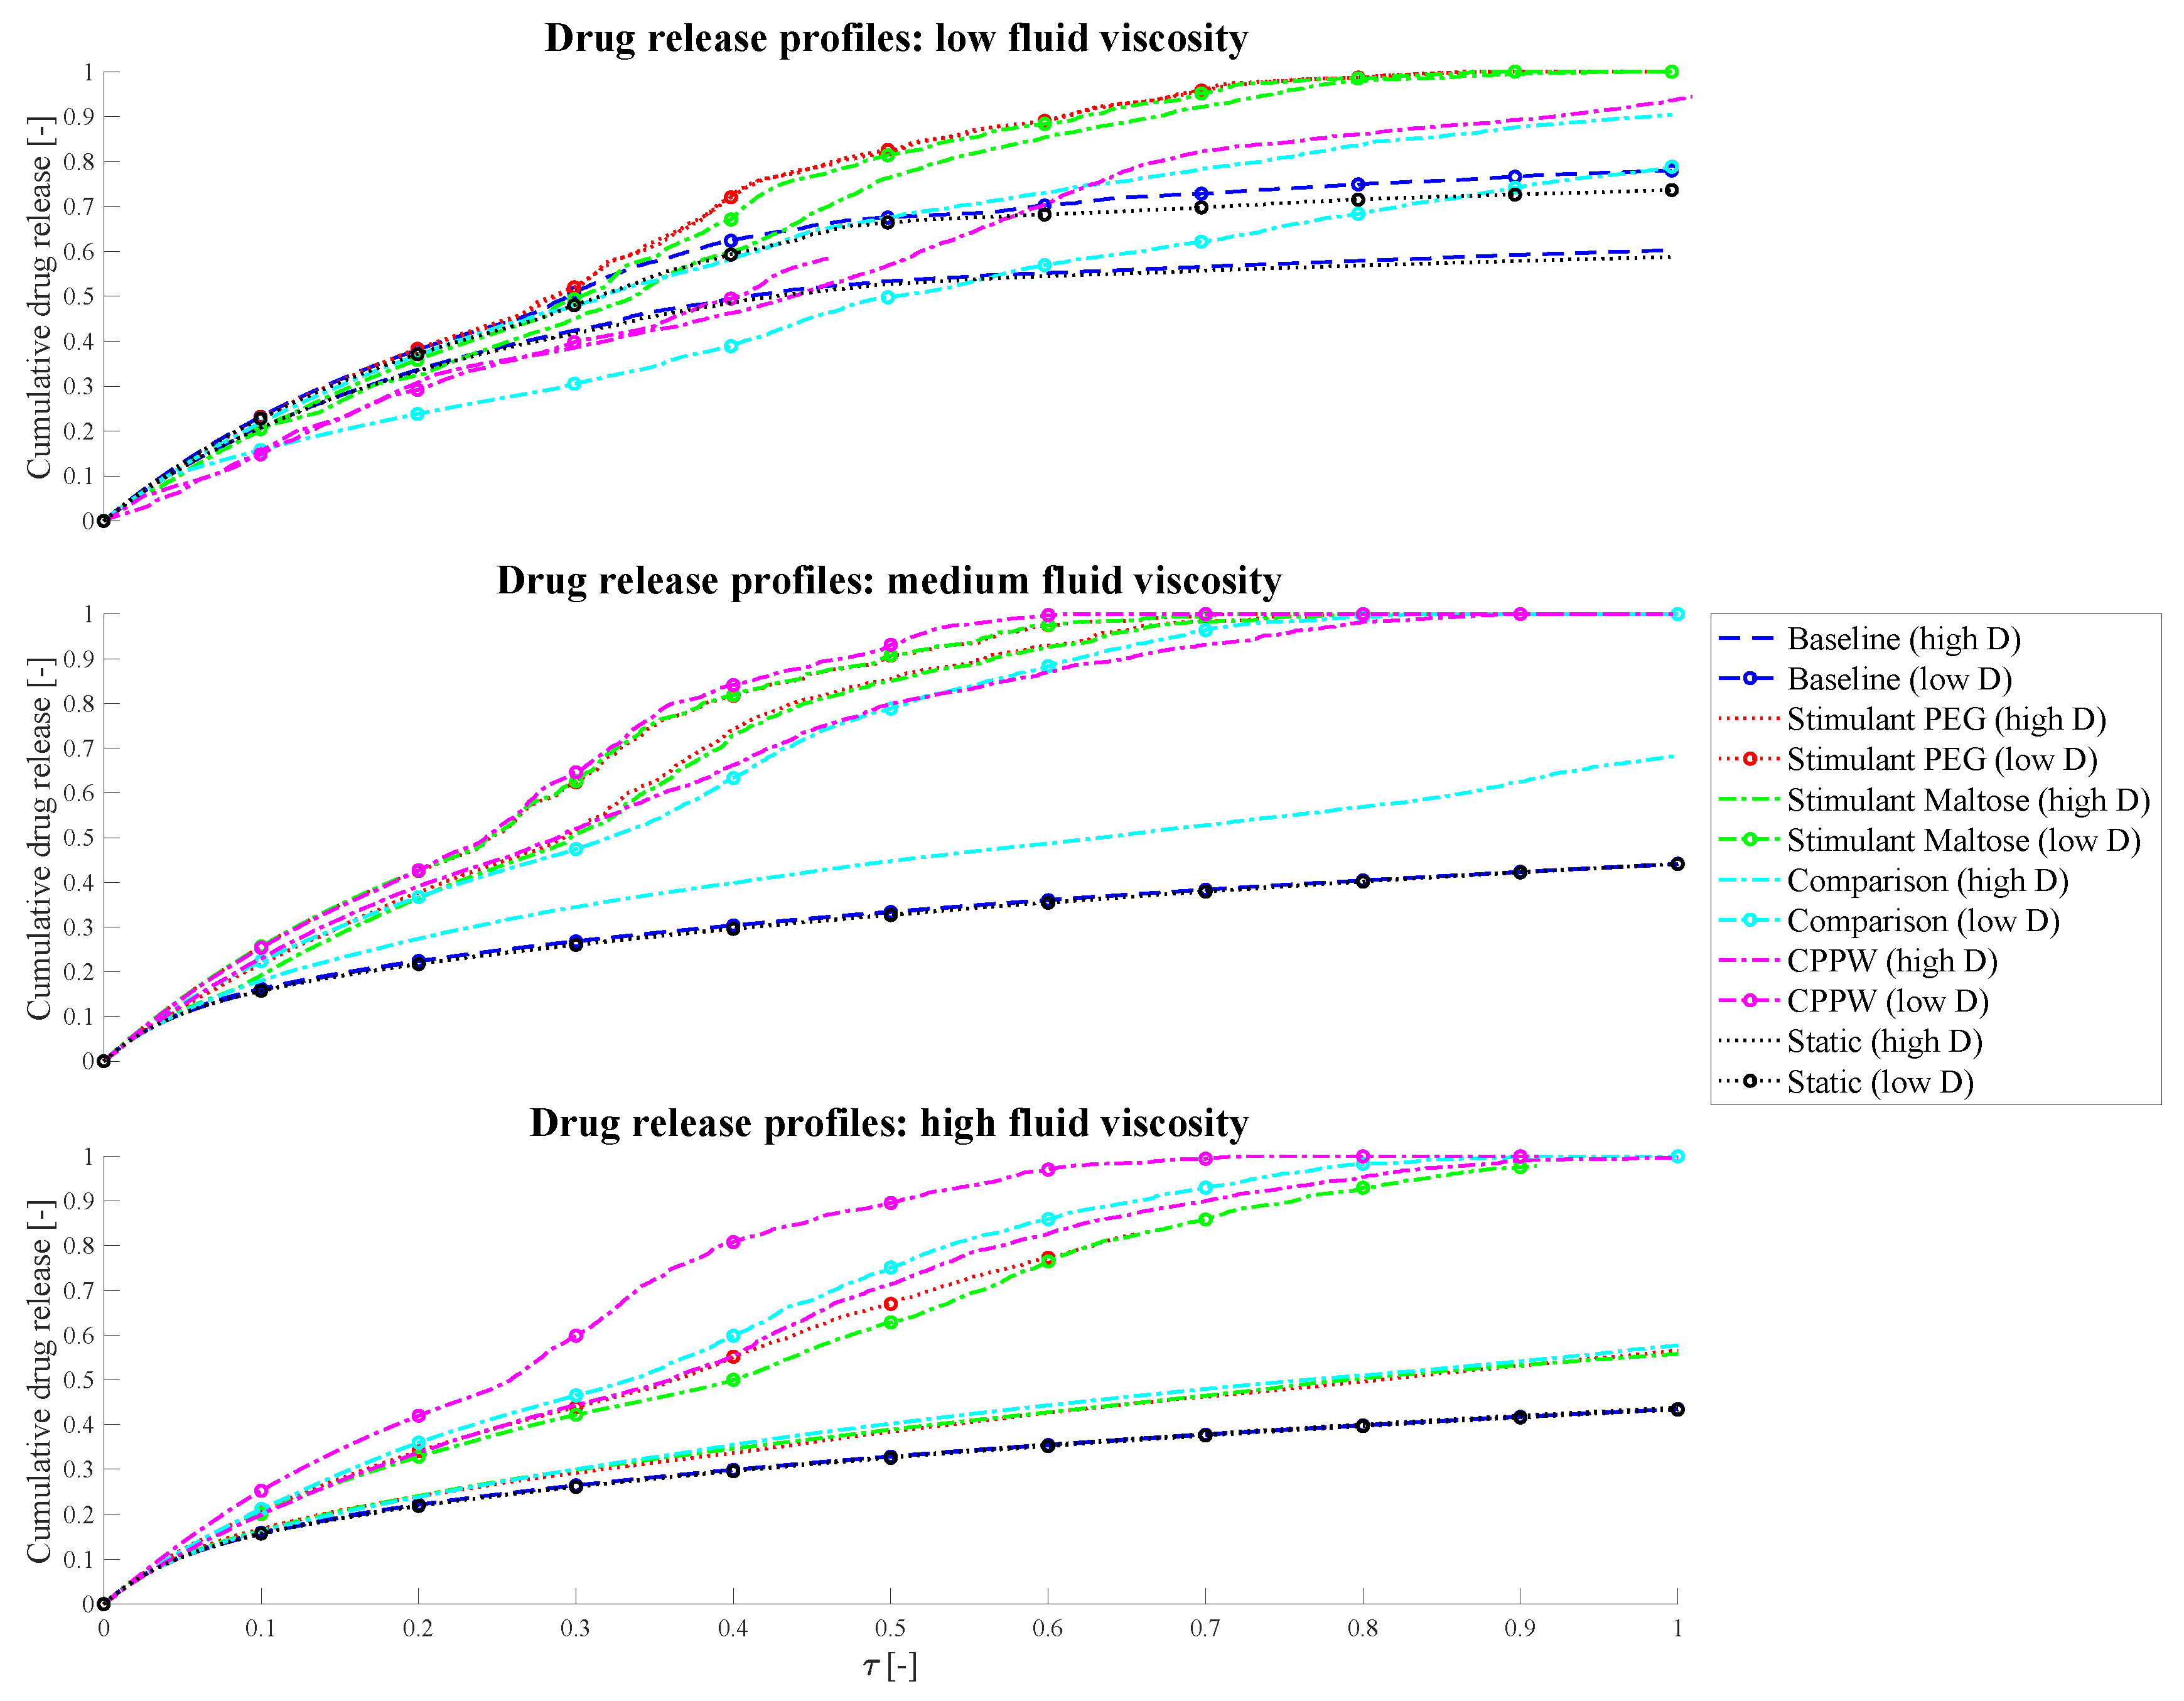
3.3. Influence of the Diffusion Coefficient on the Drug Release from Tablet
As mentioned above, the required computational time is significantly higher when a lower diffusion coefficient is used, and complete drug release of the tablet is aimed for—at least for some motility patterns. Additionally, the tablet should dissolve in about one hour, which is not achievable with a low diffusion coefficient.
To estimate the impact of diffusion coefficients that differs by one order of magnitude on the drug release process in the models used in this study, we performed a dimensional analysis of the system and additionally ran simulations of each model for 10 days, regardless of how much time can be simulated in that period—this also varies from model to model. For this reason, the drug release profiles/results represented in
Figure 13 may not show results for the entire time axis.
Figure 13.
Comparison of the influence of different diffusion coefficients on the drug release profiles, where ‘high D’ represents the drug release profile of the high diffusion coefficient and ‘low D’ the drug release profile of the low diffusion coefficient simulation.
Figure 13.
Comparison of the influence of different diffusion coefficients on the drug release profiles, where ‘high D’ represents the drug release profile of the high diffusion coefficient and ‘low D’ the drug release profile of the low diffusion coefficient simulation.
However, the target simulation time was 10 h (i.e., also one order of magnitude higher than in the case of high diffusion coefficient used). Results from the dimensional analysis confirm that it is possible to compare disintegration/dissolution profiles between different diffusion coefficients by proportionally rescaling time. Further detail of the analysis can be found in
Appendix A. From the dimensional analysis, it can be obtained that the differences of the curves shown in
Figure 13 are resulting from the fluid dynamics in the colon as the diffusion coefficient and time are scaled proportionally.
The different models (motility pattern) and different diffusion coefficients are compared based on dimensionless time (Equation (22)).
In the simplest case, which is the ‘Static’ model, the drug release profiles coincide at medium and high fluid viscosities very well, which should be the case as the diffusion and time are proportional. In the case of low fluid viscosity, the drug release profiles are slightly different but show almost parallel curves. In this case, even if there is no fluid movement, the tablet can move very slightly, especially when it releases drug particles and the size of the tablet changes. These very small movements can result in a very small amount of advection in addition to diffusion and cause the difference in drug release profiles. As soon as a fluid motion occurs, introduced by the different motility pattern, the driving parameter in terms of drug release is very much dependent on the position of the tablet and on how the accelerated fluid can reach the tablet. At low fluid viscosity conditions, the tablet tends to be pushed to the surface of the fluid which slows down the drug release rate and consequently the dissolution rate. This phenomenon can especially be recognised in the ‘Comparison’ model, where a higher drug release can be achieved at higher diffusion coefficient conditions. In the case of a lower diffusion coefficient but longer simulation time, the worst case with regard to drug release has occurred. The tablet is pushed to the surface of the fluid and additionally into a region where the fluid circulation is quite low. Even the fact that significantly more fluid movement can be achieved in 10 h compared to 1 h, and thus the drug release rate should be higher with lower diffusion coefficients, is not given in this case. Here, diffusion is the driving parameter. The increased proportion of advection, due to prolonged fluid movement, in addition to pure diffusion is particularly well seen in the models with higher fluid viscosities. Here, in all cases, a higher or/and faster relative drug release could be achieved with lower diffusion and longer simulation time compared to the case of the higher diffusion coefficient and shorter simulation time.
3.4. Strengths and Limitations of the Model
The strengths of the model include that the anatomy, fluid volumes and motility patterns are informed by robust clinical data. The model presented within this paper is capable of simultaneously capturing data on drug dissolution and distribution within the ascending colon under a range of motility patterns and fluid viscosities. Generation of such data in vivo is complex due to the relative inaccessibility of the ascending colon plus the complexity in controlling either fluid viscosity or motility. However, it is recognised that validation of the model against clinical data would offer great benefits in demonstrating the utility of the model.
In the absence of clinical data that directly replicates observations in the model correlations have been sought from the most relevant literature to demonstrate the utility of the developed model. A comparison of 5-ASA pharmacokinetics in healthy adults; adults with CD and adults with UC showed that the time to reach the colon was faster with greater overall exposure for the diseased patients compared to the healthy controls [
55]. This increased exposure is likely to be due to a combination of factors: an increase in permeability due to the inflamed mucosa or the reduction in viscosity of the colonic fluids in patients with CD or UC or the greater frequency of propagating contractions in the colon [
56,
57]. The impact of reduced viscosity and greater frequency of contractions provides consistency with our model. The regional colonic distribution of material has been shown to differ between healthy adults and those with UC where those with UC had a significantly lower percentage in the left side of the colon compared to controls [
58]. The rapid transit observed in UC as a result of greater motility would explain these data, which is consistent with the findings from our model.
The rapid distribution of material within the ascending colon was demonstrated in a paper using scintigraphy to visualise mesalamine microspheres where complete distribution was observed within 30 min of entry to the ascending colon [
59] which is consistent with the low viscosity scenario presented within our model.
Thorpe et al. [
60], using a dynamic model of colonic concentrations that mimics published transit time data, reported that the distribution of 5-ASA within the colon was shown to change in response to a change in motility patterns with reduced motility resulting in higher concentrations of 5-ASA [
60] which is also consistent with data from our model. This work considered a simple immediate release formulation as a first step in the development of the model. Future work will include evaluation of alternative formulations that target the colon, particularly formulations where clinical data is available so that the output can be compared to the existing clinical data.


 ,
, 


