Author Contributions
Conceptualization, M.R. and M.S.; methodology, M.R. and M.S.; software, M.R.; validation, M.R., A.N.K. and M.S.; formal analysis, M.R.; investigation, M.R.; resources, M.S.; data curation, M.R. and A.N.K.; writing—original draft preparation, M.R.; writing—review and editing, M.R., M.S., A.N.K. and K.R.; visualization, M.R. and A.N.K.; supervision, M.S. and M.R.; project administration, M.S.; funding acquisition, K.R. All authors have read and agreed to the published version of the manuscript.
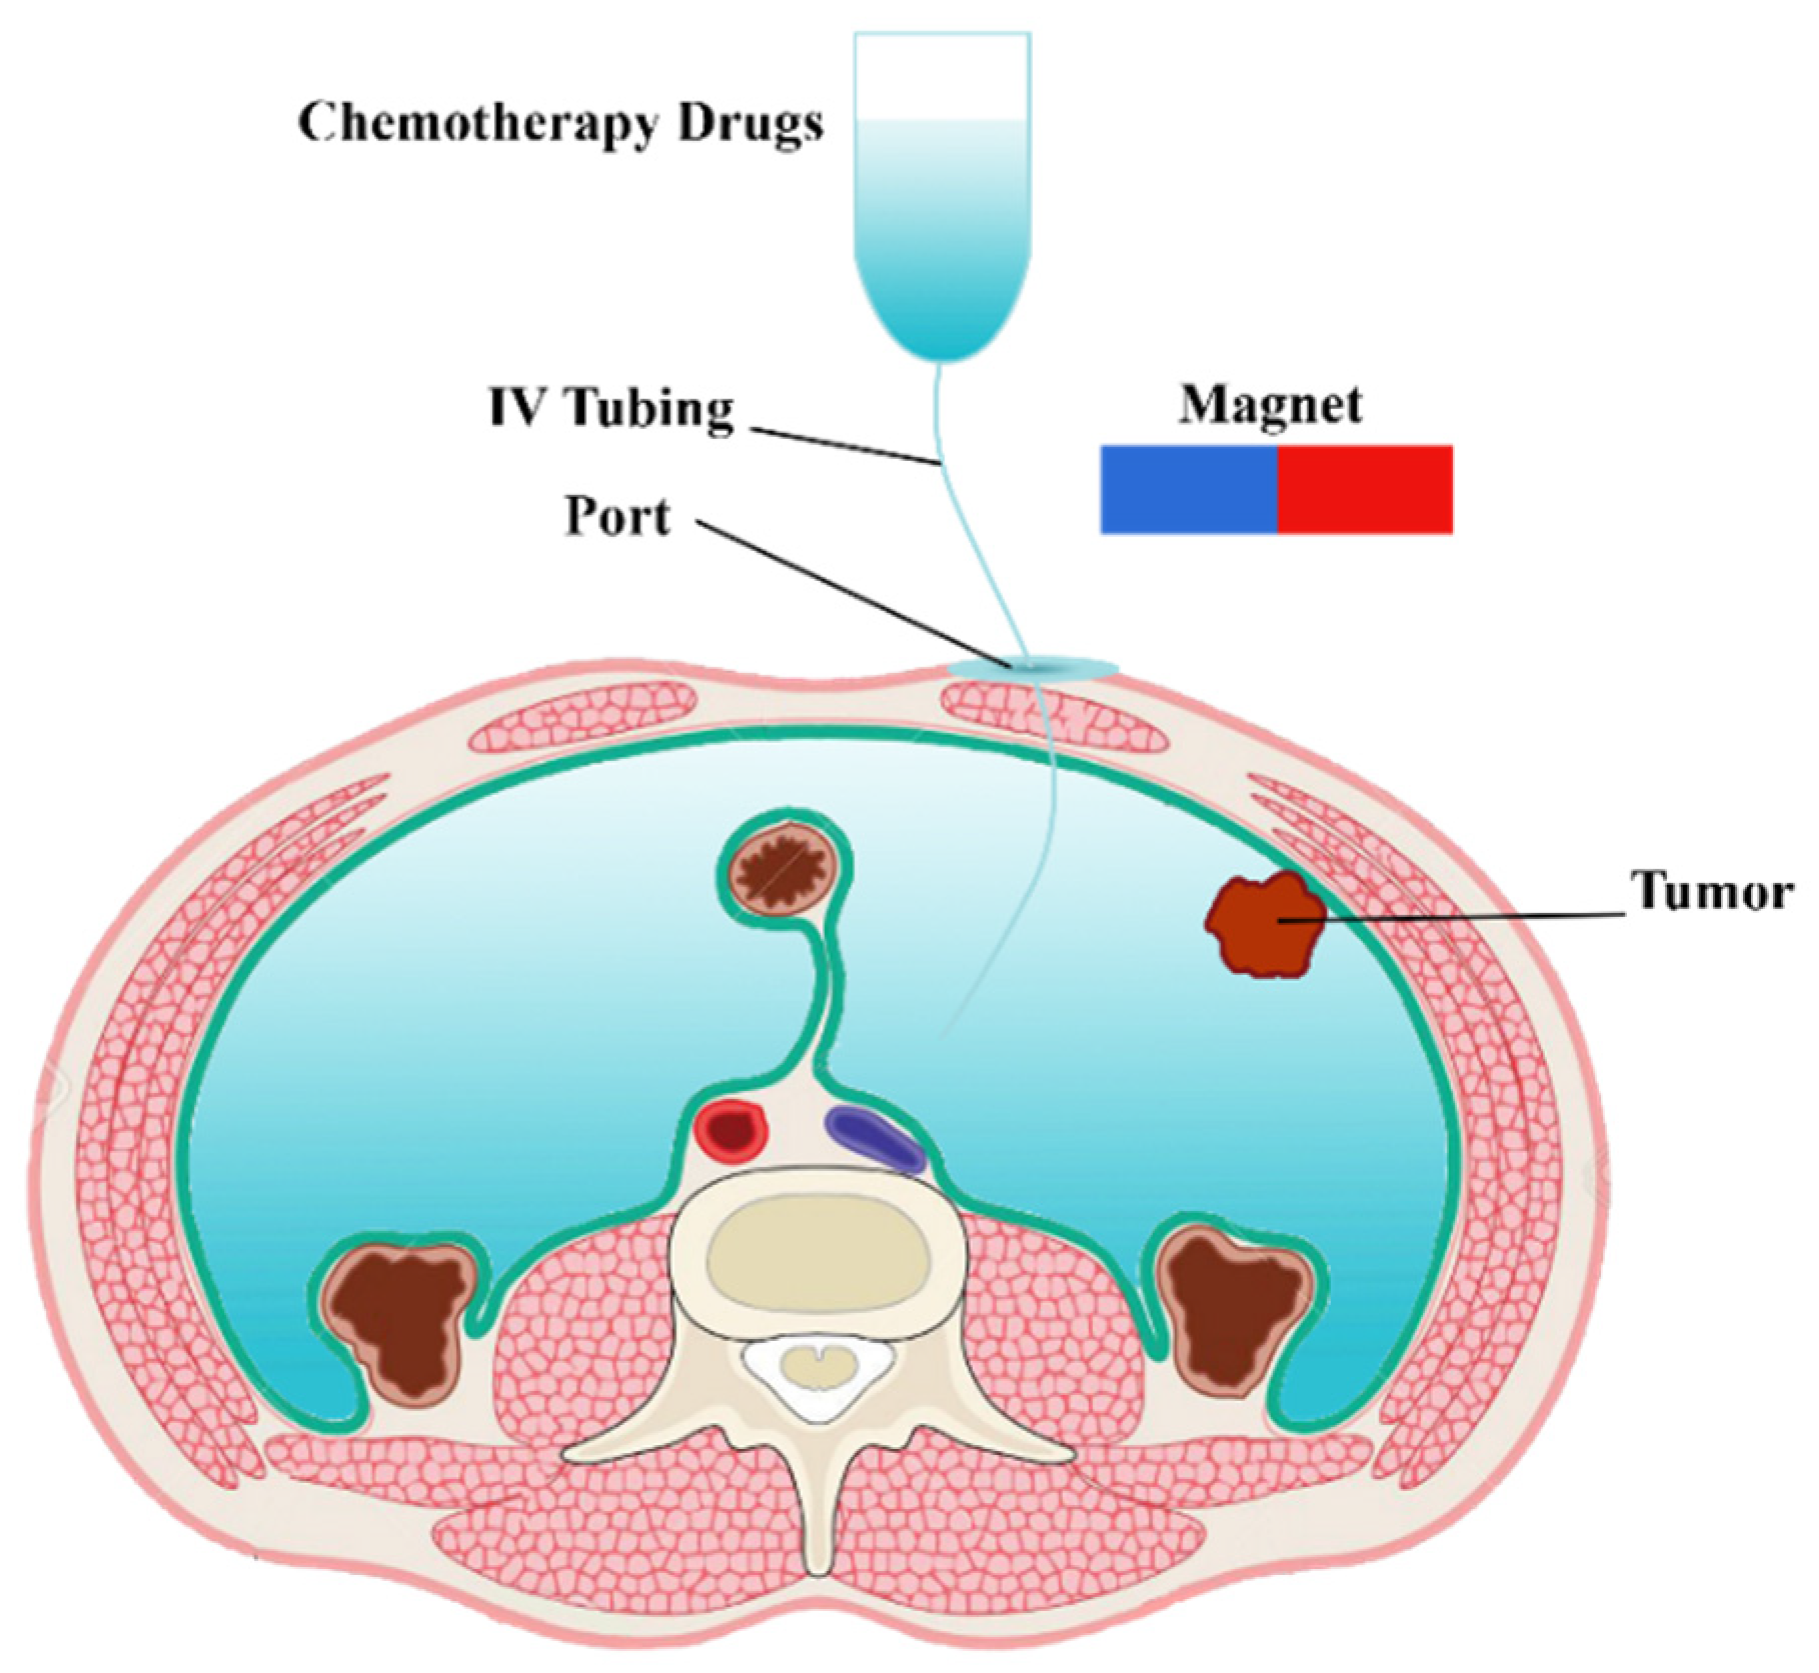
Figure 1.
Schematic of a magnetically controlled IP drug targeting system.
Figure 1.
Schematic of a magnetically controlled IP drug targeting system.
Figure 2.
Schematic of the geometry of the magnetically controlled IP drug targeting model.
Figure 2.
Schematic of the geometry of the magnetically controlled IP drug targeting model.
Figure 3.
Solution strategy for the magnetically controlled IP drug targeting model.
Figure 3.
Solution strategy for the magnetically controlled IP drug targeting model.
Figure 4.
IFP distribution in a tumor with a radius of 10 mm: (a) contour of IFP distribution in the tumor; (b) IFP distribution values along the tumor radius.
Figure 4.
IFP distribution in a tumor with a radius of 10 mm: (a) contour of IFP distribution in the tumor; (b) IFP distribution values along the tumor radius.
Figure 5.
IFV distribution in a tumor with a radius of 10 mm: (a) contour of IFV distribution in the tumor; (b) IFV distribution values along the tumor radius.
Figure 5.
IFV distribution in a tumor with a radius of 10 mm: (a) contour of IFV distribution in the tumor; (b) IFV distribution values along the tumor radius.
Figure 6.
Mean concentrations of the free drug (CF), bound drug (CB), and internalized drug (CI) versus time during 60 min of conventional IPC.
Figure 6.
Mean concentrations of the free drug (CF), bound drug (CB), and internalized drug (CI) versus time during 60 min of conventional IPC.
Figure 7.
Contours of the free, bound, and internalized drug concentrations after 60 min of treatment.
Figure 7.
Contours of the free, bound, and internalized drug concentrations after 60 min of treatment.
Figure 8.
(a) Mean concentration profiles of the free drug (CF), bound drug (CB), and internalized drug (CI) along the tumor radius after 60 min of treatment; (b) pie chart of the drug penetration area and untreated area of the tumor; (c) fraction of killed cells in the drug penetration area (FKPA) in terms of time over 60 min of chemotherapy by IP injection.
Figure 9.
Time profile of the mean concentrations of the free, bound, and internalized drug over 60 min of treatment with a magnetically controlled IP drug targeting system.
Figure 9.
Time profile of the mean concentrations of the free, bound, and internalized drug over 60 min of treatment with a magnetically controlled IP drug targeting system.
Figure 10.
Contours of the (a) free, (b) bound and (c) internalized drug concentrations 60 min after the start of treatment with a magnetically controlled IP drug targeting system.
Figure 10.
Contours of the (a) free, (b) bound and (c) internalized drug concentrations 60 min after the start of treatment with a magnetically controlled IP drug targeting system.
Figure 11.
(a) Diagram of the mean concentrations of free (CF), bound (CB), and internalized drug (CI) after 60 min; (b) killed cells fraction (FK) during 60 min of chemotherapy with intraperitoneal injection.
Figure 11.
(a) Diagram of the mean concentrations of free (CF), bound (CB), and internalized drug (CI) after 60 min; (b) killed cells fraction (FK) during 60 min of chemotherapy with intraperitoneal injection.
Figure 12.
Contours of the free drug concentration (CF) after 60 min of treatment with magnetically controlled IP chemotherapy for different nanoparticle radius: (a) 25 nm, (b) 50 nm, (c) 100 nm, (d) 200 nm, (e) 300 nm, (f) 400 nm, (g) 500 nm, and (h) 600 nm.
Figure 12.
Contours of the free drug concentration (CF) after 60 min of treatment with magnetically controlled IP chemotherapy for different nanoparticle radius: (a) 25 nm, (b) 50 nm, (c) 100 nm, (d) 200 nm, (e) 300 nm, (f) 400 nm, (g) 500 nm, and (h) 600 nm.
Figure 13.
Comparison of the mean concentrations of the free drug (CF) in the tumor over 60 min of treatment using magnetically controlled IP chemotherapy for different nanoparticle sizes.
Figure 13.
Comparison of the mean concentrations of the free drug (CF) in the tumor over 60 min of treatment using magnetically controlled IP chemotherapy for different nanoparticle sizes.
Figure 14.
Comparison of the mean concentration of free drug (CF) along the diameter of the tumor in the area with the maximum penetration depth after 60 min of treatment for different sizes of MNPs.
Figure 14.
Comparison of the mean concentration of free drug (CF) along the diameter of the tumor in the area with the maximum penetration depth after 60 min of treatment for different sizes of MNPs.
Figure 15.
Comparison of FKeff for different sizes of MNPs after 60 min of treatment.
Figure 15.
Comparison of FKeff for different sizes of MNPs after 60 min of treatment.
Figure 16.
Comparison of the mean concentration of free drug (CF) in the tumor after 60 min of treatment for different applied magnetic strengths.
Figure 16.
Comparison of the mean concentration of free drug (CF) in the tumor after 60 min of treatment for different applied magnetic strengths.
Figure 17.
Comparison of the mean CF values in the tumor over 60 min of treatment for different values of magnetic strengths.
Figure 17.
Comparison of the mean CF values in the tumor over 60 min of treatment for different values of magnetic strengths.
Figure 18.
Comparison of FKeff for different magnet strengths after 60 min of treatment.
Figure 18.
Comparison of FKeff for different magnet strengths after 60 min of treatment.
Figure 19.
Contours of the magnetic field (H) around the permanent magnet and in the solution area.
Figure 19.
Contours of the magnetic field (H) around the permanent magnet and in the solution area.
Figure 20.
Free drug concentration (CF) contours 60 min after IP injection using drug-coated MNPs at different distances between the magnetic source and the tumor center.
Figure 20.
Free drug concentration (CF) contours 60 min after IP injection using drug-coated MNPs at different distances between the magnetic source and the tumor center.
Figure 21.
The comparison of the mean concentrations of the free drug (CF) in tumors over 60 min treatment of IP chemotherapy using drug-coated magnetic nanoparticles at different distances between the magnetic source and the tumor center.
Figure 21.
The comparison of the mean concentrations of the free drug (CF) in tumors over 60 min treatment of IP chemotherapy using drug-coated magnetic nanoparticles at different distances between the magnetic source and the tumor center.
Figure 22.
Comparison of FKeff for different magnetic distances after 60 min of treatment.
Figure 22.
Comparison of FKeff for different magnetic distances after 60 min of treatment.
Figure 23.
Validation of interstitial fluid flow modeling: (a) IFP and (b) IFV.
Figure 23.
Validation of interstitial fluid flow modeling: (a) IFP and (b) IFV.
Figure 24.
Comparison of the concentration values in terms of penetration depth at 6 h after injection with the values obtained from the study by Au et al. [
50].
Figure 24.
Comparison of the concentration values in terms of penetration depth at 6 h after injection with the values obtained from the study by Au et al. [
50].
Table 1.
Parameters for tumor tissue.
Table 1.
Parameters for tumor tissue.
| Parameter | Definition | Unit | Value | References |
|---|
| Surface area of blood vessels per unit tissue volume | m−1 | 2 × 10⁴ | [42,43] |
| Hydraulic conductivity of the interstitium | m2·Pa−1·s−1 | 3 × 10⁻¹⁴ | [44,45] |
| Hydraulic conductivity of the microvascular wall | m·Pa−1·s−1 | 2.10 × 10⁻¹¹ | [44] |
| Vascular fluid pressure | Pa | 2.1 × 10³ | [42] |
| Osmotic pressure of the plasma | Pa | 2.7 × 10³ | [28] |
| Osmotic pressure of the interstitial fluid | Pa | 2 × 10³ | [28] |
| Average osmotic reflection coefficient for plasma proteins | - | 0.9 | [44] |
Table 2.
Solute transport parameters used in the simulation.
Table 2.
Solute transport parameters used in the simulation.
| Parameter | Definition | Unit | Value | References |
|---|
| Effective diffusion coefficient | cm2·s−1 | 3.40 × 10⁻⁶ | [46] |
| Microvessel permeability coefficient | cm·s−1 | 3.00 × 10⁻⁴ | [46] |
| Constant of the binding rate | M−1·s−1 | 1.5 × 10² | [25,47,48] |
| Constant of the unbinding rate | s−1 | 8 × 10⁻³ | [25,47,48] |
| Constant of the cell uptake rate | s−1 | 5 × 10⁻⁵ | [25,47,48] |
| Tumor volume fraction accessible to drugs | - | 0.3 | [9] |
| Concentration of cell surface receptors | M | 1 × 10⁻⁵ | [25] |
| Cancer cell survival constant | m3·mol−1 | 0.4938 | [40] |
Table 3.
Boundary conditions employed for the present model.
Table 3.
Boundary conditions employed for the present model.
| Boundary Conditions | Region |
|---|
| Concentration | Fluid Flow |
|---|
|
| The inner boundary of the tumor |
| | The outer boundary of the tumor |
Table 4.
Treatment evaluation parameters after 60 min of treatment with intraperitoneal injection by the traditional method.
Table 4.
Treatment evaluation parameters after 60 min of treatment with intraperitoneal injection by the traditional method.
| Evaluation Parameter | | PArel | FKPA | FKeff |
|---|
| Value | 0.006 cm | 8.97% | 28.3% | 2.54% |
Table 5.
Calculated values of treatment efficacy parameters after 60 min of treatment using an IP injection in drug delivery, which employed 100 nm magnetic nanoparticles.
Table 5.
Calculated values of treatment efficacy parameters after 60 min of treatment using an IP injection in drug delivery, which employed 100 nm magnetic nanoparticles.
| PArel | FKPA | FKeff |
|---|
| 0.08 cm | 12.73% | 51% | 6.5% |
Table 6.
Comparison of treatment efficacy parameters for different sizes of MNPs after 60 min of treatment.
Table 6.
Comparison of treatment efficacy parameters for different sizes of MNPs after 60 min of treatment.
| Nanoparticle Size (nm) | | PArel | FKPA | FKeff |
|---|
| 25 | 0.003 cm | 0.20% | 56.3% | 0.11% |
| 50 | 0.011 cm | 2.90% | 43.4% | 1.25% |
| 100 | 0.071 cm | 12.82% | 50.8% | 6.52% |
| 200 | 0.18 cm | 36.51% | 47.9% | 17.5% |
| 300 | 0.235 cm | 55.02% | 43.8% | 24.1% |
| 400 | 0.221 cm | 54.81% | 42.3% | 23.2% |
| 500 | 0.18 cm | 55.00% | 40.5% | 22.3% |
| 600 | 0.143 cm | 44.24% | 40.5% | 17.9% |
Table 7.
Comparison of the calculated values of the treatment efficacy parameters for different magnetic strengths applied for a nanoparticle size of 100 nm after 60 min of IP injection.
Table 7.
Comparison of the calculated values of the treatment efficacy parameters for different magnetic strengths applied for a nanoparticle size of 100 nm after 60 min of IP injection.
| Magnetic Strength (T) | | PArel | FKPA | FKeff |
|---|
| 0.5 | 0.006 cm | 0.955% | 45.8% | 0.43% |
| 1.5 | 0.071 cm | 12.827% | 50.8% | 6.52% |
| 2.5 | 0.192 cm | 38.324% | 47.3% | 18.1% |
Table 8.
Comparison of calculated values of treatment efficacy parameters at different distances between the magnetic source and the center of the tumor 60 min after IP injection.
Table 8.
Comparison of calculated values of treatment efficacy parameters at different distances between the magnetic source and the center of the tumor 60 min after IP injection.
| Magnet Distance | | PArel | FKPA | FKeff |
|---|
| 3 cm | 0.096 cm | 17.44% | 48.9% | 8.54% |
| 5 cm | 0.071 cm | 12.82% | 50.8% | 6.52% |
| 10 cm | 0.024 cm | 3.94% | 56.5% | 2.2% |


