

In Vitro/In Vivo Preparation and Evaluation of cRGDyK Peptide-Modified Polydopamine-Bridged Paclitaxel-Loaded Nanoparticles

Abstract
:1. Introduction
2. Materials and Methods
2.1. Materials
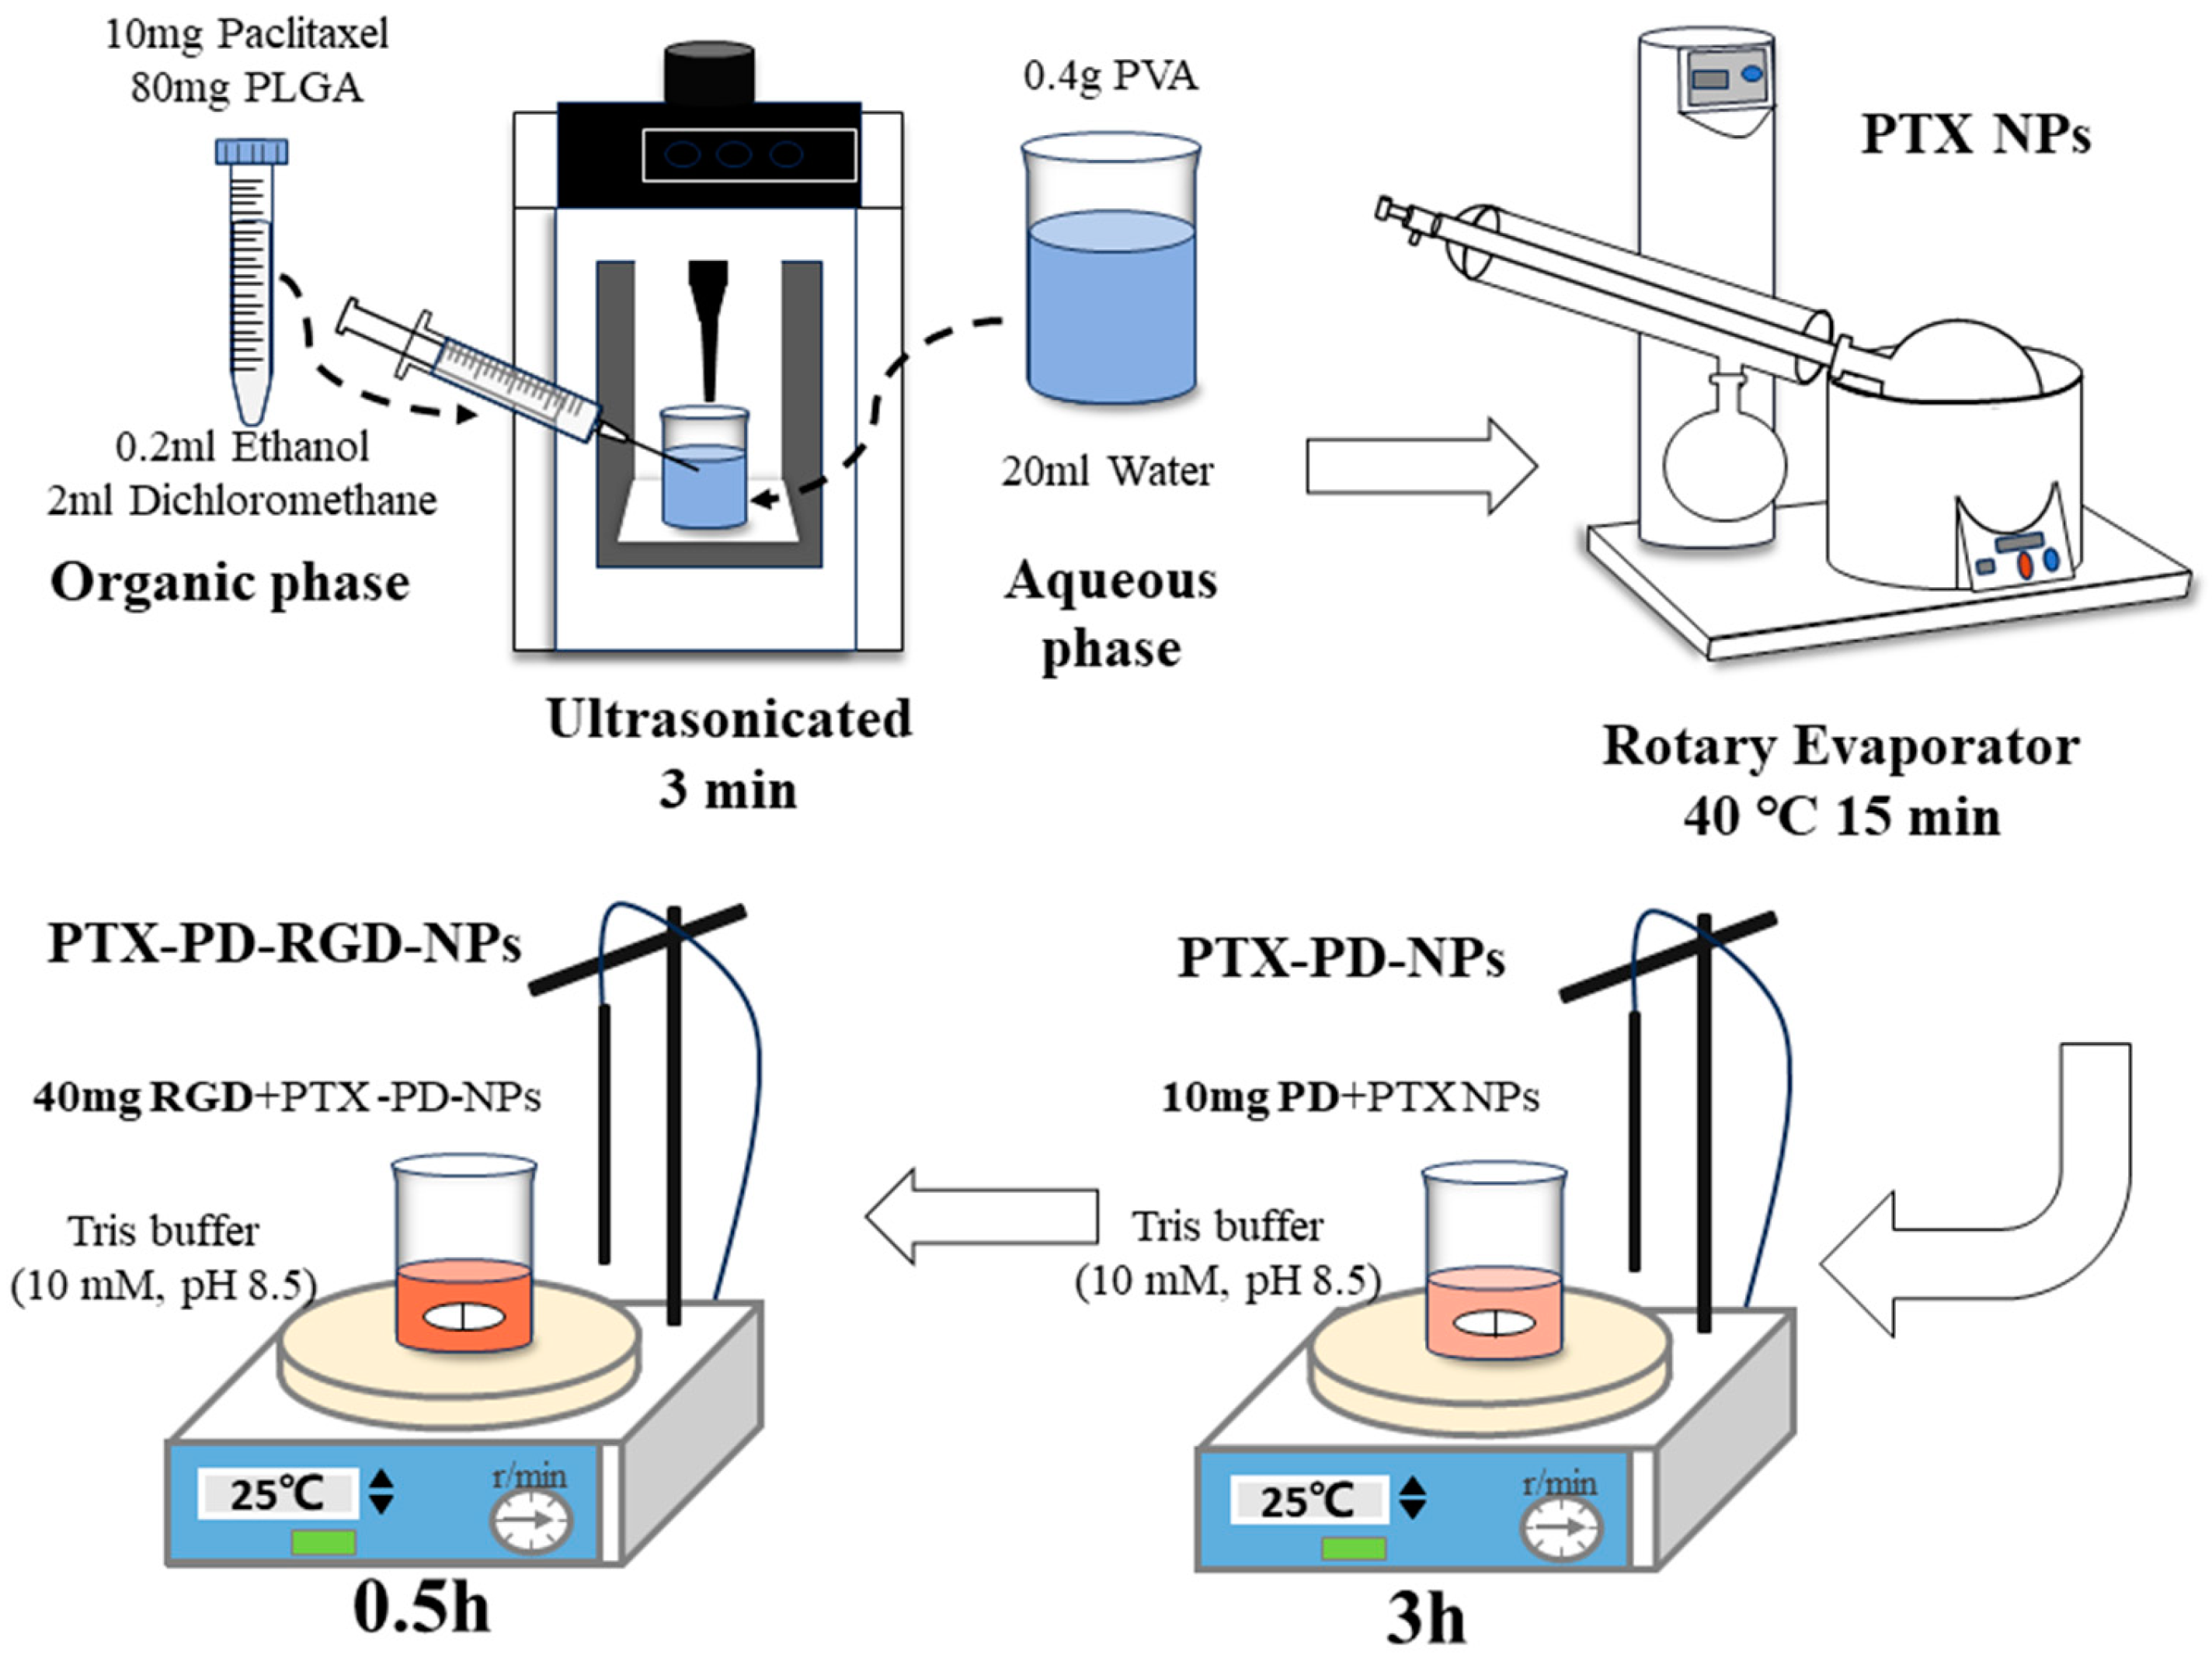
2.2. Development of PTX PD-RGD NPs
2.2.1. Development of PTX NPs
2.2.2. NP Surface Modification
2.3. Characterization of PTX PD-RGD NP Formulations
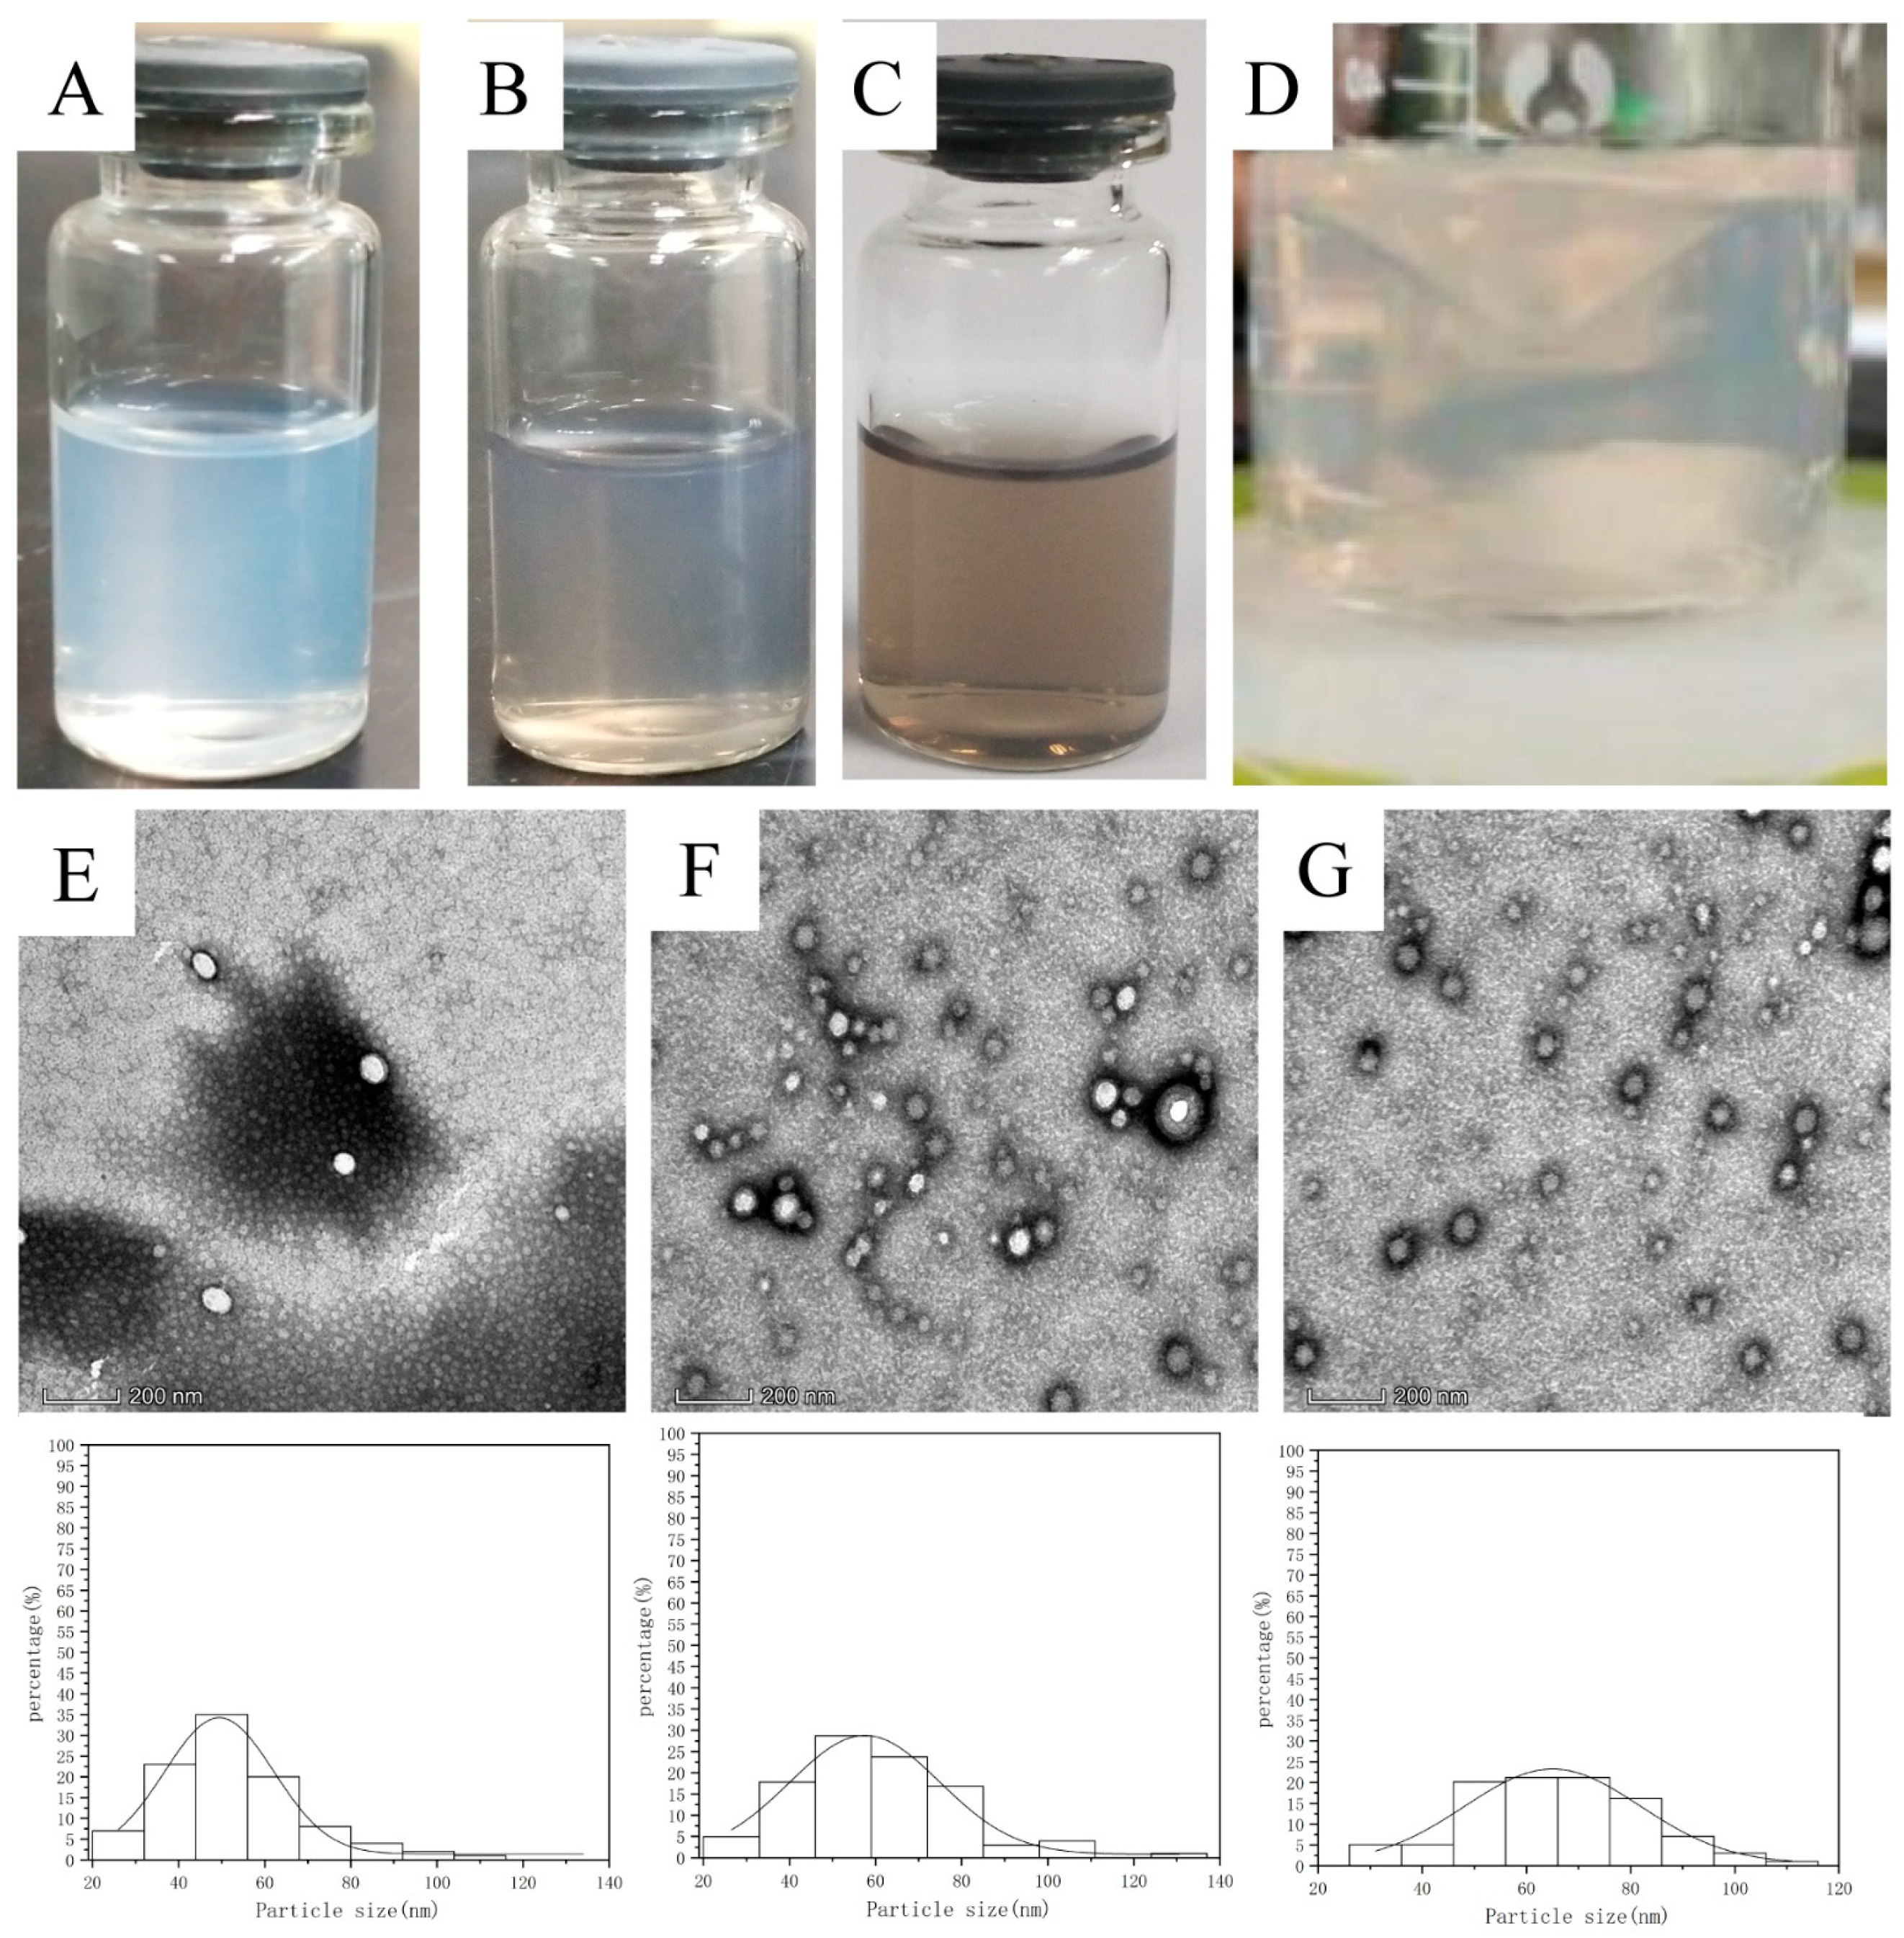
2.3.1. Size and Zeta Analysis
2.3.2. Encapsulation Efficiency of NPs
2.3.3. Morphological Evaluation
2.4. Solid-State Characterizations
2.4.1. Differential Scanning Calorimetry (DSC) Characterization
2.4.2. Fourier Transform Infrared (FTIR) Characterization
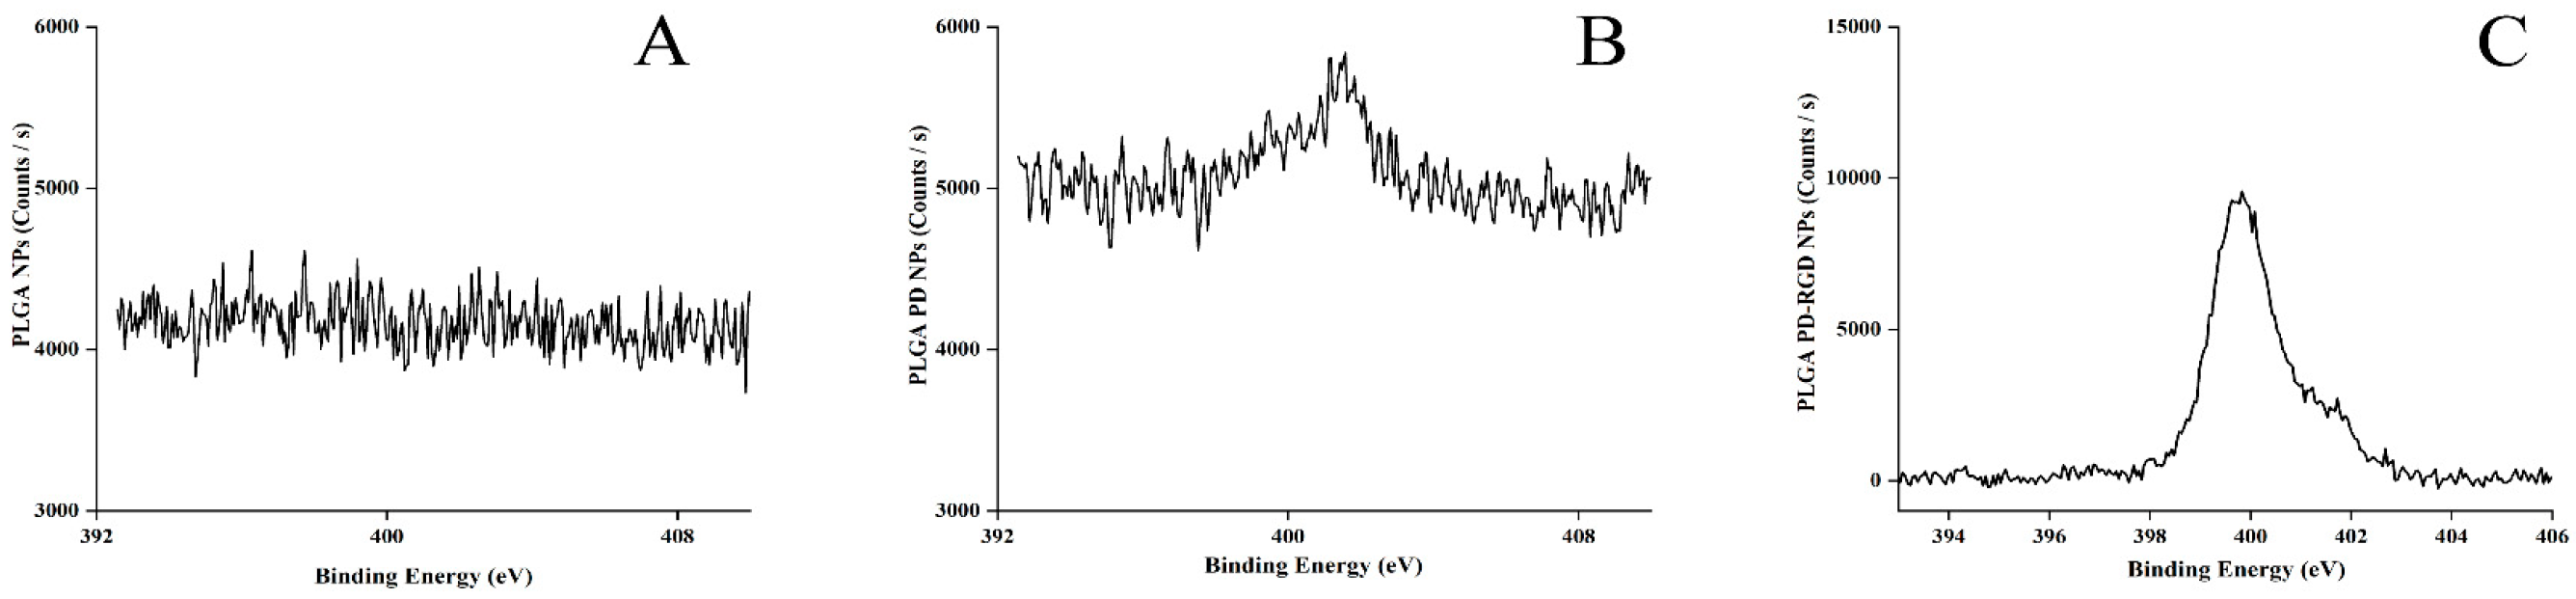
2.4.3. X-ray Photoelectron Spectroscopy (XPS) Characterization
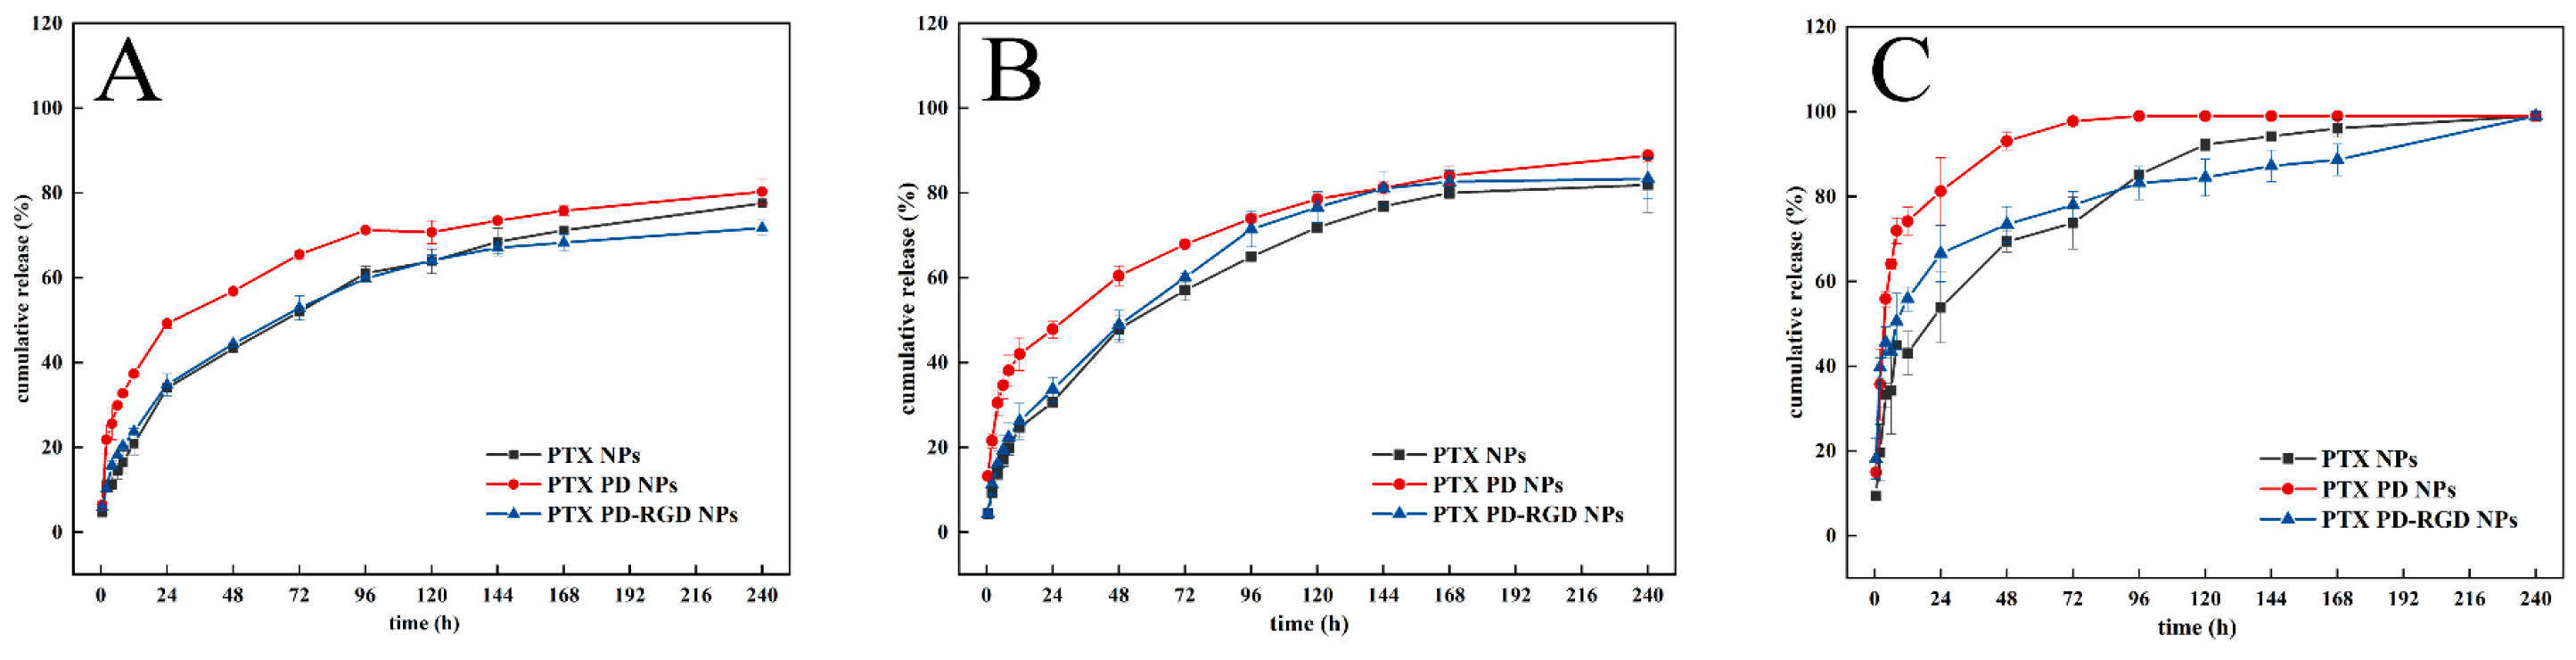
2.5. In Vitro Drug Release Study of PTX from NPs
2.6. Cell Lines
2.7. Cellular Uptake
2.7.1. Preparation of Fluorescent Probe
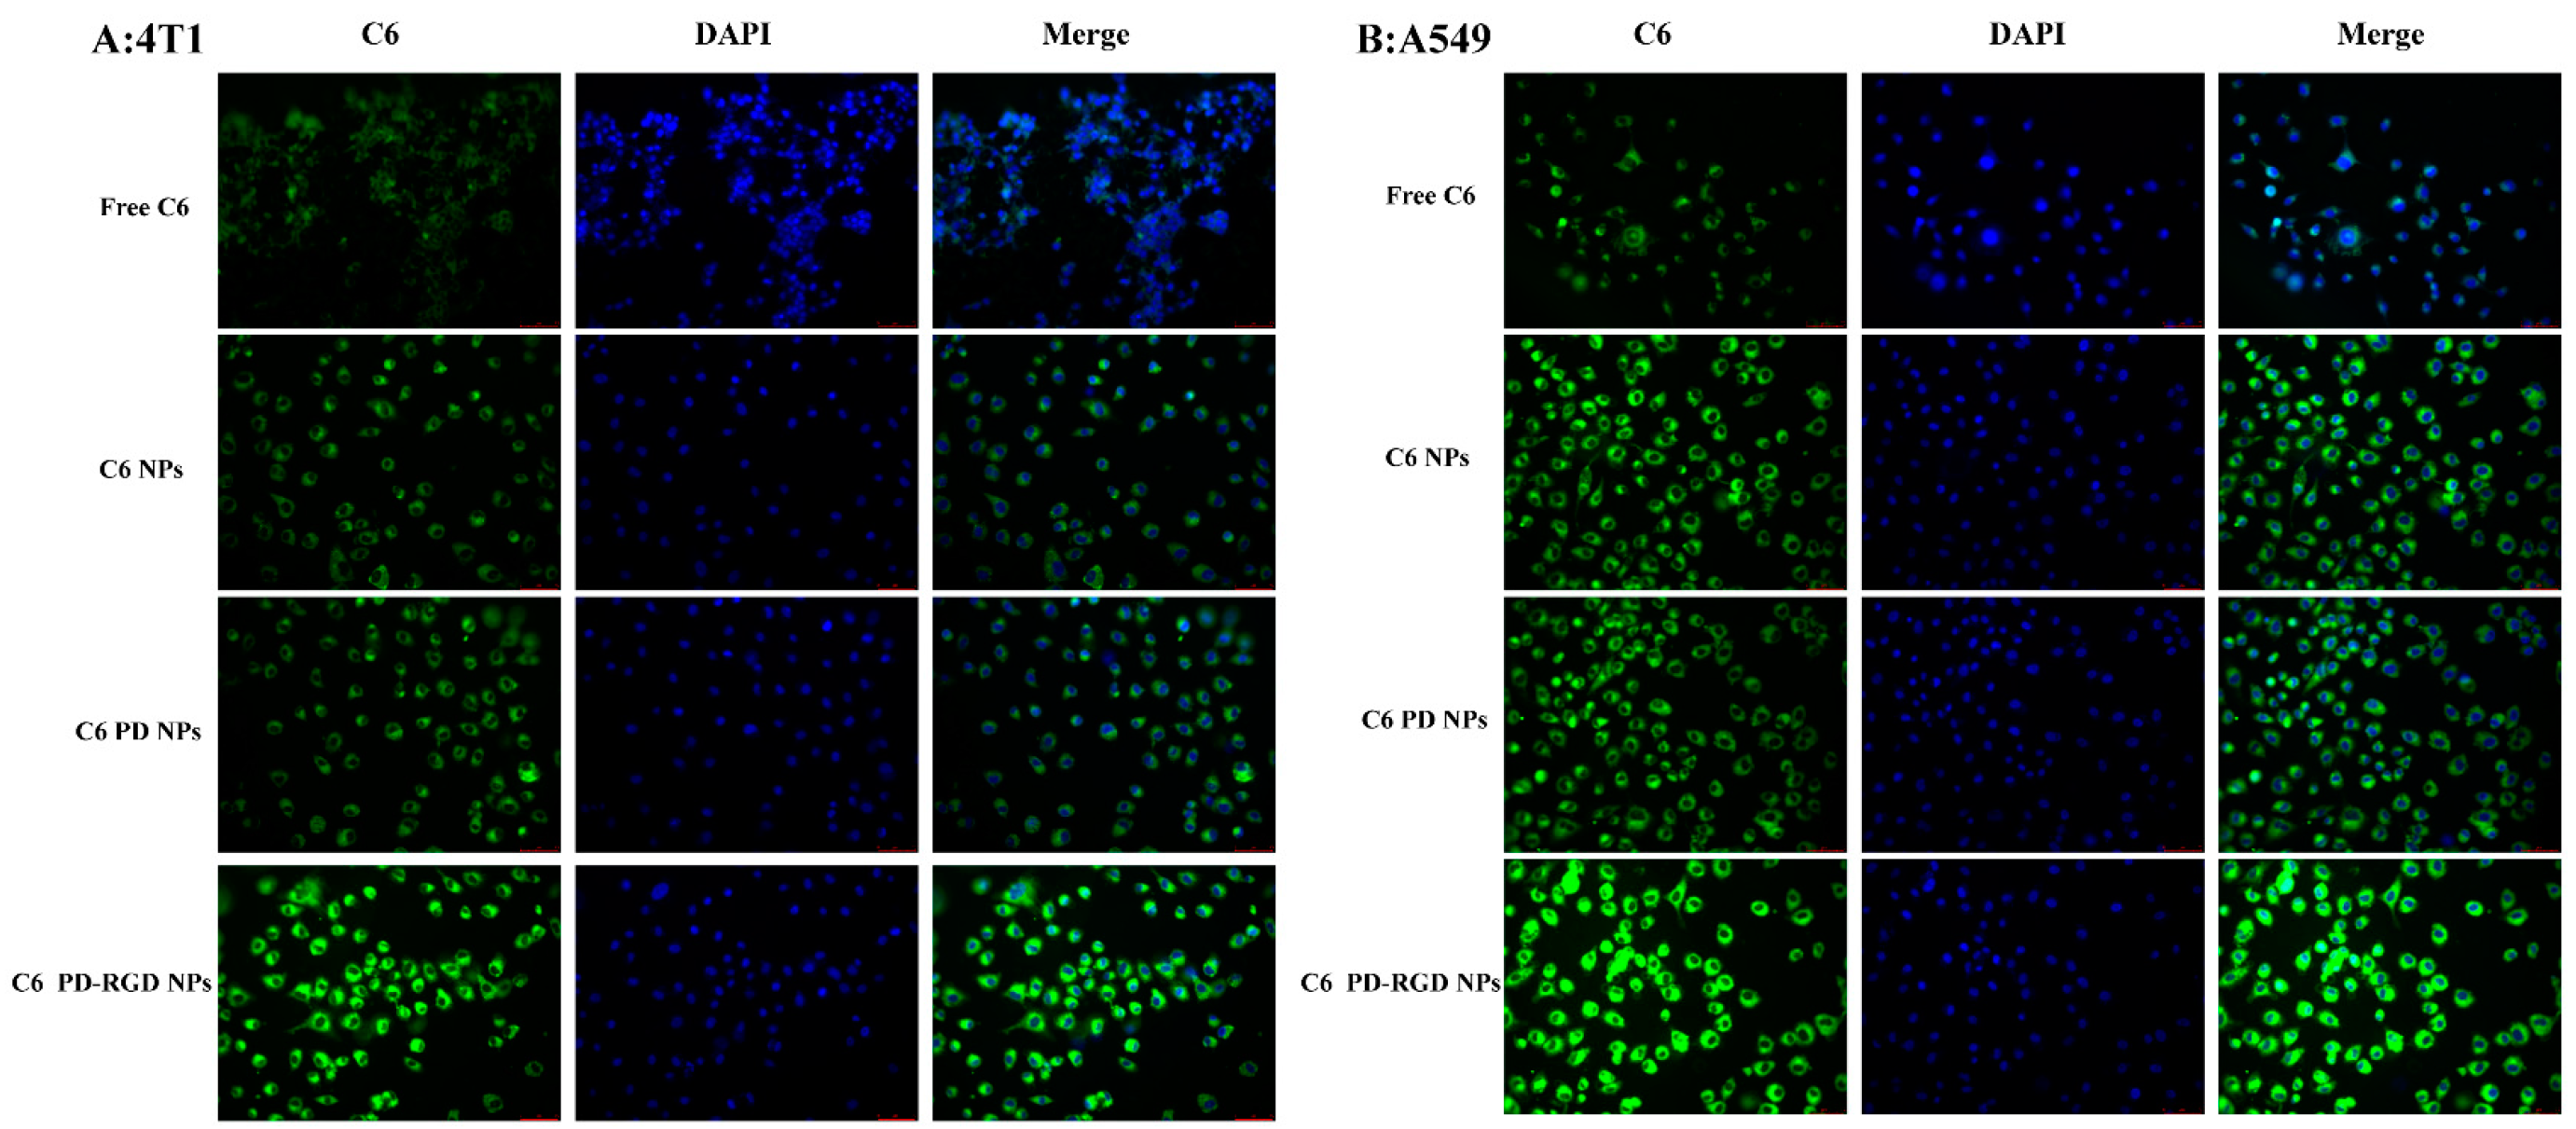
2.7.2. Qualitative Study of Cellular Uptake
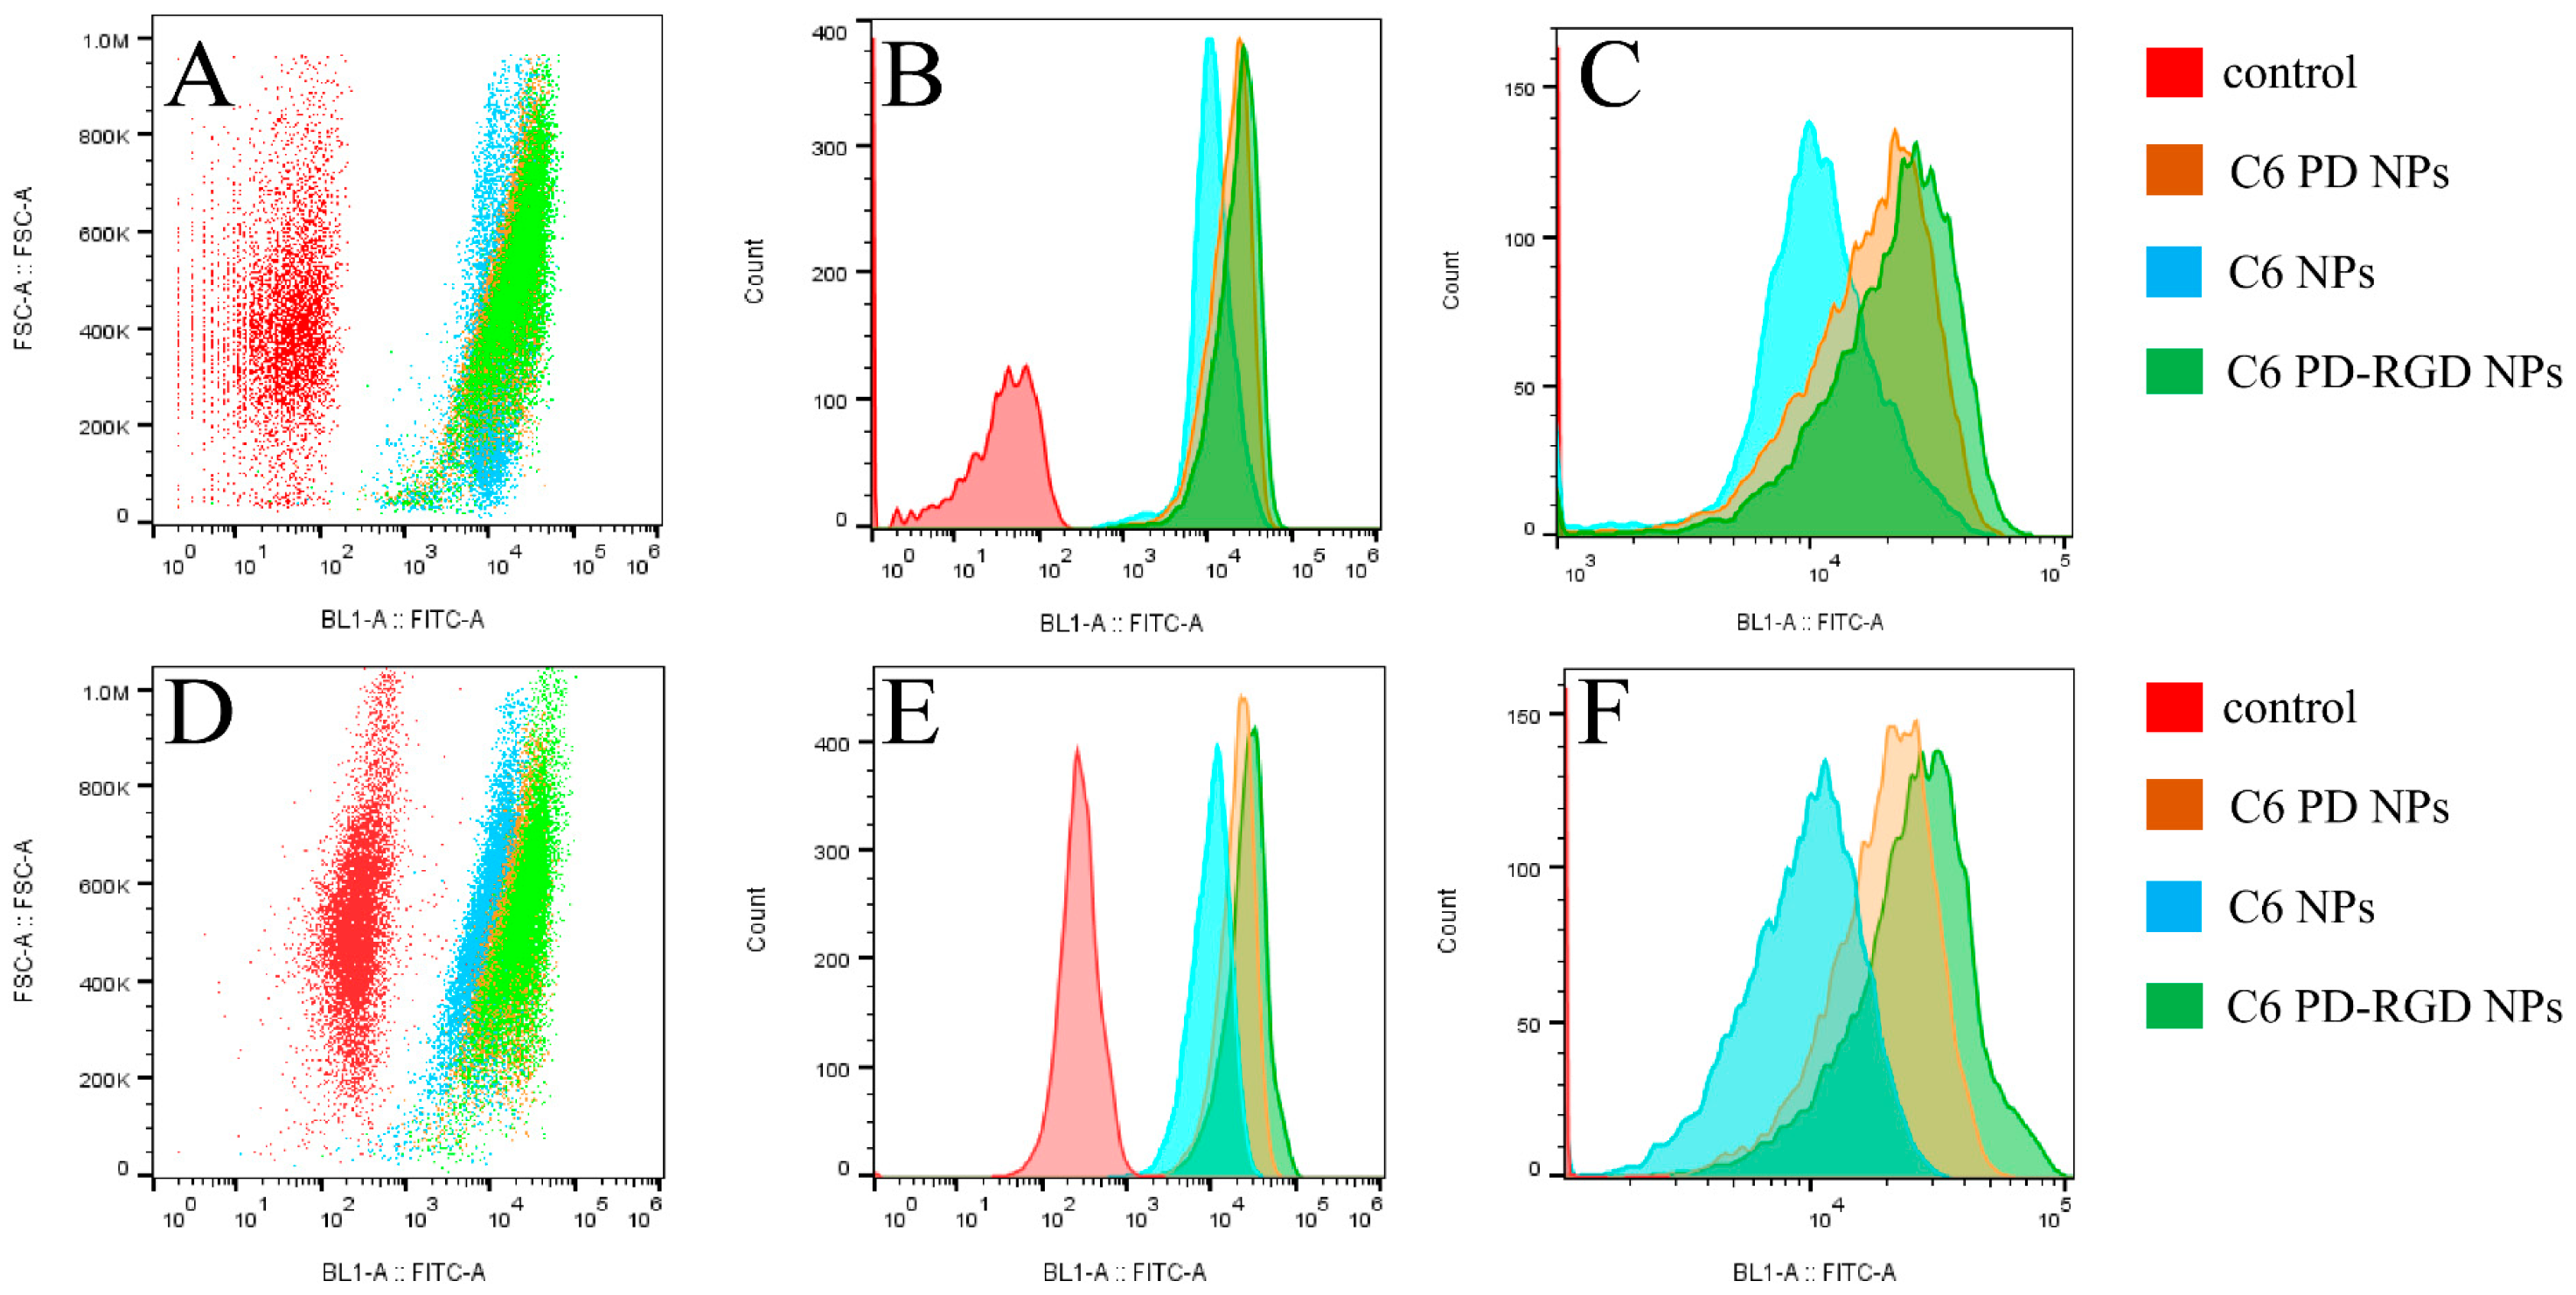
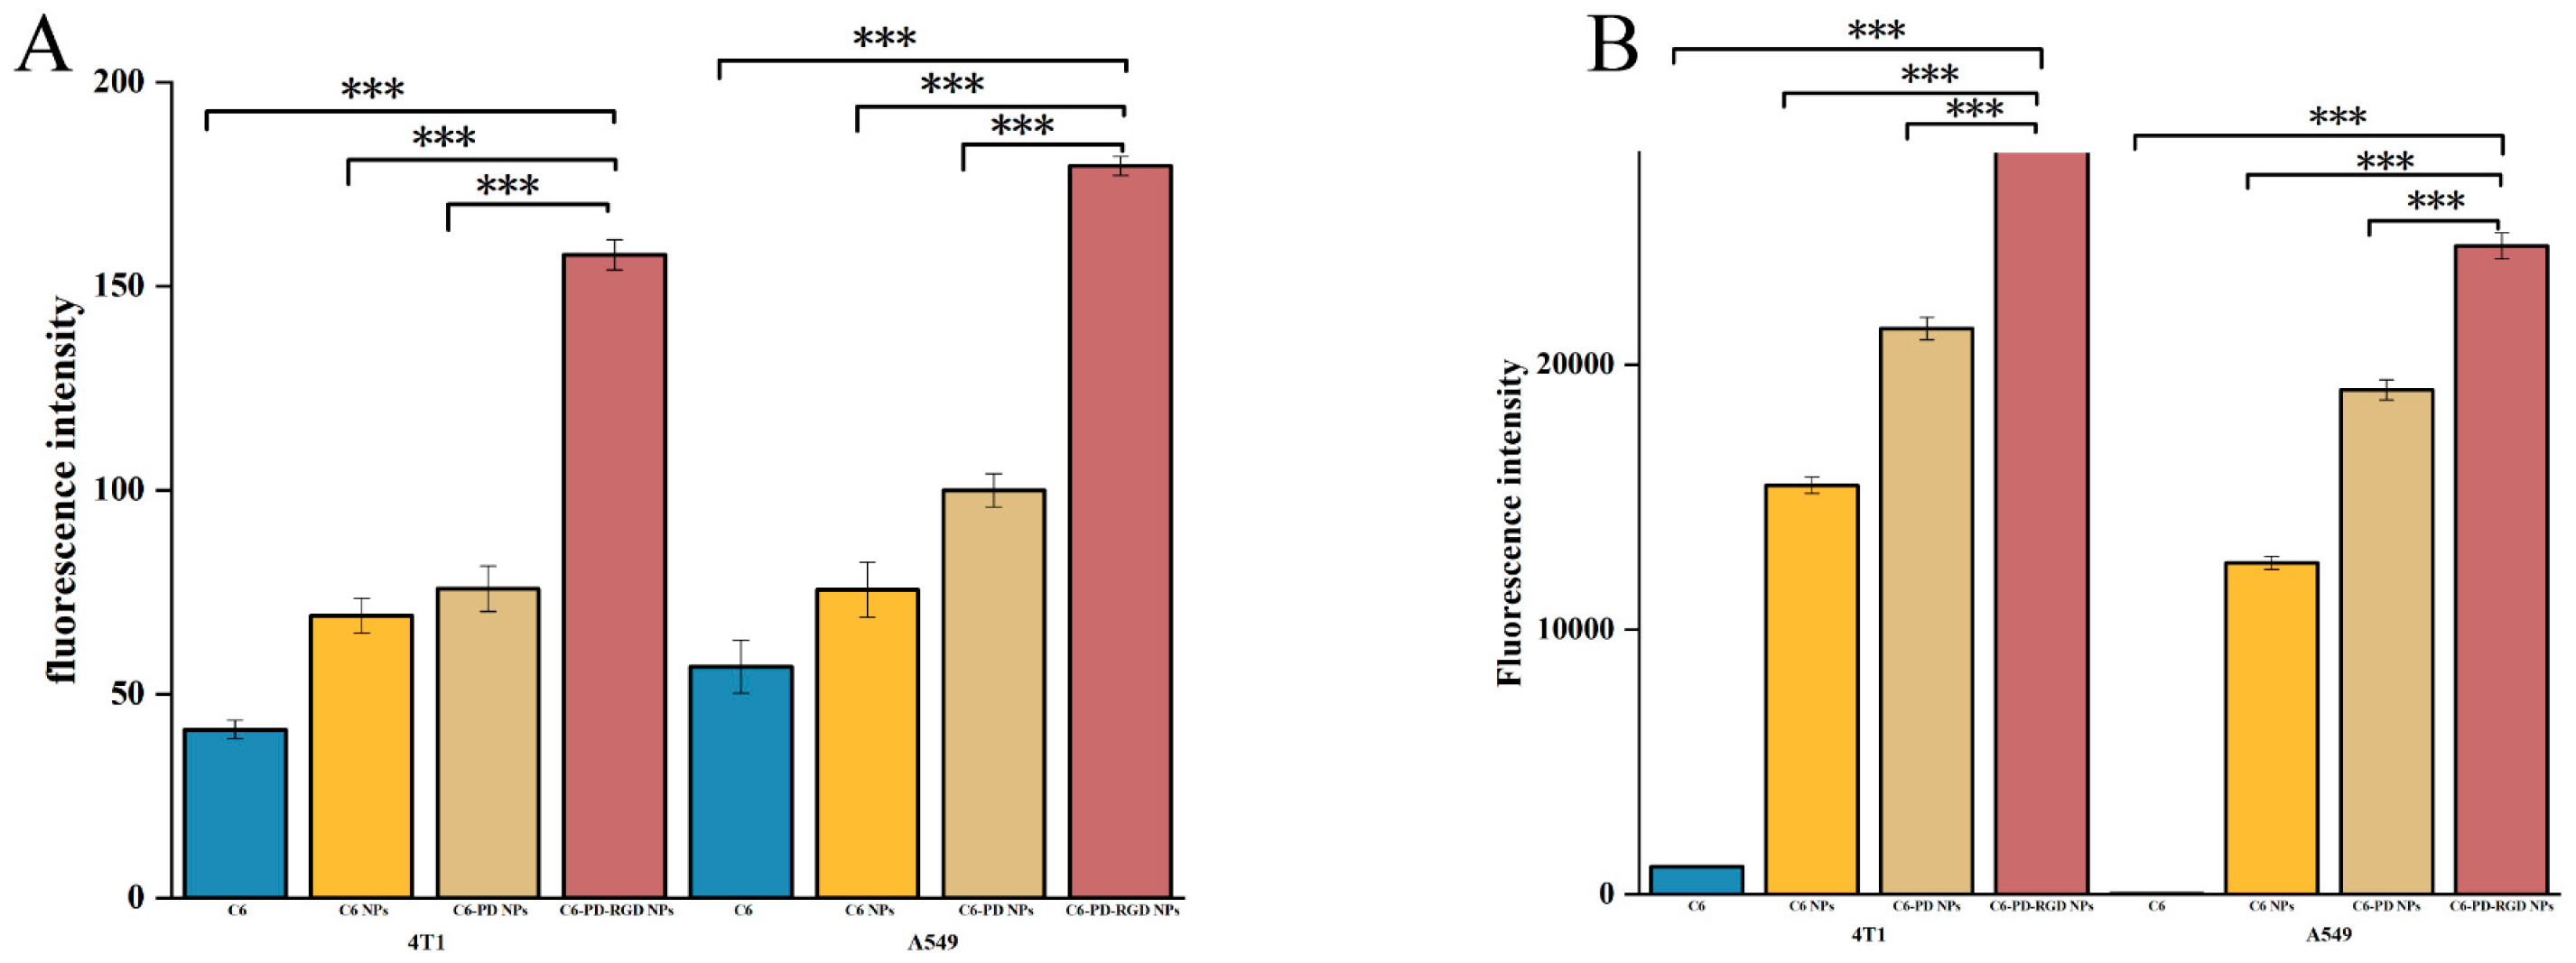
2.7.3. Quantitative Study of Cellular Uptake
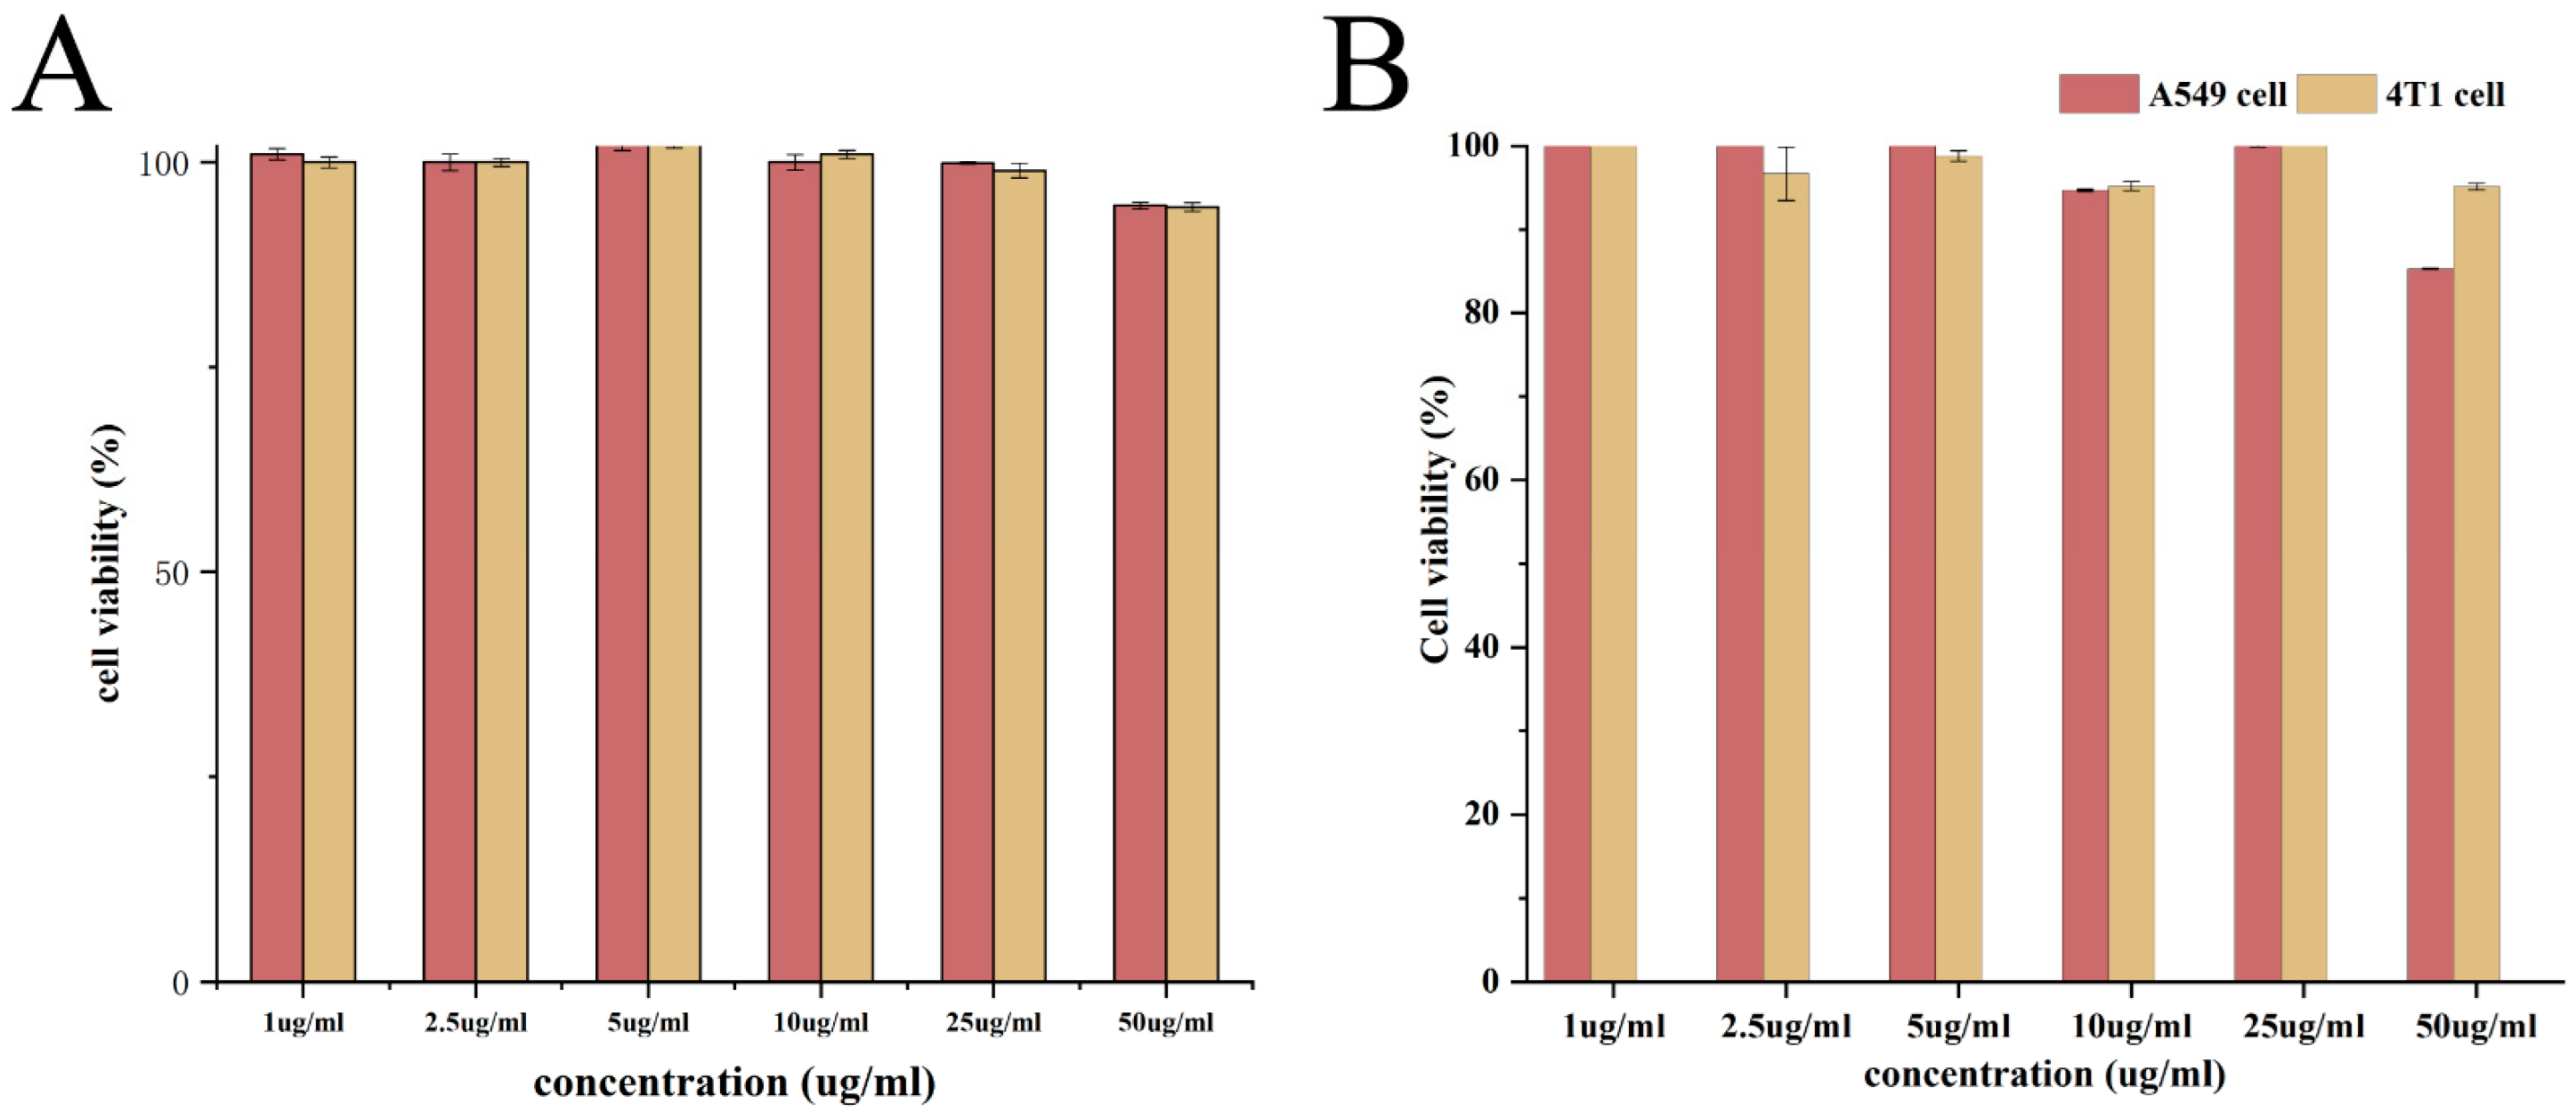
2.8. Biocompatibility Assay
2.9. In Vitro Cytotoxicity Assay
2.10. Ethics Approval
2.11. Tumor Model Establishment
2.12. In Vivo Antitumor Activity Evaluation of PLGA NPs in Tumor-Bearing Mice
- Normal group: 0.1 mL of physiological saline per 10 g;
- Negative control (model) group: 0.1 mL of physiological saline per 10 g;
- Positive control group: commercially available paclitaxel injection (10 mg/kg);
- PTX PD NP group: without active-target-modified delivery NPs (10 mg/kg);
- PTX PD-RGD NP group: with active-target-modified drug delivery NPs (10 mg/kg).
3. Results and Discussion
3.1. Characterization of PTX PD-RGD NPs
3.2. Solid-State Characterization
3.2.1. DSC Characterization
3.2.2. FTIR Characterization
3.2.3. XPS Characterization
3.3. In Vitro Drug Release
3.4. Cellular Uptake
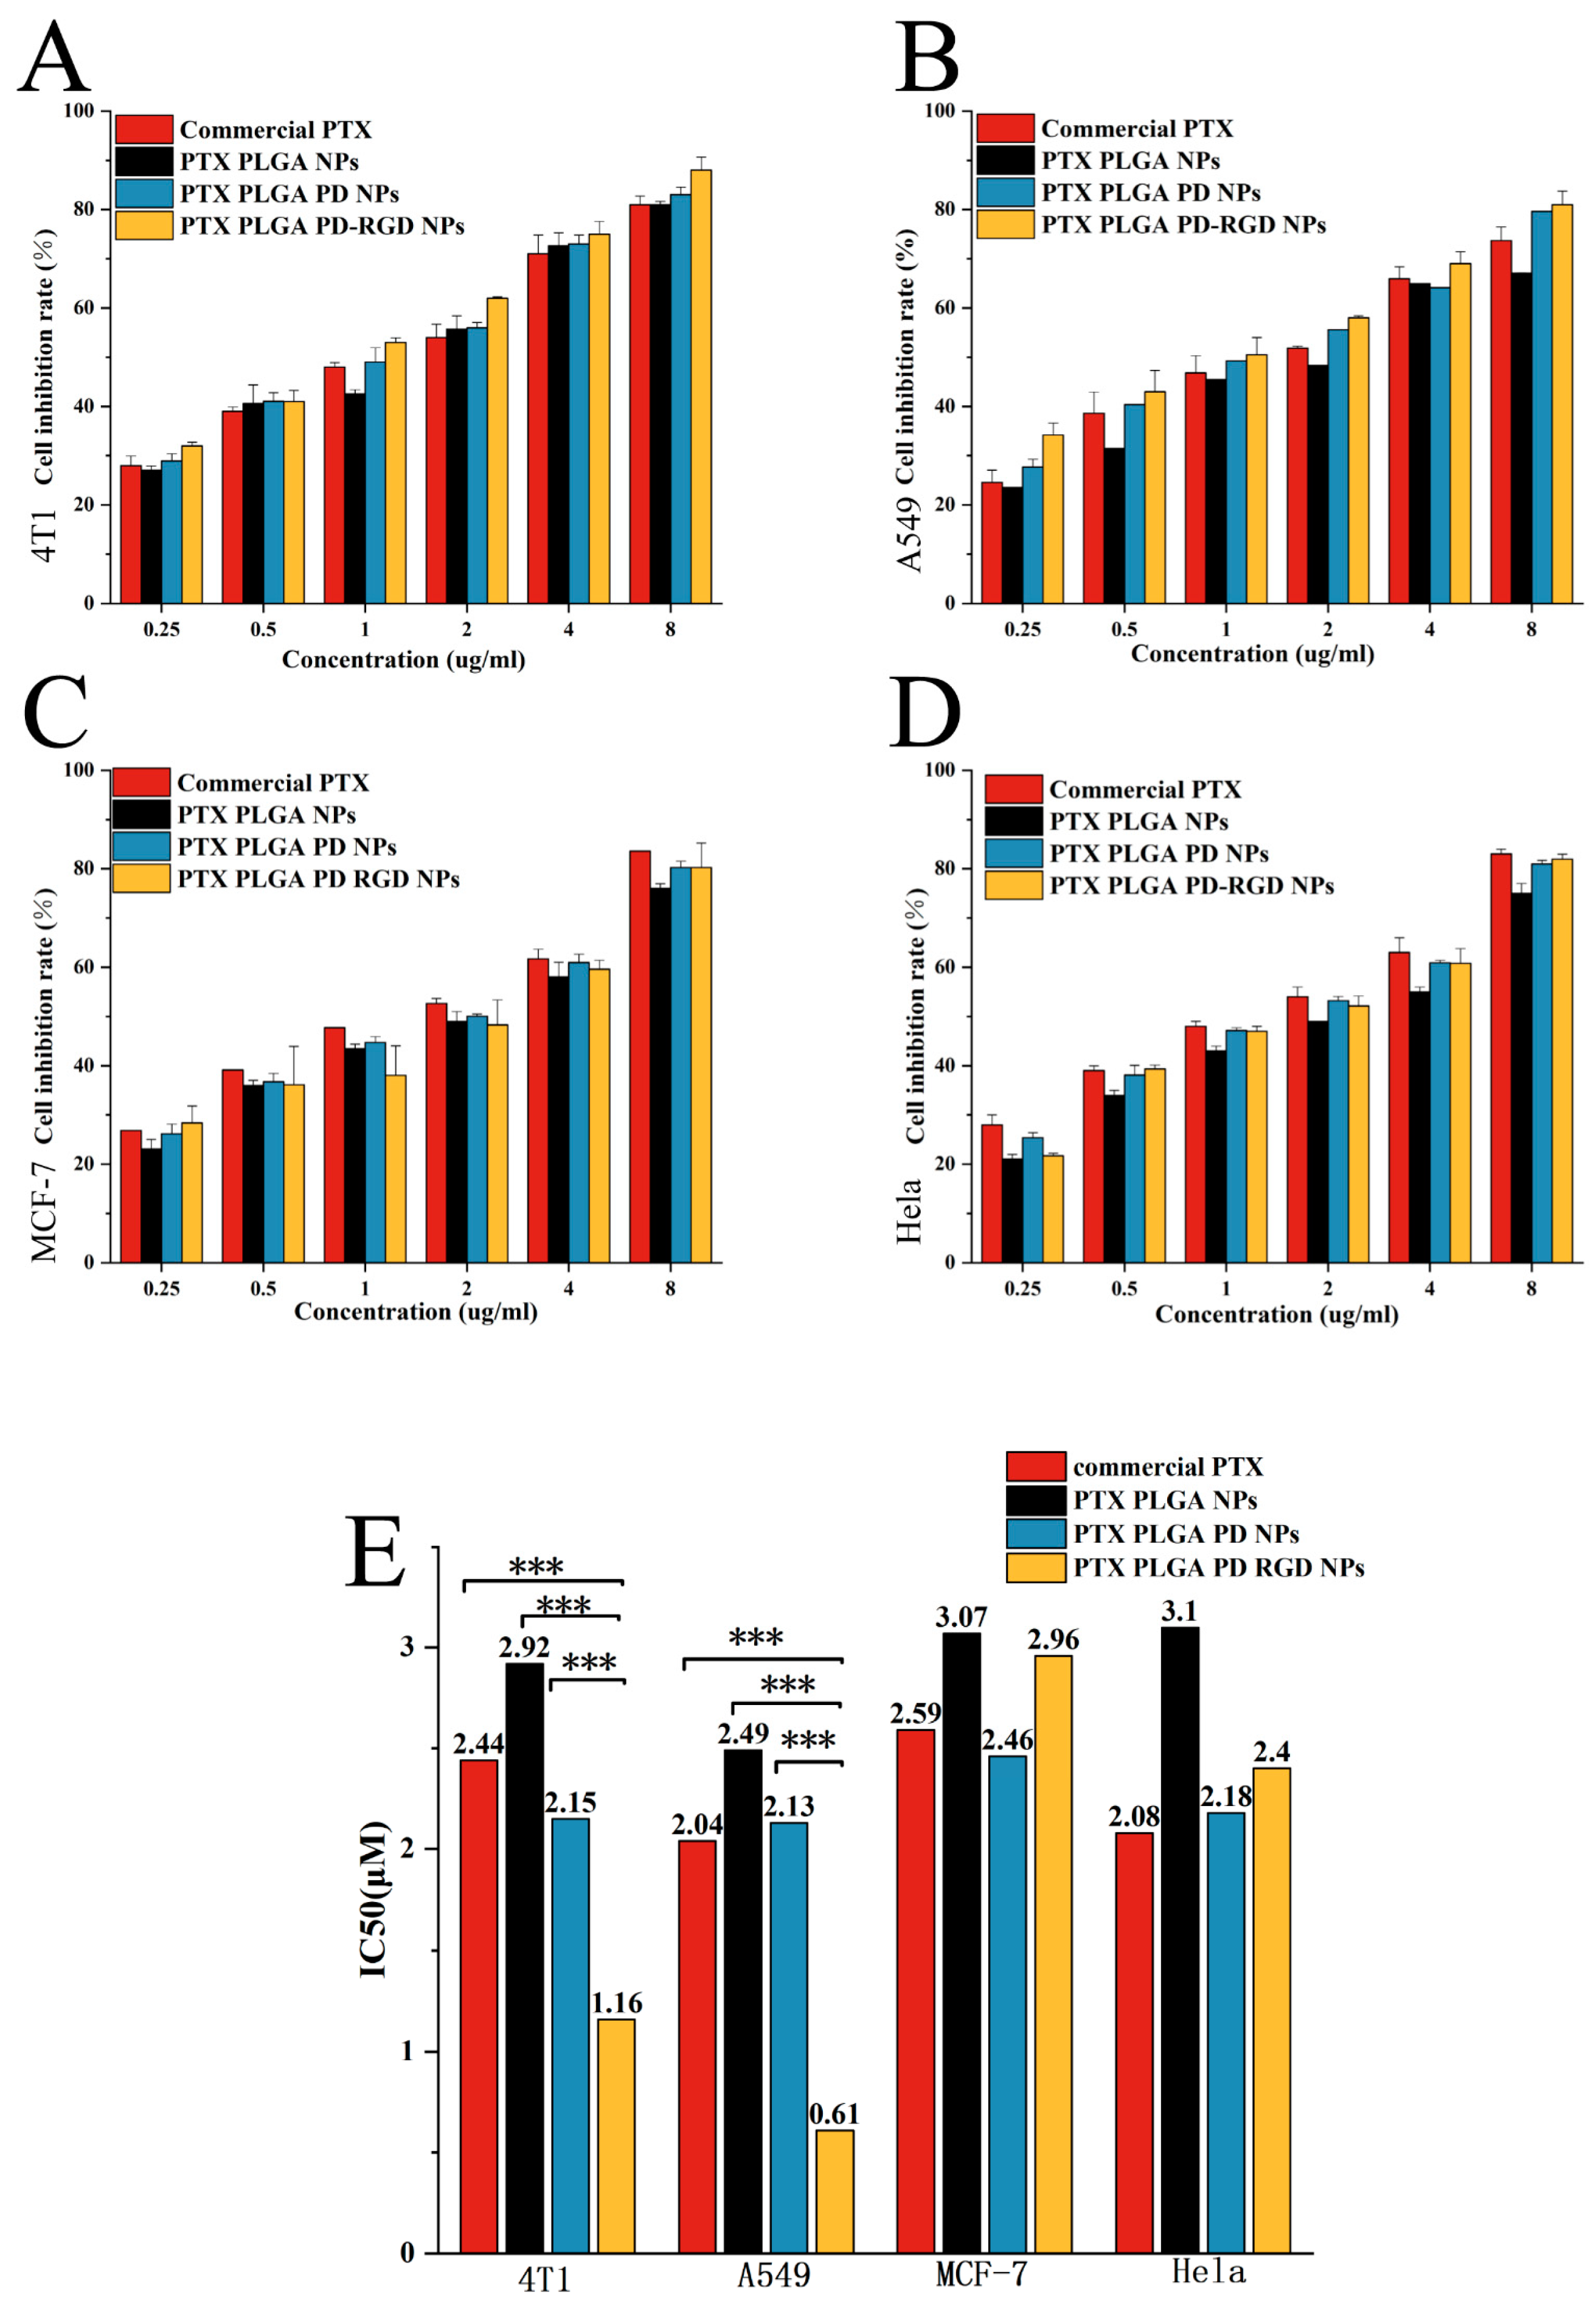
3.5. In Vitro Cytotoxicity Assay
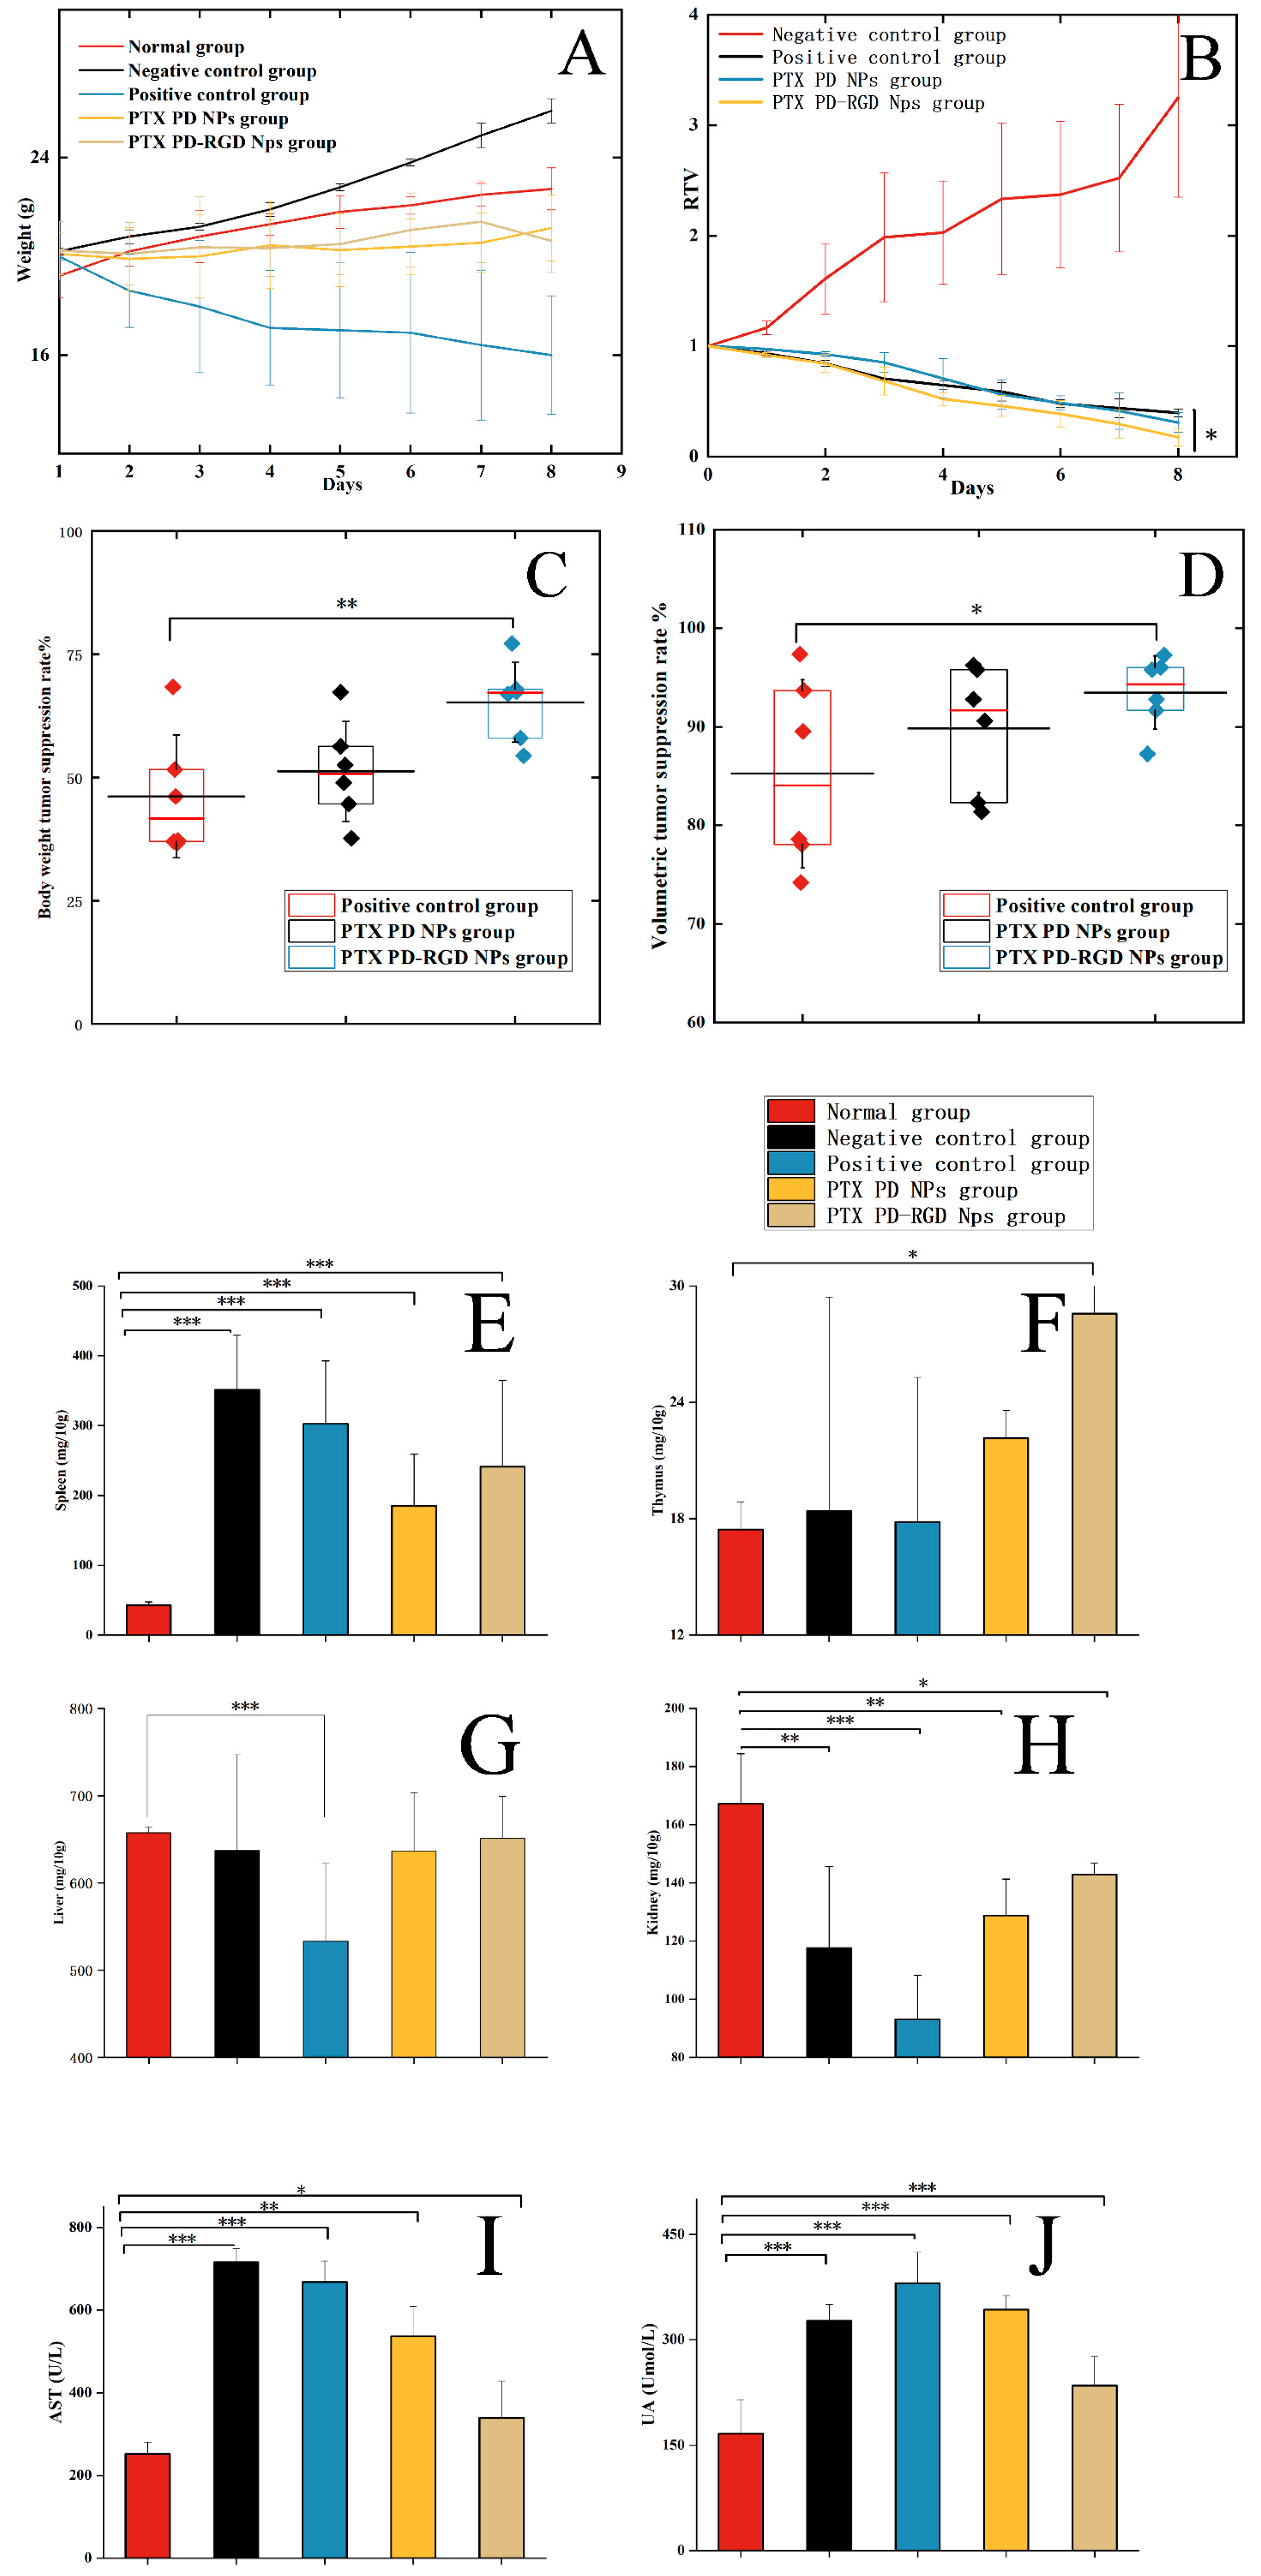
3.6. In Vivo Antitumor Study
4. Conclusions
Author Contributions
Funding
Institutional Review Board Statement
Informed Consent Statement
Data Availability Statement
Acknowledgments
Conflicts of Interest
References
- Martin, V. Overview of Paclitaxel (TAXOL). Semin. Oncol. Nurs. 1993, 9, 2–5. [Google Scholar] [CrossRef]
- Ashfaq, U.A.; Riaz, M.; Yasmeen, E.; Yousaf, M.Z. Recent Advances in Nanoparticle-Based Targeted Drug-Delivery Systems Against Cancer and Role of Tumor Microenvironment. Crit. Rev. Ther. Drug Carrier Syst. 2017, 34, 317–353. [Google Scholar] [CrossRef] [PubMed]
- Puricelli, C.; Gigliotti, C.L.; Stoppa, I.; Sacchetti, S.; Pantham, D.; Scomparin, A.; Rolla, R.; Pizzimenti, S.; Dianzani, U.; Boggio, E.; et al. Use of Poly Lactic-Co-Glycolic Acid Nano and Micro Particles in the Delivery of Drugs Modulating Different Phases of Inflammation. Pharmaceutics 2023, 15, 1772. [Google Scholar] [CrossRef] [PubMed]
- Sandomierski, M.; Jakubowski, M.; Ratajczak, M.; Pokora, M.; Voelkel, A. Zinc Zeolite as a Carrier for Tumor Targeted and pH-Responsive Drug Delivery. J. Inorg. Organomet. Polym. Mater. 2023, 33, 1667–1674. [Google Scholar] [CrossRef]
- Feng, L.; Dong, Z.; Tao, D.; Zhang, Y.; Liu, Z. The Acidic Tumor Microenvironment: A Target for Smart Cancer Nano-Theranostics. Natl. Sci. Rev. 2018, 5, 269–286. [Google Scholar] [CrossRef]
- Mittal, P.; Vardhan, H.; Ajmal, G.; Bonde, G.V.; Kapoor, R.; Mittal, A.; Mishra, B. Formulation, Optimization, Hemocompatibility and Pharmacokinetic Evaluation of PLGA Nanoparticles Containing Paclitaxel. Drug Dev. Ind. Pharm. 2019, 45, 365–378. [Google Scholar] [CrossRef]
- Godara, S.; Lather, V.; Kirthanashri, S.V.; Awasthi, R.; Pandita, D. Lipid-PLGA Hybrid Nanoparticles of Paclitaxel: Preparation, Characterization, in Vitro and in Vivo Evaluation. Mater. Sci. Eng. C Mater. Biol. Appl. 2020, 109, 110576. [Google Scholar] [CrossRef]
- Li, L.; Yang, M.; Li, R.; Hu, J.; Yu, L.; Qian, X. iRGD Co-Administration with Paclitaxel-Loaded PLGA Nanoparticles Enhance Targeting and Antitumor Effect in Colorectal Cancer Treatment. Anticancer Agents Med. Chem. 2021, 21, 910–918. [Google Scholar] [CrossRef]
- Madani, F.; Esnaashari, S.S.; Mujokoro, B.; Dorkoosh, F.; Khosravani, M.; Adabi, M. Investigation of Effective Parameters on Size of Paclitaxel Loaded PLGA Nanoparticles. Adv. Pharm. Bull. 2018, 8, 77–84. [Google Scholar] [CrossRef] [PubMed]
- Meng, X.; Wang, J.; Zhou, J.; Tian, Q.; Qie, B.; Zhou, G.; Duan, W.; Zhu, Y. Tumor Cell Membrane-Based Peptide Delivery System Targeting the Tumor Microenvironment for Cancer Immunotherapy and Diagnosis. Acta Biomater. 2021, 127, 266–275. [Google Scholar] [CrossRef]
- Jain, P.; Kathuria, H.; Momin, M. Clinical Therapies and Nano Drug Delivery Systems for Urinary Bladder Cancer. Pharmacol. Ther. 2021, 226, 107871. [Google Scholar] [CrossRef] [PubMed]
- Alavi, M.; Hamidi, M. Passive and Active Targeting in Cancer Therapy by Liposomes and Lipid Nanoparticles. Drug Metab. Pers. Ther. 2019, 34, 20180032. [Google Scholar] [CrossRef]
- Das, R.P.; Gandhi, V.V.; Singh, B.G.; Kunwar, A. Passive and Active Drug Targeting: Role of Nanocarriers in Rational Design of Anticancer Formulations. Curr. Pharm. Des. 2019, 25, 3034–3056. [Google Scholar] [CrossRef]
- Mir, M.; Ahmed, N.; Rehman, A.U. Recent Applications of PLGA Based Nanostructures in Drug Delivery. Colloids Surf. B Biointerfaces 2017, 159, 217–231. [Google Scholar] [CrossRef] [PubMed]
- Wu, X.S. Synthesis, Characterization, Biodegradation, and Drug Delivery Application of Biodegradable Lactic/Glycolic Acid Polymers: Part III. Drug Delivery Application. Artif. Cells Blood Substit. Immobil. Biotechnol. 2004, 32, 575–591. [Google Scholar] [CrossRef]
- Danhier, F.; Le Breton, A.; Préat, V. RGD-Based Strategies to Target Alpha(v) Beta(3) Integrin in Cancer Therapy and Diagnosis. Mol. Pharm. 2012, 9, 2961–2973. [Google Scholar] [CrossRef]
- Ruoslahti, E. RGD and Other Recognition Sequences for Integrins. Annu. Rev. Cell Dev. Biol. 1996, 12, 697–715. [Google Scholar] [CrossRef] [PubMed]
- Ahmadi, Z.; Jha, D.; Kumar Gautam, H.; Kumar, P.; Kumar Sharma, A. Cationic RGD Peptidomimetic Nanoconjugates as Effective Tumor Targeting Gene Delivery Vectors with Antimicrobial Potential. Bioorg Chem. 2022, 129, 106197. [Google Scholar] [CrossRef]
- Fu, S.; Xu, X.; Ma, Y.; Zhang, S.; Zhang, S. RGD Peptide-Based Non-Viral Gene Delivery Vectors Targeting Integrin Avβ3 for Cancer Therapy. J. Drug Target. 2019, 27, 1–11. [Google Scholar] [CrossRef]
- Qi, N.; Zhang, S.; Zhou, X.; Duan, W.; Gao, D.; Feng, J.; Li, A. Combined Integrin Avβ3 and Lactoferrin Receptor Targeted Docetaxel Liposomes Enhance the Brain Targeting Effect and Anti-Glioma Effect. J. Nanobiotechnol. 2021, 19, 446. [Google Scholar] [CrossRef]
- Narmani, A.; Jahedi, R.; Bakhshian-Dehkordi, E.; Ganji, S.; Nemati, M.; Ghahramani-Asl, R.; Moloudi, K.; Hosseini, S.M.; Bagheri, H.; Kesharwani, P.; et al. Biomedical Applications of PLGA Nanoparticles in Nanomedicine: Advances in Drug Delivery Systems and Cancer Therapy. Expert Opin. Drug Deliv. 2023, 20, 937–954. [Google Scholar] [CrossRef] [PubMed]
- Kapoor, D.N.; Bhatia, A.; Kaur, R.; Sharma, R.; Kaur, G.; Dhawan, S. PLGA: A Unique Polymer for Drug Delivery. Ther. Deliv. 2015, 6, 41–58. [Google Scholar] [CrossRef] [PubMed]
- Lee, H.; Lee, B.P.; Messersmith, P.B. A Reversible Wet/Dry Adhesive Inspired by Mussels and Geckos. Nature 2007, 448, 338–341. [Google Scholar] [CrossRef]
- Liu, Y.; Ai, K.; Lu, L. Polydopamine and Its Derivative Materials: Synthesis and Promising Applications in Energy, Environmental, and Biomedical Fields. Chem. Rev. 2014, 114, 5057–5115. [Google Scholar] [CrossRef] [PubMed]
- Coy, E.; Iatsunskyi, I.; Colmenares, J.C.; Kim, Y.; Mrówczyński, R. Polydopamine Films with 2D-like Layered Structure and High Mechanical Resilience. ACS Appl. Mater. Interfaces 2021, 13, 23113–23120. [Google Scholar] [CrossRef] [PubMed]
- Delparastan, P.; Malollari, K.G.; Lee, H.; Messersmith, P.B. Direct Evidence for the Polymeric Nature of Polydopamine. Angew. Chem. Int. Ed. Engl. 2019, 58, 1077–1082. [Google Scholar] [CrossRef]
- Zhang, C.; Gong, L.; Xiang, L.; Du, Y.; Hu, W.; Zeng, H.; Xu, Z.-K. Deposition and Adhesion of Polydopamine on the Surfaces of Varying Wettability. ACS Appl. Mater. Interfaces 2017, 9, 30943–30950. [Google Scholar] [CrossRef]
- Luo, R.; Tang, L.; Zhong, S.; Yang, Z.; Wang, J.; Weng, Y.; Tu, Q.; Jiang, C.; Huang, N. In Vitro Investigation of Enhanced Hemocompatibility and Endothelial Cell Proliferation Associated with Quinone-Rich Polydopamine Coating. ACS Appl. Mater. Interfaces 2013, 5, 1704–1714. [Google Scholar] [CrossRef]
- Hassanzadeh, P. The Biomedical Significance of Multifunctional Nanobiomaterials: The Key Components for Site-Specific Delivery of Therapeutics. Life Sci. 2021, 277, 119400. [Google Scholar] [CrossRef]
- Fan, X.; Yuan, Z.; Shou, C.; Fan, G.; Wang, H.; Gao, F.; Rui, Y.; Xu, K.; Yin, P. cRGD-Conjugated Fe3O4@PDA-DOX Multifunctional Nanocomposites for MRI and Antitumor Chemo-Photothermal Therapy. Int. J. Nanomed. 2019, 14, 9631–9645. [Google Scholar] [CrossRef]
- Bi, D.; Zhao, L.; Li, H.; Guo, Y.; Wang, X.; Han, M. A Comparative Study of Polydopamine Modified and Conventional Chemical Synthesis Method in Doxorubicin Liposomes Form the Aspect of Tumor Targeted Therapy. Int. J. Pharm. 2019, 559, 76–85. [Google Scholar] [CrossRef]
- Lim, D.G.; Prim, R.E.; Kang, E.; Jeong, S.H. One-Pot Synthesis of Dopamine-Conjugated Hyaluronic Acid/Polydopamine Nanocomplexes to Control Protein Drug Release. Int. J. Pharm. 2018, 542, 288–296. [Google Scholar] [CrossRef]
- Jung, H.-S.; Cho, K.-J.; Seol, Y.; Takagi, Y.; Dittmore, A.; Roche, P.A.; Neuman, K.C. Polydopamine Encapsulation of Fluorescent Nanodiamonds for Biomedical Applications. Adv. Funct. Mater. 2018, 28, 1801252. [Google Scholar] [CrossRef] [PubMed]
- Sun, S.; Sha, X.; Liang, J.; Yang, G.; Hu, X.; Wen, Y.; Liu, M.; Zhou, N.; Zhang, X.; Wei, Y. Construction of Ionic Liquid Functionalized MXene with Extremely High Adsorption Capacity towards Iodine via the Combination of Mussel-Inspired Chemistry and Michael Addition Reaction. J. Colloid. Interface Sci. 2021, 601, 294–304. [Google Scholar] [CrossRef]
- Cheng, W.; Zeng, X.; Chen, H.; Li, Z.; Zeng, W.; Mei, L.; Zhao, Y. Versatile Polydopamine Platforms: Synthesis and Promising Applications for Surface Modification and Advanced Nanomedicine. ACS Nano 2019, 13, 8537–8565. [Google Scholar] [CrossRef]
- Ochs, C.J.; Hong, T.; Such, G.K.; Cui, J.; Postma, A.; Caruso, F. Dopamine-Mediated Continuous Assembly of Biodegradable Capsules. Chem. Mat. 2011, 23, 3141–3143. [Google Scholar] [CrossRef]
- Xu, Z.; Wu, Y.; Wu, H.; Sun, N.; Deng, C. Hydrophilic Polydopamine-Derived Mesoporous Channels for Loading Ti(IV) Ions for Salivary Phosphoproteome Research. Anal. Chim. Acta 2021, 1146, 53–60. [Google Scholar] [CrossRef]
- Borgå, O.; Lilienberg, E.; Bjermo, H.; Hansson, F.; Heldring, N.; Dediu, R. Pharmacokinetics of Total and Unbound Paclitaxel After Administration of Paclitaxel Micellar or Nab-Paclitaxel: An Open, Randomized, Cross-Over, Explorative Study in Breast Cancer Patients. Adv. Ther. 2019, 36, 2825–2837. [Google Scholar] [CrossRef] [PubMed]
- Zhang, J.; Pan, Y.; Shi, Q.; Zhang, G.; Jiang, L.; Dong, X.; Gu, K.; Wang, H.; Zhang, X.; Yang, N.; et al. Paclitaxel Liposome for Injection (Lipusu) plus Cisplatin versus Gemcitabine plus Cisplatin in the First-Line Treatment of Locally Advanced or Metastatic Lung Squamous Cell Carcinoma: A Multicenter, Randomized, Open-Label, Parallel Controlled Clinical Study. Cancer Commun. 2022, 42, 3–16. [Google Scholar] [CrossRef]
- Spencer, C.M.; Faulds, D. Paclitaxel. A Review of Its Pharmacodynamic and Pharmacokinetic Properties and Therapeutic Potential in the Treatment of Cancer. Drugs 1994, 48, 794–847. [Google Scholar] [CrossRef] [PubMed]
- Rowinsky, E.K.; Onetto, N.; Canetta, R.M.; Arbuck, S.G. Taxol: The First of the Taxanes, an Important New Class of Antitumor Agents. Semin. Oncol. 1992, 19, 646–662. [Google Scholar] [PubMed]
- Zhang, T.; Jiang, Z.; Xve, T.; Sun, S.; Li, J.; Ren, W.; Wu, A.; Huang, P. One-Pot Synthesis of Hollow PDA@DOX Nanoparticles for Ultrasound Imaging and Chemo-Thermal Therapy in Breast Cancer. Nanoscale 2019, 11, 21759–21766. [Google Scholar] [CrossRef] [PubMed]
- Phan, L.M.T.; Gul, A.R.; Le, T.N.; Kim, M.W.; Kailasa, S.K.; Oh, K.T.; Park, T.J. One-Pot Synthesis of Carbon Dots with Intrinsic Folic Acid for Synergistic Imaging-Guided Photothermal Therapy of Prostate Cancer Cells. Biomater. Sci. 2019, 7, 5187–5196. [Google Scholar] [CrossRef]
- Bernsmann, F.; Ball, V.; Addiego, F.; Ponche, A.; Michel, M.; Gracio, J.J.d.A.; Toniazzo, V.; Ruch, D. Dopamine-Melanin Film Deposition Depends on the Used Oxidant and Buffer Solution. Langmuir 2011, 27, 2819–2825. [Google Scholar] [CrossRef]
- Park, J.; Brust, T.F.; Lee, H.J.; Lee, S.C.; Watts, V.J.; Yeo, Y. Polydopamine-Based Simple and Versatile Surface Modification of Polymeric Nano Drug Carriers. ACS Nano 2014, 8, 3347–3356. [Google Scholar] [CrossRef] [PubMed]
- Wang, X.; Wang, X.; Jin, S.; Muhammad, N.; Guo, Z. Stimuli-Responsive Therapeutic Metallodrugs. Chem. Rev. 2019, 119, 1138–1192. [Google Scholar] [CrossRef]
- Cedervall, T.; Lynch, I.; Lindman, S.; Berggard, T.; Thulin, E.; Nilsson, H.; Dawson, K.A.; Linse, S. Understanding the Nanoparticle-Protein Corona Using Methods to Quantify Exchange Rates and Affinities of Proteins for Nanoparticles. Proc. Natl. Acad. Sci. USA 2007, 104, 2050–2055. [Google Scholar] [CrossRef] [PubMed]
- Cho, H.; Perikamana, S.K.M.; Lee, J.; Lee, J.; Lee, K.-M.; Shin, C.S.; Shin, H. Effective Immobilization of BMP-2 Mediated by Polydopamine Coating on Biodegradable Nanofibers for Enhanced in Vivo Bone Formation. ACS Appl. Mater. Interfaces 2014, 6, 11225–11235. [Google Scholar] [CrossRef]
- Sandomierski, M.; Chojnacka, M.; Dlugosz, M.; Pokora, M.; Zwolinska, J.; Majchrzycki, L.; Voelkel, A. Mesoporous Silica Modified with Polydopamine and Zinc Ions as a Potential Carrier in the Controlled Release of Mercaptopurine. Materials 2023, 16, 4358. [Google Scholar] [CrossRef]
- Hasanzadeh, M.; Sadeghi, S.; Bageri, L.; Mokhtarzadeh, A.; Karimzadeh, A.; Shadjou, N.; Mahboob, S. Poly-Dopamine-Beta-Cyclodextrin: A Novel Nanobiopolymer towards Sensing of Some Amino Acids at Physiological pH. Mater. Sci. Eng. C-Mater. Biol. Appl. 2016, 69, 343–357. [Google Scholar] [CrossRef]
- Zhu, X.; Yang, Z.; Gan, D.; Cui, T.; Luo, H.; Wan, Y.; Zhang, Q. A Doxorubicin and siRNA Coloaded Nanolamellar Hydroxyapatite/PLGA Electrospun Scaffold as a Safe Antitumor Drug Delivery System. Appl. Mater. Today 2023, 31, 101759. [Google Scholar] [CrossRef]
- Rennick, J.J.; Johnston, A.P.R.; Parton, R.G. Key Principles and Methods for Studying the Endocytosis of Biological and Nanoparticle Therapeutics. Nat. Nanotechnol. 2021, 16, 266–276. [Google Scholar] [CrossRef]
- Poinard, B.; Kamaluddin, S.; Tan, A.Q.Q.; Neoh, K.G.; Kah, J.C.Y. Polydopamine Coating Enhances Mucopenetration and Cell Uptake of Nanoparticles. ACS Appl. Mater. Interfaces 2019, 11, 4777–4789. [Google Scholar] [CrossRef] [PubMed]
- Daniel, J.; Montaleytang, M.; Nagarajan, S.; Picard, S.; Clermont, G.; Lazar, A.N.; Dumas, N.; Correard, F.; Braguer, D.; Blanchard-Desce, M.; et al. Hydrophilic Fluorescent Nanoprodrug of Paclitaxel for Glioblastoma Chemotherapy. ACS Omega 2019, 4, 18342–18354. [Google Scholar] [CrossRef]
- Bass, A.D.; Place, E.F. Uric Acid and Allantoin Excretion in Normal and Tumor-Bearing Mice. J. Biol. Chem. 1949, 181, 81–87. [Google Scholar] [CrossRef]
- Ruggiero, C.; Cherubini, A.; Ble, A.; Bos, A.J.G.; Maggio, M.; Dixit, V.D.; Lauretani, F.; Bandinelli, S.; Senin, U.; Ferrucci, L. Uric Acid and Inflammatory Markers. Eur. Heart J. 2006, 27, 1174–1181. [Google Scholar] [CrossRef] [PubMed]


| Preparation | Size (nm) | D90 (nm) | PDI | ζ (mV) | EE (%) |
|---|---|---|---|---|---|
| PTX NPs | 134.5 ± 0.9 | 227.6 ± 11.8 | 0.108 ± 0.018 | −15.63 ± 2.34 | 85.06% ± 0.18 |
| PTX PD NPs | 136.8 ± 0.4 | 230.6 ± 7.4 | 0.136 ± 0.030 | −12.11 ± 1.82 | 87.31% ± 0.43 |
| PTX PD-RGD NPs | 137.6 ± 2.9 | 232.9 ± 11.7 | 0.104 ± 0.010 | −8.20 ± 1.24 | 81.72% ± 0.49 |
| Category | Units | Normal Group | Negative Control Group | Positive Control Group | PTX PD-RGD NP Group | PTX PD NP Group | Reference Range |
|---|---|---|---|---|---|---|---|
| Leukocyte | 109/L | 8.3 ± 1.4 | 217.6 ± 71.9 *** | 225.7 ± 46.4 *** | 220.9 ± 88.4 *** | 254.1 ± 69.9 *** | 0.8–8 |
| Lymphocyte | 109/L | 6.40 ± 2.10 | 84.6 ± 32.52 *** | 35.03 ± 29.89 *** | 74.63 ± 35.07 *** | 113.8 ± 26.00 *** | 0.7–6.0 |
| Monocyte | 109/L | 0.2 ± 0.1 | 9.4 ± 4.6 *** | 9.7 ± 4.9 *** | 9.7 ± 3.7 *** | 12.6 ± 4.6 *** | 0.0–0.3 |
| Neutrophil | 109/L | 1.7 ± 1.1 | 144.1 ± 104.9 *** | 180.9 ± 13.1 *** | 136.5 ± 95.3 *** | 103.5 ± 68.8 *** | 0.1–1.8 |
| Lymphocyte percentage | % | 74.9 ± 14.8 | 50.8 ± 39.8 | 14.2 ± 9.3 *** | 52.7 ± 5.8 | 57.6 ± 19.8 | 55.8–90.6 |
| Neutrophil/lymphocyte | -- | 0.27 ± 0.21 | 1.70 ± 2.10 | 5.17 ± 4.10 *** | 3.15 ± 2.71 | 0.83 ± 0.88 | -- |
| Erythrocyte | 1012/L | 8.50 ± 4.08 | 7.53 ± 1.65 | 9.42 ± 1.50 | 8.32 ± 0.36 | 6.90 ± 0.73 | 6.36–9.42 |
| Thrombocyte | 109/L | 1025 ± 79 | 1845 ± 768 *** | 619 ± 81 | 778 ± 114 | 894 ± 350 | 450–1500 |
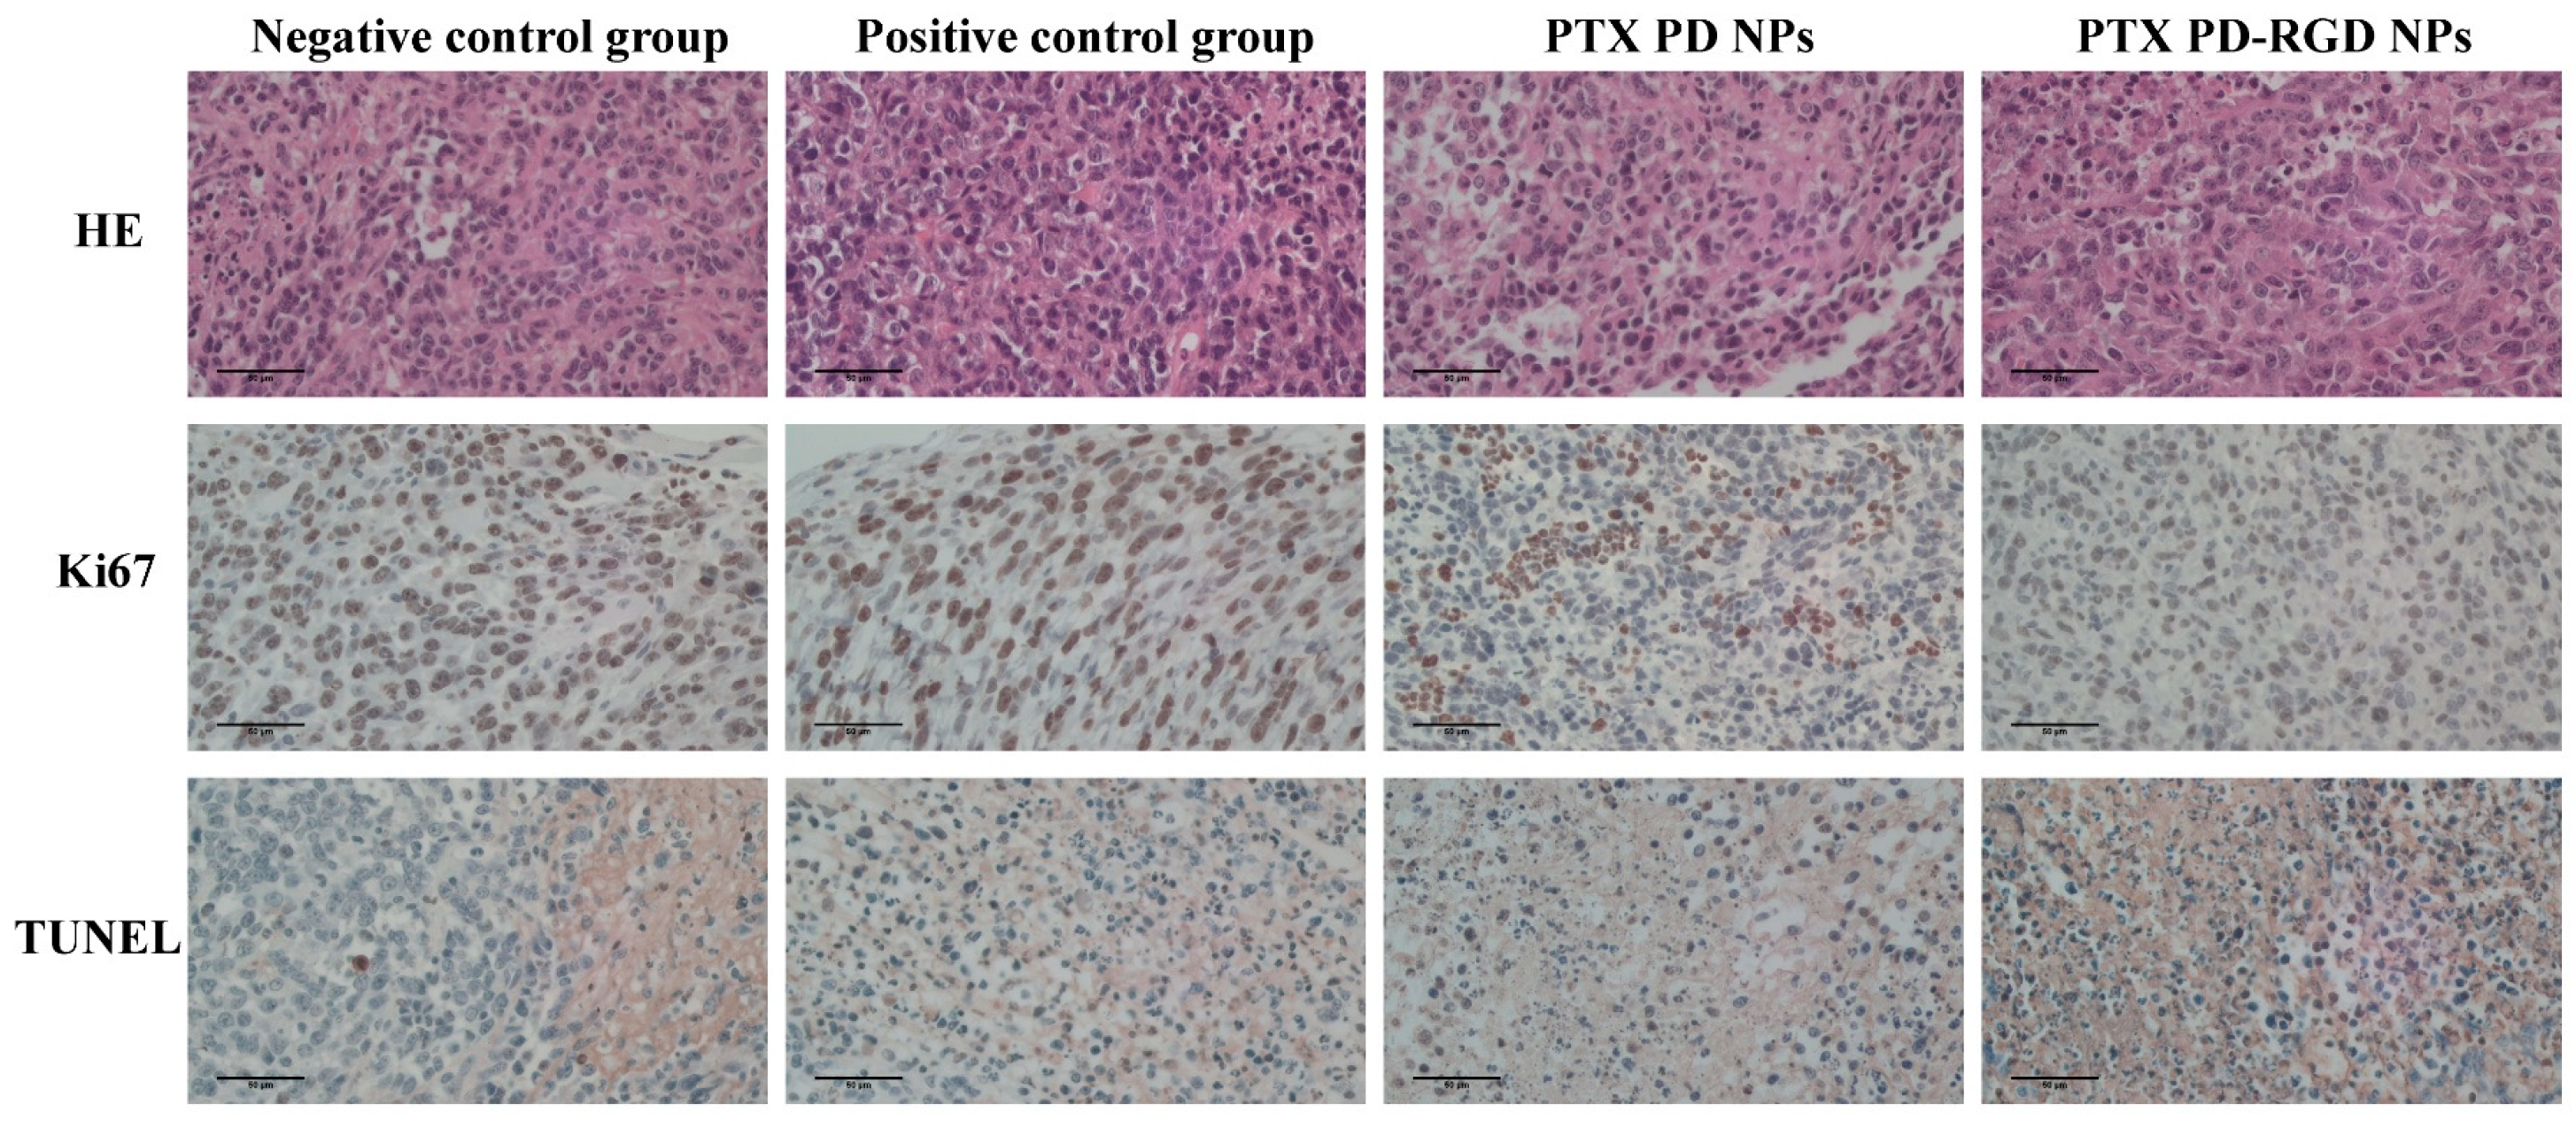
| Score | Negative Control Group | Positive Control Group | PTX PD NPs | PTX PD-RGD NPs |
|---|---|---|---|---|
| Ki67 | Positive | Low Positive | Low Positive | Negative |
| TUNEL | Negative | Low Positive | Low Positive | Positive |
Disclaimer/Publisher’s Note: The statements, opinions and data contained in all publications are solely those of the individual author(s) and contributor(s) and not of MDPI and/or the editor(s). MDPI and/or the editor(s) disclaim responsibility for any injury to people or property resulting from any ideas, methods, instructions or products referred to in the content. |
© 2023 by the authors. Licensee MDPI, Basel, Switzerland. This article is an open access article distributed under the terms and conditions of the Creative Commons Attribution (CC BY) license (https://creativecommons.org/licenses/by/4.0/).
Share and Cite
Yun, D.; Liu, D.; Liu, J.; Feng, Y.; Chen, H.; Chen, S.; Xie, Q. In Vitro/In Vivo Preparation and Evaluation of cRGDyK Peptide-Modified Polydopamine-Bridged Paclitaxel-Loaded Nanoparticles. Pharmaceutics 2023, 15, 2644. https://doi.org/10.3390/pharmaceutics15112644
Yun D, Liu D, Liu J, Feng Y, Chen H, Chen S, Xie Q. In Vitro/In Vivo Preparation and Evaluation of cRGDyK Peptide-Modified Polydopamine-Bridged Paclitaxel-Loaded Nanoparticles. Pharmaceutics. 2023; 15(11):2644. https://doi.org/10.3390/pharmaceutics15112644
Chicago/Turabian StyleYun, Dan, Dengyuan Liu, Jinlin Liu, Yanyi Feng, Hongyu Chen, Simiao Chen, and Qingchun Xie. 2023. "In Vitro/In Vivo Preparation and Evaluation of cRGDyK Peptide-Modified Polydopamine-Bridged Paclitaxel-Loaded Nanoparticles" Pharmaceutics 15, no. 11: 2644. https://doi.org/10.3390/pharmaceutics15112644
APA StyleYun, D., Liu, D., Liu, J., Feng, Y., Chen, H., Chen, S., & Xie, Q. (2023). In Vitro/In Vivo Preparation and Evaluation of cRGDyK Peptide-Modified Polydopamine-Bridged Paclitaxel-Loaded Nanoparticles. Pharmaceutics, 15(11), 2644. https://doi.org/10.3390/pharmaceutics15112644