3.1. Wall Deposition Problem
An atypical process yield behavior was observed during the spray-drying process development of the spray-dried powder of the model compound on dryer 1. The initial batch processed on a fully cleaned spray dryer achieved a wet yield of 98%. A typical acceptable wet yield for a spray-dried polymer product is >80% since some powder deposition on the wall is common and cannot be recovered. Additionally, wet yields above 100% can sometimes be observed because the drying solvent has not been completely removed from the powder. Most often, the spray drying process with yield issues shows the risk of yield loss in the first batch. Others might have a decreasing trend in yield in subsequent batches. However, in this experiment, the entire second batch was plagued with less than expected collection of spray dried powder with a significant yield reduction and net wet yield of 59% (Poor collection was noted through out the batch. To avoid significant wastage, in the middle of the second batch, solution spray was stopped and solvent was sprayed. An additional 15% of the batch was recovered. At the end of batch, additional gas flow was run to dislodge wall deposits and 13% of batch was recovered. 5% of material was recovered from wiping the walls of the chamber. These are not included in the calculation of the net wet yield in this paper.).
After the completion of the batch, the inner chamber walls were noted to have significant atypical powder deposition on the roof and near the top regions of the dryer as shown in
Figure 2A–C.
Samples of the powder collected from the cyclone during steady state operation and wall deposited powder were characterized and confirmed to have similar properties as seen by the morphology SEM images in
Figure 2D,E, particle size and density along with measured glass transition temperature, T
g in
Table 1. The details of characterization techniques are included in the
supplementary section. The differences in the material properties are within the standard batch-to-batch variability. These observations confirm that other common failure modes leading to spray dryer wall deposition, such as incomplete atomization or poor droplet drying leading to agglomeration on walls, were not contributing to this specific problem as significantly larger and agglomerated particles and associated potential shifts in bulk density properties particles would have been noted.
3.2. Approach to Evaluate Potential Root Causes
3.2.1. Repeatability Test
At the outset of troubleshooting the atypical yield problem, we established an experiment to test the occurrence of yield reduction problems during two-batch manufacture on a second Pharma Spray Dryer-2. Same operating conditions, namely, same set of inlet conditions (inlet gas temperature, gas and solution flow rate, and condenser temperature) were used and these resulted in a similar outlet temperature at the exit of the spray dryer. However, the two spray dryers and their operation had some potential and some known differences, namely, (i) potential differences in the design of gas dispersers (proprietary knowledge), (ii) differences in specifications on the surface finish of inner walls, (iii) the second spray-dryer did not include the in-situ particle size analyzer, and (iv) differences in start-up and shut-down conditions.
A comparison of in-process or running yields was conducted in the two spray drying experiments. Running wet yield during the spray drying batch is calculated as the ratio of the amount of wet powder collected to the amount of solids sprayed from the beginning of the batch up until the given time point in the batch and is expressed in percentage. Since the wet spray dried powder contains approximately 3–4.5% of solvent, the wet yield can exceed 100%. The in-process running wet solids collected against the amount of solids sprayed over two consecutive batches of spray drying is shown in
Figure 3A. Translating the mass of wet solids to the running wet yield (as a function of the amount of solids sprayed) in
Figure 3B, we find a noticeable difference in the wet yield between the two dryers for the second consecutive spray. In both dryers, the running yields have acceptable yields of >80% throughout the first batch. However, the second consecutive spray shows significantly lower product collection throughout the run in dryer 1 compared to the collection in dryer 2. As a result of the reduced net yield in dryer 1, nonstandard processing steps were performed to recover the wall deposits (To avoid significant wastage, in the middle of the second batch, solution spray was stopped and solvent was sprayed. An additional 15% of the batch was recovered. At the end of the batch, the additional gas flow was run to dislodge wall deposits, and 13% of the batch was recovered. Approximately 5% of the material was recovered from wiping the walls of the chamber. These are not included in the running wet yield.). While wall deposition was observed in dryer 2, these were typical of pharmaceutical spray drying with a build-up in the lower portions of the dryer. Wall deposition was not noticeable on the roof and the upper portion of the dryer.
Since dryer 2 did not show significant wall deposition and the resulting yield reduction, we focused our attention on the known differences between the two spray dryers and assessed each of our hypotheses systematically.
3.2.2. Root Causes for Investigation
An initial representation of the root causes for yield reduction based on our observations and our review of spray drying literature. We established three major categories: equipment, process, and material properties of the product, or an interplay of some or all these factors as shown in
Figure 4. Based on the results of the repeatability test, we classified the known differences between dryer 1 and dryer 2 into targeted hypotheses within these categories to enable systematic investigation.
Equipment design elements, such as the surface roughness of the inner walls and gas disperser design could be responsible for the wall adhesion of partially dried spray-dried powder. Since gas disperser design is proprietary knowledge, the focus of the investigation was on surface roughness and gas flow variability.
The atypical wall deposition noted on the roof and upper walls of the drying chamber (
Figure 2A–C) of a co-current spray dryer, raised concern that gas flow variability is a possible root cause. Yield reduction was noticed only during the second batch of a series of batches; therefore, the choice of shutdown and startup conditions was considered a potential factor.
Further, an understanding of the dependence of glass transition temperature on processing parameters such as outlet temperature and the concentration of the solvent in the drying gas could provide insight into factors leading to the adherence of spray-dried powder to the walls.
In our approach to understanding and overcoming yield reduction, we critically analyzed process parameters for unexpected behaviors and attempted to correlate process observations and our potential root causes. We will study testable hypotheses through targeted experiments at the laboratory scale when appropriate, and finally, implement a combination of our learnings on the spray dryer towards mitigating the yield reduction problem.
3.4. Equipment as Root Cause: Gas Flow Variability
During a typical operation of the spray drying process, the swirling gas flow patterns introduced into the spray dryer by the gas disperser results in drying the sprayed droplets and entrainment of the spray-dried powder to the cyclone with some wall deposition on the lower conical portion of the dryer. Due to the unexpected wall deposition of spray-dried powder on the roof and the upper cylindrical section of dryer 1 while operating at the same target conditions as dryer 2, a review of instrument data on gas flowrate, exhaust valve, and bag house filter differential pressure was assessed on a representative batch from the data historian on dryer 1.
The results of the data analysis in
Figure 6 showed that during the spray drying operation on dryer 1, an unexpected, periodic, and nearly sinusoidal variation in gas flow rate between ~380 to ~412 kg/h occurred when the set point was 400 kg/h. Since the closed cycle operation of the dryer utilizes a pressure control loop to maintain the level of nitrogen in the system, the control system monitored the variation of pressure on the return line (return loop pressure) from the spray dryer and responded by either adding nitrogen or opening an exhaust valve to maintain spray dryer chamber pressure. The pressure control loop was working in a cyclical mode with the exhaust valve opening and closing approximately 7.5 times a min modulating the percentage of blower capacity usage. This variation in gas flow rate and pressure gradients could disrupt the gas flow patterns in the spray dryer and potentially direct particle trajectories to the roof and upper walls of the spray dryer.
Potential sources of pressure variation are gas purges from the sealing shaft of the blower and the inline particle size analyzer, gas supply to differential pressure instruments on the cyclone and the baghouse filters, and pulsing of the bag house filters. One or a combination of these sources could trigger the pressure control loop to cause the observed gas flow variability. We found that modifications could not be made to the sealing shaft of the blower or the differential pressure instruments on the cyclone to ensure adequate operation of the dryer. Further, dryer 2, which does not have yield reduction issues, also does not have the inline particle size analyzer. Therefore, our approach to reducing the gas flow variability involved the removal of the inline particle size analyzer.
The removal of the inline particle size analyzer and the associated nitrogen purge removed the high-frequency periodic (almost sinusoidal) variation in gas flow rate as seen in
Figure 7B compared to
Figure 7A. However, less frequent pulsing is noticeable in the gas flow rate-time graph, and the steep changes in flow rate are representative of exhaust valve motion when the valve is opened.
To further reduce this observed variability, we turned our attention to optimizing the pulsing operation of baghouse filters. The pulse frequency of the bag house filter was revised from 120 to 900 s thereby reducing the rate of nitrogen supply to the system for pulsing. The effect of this additional change on the gas flow rate-time graph is depicted in
Figure 7C. The reduction in variability was quantified by evaluating the relative standard deviation. From the initial state (
Figure 7A) to the removal of the inline purge (
Figure 7B) coupled with a reduction in the pulsing frequency of the bag house filter (
Figure 7C) reduced the relative standard deviation in gas flow rate from 2.8% to 1.2% to 0.8%. The corresponding reduction in the frequency of exhaust valve operation decreases from approximately 7.5 times a min (
Figure 7A) to 0.3 times a min (
Figure 7B) to 0.1 times a min (
Figure 7C).
These approaches to reduce gas flow variability were implemented along with other mitigations from other root causes of the spray drying process in later sections and the results of the experiment are as discussed in
Section 3.6 (overcoming yield reduction due to wall deposition). Briefly, a significant improvement in reducing the extent of wall deposits was observed in the upper part of the chamber walls and the roof. Only a slight dusting was noted compared to the extensive coverage without these changes.
3.5. Root Cause: Interplay of Material Properties and Process
While previous factors such as surface finish and gas flow variability could create conditions that support the wall deposition of the spray-dried powder, it is the material properties of the powder at specific process conditions that cause the powder adhesion to the wall. Therefore, to understand the stickiness of the powder, studies of glass transition temperature dependence on the level of spray-solvent in the powder and sorption studies were conducted. Thereafter, the operating conditions of the spray dryer were critically evaluated against this material property behavior to postulate potential root causes for the increased wall deposition during the second batch of spray drying.
Modulated DSC experiments were conducted in hermetically sealed pans of spray-dried powder pre-equilibrated with different amounts of acetone. The glass transition of the spray dried powder was detected by heat capacity variations with temperature and reported as the onset of glass transition temperature (T
g, onset) and mid-point glass transition temperature (T
g), respectively.
Figure 8A shows the dependence of T
g, onset, and T
g on the weight percent of acetone in the spray-dried powder. Independently, the amount of acetone in the wet spray dried powder when operating at the process outlet temperature range of 38–48 °C was measured to be 3.4–4.6% (
w/
w). As shown in the shaded region in
Figure 8A, the process window overlaps with T
g, onset of the wet spray dried powder, and spans to the mid-point T
g line potentially making the powder prone to stick to walls.
Additionally, isothermal acetone sorption of spray-dried powder and the rate of sorption of acetone were studied experimentally using dynamic vapor sorption as shown in
Figure 8B,C. The hysteresis in the change in the level of acetone (% by weight) during absorption (red solid line) and desorption steps (red dashed line) showed that a higher level of acetone is retained in the powder during the desorption process. A second cycle of sorption (green) resulted in a higher level of acetone retained by the powder compared to the first cycle. Further, when dried spray dried powder is exposed to 14.5% P/Po corresponding to the condition expected during a target closed loop operation of the spray dryer, very rapid uptake of acetone is observed raising concern about any undesired shifts in acetone content in the process gas. The combination of these studies shows that the spray-dried powder is prone to rapid uptake of solvent which plasticizes the powder. This plasticization could bring the powder close to its stickiness point temperature. The hysteresis in acetone sorption and desorption data suggests the material may be slow to release the acetone back during process shutdown or setpoint changes. Theoretically, these properties could lend the spray dried powder to a higher risk for sticky behavior and wall adhesion.
With an understanding of these material properties, and knowing the process parameters, we estimate the thermal history, and residual solvent concentration that wall-deposited powders are exposed to, in relation to glass transition behavior. The various steps of the operation per batch are (i) heat-up phase, (ii) solvent start-up phase, (iii) solution phase (spray dried powder is produced in this phase), (iv) solvent shutdown followed by (v) cool-down phase and (vi) gap period before the start of next batch.
Wall deposits are expected to be first formed during the solution phase (iii) when the first batch of the spray-dried solution is sprayed. Noting that the residual solvent concentration in the wet spray dried powder leaving the spray dryer is between 3.4–4.6% (
w/
w), as noted in
Figure 8A, the process outlet temperature overlaps with the T
g, onset temperature of wet spray dried powder exiting the spray dryer. Therefore, the powders deposited on the wall are exposed to conditions that could cause it to stick to the wall. Switch from solution to solvent shutdown phase (iv) maintains a similar process temperature and partial pressure of solvent, and therefore no significant change in behavior is expected.
In the cool-down phase (v) of the first batch, the solvent spray is turned off, and shortly afterwards, the inlet temperature is slowly ramped down as shown in
Figure 9. Given the sudden loss in evaporation heat sink as a result of turning off the solvent spray, there is a short-term spike in outlet temperature up to 70 °C before slowly decreasing to room temperature. This happens because the inlet gas is heated by an electric heater. Electric heaters do not have a cooling function and the elements only cool by removal of heat from the flowing gas which is a slow process. Therefore, since heat removal from evaporation is no longer occurring, the outlet gas temperature increases briefly before ramping down. During these processes, outlet temperature spikes with almost no solvent present in the drying gas, the temperature of wall deposits could exceed T
g, onset and potentially increase the stickiness of the wall deposits. Process modifications to the cool-down step, (which is described later in
Table 2), were successful in decreasing the extent of the outlet gas temperature spike and minimized thermal exposure of the wall deposits.
The next phase is the gap between two batches (vi), wherein the spray dryer remains shut down until the start of the next batch, and the spray dryer is not maintained in an inert state. Therefore, the wall deposits are equilibrated with room moisture. The presence of moisture could result in plasticization and reduction of Tg of the wall deposits. Thus, the spray, solvent shutdown, cool down and gap phases of the first batch seem to ensure that a small fraction of wall-deposited powders remain stuck to the wall even as we get an acceptable yield of 98% for this batch.
During the gas flow Heat-Up phase of the second batch, heated gas is blown through the drying chamber to warm up the equipment. The chamber is maintained at an outlet temperature of 65 °C for approximately 2 h, once again exposing the wall deposits from batch 1 to thermal conditions at or above Tg, onset and rendering the material more adhesive.
During the solvent startup phase of the second batch, the condenser set point changes from −5 °C to −15 °C at the same time when the solvent spray is initiated. Therefore, for a short 15–20 min until the condenser stabilizes to −15 °C, the inlet gas to the chamber carried a higher partial pressure of acetone leading to elevated acetone concentration in the resulting outlet gas. At 5 °C, thermodynamic modeling and estimation of saturation pressure via Antoine’s equation suggests the chamber outlet gas could go as high as 26% P/Po whereas it will drop to ~14% at steady-state operation at −15 °C. Acetone diffuses into the wall deposits, with the surface of wall deposits prone to higher concentrations of acetone and therefore further Tg reduction. These characteristics coupled with other root causes could make the wall deposits more likely to accumulate more particles during the solution spray phase of the second batch.
In contrast, dryer 2 with shorter start-up and short down periods, and different temperature control which led to fewer temperature spikes, may have avoided priming the wall deposits for future accumulation and therefore maintained the yields during the second batch. Thus, two mechanisms, exposure of wall deposits to temperatures higher than Tg, onset and exposure to conditions that lower the Tg of wall deposits were identified as root causes after critical assessment of the interplay of material properties and process conditions. The specific process conditions identified were specific to the long duration of the gas flow start-up and shutdown period, and specific settings to avoid temperature or acetone partial pressure spikes during start-up and shutdown. Additionally, we postulate that maintaining the inertness of the chamber between batches could also help avoid depression in the glass transition temperature of wall deposits.
3.6. Overcoming Yield Reduction Due to Wall Deposition
Based on our understanding of the root causes, and hypotheses leading to increased wall deposition, we assimilated the various mechanisms, namely gas flow stabilization, exposure of wall deposits to temperatures higher than T
g, onset and exposure to conditions that lower the T
g of wall deposits. Based on the root cause investigation, we identified process parameters to address the mechanism that impacts the yield. A summary of the mechanism and the process/equipment parameter to be revised are provided in
Table 2. We conducted another experiment with multiple batches to implement all these factors, excluding any revisions to surface finish, to assess the change in yield behavior of dryer 1.
Table 2.
Summary of mechanism and process parameters to improve yield.
Table 2.
Summary of mechanism and process parameters to improve yield.
| Target Mechanism | Parameter |
|---|
| Gas Flow Stabilization | Removal of Particle Size Analyzer and Associated Purge |
| Increased cycle time between bag filter pulse event |
| Exposure to Temperatures above Tg, onset | Minimize Inlet Temperatures during Heat Up Phase |
| Minimize Heat Up duration during Heat Up phase |
| Lower Inlet Temperature during cool-down phase of shutdown |
| Tg Suppression | Maintaining inert chamber between batches |
| Condenser equilibrated to set point prior to solvent startup (at the end of Heat Up phase) |
The resulting yield improvement on a series of four consecutive batches is shown in
Figure 10. The overall yield for each batch is greater than 90%. We note that wall deposition on the roof and upper portion of the chamber walls experienced slight dusting after the initial batch and it remains unchanged through the remaining batches. However, in dryer 1, the initial running yield of the second and other consecutive batches during the solution phase is still poor, but much more improved compared to the initial experiment indicating that wall adhesion is reduced but not eliminated. We note that while the impact of individual factors on the yield of the batch was not available, these improvements to the processing were also useful in ensuring that the product was not exposed to conditions that modify the physical characteristics of the powder.
Furthermore, this improvement was achieved without any significant changes to the target operation of the spray drying of the product. This approach was critical for pharmaceutical spray drying processing because if significant process changes to the target spray drying process are required then it could impact the performance of the tablet which contains the spray-dried powder. The impact of such changes, especially during later stages of drug product development may require additional studies to confirm the acceptability of such changes. In worst cases, such changes could impact the shelf life of the product and therefore, may not be feasible for the product.
A closer look at the running yield performance for the 4th batch indicates a marginal decrease in the final product yield compared to the previous batches. Thus, while the approaches identified above have been effective in mitigating yield reduction for a reasonable number of batches, the risk of wall deposition leading to reduced yields increases forlarger number of consecutively run batches. This behavior could be because, during the steady state operation of the dryer, the gas temperature and acetone partial pressure could bring the wall deposited spray dried powder close to the Tg, onset temperature. However, from a practical perspective, when 5–10 batches are required to be sprayed consecutively, it is common practice to scale up to the next larger scale to reduce the operational burden.
3.7. Recommendations for Overcoming Yield Issues during Different Stages of Development
Applying the learnings to the development of future amorphous solid dispersions especially during early stages of drug development, we highlight general and targeted approaches identified here to avoid the occurrence of such issues proactively. It is well-known that the process conditions of the spray drying process (such as the liquid: gas flow rate and process temperature) need to be chosen such that the product experiences temperatures below its wet glass transition temperature. It is also known through the review of the literature on sticking and wall deposition [
7,
9], that sticking often occurs at temperatures above the glass transition temperature. Studies have evaluated the rate and extent of wall deposition as a function of T-T
g [
22]. However, occasionally for some drug and polymeric spray dried powders, operating at a temperature corresponding to the onset of the wet glass transition temperature (despite being below T
g) may exhibit atypically strong adhesion to the wall leading to reduced yield and delayed recovery.
Therefore, during the early development of the spray drying process, characterization of the dependence of wet glass transition temperature (T
g as well as T
g, onset) on the residual solvent levels relative to the operating conditions are critical. If the intended processing condition overlaps with wet T
g,onset region as such in
Figure 8A, then there are several approaches listed below that may be proactively applied to avoid the occurrence of risk [
23].
A process-centric approach involves moving away from and below the wet T
g, onset curve (
Figure 8A) by reducing the liquid: gas flow rate and/or process outlet temperature (T). Such a process space can be estimated using a simple energy balance model of the spray dryer. Such approaches are robust if complemented by experimental confirmation of yield robustness over a wider range of the liquid: gas flow rates and processing temperatures in addition to the impact on the attributes of the resulting spray-dried powder on the final drug product. Attention to the start-up and shutdown procedures should be paid to avoid conditions that cause depression in the wet glass transition behavior and cause depression of the wet glass transition behavior and exposure of wall deposited powder to a temperature above the glass transition temperature.
Formulation-centric approaches include a selection of polymeric stabilizers or modification of the ratio of drug to polymer to ensure that the resulting amorphous solid dispersion has sufficiently high T-Tg, onset. Modification of solvent systems could also be considered if the new solvents can adequately modify the glass transition temperature dependence on the residual solvent level of the new solvents such that T-Tg, onset is high. Modification of solvent systems could also be considered if the new solvents can modify the glass transition temperature dependence on the residual solvent level of the new solvents.
When applying our learnings to the occurrence of reduced yield behaviors later in drug development as in our case, we recommend an assessment of the mechanisms. At the first observation of yield reduction, it is important to confirm or rule out common failure modes leading to wall deposition, such as atypical or incomplete or significant differences of atomization arising from nozzle variability or poor droplet drying leading to agglomeration on walls. By comparing the attributes of wall-deposited material against the steady-state material, we confirmed that these failure modes were not contributing to this specific problem as significantly larger and agglomerated particles would be expected and associated potential shifts in bulk density properties. If the attributes are different [
24], a thorough assessment of attributes can be used to identify root causes such as the sensitivity of atomization and/or the interplay with the gas flow in the drying chamber.
If the mechanisms point to the interplay of glass transition thermodynamics with processing space, employing practical approaches demonstrated here to avoid conditions prone to depression of glass transition temperature and exposures to a temperature above glass transition temperature could be useful. It is important to note that the changes to start and shutdown conditions in addition to a reduction of gas flow variability arising from inline analytical equipment were adequate to improve the yield in our case because the overall target processing was not at or above the wet glass transition temperature of the powder. We also note that although this study has been effective in mitigating yield reduction for a few batches, wall-build up can impact yields when running a longer number of batches. Therefore, if the implementation of these changes does not result in significant improvement in yield, then approaches such as process or formulation changes proposed for the early stage of drug development may be necessary.
Further, during the technical transfer of the spray drying process to different spray drying units, a critical assessment of gas flow variability must be conducted in addition to other process fit considerations. In our case, while the variations in gas flow were noted, they were attributed to normal process variability until a targeted in-depth understanding of the gas flow and the feedback control clarified that the source of near periodic variability was due to the presence of the inline analytical equipment. Therefore, a thorough assessment studying the impact of additional inline equipment on the gas flow variability during qualification is important for the successful operation of the spray drying.


 and
and 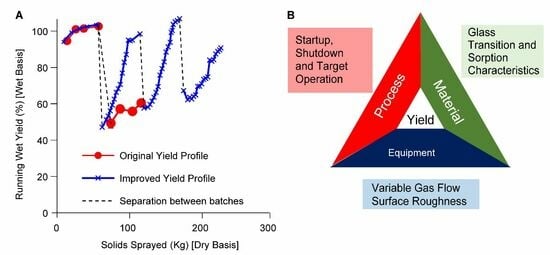


