
Applications of the Cholesterol Metabolite, 4β-Hydroxycholesterol, as a Sensitive Endogenous Biomarker for Hepatic CYP3A Activity Evaluated within a PBPK Framework


Abstract
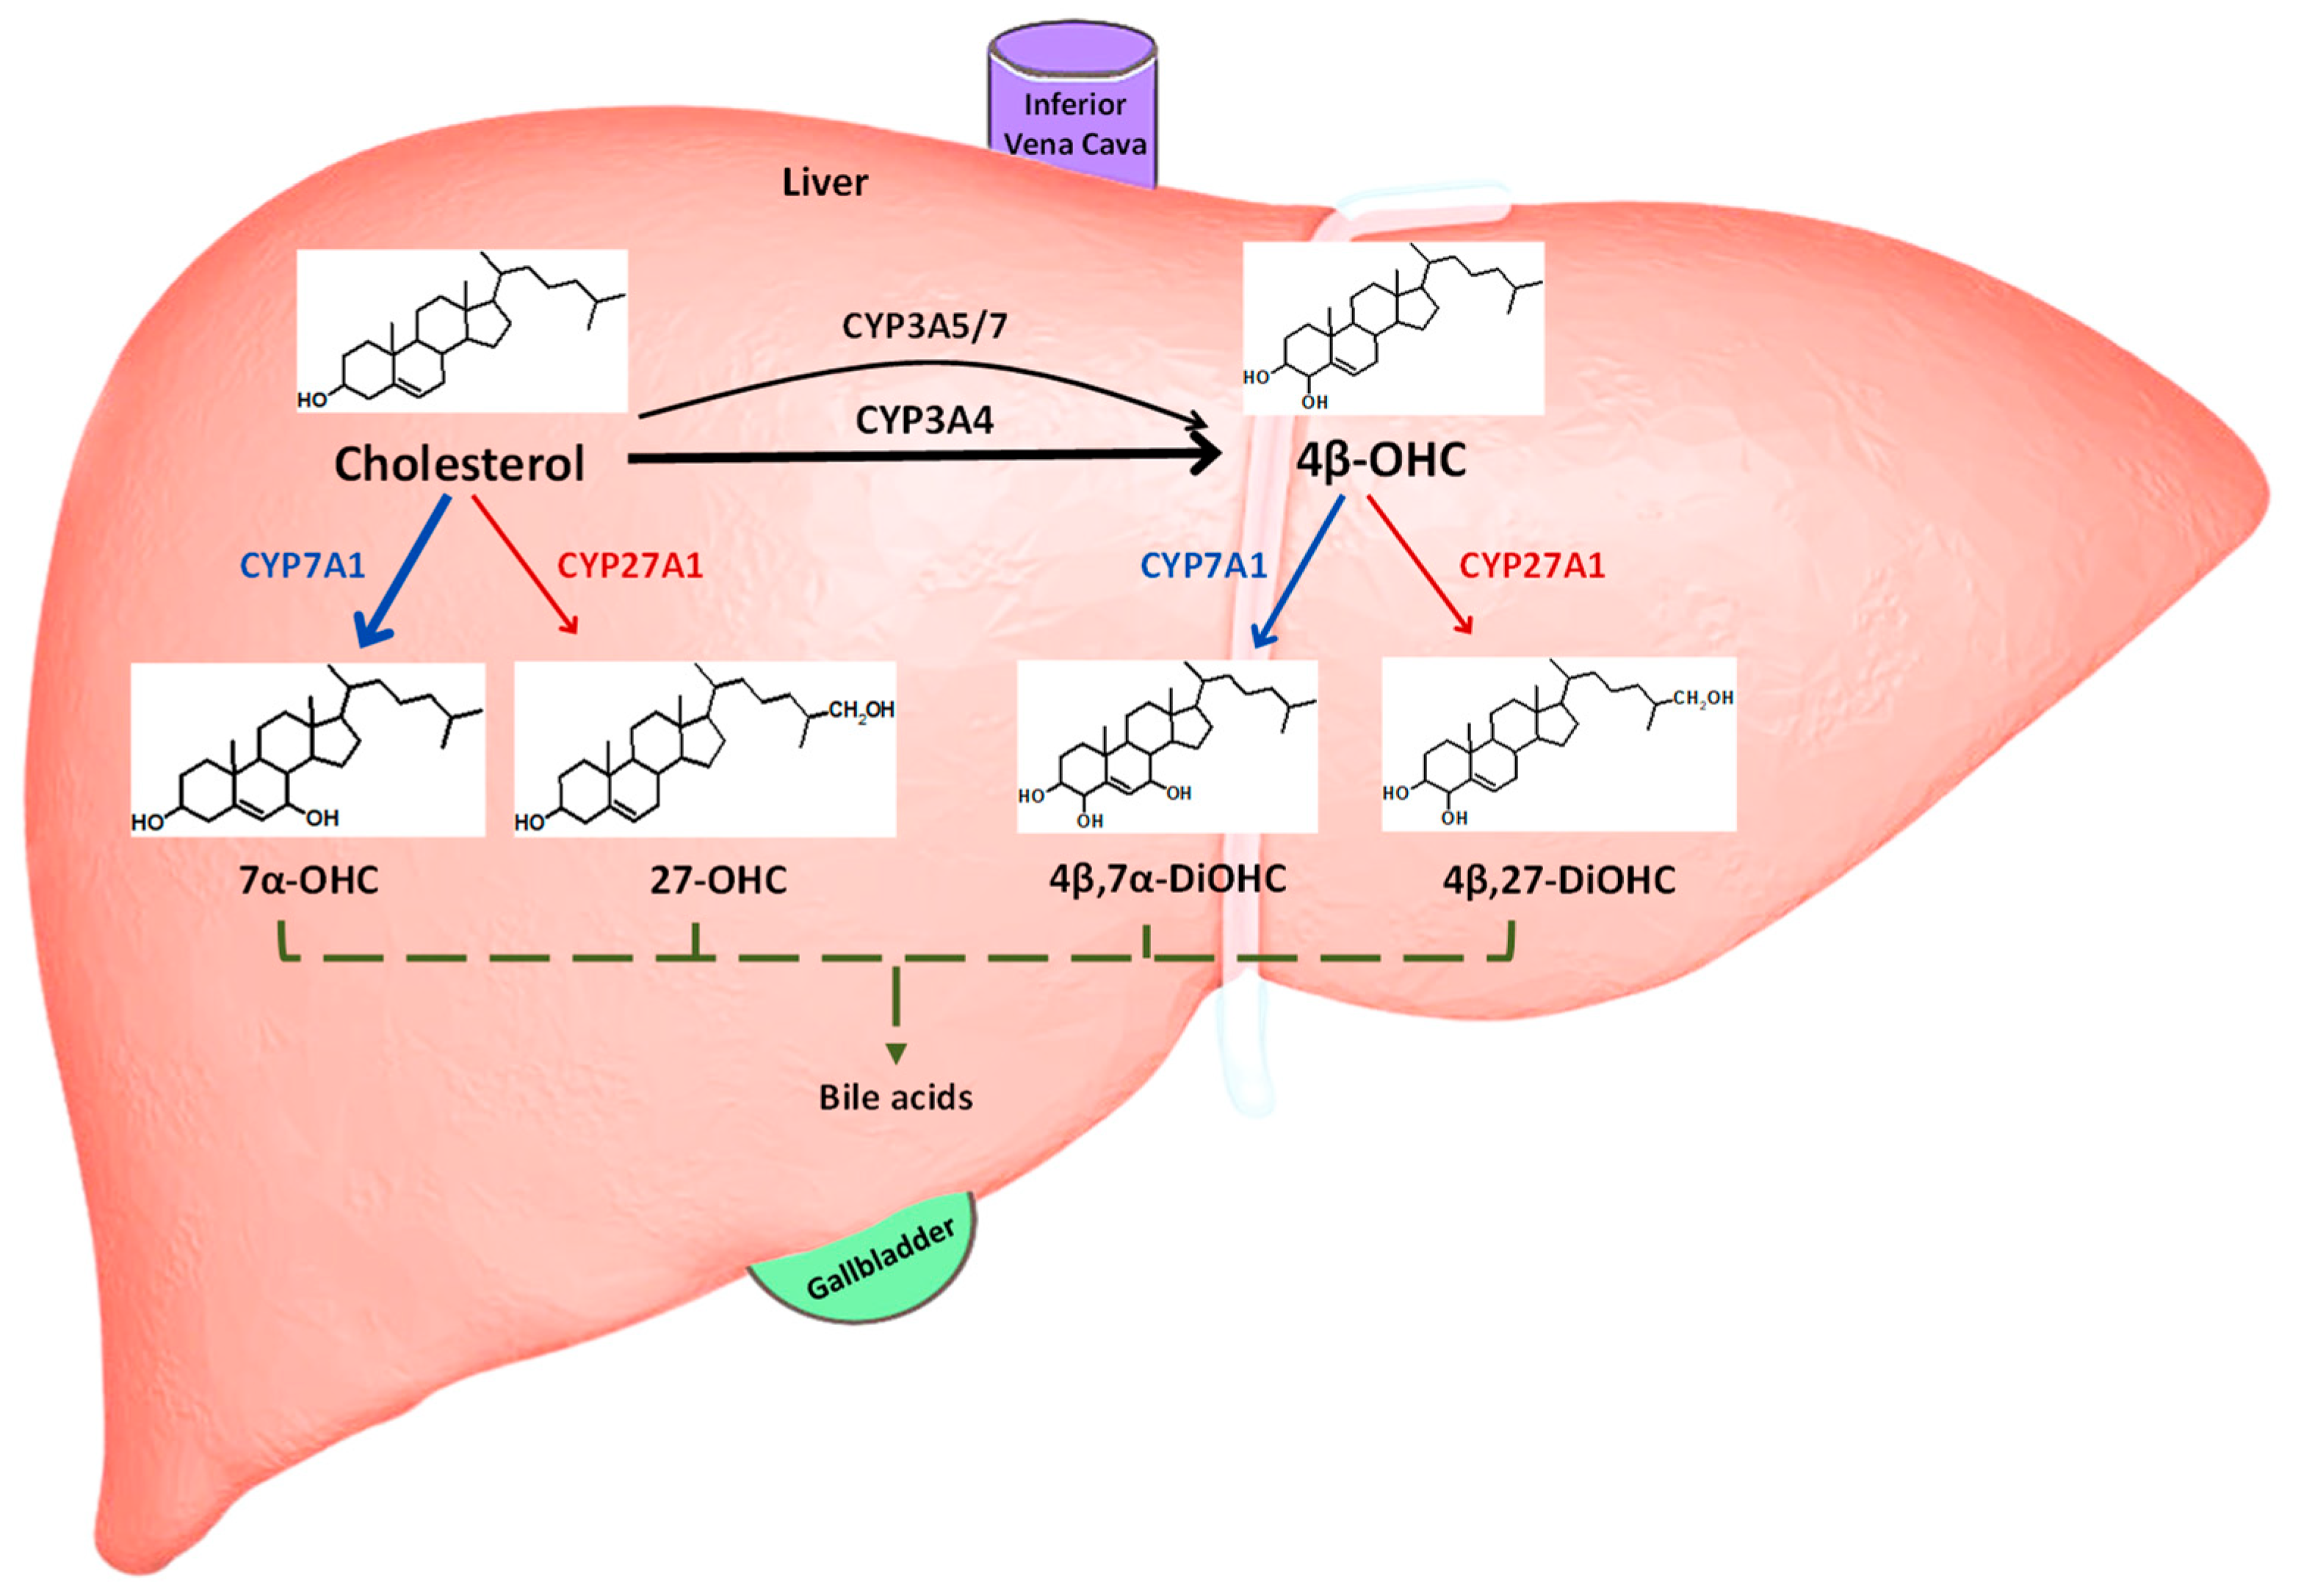
1. Introduction
2. Materials and Methods
2.1. Establishing 4β-OHC Baseline Plasma Concentrations across Populations by Meta-Analysis
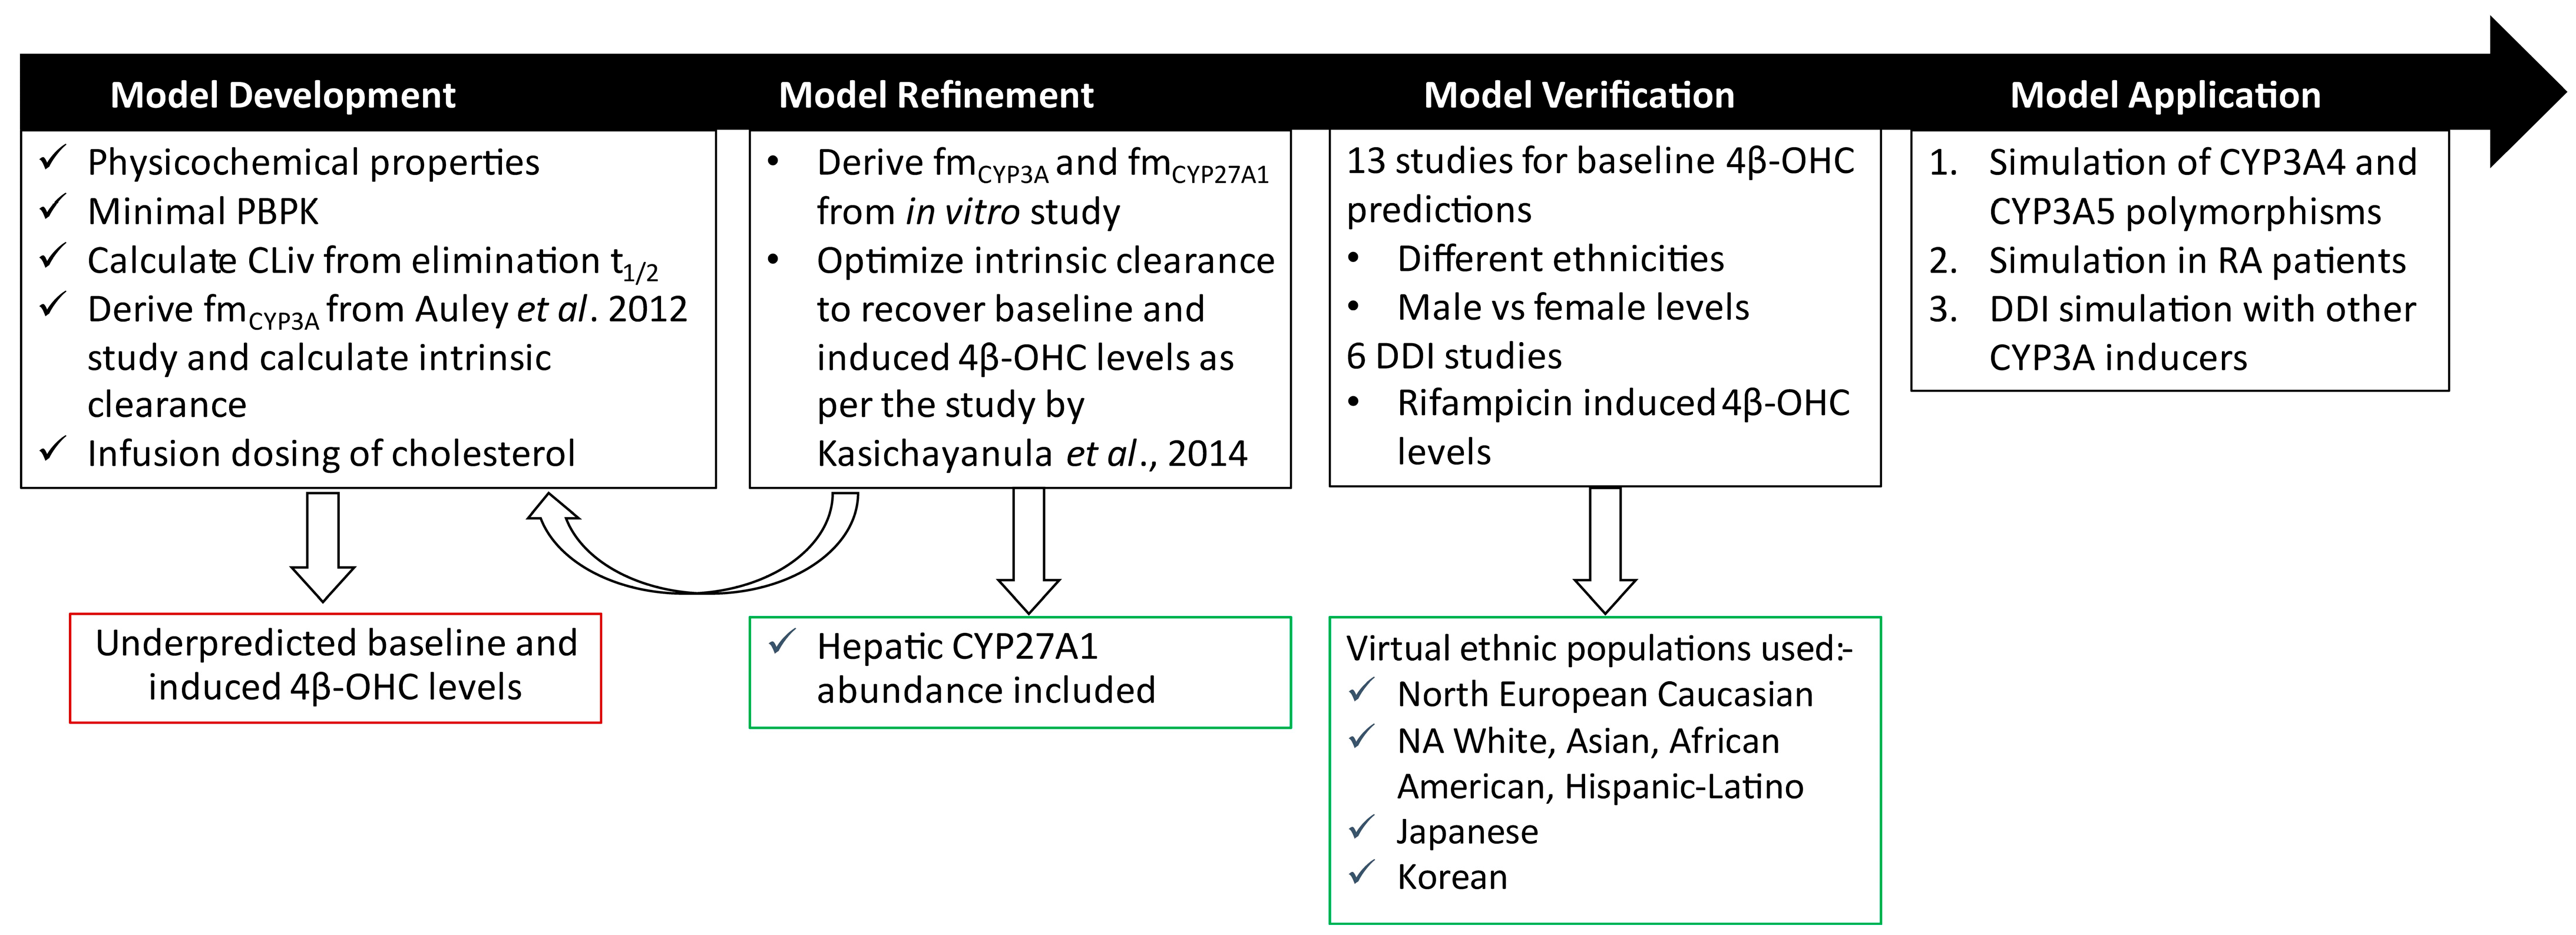
2.2. PBPK Model Development
2.2.1. Distribution
2.2.2. Elimination
- Step 1: Calculation of CYP450-Specific Intrinsic Clearance of Cholesterol
- Step 2: Optimization of Fraction Metabolized by CYP3A ()
2.2.3. Trial Design
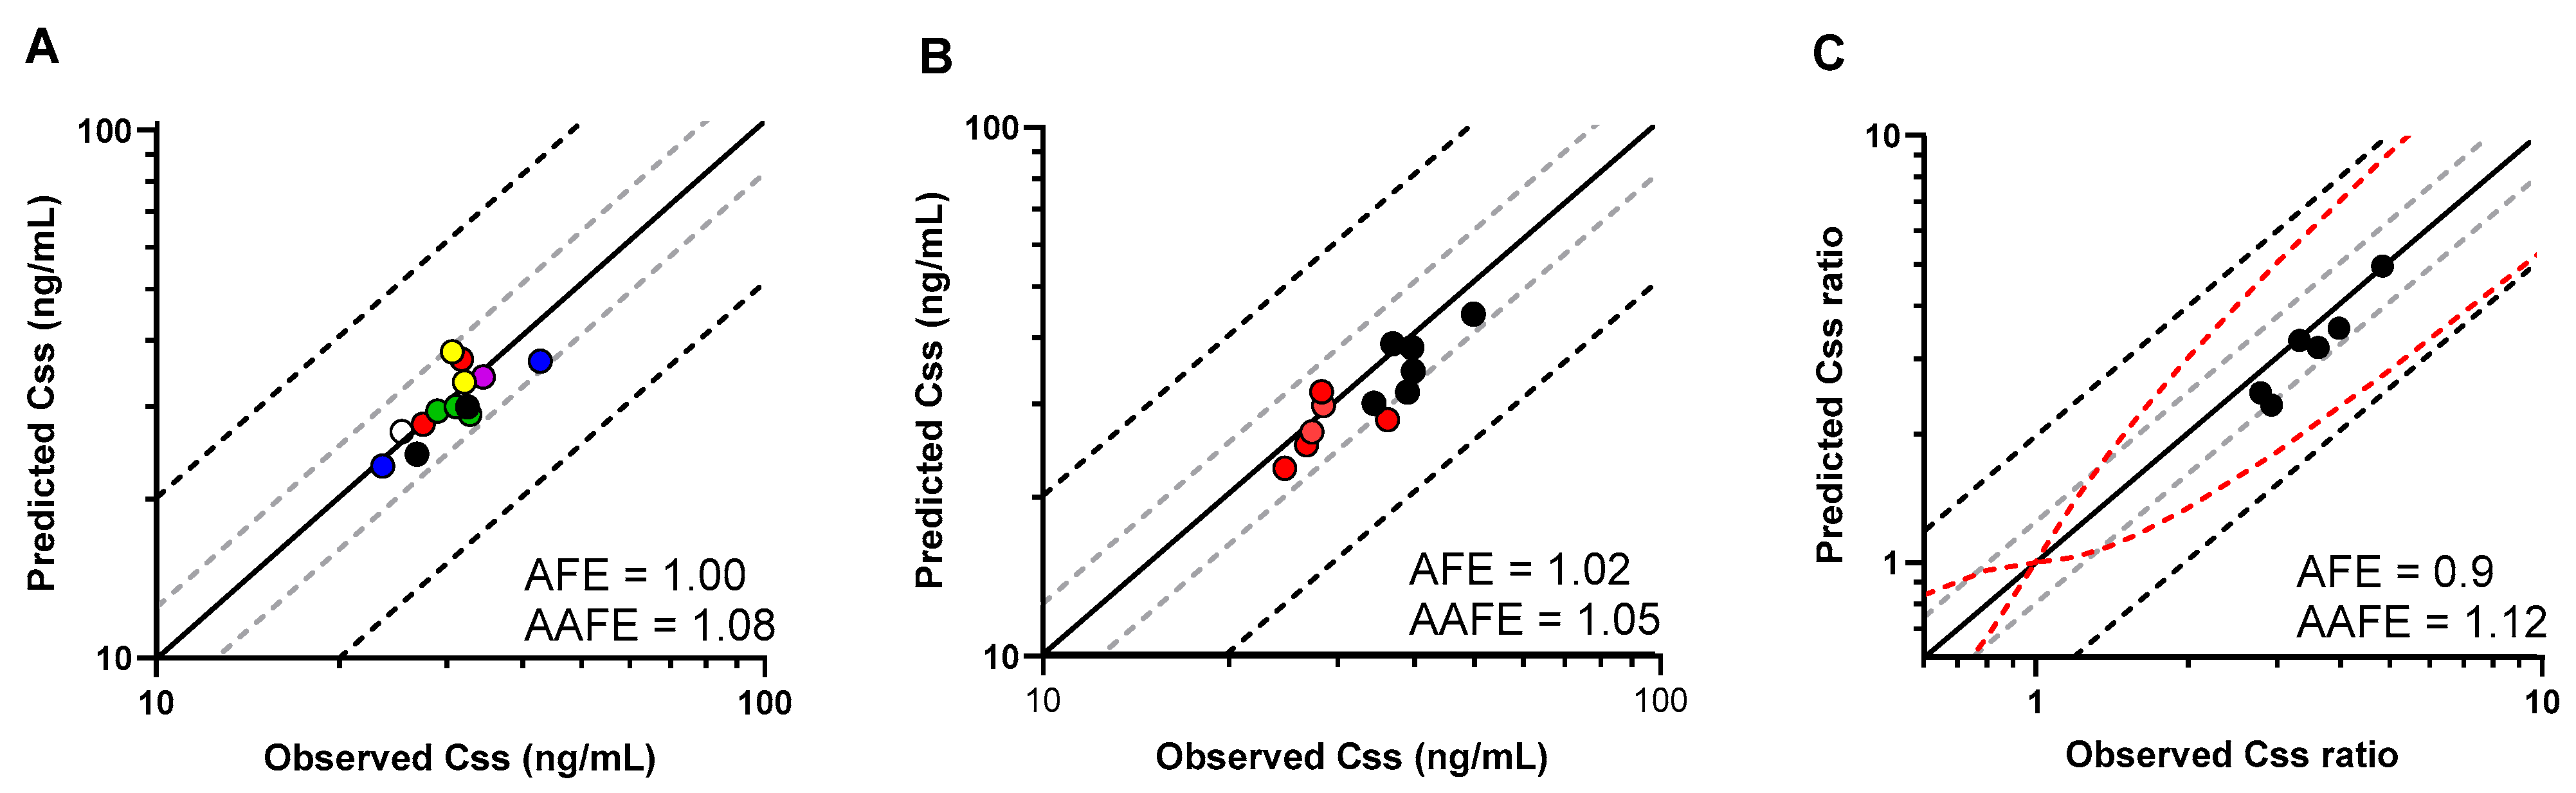
2.3. PBPK Model Performance and Verification
2.4. Statistical Assessment of Model Prediction Accuracy
2.5. PBPK Model Application
2.5.1. CYP3A4 Polymorphism
2.5.2. CYP3A5 Polymorphism
2.5.3. RA Patients
2.5.4. Effect of Other CYP3A4 Inducers
2.6. Statistical Analysis of 4β-OHC Levels in Different Groups
3. Results
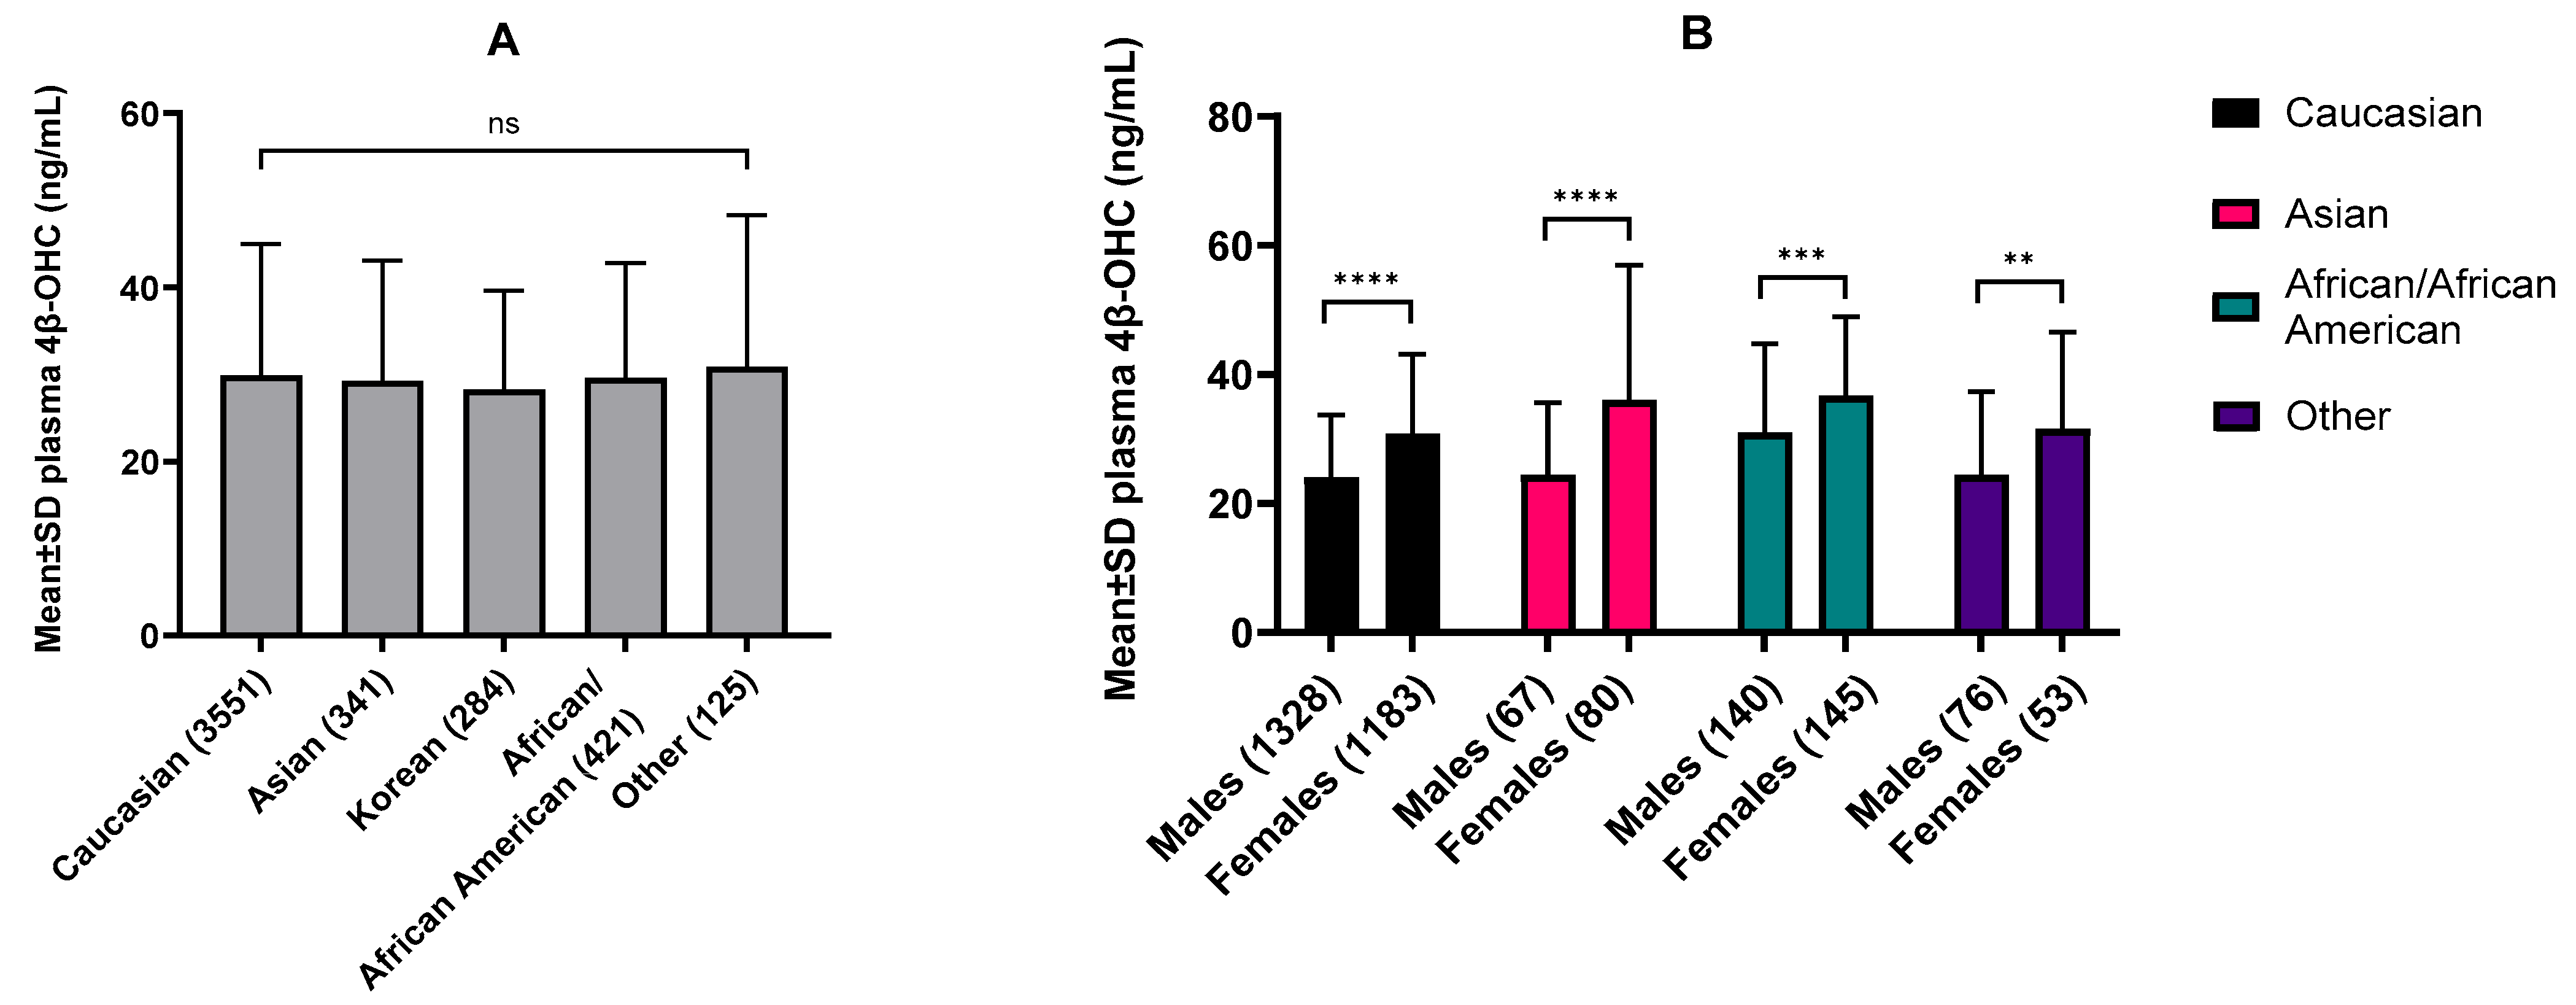
3.1. Ethnic and Sex-Specific Differences in Baseline 4β-OHC Levels
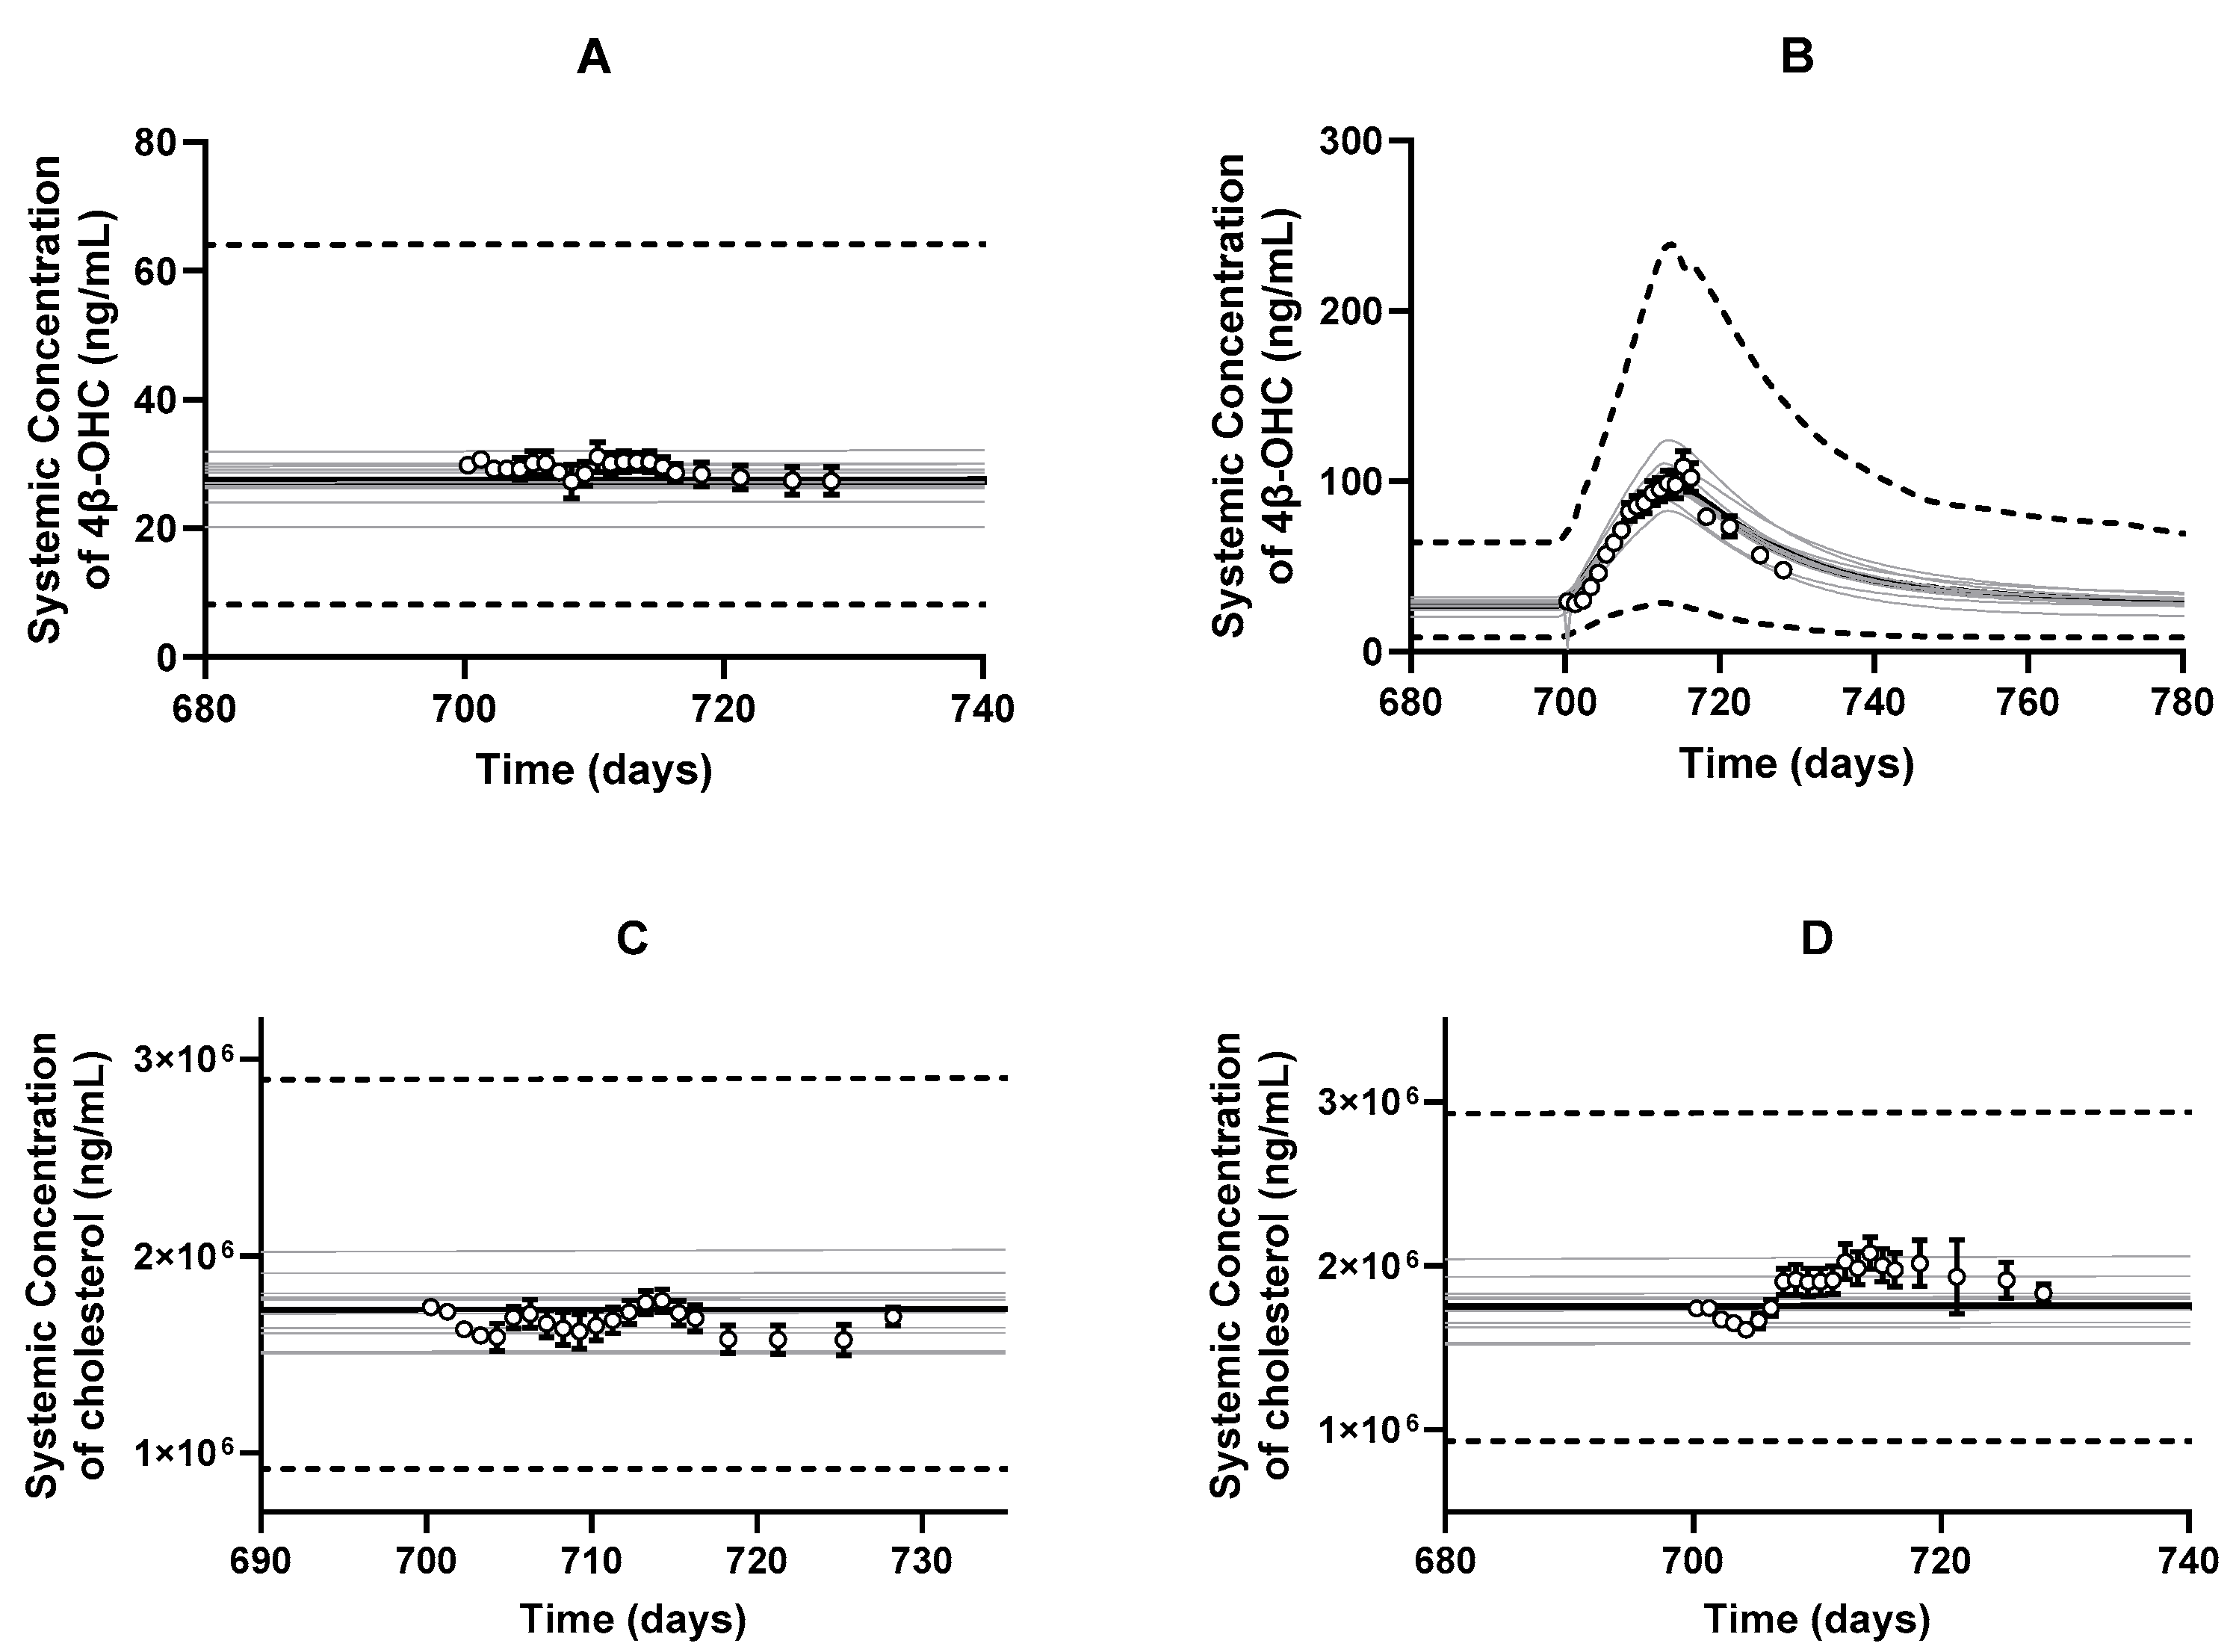
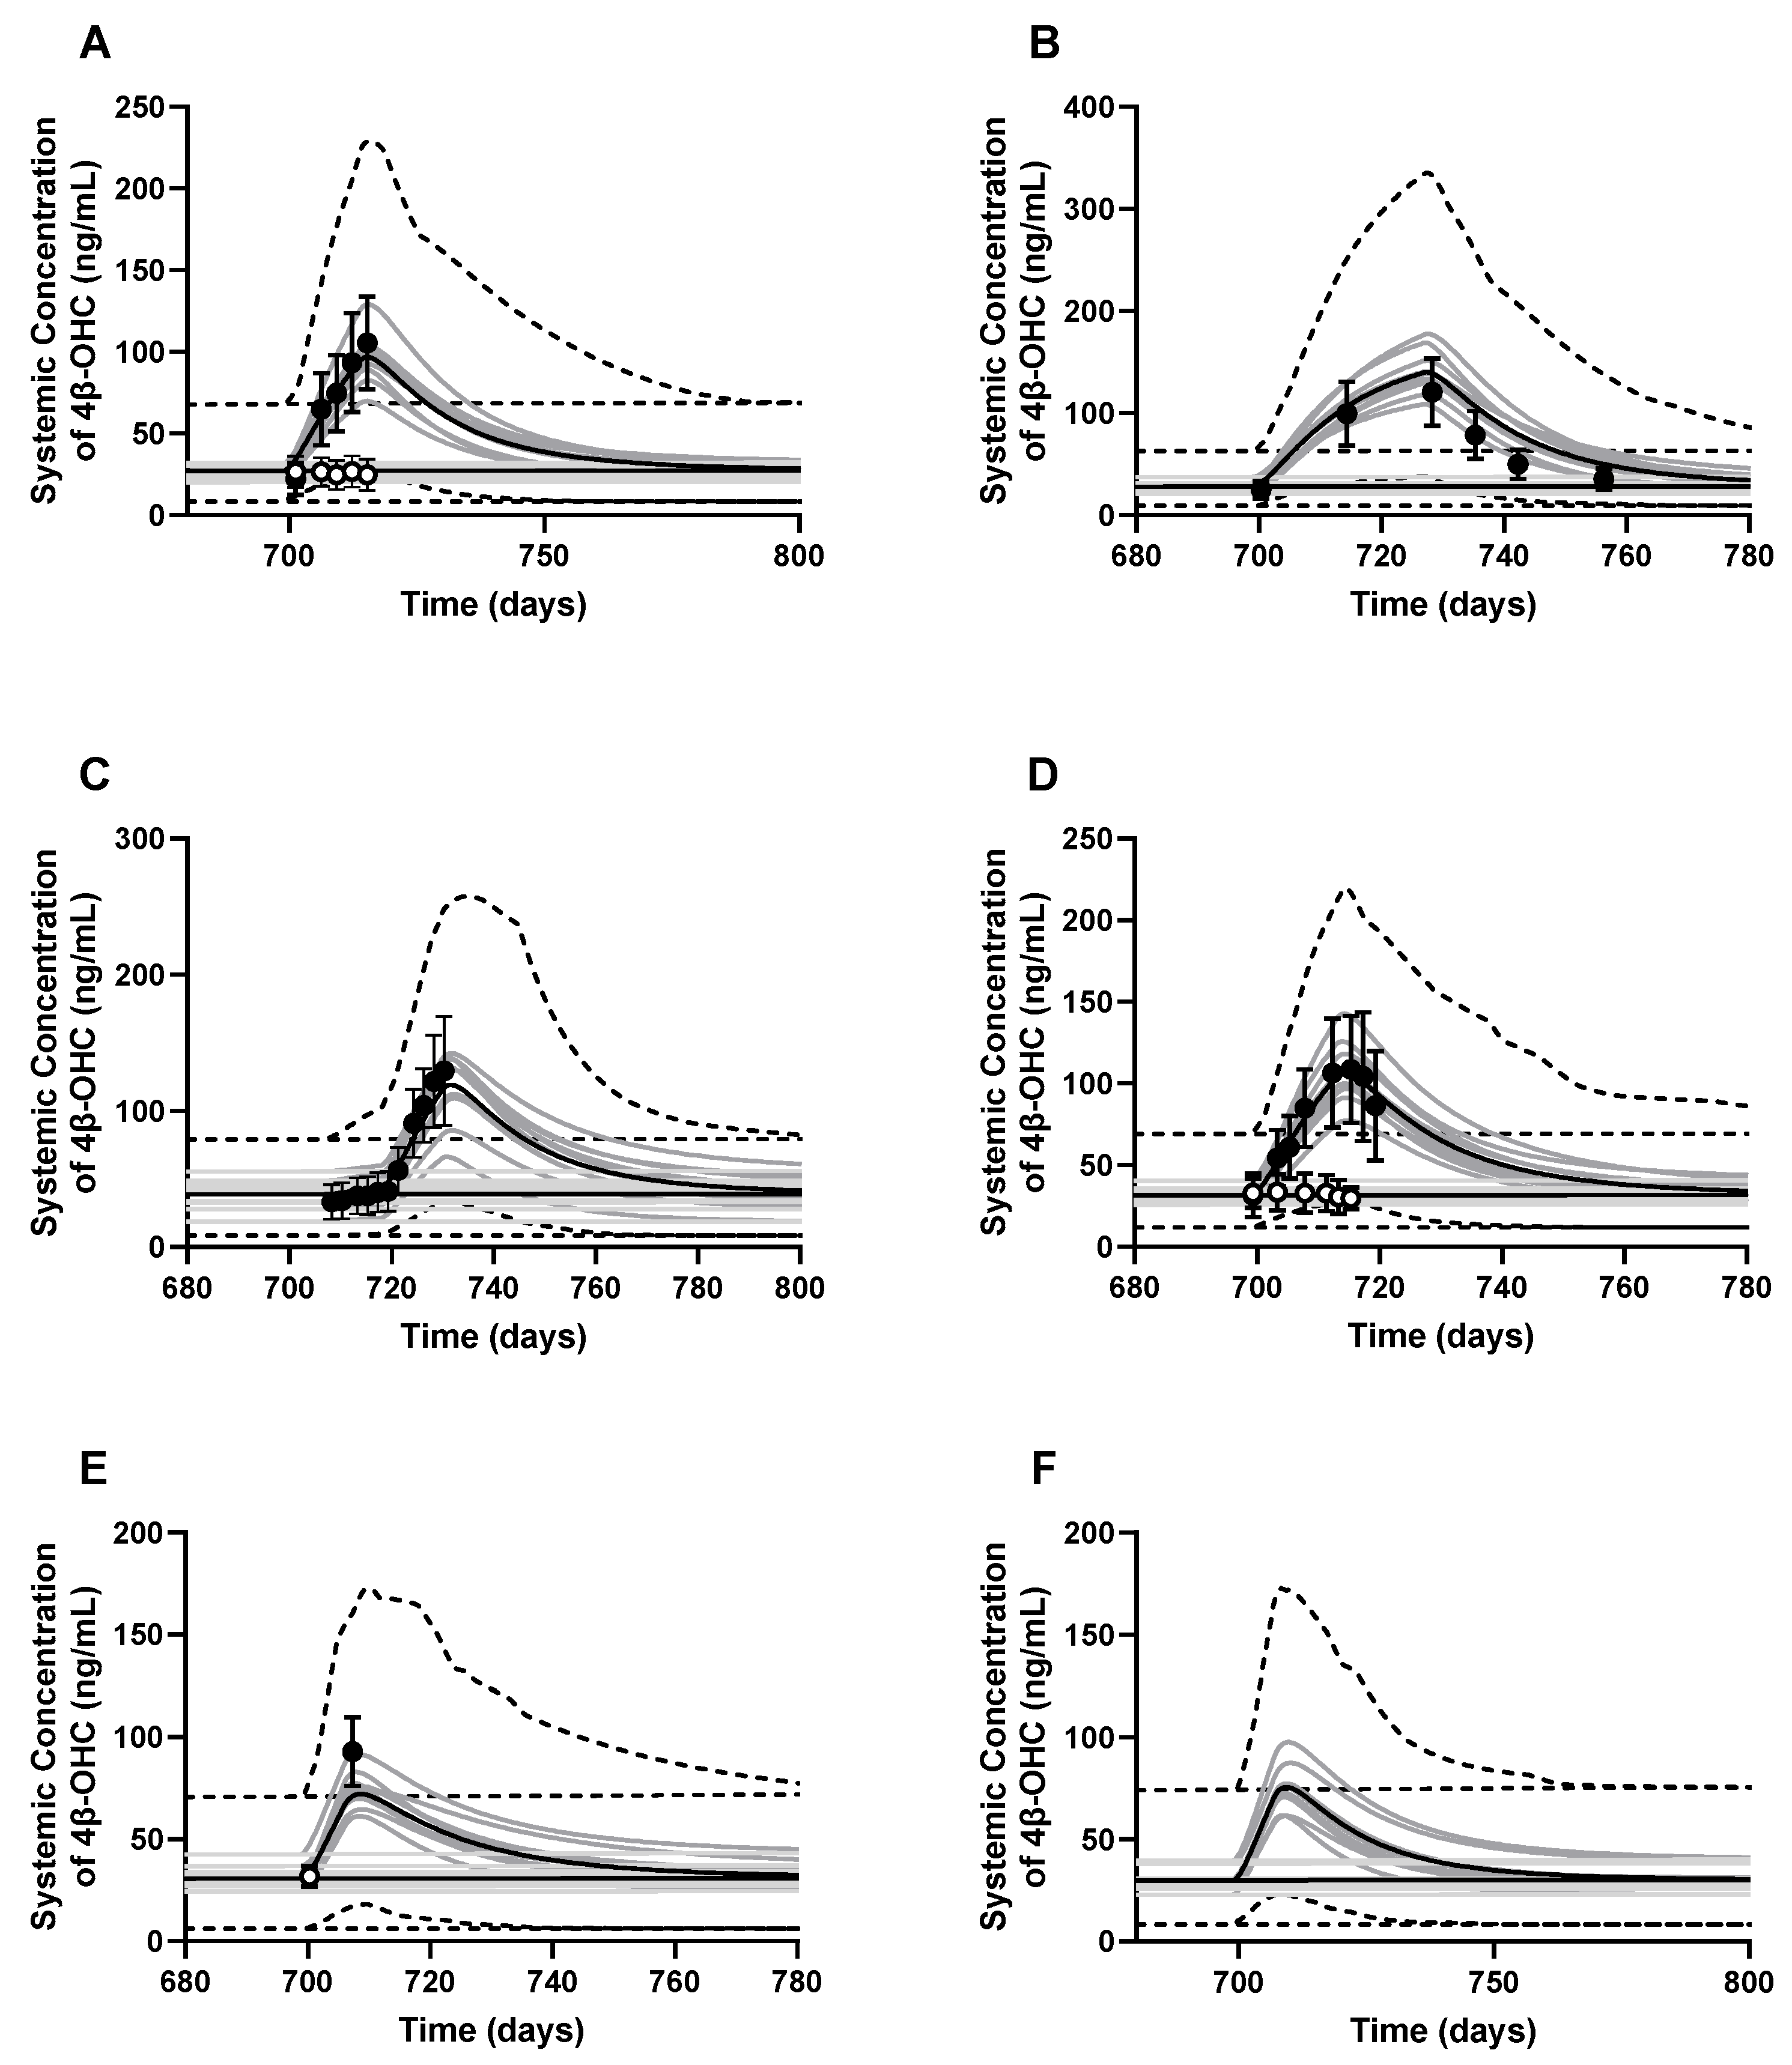
3.2. PBPK Model Development and Performance Verification
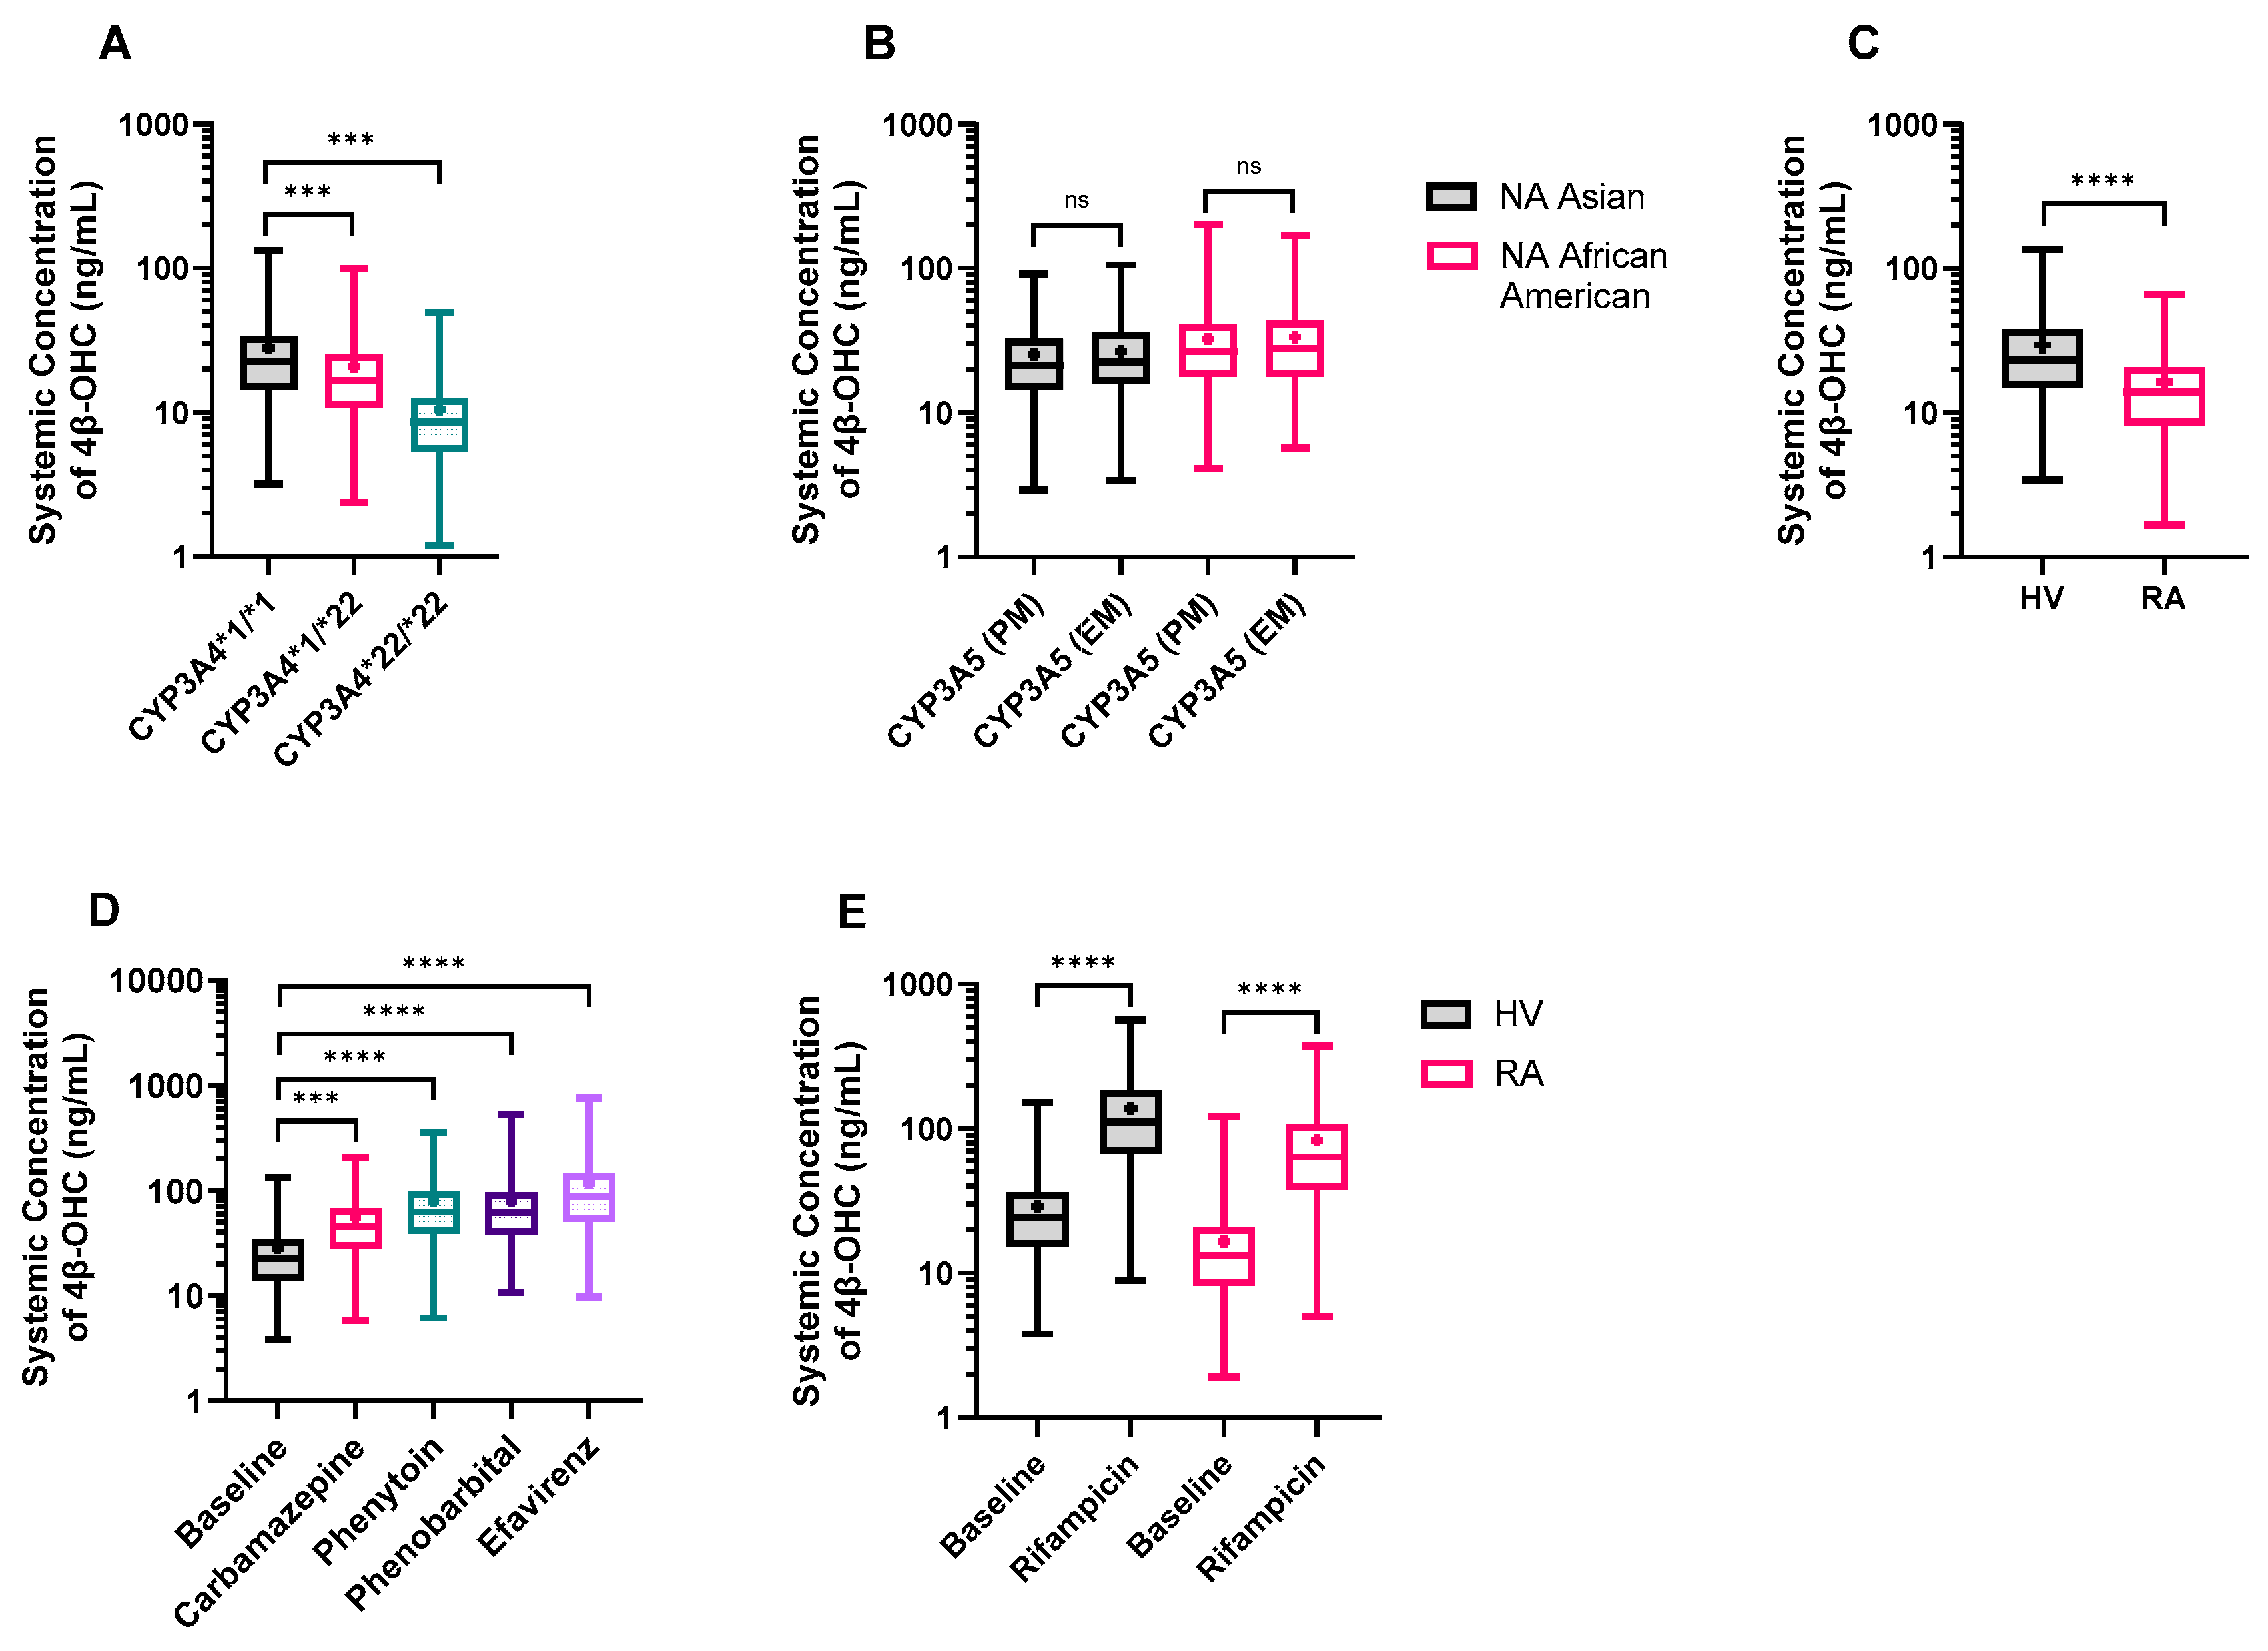
3.3. PBPK Model Applications
3.3.1. CYP3A4*22 Carriers Show Reduced CYP3A4 Protein Content and Baseline 4β-OHC Levels
3.3.2. The Impact of CYP3A5 Polymorphisms
3.3.3. Rheumatoid Arthritis (RA) Patients Exhibit Lower 4β-OHC Levels
3.3.4. DDI Simulation with Other CYP3A4 Inducers
4. Discussion
5. Conclusions
Supplementary Materials
Author Contributions
Funding
Institutional Review Board Statement
Informed Consent Statement
Data Availability Statement
Acknowledgments
Conflicts of Interest
References
- Saravanakumar, A.; Sadighi, A.; Ryu, R.; Akhlaghi, F. Physicochemical Properties, Biotransformation, and Transport Pathways of Established and Newly Approved Medications: A Systematic Review of the Top 200 Most Prescribed Drugs vs. the FDA-Approved Drugs Between 2005 and 2016. Clin. Pharmacokinet. 2019, 58, 1281–1294. [Google Scholar] [CrossRef] [PubMed]
- Bodin, K.; Bretillon, L.; Aden, Y.; Bertilsson, L.; Broome, U.; Einarsson, C.; Diczfalusy, U. Antiepileptic drugs increase plasma levels of 4beta-hydroxycholesterol in humans: Evidence for involvement of cytochrome p450 3A4. J. Biol. Chem. 2001, 276, 38685–38689. [Google Scholar] [CrossRef]
- Gjestad, C.; Hole, K.; Haslemo, T.; Diczfalusy, U.; Molden, E. Effect of Grapefruit Juice Intake on Serum Level of the Endogenous CYP3A4 Metabolite 4beta-Hydroxycholesterol-an Interaction Study in Healthy Volunteers. AAPS J. 2019, 21, 58. [Google Scholar] [CrossRef] [PubMed]
- Bodin, K.; Andersson, U.; Rystedt, E.; Ellis, E.; Norlin, M.; Pikuleva, I.; Eggertsen, G.; Bjorkhem, I.; Diczfalusy, U. Metabolism of 4 beta-hydroxycholesterol in humans. J. Biol. Chem. 2002, 277, 31534–31540. [Google Scholar] [CrossRef]
- Diczfalusy, U.; Miura, J.; Roh, H.K.; Mirghani, R.A.; Sayi, J.; Larsson, H.; Bodin, K.G.; Allqvist, A.; Jande, M.; Kim, J.W.; et al. 4Beta-hydroxycholesterol is a new endogenous CYP3A marker: Relationship to CYP3A5 genotype, quinine 3-hydroxylation and sex in Koreans, Swedes and Tanzanians. Pharmacogenet. Genom. 2008, 18, 201–208. [Google Scholar] [CrossRef] [PubMed]
- Lutjohann, D.; Marinova, M.; Schneider, B.; Oldenburg, J.; von Bergmann, K.; Bieber, T.; Bjorkhem, I.; Diczfalusy, U. 4beta-hydroxycholesterol as a marker of CYP3A4 inhibition in vivo—Effects of itraconazole in man. Int. J. Clin. Pharmacol. Ther. 2009, 47, 709–715. [Google Scholar] [CrossRef] [PubMed]
- Josephson, F.; Bertilsson, L.; Bottiger, Y.; Flamholc, L.; Gisslen, M.; Ormaasen, V.; Sonnerborg, A.; Diczfalusy, U. CYP3A induction and inhibition by different antiretroviral regimens reflected by changes in plasma 4beta-hydroxycholesterol levels. Eur. J. Clin. Pharmacol. 2008, 64, 775–781. [Google Scholar] [CrossRef] [PubMed]
- Kasichayanula, S.; Boulton, D.W.; Luo, W.L.; Rodrigues, A.D.; Yang, Z.; Goodenough, A.; Lee, M.; Jemal, M.; LaCreta, F. Validation of 4beta-hydroxycholesterol and evaluation of other endogenous biomarkers for the assessment of CYP3A activity in healthy subjects. Br. J. Clin. Pharmacol. 2014, 78, 1122–1134. [Google Scholar] [CrossRef] [PubMed]
- Leil, T.A.; Kasichayanula, S.; Boulton, D.W.; LaCreta, F. Evaluation of 4beta-Hydroxycholesterol as a Clinical Biomarker of CYP3A4 Drug Interactions Using a Bayesian Mechanism-Based Pharmacometric Model. CPT Pharmacomet. Syst. Pharmacol. 2014, 3, e120. [Google Scholar] [CrossRef] [PubMed]
- Ngaimisi, E.; Minzi, O.; Mugusi, S.; Sasi, P.; Riedel, K.D.; Suda, A.; Ueda, N.; Bakari, M.; Janabi, M.; Mugusi, F.; et al. Pharmacokinetic and pharmacogenomic modelling of the CYP3A activity marker 4beta-hydroxycholesterol during efavirenz treatment and efavirenz/rifampicin co-treatment. J. Antimicrob. Chemother. 2014, 69, 3311–3319. [Google Scholar] [CrossRef] [PubMed]
- Li, Y.; Connarn, J.N.; Chen, J.; Tong, Z.; Palmisano, M.; Zhou, S. Modeling and simulation of the endogenous CYP3A induction marker 4beta-hydroxycholesterol during enasidenib treatment. Clin. Pharmacol. 2019, 11, 39–50. [Google Scholar] [CrossRef]
- El-Khateeb, E.; Burkhill, S.; Murby, S.; Amirat, H.; Rostami-Hodjegan, A.; Ahmad, A. Physiological-based pharmacokinetic modeling trends in pharmaceutical drug development over the last 20-years; in-depth analysis of applications, organizations, and platforms. Biopharm. Drug Dispos. 2021, 42, 107–117. [Google Scholar] [CrossRef] [PubMed]
- Jamei, M.; Dickinson, G.L.; Rostami-Hodjegan, A. A framework for assessing inter-individual variability in pharmacokinetics using virtual human populations and integrating general knowledge of physical chemistry, biology, anatomy, physiology and genetics: A tale of ‘bottom-up’ vs ‘top-down’ recognition of covariates. Drug Metab. Pharmacokinet. 2009, 24, 53–75. [Google Scholar] [CrossRef] [PubMed]
- Hole, K.; Wollmann, B.M.; Nguyen, C.; Haslemo, T.; Molden, E. Comparison of CYP3A4-Inducing Capacity of Enzyme-Inducing Antiepileptic Drugs Using 4beta-Hydroxycholesterol as Biomarker. Ther. Drug Monit. 2018, 40, 463–468. [Google Scholar] [CrossRef] [PubMed]
- Chen, H.; Li, W.; Hu, J.; Xu, F.; Lu, Y.; Zhu, L.; Shen, H. Association of serum lipids with inflammatory bowel disease: A systematic review and meta-analysis. Front. Med. 2023, 10, 1198988. [Google Scholar] [CrossRef] [PubMed]
- Krycer, J.R.; Brown, A.J. Cholesterol accumulation in prostate cancer: A classic observation from a modern perspective. Biochim. Biophys. Acta 2013, 1835, 219–229. [Google Scholar] [CrossRef] [PubMed]
- Vanhove, T.; de Jonge, H.; de Loor, H.; Annaert, P.; Diczfalusy, U.; Kuypers, D.R. Comparative performance of oral midazolam clearance and plasma 4beta-hydroxycholesterol to explain interindividual variability in tacrolimus clearance. Br. J. Clin. Pharmacol. 2016, 82, 1539–1549. [Google Scholar] [CrossRef] [PubMed]
- Chakrabarti, R.S.; Ingham, S.A.; Kozlitina, J.; Gay, A.; Cohen, J.C.; Radhakrishnan, A.; Hobbs, H.H. Variability of cholesterol accessibility in human red blood cells measured using a bacterial cholesterol-binding toxin. Elife 2017, 6, e23355. [Google Scholar] [CrossRef] [PubMed]
- Turner, S.; Voogt, J.; Davidson, M.; Glass, A.; Killion, S.; Decaris, J.; Mohammed, H.; Minehira, K.; Boban, D.; Murphy, E.; et al. Measurement of reverse cholesterol transport pathways in humans: In vivo rates of free cholesterol efflux, esterification, and excretion. J. Am. Heart Assoc. 2012, 1, e001826. [Google Scholar] [CrossRef] [PubMed]
- Lobell, M.; Sivarajah, V. In silico prediction of aqueous solubility, human plasma protein binding and volume of distribution of compounds from calculated pKa and AlogP98 values. Mol. Divers. 2003, 7, 69–87. [Google Scholar] [CrossRef] [PubMed]
- Olofsson, S.-O.; Bjursell, G.; Boström, K.; Carlsson, P.; Elovson, J.; Protter, A.A.; Reuben, M.A.; Bondjers, G. Apolipoprotein B: Structure, biosynthesis and role in the lipoprotein assembly process. Atherosclerosis 1987, 68, 1–17. [Google Scholar] [CrossRef] [PubMed]
- Mc Auley, M.T.; Wilkinson, D.J.; Jones, J.J.; Kirkwood, T.B. A whole-body mathematical model of cholesterol metabolism and its age-associated dysregulation. BMC Syst. Biol. 2012, 6, 130. [Google Scholar] [CrossRef] [PubMed]
- Turley, S.D.; Spady, D.K.; Dietschy, J.M. Role of liver in the synthesis of cholesterol and the clearance of low density lipoproteins in the cynomolgus monkey. J. Lipid Res. 1995, 36, 67–79. [Google Scholar] [CrossRef] [PubMed]
- Yang, J.; Wang, L.; Jia, R. Role of de novo cholesterol synthesis enzymes in cancer. J. Cancer 2020, 11, 1761–1767. [Google Scholar] [CrossRef] [PubMed]
- Ikonen, E. Mechanisms for cellular cholesterol transport: Defects and human disease. Physiol. Rev. 2006, 86, 1237–1261. [Google Scholar] [CrossRef] [PubMed]
- Wisniewski, J.R.; Wegler, C.; Artursson, P. Subcellular fractionation of human liver reveals limits in global proteomic quantification from isolated fractions. Anal. Biochem. 2016, 509, 82–88. [Google Scholar] [CrossRef] [PubMed]
- Grundy, S.M.; Ahrens, E.H., Jr. Measurements of cholesterol turnover, synthesis, and absorption in man, carried out by isotope kinetic and sterol balance methods. J. Lipid Res. 1969, 10, 91–107. [Google Scholar] [CrossRef] [PubMed]
- Goodman, D.S.; Noble, R.P.; Dell, R.B. The effects of colestipol resin and of colestipol plus clofibrate on the turnover of plasma cholesterol in man. J. Clin. Investig. 1973, 52, 2646–2655. [Google Scholar] [CrossRef] [PubMed]
- Kim, Y.; Hatley, O.; Rhee, S.J.; Yi, S.; Lee, H.A.; Yoon, S.; Chung, J.Y.; Yu, K.S.; Lee, H. Development of a Korean-specific virtual population for physiologically based pharmacokinetic modelling and simulation. Biopharm. Drug Dispos. 2019, 40, 135–150. [Google Scholar] [CrossRef]
- Abduljalil, K.; Cain, T.; Humphries, H.; Rostami-Hodjegan, A. Deciding on success criteria for predictability of pharmacokinetic parameters from in vitro studies: An analysis based on in vivo observations. Drug Metab. Dispos. 2014, 42, 1478–1484. [Google Scholar] [CrossRef]
- Shebley, M.; Sandhu, P.; Emami Riedmaier, A.; Jamei, M.; Narayanan, R.; Patel, A.; Peters, S.A.; Reddy, V.P.; Zheng, M.; de Zwart, L.; et al. Physiologically Based Pharmacokinetic Model Qualification and Reporting Procedures for Regulatory Submissions: A Consortium Perspective. Clin. Pharmacol. Ther. 2018, 104, 88–110. [Google Scholar] [CrossRef] [PubMed]
- Tang, H.; Hussain, A.; Leal, M.; Mayersohn, M.; Fluhler, E. Interspecies prediction of human drug clearance based on scaling data from one or two animal species. Drug Metab. Dispos. 2007, 35, 1886–1893. [Google Scholar] [CrossRef] [PubMed]
- Guest, E.J.; Aarons, L.; Houston, J.B.; Rostami-Hodjegan, A.; Galetin, A. Critique of the two-fold measure of prediction success for ratios: Application for the assessment of drug-drug interactions. Drug Metab. Dispos. 2011, 39, 170–173. [Google Scholar] [CrossRef] [PubMed]
- Wang, D.; Guo, Y.; Wrighton, S.A.; Cooke, G.E.; Sadee, W. Intronic polymorphism in CYP3A4 affects hepatic expression and response to statin drugs. Pharmacogenomics J. 2011, 11, 274–286. [Google Scholar] [CrossRef] [PubMed]
- Mohamed, M.E.; Schladt, D.P.; Guan, W.; Wu, B.; van Setten, J.; Keating, B.J.; Ikle, D.; Remmel, R.P.; Dorr, C.R.; Mannon, R.B.; et al. Tacrolimus troughs and genetic determinants of metabolism in kidney transplant recipients: A comparison of four ancestry groups. Am. J. Transplant. 2019, 19, 2795–2804. [Google Scholar] [CrossRef] [PubMed]
- Mayo, P.R.; Skeith, K.; Russell, A.S.; Jamali, F. Decreased dromotropic response to verapamil despite pronounced increased drug concentration in rheumatoid arthritis. Br. J. Clin. Pharmacol. 2000, 50, 605–613. [Google Scholar] [CrossRef]
- Abdel-Razzak, Z.; Loyer, P.; Fautrel, A.; Gautier, J.C.; Corcos, L.; Turlin, B.; Beaune, P.; Guillouzo, A. Cytokines down-regulate expression of major cytochrome P-450 enzymes in adult human hepatocytes in primary culture. Mol. Pharmacol. 1993, 44, 707–715. [Google Scholar]
- Molanaei, H.; Stenvinkel, P.; Qureshi, A.R.; Carrero, J.J.; Heimburger, O.; Lindholm, B.; Diczfalusy, U.; Odar-Cederlof, I.; Bertilsson, L. Metabolism of alprazolam (a marker of CYP3A4) in hemodialysis patients with persistent inflammation. Eur. J. Clin. Pharmacol. 2012, 68, 571–577. [Google Scholar] [CrossRef] [PubMed]
- Wollmann, B.M.; Syversen, S.W.; Lie, E.; Gjestad, C.; Mehus, L.L.; Olsen, I.C.; Molden, E. 4beta-Hydroxycholesterol Level in Patients with Rheumatoid Arthritis Before vs. After Initiation of bDMARDs and Correlation with Inflammatory State. Clin. Transl. Sci. 2017, 10, 42–49. [Google Scholar] [CrossRef]
- Yang, Z.; Rodrigues, A.D. Does the long plasma half-life of 4beta-hydroxycholesterol impact its utility as a cytochrome P450 3A (CYP3A) metric? J. Clin. Pharmacol. 2010, 50, 1330–1338. [Google Scholar] [CrossRef] [PubMed]
- Dutreix, C.; Lorenzo, S.; Wang, Y. Comparison of two endogenous biomarkers of CYP3A4 activity in a drug-drug interaction study between midostaurin and rifampicin. Eur. J. Clin. Pharmacol. 2014, 70, 915–920. [Google Scholar] [CrossRef] [PubMed]
- Stoch, S.A.; Ballard, J.; Gibson, C.; Kesisoglou, F.; Witter, R.; Kassahun, K.; Zajic, S.; Mehta, A.; Brandquist, C.; Dempsey, C.; et al. Coadministration of Rifampin Significantly Reduces Odanacatib Concentrations in Healthy Subjects. J. Clin. Pharmacol. 2017, 57, 110–117. [Google Scholar] [CrossRef] [PubMed]
- Wiesinger, H.; Klein, S.; Rottmann, A.; Nowotny, B.; Riecke, K.; Gashaw, I.; Brudny-Kloppel, M.; Fricke, R.; Hochel, J.; Friedrich, C. The Effects of Weak and Strong CYP3A Induction by Rifampicin on the Pharmacokinetics of Five Progestins and Ethinylestradiol Compared to Midazolam. Clin. Pharmacol. Ther. 2020, 108, 798–807. [Google Scholar] [CrossRef] [PubMed]
- Einolf, H.J.; Zhou, J.; Won, C.; Wang, L.; Rebello, S. A Physiologically-Based Pharmacokinetic Modeling Approach To Predict Drug-Drug Interactions of Sonidegib (LDE225) with Perpetrators of CYP3A in Cancer Patients. Drug Metab. Dispos. 2017, 45, 361–374. [Google Scholar] [CrossRef]
- Marschall, H.U.; Wagner, M.; Zollner, G.; Fickert, P.; Diczfalusy, U.; Gumhold, J.; Silbert, D.; Fuchsbichler, A.; Benthin, L.; Grundstrom, R.; et al. Complementary stimulation of hepatobiliary transport and detoxification systems by rifampicin and ursodeoxycholic acid in humans. Gastroenterology 2005, 129, 476–485. [Google Scholar] [CrossRef] [PubMed]
- OLUMIANT (Baricitinib). Clinical Pharmacology and Biopharmaceutics Reviews(s), NDA#207924. 2017. Available online: https://www.accessdata.fda.gov/drugsatfda_docs/nda/2018/207924Orig1s000ClinPharmR.pdf (accessed on 25 May 2024).
- Okubo, M.; Murayama, N.; Shimizu, M.; Shimada, T.; Guengerich, F.P.; Yamazaki, H. CYP3A4 intron 6 C>T polymorphism (CYP3A4*22) is associated with reduced CYP3A4 protein level and function in human liver microsomes. J. Toxicol. Sci. 2013, 38, 349–354. [Google Scholar] [CrossRef] [PubMed]
- De Jonge, H.; Elens, L.; de Loor, H.; van Schaik, R.H.; Kuypers, D.R. The CYP3A4*22 C>T single nucleotide polymorphism is associated with reduced midazolam and tacrolimus clearance in stable renal allograft recipients. Pharmacogenomics J. 2015, 15, 144–152. [Google Scholar] [CrossRef] [PubMed]
- Scheibner, A.; Remmel, R.; Schladt, D.; Oetting, W.S.; Guan, W.; Wu, B.; Dorr, C.; Israni, A.; Jacobson, P.A. Tacrolimus Elimination in Four Patients with a CYP3A5*3/*3 CYP3A4*22/*22 Genotype Combination. Pharmacotherapy 2018, 38, e46–e52. [Google Scholar] [CrossRef] [PubMed]
- Elens, L.; Nieuweboer, A.; Clarke, S.J.; Charles, K.A.; de Graan, A.J.; Haufroid, V.; Mathijssen, R.H.; van Schaik, R.H. CYP3A4 intron 6 C>T SNP (CYP3A4*22) encodes lower CYP3A4 activity in cancer patients, as measured with probes midazolam and erythromycin. Pharmacogenomics 2013, 14, 137–149. [Google Scholar] [CrossRef]
- Gebeyehu, E.; Engidawork, E.; Bijnsdorp, A.; Aminy, A.; Diczfalusy, U.; Aklillu, E. Sex and CYP3A5 genotype influence total CYP3A activity: High CYP3A activity and a unique distribution of CYP3A5 variant alleles in Ethiopians. Pharmacogenomics J. 2011, 11, 130–137. [Google Scholar] [CrossRef] [PubMed]
- Lee, S.; Kim, A.H.; Yoon, S.; Lee, J.; Lee, Y.; Ji, S.C.; Yoon, S.H.; Lee, S.; Yu, K.S.; Jang, I.J.; et al. The utility of CYP3A activity endogenous markers for evaluating drug-drug interaction between sildenafil and CYP3A inhibitors in healthy subjects. Drug Metab. Pharmacokinet. 2021, 36, 100368. [Google Scholar] [CrossRef] [PubMed]
- Machavaram, K.K.; Almond, L.M.; Rostami-Hodjegan, A.; Gardner, I.; Jamei, M.; Tay, S.; Wong, S.; Joshi, A.; Kenny, J.R. A physiologically based pharmacokinetic modeling approach to predict disease-drug interactions: Suppression of CYP3A by IL-6. Clin. Pharmacol. Ther. 2013, 94, 260–268. [Google Scholar] [CrossRef] [PubMed]
- Lai, Y.; Mandlekar, S.; Shen, H.; Holenarsipur, V.K.; Langish, R.; Rajanna, P.; Murugesan, S.; Gaud, N.; Selvam, S.; Date, O.; et al. Coproporphyrins in Plasma and Urine Can Be Appropriate Clinical Biomarkers to Recapitulate Drug-Drug Interactions Mediated by Organic Anion Transporting Polypeptide Inhibition. J. Pharmacol. Exp. Ther. 2016, 358, 397–404. [Google Scholar] [CrossRef] [PubMed]
- Yoshikado, T.; Toshimoto, K.; Maeda, K.; Kusuhara, H.; Kimoto, E.; Rodrigues, A.D.; Chiba, K.; Sugiyama, Y. PBPK Modeling of Coproporphyrin I as an Endogenous Biomarker for Drug Interactions Involving Inhibition of Hepatic OATP1B1 and OATP1B3. CPT Pharmacomet. Syst. Pharmacol. 2018, 7, 739–747. [Google Scholar] [CrossRef]
- Fan, B.; Dai, D.; DiNardo, C.D.; Stein, E.; de Botton, S.; Attar, E.C.; Liu, H.; Liu, G.; Lemieux, I.; Agresta, S.V.; et al. Clinical pharmacokinetics and pharmacodynamics of ivosidenib in patients with advanced hematologic malignancies with an IDH1 mutation. Cancer Chemother. Pharmacol. 2020, 85, 959–968. [Google Scholar] [CrossRef] [PubMed]
- Dong, J.Q.; Gosset, J.R.; Fahmi, O.A.; Lin, Z.; Chabot, J.R.; Terra, S.G.; Le, V.; Chidsey, K.; Nouri, P.; Kim, A.; et al. Examination of the Human Cytochrome P4503A4 Induction Potential of PF-06282999, an Irreversible Myeloperoxidase Inactivator: Integration of Preclinical, In Silico, and Biomarker Methodologies in the Prediction of the Clinical Outcome. Drug Metab. Dispos. 2017, 45, 501–511. [Google Scholar] [CrossRef] [PubMed]
- Lin, J.; Gaudreault, F.; Johnson, N.; Lin, Z.; Nouri, P.; Goosen, T.C.; Sawant-Basak, A. Investigation of CYP3A induction by PF-05251749 in early clinical development: Comparison of linear slope physiologically based pharmacokinetic prediction and biomarker response. Clin. Transl. Sci. 2022, 15, 2184–2194. [Google Scholar] [CrossRef]
- Passarelli, M.N.; McDonald, J.G.; Thompson, B.M.; Arega, E.A.; Palys, T.J.; Rees, J.R.; Barry, E.L.; Baron, J.A. Association of demographic and health characteristics with circulating oxysterol concentrations. J. Clin. Lipidol. 2022, 16, 345–355. [Google Scholar] [CrossRef]
- Li, T.; Chiang, J.Y. Rifampicin induction of CYP3A4 requires pregnane X receptor cross talk with hepatocyte nuclear factor 4alpha and coactivators, and suppression of small heterodimer partner gene expression. Drug Metab. Dispos. 2006, 34, 756–764. [Google Scholar] [CrossRef] [PubMed]
- Li, T.; Chiang, J.Y. Mechanism of rifampicin and pregnane X receptor inhibition of human cholesterol 7 alpha-hydroxylase gene transcription. Am. J. Physiol. Gastrointest. Liver Physiol. 2005, 288, G74–G84. [Google Scholar] [CrossRef]
- Almond, L.M.; Mukadam, S.; Gardner, I.; Okialda, K.; Wong, S.; Hatley, O.; Tay, S.; Rowland-Yeo, K.; Jamei, M.; Rostami-Hodjegan, A.; et al. Prediction of Drug-Drug Interactions Arising from CYP3A induction Using a Physiologically Based Dynamic Model. Drug Metab. Dispos. 2016, 44, 821–832. [Google Scholar] [CrossRef]
- Almond, L.M.; Hoggard, P.G.; Edirisinghe, D.; Khoo, S.H.; Back, D.J. Intracellular and plasma pharmacokinetics of efavirenz in HIV-infected individuals. J. Antimicrob. Chemother. 2005, 56, 738–744. [Google Scholar] [CrossRef] [PubMed]
- Oscarson, M.; Zanger, U.M.; Rifki, O.F.; Klein, K.; Eichelbaum, M.; Meyer, U.A. Transcriptional profiling of genes induced in the livers of patients treated with carbamazepine. Clin. Pharmacol. Ther. 2006, 80, 440–456. [Google Scholar] [CrossRef] [PubMed]
- Li, T.; Francl, J.M.; Boehme, S.; Chiang, J.Y. Regulation of cholesterol and bile acid homeostasis by the cholesterol 7alpha-hydroxylase/steroid response element-binding protein 2/microRNA-33a axis in mice. Hepatology 2013, 58, 1111–1121. [Google Scholar] [CrossRef] [PubMed]
- Moldavski, O.; Zushin, P.H.; Berdan, C.A.; Van Eijkeren, R.J.; Jiang, X.; Qian, M.; Ory, D.S.; Covey, D.F.; Nomura, D.K.; Stahl, A.; et al. 4beta-Hydroxycholesterol is a prolipogenic factor that promotes SREBP1c expression and activity through the liver X receptor. J. Lipid Res. 2021, 62, 100051. [Google Scholar] [CrossRef]
- Saiz-Rodriguez, M.; Almenara, S.; Navares-Gomez, M.; Ochoa, D.; Roman, M.; Zubiaur, P.; Koller, D.; Santos, M.; Mejia, G.; Borobia, A.M.; et al. Effect of the Most Relevant CYP3A4 and CYP3A5 Polymorphisms on the Pharmacokinetic Parameters of 10 CYP3A Substrates. Biomedicines 2020, 8, 94. [Google Scholar] [CrossRef] [PubMed]
- Pena, M.A.; Muriel, J.; Saiz-Rodriguez, M.; Borobia, A.M.; Abad-Santos, F.; Frias, J.; Peiro, A.M. Effect of Cytochrome P450 and ABCB1 Polymorphisms on Imatinib Pharmacokinetics After Single-Dose Administration to Healthy Subjects. Clin. Drug Investig. 2020, 40, 617–628. [Google Scholar] [CrossRef]
- Hole, K.; Gjestad, C.; Heitmann, K.M.; Haslemo, T.; Molden, E.; Bremer, S. Impact of genetic and nongenetic factors on interindividual variability in 4beta-hydroxycholesterol concentration. Eur. J. Clin. Pharmacol. 2017, 73, 317–324. [Google Scholar] [CrossRef] [PubMed]
- Gravel, S.; Chiasson, J.L.; Gaudette, F.; Turgeon, J.; Michaud, V. Use of 4beta-Hydroxycholesterol Plasma Concentrations as an Endogenous Biomarker of CYP3A Activity: Clinical Validation in Individuals with Type 2 Diabetes. Clin. Pharmacol. Ther. 2019, 106, 831–840. [Google Scholar] [CrossRef] [PubMed]
- De Jonge, H.; de Loor, H.; Verbeke, K.; Vanrenterghem, Y.; Kuypers, D.R. Impact of CYP3A5 genotype on tacrolimus versus midazolam clearance in renal transplant recipients: New insights in CYP3A5-mediated drug metabolism. Pharmacogenomics 2013, 14, 1467–1480. [Google Scholar] [CrossRef] [PubMed]
- Yan, J.; Yang, S.; Han, L.; Ba, X.; Shen, P.; Lin, W.; Li, T.; Zhang, R.; Huang, Y.; Huang, Y.; et al. Dyslipidemia in rheumatoid arthritis: The possible mechanisms. Front. Immunol. 2023, 14, 1254753. [Google Scholar] [CrossRef] [PubMed]
- Koh, J.H.; Lee, B.W.; Kim, W.U. Changes in the cholesterol profile of patients with rheumatoid arthritis treated with biologics or Janus kinase inhibitors. J. Rheum. Dis. 2023, 30, 234–242. [Google Scholar] [CrossRef] [PubMed]
- Chen, K.F.; Jones, H.M. PBPK perspective on alternative CYP3A4 inducers for rifampin. CPT Pharmacomet. Syst. Pharmacol. 2022, 11, 1543–1546. [Google Scholar] [CrossRef] [PubMed]

| Cholesterol | 4β-OHC | |||
|---|---|---|---|---|
| Parameter | Value | Source/Reference | Value | Source/Reference |
| Physicochemical Parameters | ||||
| Molecular weight (g/mol) | 386.65 | HMDB ID (HMDB0000067) | 402.35 | HMDB (HMDB0013643) |
| log P | 7.02 | HMDB ID (HMDB0000067) | 6.16 | HMDB ID (HMDB0013643) |
| Compound type | Neutral | Neutral | ||
| Blood Binding Parameters | ||||
| B/P | 0.55 | [18] | 0.55 | [18] |
| fup | 0.0021 Predicted (QSAR) | [20] | 0.0051 Predicted (QSAR) | [20] |
| Reference binding component | Apolipoprotein B | [21] | Apolipoprotein B | [21] |
| Protein reference concentration (µM) | 620 | Optimized. Please see the methods Section 2.2 for details. | 620 | Optimized. Please see the methods Section 2.2 for details. |
| Distribution | Minimal PBPK Model | |||
| Vss (L/kg) | 0.10 | User input | 0.05 | User input |
| Liver Kp | 3.07 | Calculated from [23]. See Table S1. | 3.87 | Calculated from [23]. See Table S1. |
| Elimination | Enzyme Kinetics | |||
| CYP3A4 CLint (µL/min/pmol) | 4.17 × 10⁻⁷ | Optimized. Please see the methods Section 2.2.2 for details. | N.A. | Optimized. Please see the methods Section 2.2.2 for details. |
| CYP3A5 CLint (µL/min/pmol) | 2.55 × 10⁻⁸ | N.A. | ||
| CYP3A7 CLint (µL/min/pmol) | 1.27 × 10⁻⁸ | N.A. | ||
| CYP27A1 CLint (µL/min/pmol) | 3.13 × 10⁻³ | 0.02 | ||
| Additional HLM CLint (μL/min/mg protein) | 0.350 | 0.84 | ||
Disclaimer/Publisher’s Note: The statements, opinions and data contained in all publications are solely those of the individual author(s) and contributor(s) and not of MDPI and/or the editor(s). MDPI and/or the editor(s) disclaim responsibility for any injury to people or property resulting from any ideas, methods, instructions or products referred to in the content. |
© 2024 by the authors. Licensee MDPI, Basel, Switzerland. This article is an open access article distributed under the terms and conditions of the Creative Commons Attribution (CC BY) license (https://creativecommons.org/licenses/by/4.0/).
Share and Cite
Karkhanis, A.V.; Harwood, M.D.; Stader, F.; Bois, F.Y.; Neuhoff, S. Applications of the Cholesterol Metabolite, 4β-Hydroxycholesterol, as a Sensitive Endogenous Biomarker for Hepatic CYP3A Activity Evaluated within a PBPK Framework. Pharmaceutics 2024, 16, 1284. https://doi.org/10.3390/pharmaceutics16101284
Karkhanis AV, Harwood MD, Stader F, Bois FY, Neuhoff S. Applications of the Cholesterol Metabolite, 4β-Hydroxycholesterol, as a Sensitive Endogenous Biomarker for Hepatic CYP3A Activity Evaluated within a PBPK Framework. Pharmaceutics. 2024; 16(10):1284. https://doi.org/10.3390/pharmaceutics16101284
Chicago/Turabian StyleKarkhanis, Aneesh V., Matthew D. Harwood, Felix Stader, Frederic Y. Bois, and Sibylle Neuhoff. 2024. "Applications of the Cholesterol Metabolite, 4β-Hydroxycholesterol, as a Sensitive Endogenous Biomarker for Hepatic CYP3A Activity Evaluated within a PBPK Framework" Pharmaceutics 16, no. 10: 1284. https://doi.org/10.3390/pharmaceutics16101284
APA StyleKarkhanis, A. V., Harwood, M. D., Stader, F., Bois, F. Y., & Neuhoff, S. (2024). Applications of the Cholesterol Metabolite, 4β-Hydroxycholesterol, as a Sensitive Endogenous Biomarker for Hepatic CYP3A Activity Evaluated within a PBPK Framework. Pharmaceutics, 16(10), 1284. https://doi.org/10.3390/pharmaceutics16101284