Abstract
In this work, phytochemical analysis on different extracts of Roccella tinctoria DC. was reported using different techniques with respect to the past. Twenty volatile and three non-volatile compounds were identified, some of which were found in this species for the first time. The methanolic extracts and their non-volatile components were then evaluated for their antitumor effects in cancerous A549 and Mz-ChA-1 cells and for their tolerability in non-cancerous BEAS-2B and H69 cells, showing IC50 values from 94.6 µg/mL to 416.4 µg/mL, in general. The same extracts and compounds were also tested for their antifungal effects in Candida albicans, with only compound 2 being active, with an MIC50 value of 87 µg/mL. In addition, they were tested for their anti-Candida adhesion activity, anti-Candida biofilm formation, and anti-Candida mature biofilm inhibition, with efficacy percentages generally above 50% but not for all of them. Lastly, the DF3 extract and compounds 1–2 were tested in vivo according to the Galleria mellonella survival assay, showing positive mortality rates above 50% at different concentrations. All these biological assays were conducted on this species for the first time. Comparisons with other lichens and compounds were also presented and discussed.
1. Introduction
Lichens are a symbiotic association of a fungus defined as a mycobiont and usually represented by an ascomycete, and an alga or cyanobacterial species defined as photobiont [1], that form composite thalli, which are clearly visible, even to the naked eye [2]. They appear in a wide variety of habitats and can even survive under severe conditions (i.e., low temperatures and prolonged darkness), producing high amounts of characteristic phenolics in response to the environment [3].
Roccella DC. (Roccellaceae) is a genus of fruticose lichens that comprises more than 20 species, 7 of which are widespread in Europe, especially along the Mediterranean coasts [4]. Under the phytochemical point of view, about fifty secondary metabolites belonging to several classes of compounds have been reported for the Roccella genus, including depsides (e.g., erythrin, lecanoric acid, and lepraric acid), monoaromatic phenols (e.g., β-orcinol, ethyl orsellinate, and montagnetol), and aliphatic acids (e.g., roccellic acid) [5], which have already been reported to have strong effects against different fungal strains [6,7,8].
Roccella tinctoria DC. represents the most common species of this genus in Italy [9], where it is characterized by a rigid fruticose brownish thallus, 3–20 cm long smooth branches, a bark of hyphae anticlinally disposed, and, generally, the total absence of apothecia [10]. In Europe, Roccella tinctoria DC. is mainly known for its mass use as a source of purple dye [11]. Just a couple of works have studied its phytochemical constituents and only by means of MS, HPLC-MS, Raman spectroscopy, FT-IR, and UV, starting from differently adjusted aqueous solutions, identifying several orcein derivatives as main compounds together with the typical compounds already found in the genus [12,13,14,15]. Indeed, no phytochemical analysis has ever been conducted on different non-aqueous extracts of R. tinctoria collected in Italy using methods like CC and SPME.
Lichen extracts and their derived phenolic compounds have already shown promising antifungal and antiproliferative properties [16,17,18,19,20,21,22].
Candida albicans is an opportunistic fungal pathogen and a commensal yeast that colonizes the oral, gastrointestinal, and vaginal tracts [23]. Several factors, such as stress and an impaired immune system, can cause its overgrowth and mucosal and/or systemic infections [24]. C. albicans can make a transition from commensal to pathogen due to its virulence factors, including the ability to form biofilms [25], which represents a significant clinical problem. In fact, fungal biofilms are less susceptible to many drugs [26]. Therefore, there is a need to develop new agents active against planktonic cells and biofilms of C. albicans. The role of natural products in drug discovery is widely recognized in several therapeutic areas, mainly in infectious disease [27]. Several plant extracts and their metabolites have been investigated as anti-C. albicans agents [28,29,30]. Conversely, only a couple of studies have focused on lichen extracts [16,31] and their metabolites [32,33] but none specifically on R. tinctoria and its metabolites.
Several studies also investigated the in vitro antitumor activity of lichen extracts and their metabolites [22]. For instance, the methanolic extracts from Xanthoria parietina (L.) Th. Fr. exhibited antiproliferative properties in MDA-MB231 and MCF-7 breast cancer cells and murine myeloma cells [34], while those from Cladonia foliacea (Huds.) Willd. and Hypogymnia physodes (L.) Nyl. were in HCT-116 colon cancer cells [35]. Moreover, the methanolic extracts of Usnea intermedia (A. Massal.) Jatta as well as the acetone extracts from Parmotrema gardneri (Du Rietz) Hale, C. foliacea and Parmelia arseneana Gyelnik produced cytotoxic effects in lung cancer A549 cells [36,37,38]. Promising antiproliferative effects have also been observed for the methanolic extract from Roccella montagnei Bél., in human colon (DLD-1, SW-620), breast (MCF-7), head and neck (FaDu) cancer cell lines, ascribed to the presence of roccellic acid [39].
Based on this evidence, the present study aimed at characterizing the anti-Candida activity, the cytotoxicity in human cancer cells, and tolerability in non-cancerous ones of R. tinctoria extracts and their main phenolic compounds. Notably, there is a serious lack of previous investigations on these aspects.
2. Materials and Methods
2.1. Chemicals and Instruments
All solvents as well as deuterated solvents of isotopic purity were purchased from Sigma Aldrich (Milan, Italy). A Bruker AC 400 Ultrashield 10 spectrophotometer (400 MHz) (Bruker, Billerica, MA, USA) was used to record 1H NMR spectra at 27 °C; chemical shifts are expressed in δ (ppm), while coupling constants are in Hz. Melting points were measured on a Bobby Stuart Scientific SMP1 melting point apparatus (Bibby Scientific, Stone, UK). Infrared spectra were recorded on a PerkinElmer Spectrum-One spectrophotometer (Perkin Elmer, Shelton, CT, USA). Column chromatography on silica gel (Merck, Darmstadt, Germany; 70–230 mesh) was employed to separate the components of the extracts. Thin-layer chromatography (TLC) was performed by using aluminum-baked silica gel plates (Fluka, Honeywell, Charlotte, NC, USA; DC-Alufolien Kieselgel 60 F254). Developed plates were visualized by UV light (254 and 365 nm). Direct infusion ESI-MS/MS experiments were carried out by a Quattro Micro Tandem MS/MS with a Waters ESI source (Micromass, Manchester, UK), by direct infusion of the samples into the ESI source through an external syringe, flow rate 5 μL/min. Mass spectral data for each compound were acquired for 2 min in the appropriate mass range in both positive (ES+) and negative (ES-) ionization: cone voltage 20 V, ionization source temperature 100 °C, desolvation gas temperature of 150 °C, cone gas flow of 30 L/h, desolvation gas flow 400 L/h. Fragmentation patterns in both ES+ and ES− were obtained by using argon as collision gas and collision energy CE in a range of 10–17 eV, optimized for each compound. The Folin–Ciocâlteu phenol reagent, sodium carbonate (Na2CO3; 99% purity), tannic acid (Ph Eur purity), aluminum chloride hexahydrate (AlCl3 × 6 H2O; Ph Eur purity), quercetin (98% purity), 3-[4,5-dimethylthiazol-2-yl]-2,5-diphenyl tetrazolium bromide (MTT), doxorubicin (98% purity), and ethanol (EtOH) were provided by Merck (Darmstadt, Germany), while media, cofactors, and antibiotics for cell cultures were from Aurogene (Rome, Italy).
2.2. Extraction, Isolation, and Identification of Metabolites of R. tinctoria Lichen Material
R. tinctoria was collected in the area between Ostia City and Parco Archeologico of Ostia Antica in July 2022. The lichen R. tinctoria has been recognized by the Department of Environmental Biology, Sapienza University of Rome, through comparison of its morphological data with those reported in the literature. A representative sample of this collection is also stored in our laboratory for further reference under voucher number code RT20220715. Then, 15 g of thalli was successively extracted by Soxhlet apparatus with solvents of increased polarity, i.e., n-hexane, dichloromethane, and methanol. The resulting separated solutions were concentrated at reduced pressure via Rotavapor at a temperature of 35 °C, 40 °C, and 40° C, respectively, obtaining three extracts named DF1, DF2, and DF3, with a yield of 0.17, 1.3, and 36%, respectively. Another extract, named DF4 (24% yield), was prepared from a united double-consecutive maceration of 10 g of thalli in 150 mL of methanol for 24 h after concentration at reduced pressure via Rotavapor at a temperature of 40 °C. Purification of DF3 and DF4 was performed by CC on silica gel using CH2Cl2 100% → CH2Cl2:MeOH (9:1 v/v) as a mobile phase. Three main compounds were isolated from DF3 and DF4: erythrin (1), methyl orsellinate (2), and montagnetol (3).
Characterization of Compounds 1–3
Erythrin (1): Mp 158–160 °C; 1H NMR (CD3OD, 400 MHz) δ 6.63 (m, 2H), 6.27 (d, J = 2.4 Hz, 1H), 6.21 (d, J = 2.5 Hz, 1H), 4.64 (m, 1H), 4.45 (dd, J = 11.5, 6.6 Hz, 1H), 3.91 (m, 1H), 3.79 (dd, J = 13.6, 6.0 Hz, 1H), 3.75–3.64 (m, 2H), 2.56 (s, 6H); IR: ν 3484, 1655, 1608 (cm−1); tR: 12.44 min. MS: [M − H]− = 421 m/z, [M + H]+ = 423 m/z, [M + Na]+ = 445 m/z, principal fragments: ES-, CE 17 eV: 167, 149, 271 m/z; ES+, CE 10 eV: 151 m/z.
Methyl orsellinate (2): Mp 148–150 °C; 1H NMR (DMSO-d6) δ 10.66 (s br, 1H), 9.98 (s br, 1H), 6.16 (m, 2H), 3.79 (s, 3H), 2.28 (s, 3H); IR: ν 3366, 3309, 1613 (cm−1); tR: 13.33 min. MS: [M − H]− = 181 m/z, [M + H]+ = 183 m/z, principal fragments: ES-, CE 10 eV: 149 m/z; ES+, CE 14 eV: 151 m/z.
Montagnetol (3): Mp 136–138 °C; 1H NMR (CD3OD) δ 6.20 (d, J = 1.8 Hz, 1H), 6.15 (d, J = 2.3 Hz, 1H), 4.59 (dd, J = 11.6, 2.8 Hz, 1H), 4.37 (dd, J = 11.6, 6.6 Hz, 1H), 3.92–3.86 (m, 1H), 3.81 (m, 1H), 3.66–3.61 (m, 2H), 2.15 (s, 3H); IR: ν 3394, 3202, 1634 (cm−1); tR: 6.75 min. MS: [M − H]− = 271 m/z, [M + H]+ = 273 m/z, [M + Na]+ = 295 m/z, principal fragments: ES-, CE 12 eV: 149, 167 m/z; ES+, CE 12 eV: 151 m/z.
2.3. HPLC Analysis
High-Performance Liquid Chromatography (HPLC) analysis was carried out with the following instrumentation and parameters: 1260 Infinity II Prime LC System (Agilent, Santa Clara, CA, USA); 1260 Infinity II autosampler; HS 1260 Infinity II diode array detector (Agilent); InfinityLab Poroshell 120 EC-C18 column (3.0 mm × 150 mm, 2.7 µm) (Agilent); solvent A (MilliQ water), solvent B (acetonitrile); gradient program: 5–100% solvent B linearly for 30 min; flow rate 0.5 mL/min; temperature of the column 30 °C; lambda 254 nm.
2.4. Analyses by Gas Chromatography–Mass Spectrometry (GC-MS)
2.4.1. SPME Sampling
To identify the volatile chemical profile of the untreated R. tinctoria, SPME sampling technique was used. Further, 500 mg of the lichen was inserted in a 7 mL glass vial equipped with a PTFE-coated silicone septum. An SPME device from Supelco (Bellefonte, PA, USA) with 1 cm fiber coated with 50/30 μm DVB/CAR/PDMS (divinylbenzene/carboxen/polydimethylsiloxane) was used to adsorb the volatile compounds. The fiber was initially conditioned at 270 °C for 30 min. After reaching equilibrium, the fiber was exposed to the headspace of the sample for 30 min at 40 °C. Lastly, to desorb the components, the SPME fiber was inserted in the GC injector maintained at 250 °C in spitless mode.
2.4.2. GC-MS Analysis
To perform the analyses of the untreated matrix and of DF1, DF2, and DF3 extracts, a Clarus 500 model Perkin Elmer (Waltham, MA, USA) gas chromatograph equipped with FID (flame detector ionization) and coupled with a single-quadrupole mass spectrometer (Clarus 500 model Perkin Elmer) was used. A capillary column (Varian Factor Four VF-1) was housed in the GC oven, whose programmed temperature was set initially at 60 °C, then at a gradient of 7 °C/minute to 170 °C and a gradient of 8 °C/minute to 250 °C for 25 min. The injector GC was set at 270 °C. Helium was used as carrier gas at a constant rate of 1 mL/min. MS detection was performed with electron ionization (EI) at 70 eV, operating in the full-scan acquisition mode in the m/z range 40–550 amu. The identification of compounds was performed by the comparison of the MS-fragmentation pattern of the analytes with those of pure components stored in the Wiley 2.2 and Nist 11 mass spectra libraries database. Further, the linear retention indices (LRIs) were calculated using a series of alkane standards (C8–C25 n-alkanes-Agilent) and then compared with those available in the literature. The relative amounts of the components were expressed as percent peak area relative to total peak area without the use of an internal standard and any factor correction. The analysis was carried out in triplicate.
2.4.3. GC-MS Analysis of the Extracts after Derivatization
To describe the non-volatile content of extracts DF3 and DF4, a derivatization reaction was performed. For this purpose, about 1mg of each extract was added to 300 µL of pyridine and 100 µL of bis-(trimethylsilyl) trifluoroacetamide (BSTFA), with heating at 80 °C for 60 min. One μL of the silylated sample was manually injected at 280 °C into the GC injector. The analysis was performed using the same apparatus GC-MS and the same capillary column (Varian Factor Four VF-1) described in the previous section.
The GC oven temperature program was as follows: 80 °C at the beginning; a gradient of 7 °C/min up to 170 °C; a gradient of 8 °C/min up to 250 °C; a gradient of 8 °C/min up to 300 °C for 25 min. The identification of compounds was achieved on the basis of the similarity percentage and comparison of the obtained mass spectra with those reported in software NIST 11 data library.
2.5. Spectrophotometric Analysis of Total Polyphenols and Tannins
Total polyphenols and tannin contents were determined according to the Folin–Ciocâlteu method [40]; 20 μL of the tested sample was added to 100 μL of the Folin–Ciocâlteu reagent and 80 μL of a sodium carbonate solution at a concentration of 7.5% w/v. After incubation for 2 h, the absorbance was measured at 765 nm by an Epoch Microplate Spectrophotometer (BioTek, AHSI, Milan, Italy). Tannins were calculated by the difference between the amount of polyphenols in the extracts and that in their supernatants after precipitation with polyvinylpyrrolidone (100 mg per mL of extract). The total content was determined from the calibration curves of tannic acid (y = 31055∗x + 0.04217) and expressed as tannic acid equivalents (TAEs) per mg of extract.
2.6. In Vitro Cytotoxic Activity
2.6.1. Cell Culture
To perform this study, human non-small A549 lung cancer and extrahepatic Mz-ChA-1 cholangiocarcinoma cells, along with the human noncancerous epithelial BEAS-2B bronchial cells and SV40-immortalized H69 cholangiocytes [41], were used. A549 cells were kindly provided by Prof. Lucia Nencioni (Dept. of Public Health and Infectious Diseases, Sapienza University of Rome, Rome, Italy), while Mz-ChA-1 and H69 cells were donated by Prof. Romina Mancinelli (Dept. of Anatomical, Histological, Forensic and Orthopedic Sciences, Sapienza University of Rome, Rome, Italy) and Prof. G. Alpini (Indiana University School of Medicine, Indianapolis, IN, USA). BEAS-2B cells were provided by Sigma-Aldrich (St. Louis, MO, USA). All the cell lines were cultured at a density of approximately 2 × 10⁴ cells/cm2 in suitable media and co-factors under standard conditions (37 °C and 5% CO2), according to previous studies [42,43]. The growth media were replaced twice per week; subcultures were prepared when the cells achieved approximately 80% confluency.
2.6.2. Cytotoxicity Evaluation
The 3-[4,5-dimethylthiazol-2-yl]-2,5-diphenyl tetrazolium bromide (MTT) assay was used to determine the effect of the treatments on the cell viability, according to previous methods [43]. In brief, 2 × 10⁴ cells/well were cultured into 96-well microplates for 24 h. Then, they were subjected to a treatment with progressive concentrations of the tested extracts for further 24 h. Further, 1% v/v ethanol (EtOH) was used as negative control, whereas the known cytotoxic agent doxorubicin was used as positive control. The effect of the treatments on the cell viability was expressed as percentage of the vehicle control. A significant level of cytotoxicity is achieved when a decrease in the cell viability exceeding 30% of the control is observed [44].
2.7. In Vitro Antifungal Assays
2.7.1. Antifungal Susceptibility Test
Candida albicans ATCC 10231 was obtained from the American Type Culture Collection (ATCC, Rockville, MD, USA). The antifungal effects of the isolated compounds and of the extracts against C. albicans ATCC 10231 were measured using the broth microdilution method following the standardized methods for yeast [45,46]. C. albicans was cultured on Sabouraud dextrose agar (Sigma Aldrich, St. Louis, MO, USA) at 35 °C for 24 h. The final concentration of the inoculum was 2500 cells/mL. The extracts and the compounds were firstly dissolved in DMSO and then diluted at least 100-times with RPMI-1640 medium buffered with MOPS (4-morpholinepropanesulfonic acid). The concentrations ranged from 512 μg/mL to 8 μg/mL for DF3 and DF4, and from 128 μg/mL to 1 μg/mL for DF3C1, DF3C1, and DF4C1. The minimal inhibitory concentration (MIC) was calculated by comparison of the growth in each well with that of the drug-free control after 24 h. Each experiment was conducted in triplicate and replicated at least three times on different dates.
2.7.2. Anti-Adhesion Activity
Presterilized, polystyrene, flat-bottom 48-well microtiter plates were used to investigate anti-Candida adhesion property of the extracts and the compounds [47,48]. For this, 200 μL aliquot of 1.0 × 10⁶ cell/mL C. albicans suspension was transferred into microtiter plate wells together with the extract solutions at concentrations from 512 μg/mL to 32 μg/mL or of the compound solutions at concentrations from 128 μg/mL to 8 μg/mL, and the plate was incubated for 90 min and 24 h at 37 °C [47]. After that time, the cell suspensions were aspirated, and each well was washed twice with PBS to remove loosely adherent cells. Thus, CV assay was used to quantitatively study Candida adhesion (90 min) and early biofilm formation (24 h) [49]. The biomass was measured at 590 nm using a microplate reader.
2.7.3. Antibiofilm Formation Activity
Candida biofilm was established on flat-bottomed, 48-well microtiter plates, following previous protocols with minor modifications [50]. A suspension of 1.0 × 10⁵ cells/mL of C. albicans was prepared in RPMI-1640 buffered with MOPS (4-morpholinepropanesulfonic acid) and added to each well together with 200 μL of the extract solutions at concentrations from 512 μg/mL to 32 μg/mL or of the compound solution at concentrations from 128 μg/mL to 8 μg/mL. Plates were then incubated for 48 h at 37 °C. After biofilm formation, the medium was aspirated, and non-adherent cells were removed by washing twice with phosphate-buffered saline (PBS). C. albicans biomass was quantified using CV assay [49].
2.7.4. Reduction in Preformed Biofilm
Candida biofilm was formed as previously described [50]. For example, 200 μL of 1.0 × 10⁷ cells/mL suspension of C. albicans was added to polystyrene flat-bottomed, 48-well microtiter plates and incubated for 24 h. After this interval, the medium was aspirated, and non-adherent cells were removed by washing twice with phosphate-buffered saline (PBS). Then, 200 μL of the extract solutions at concentrations from 512 μg/mL to 32 μg/mL or of the compound solutions at concentrations from 128 μg/mL to 8 μg/mL was added on the preformed biofilm and plates incubated for additional 24 h. After removing the media, wells were washed again with PBS. Biomass of preformed biofilm was estimated through CV assay [49]. Furthermore, the experiments were replicated, and the assessment of the metabolic activity of preformed biofilms was quantified using the XTT [2,3-bis(2-methoxy-4-nitro-5-sulfophenyl)-2H-tetrazolium-5-carboxanilide] reduction assay [51]. The experiment was performed three times independently in triplicate, and the results were expressed as mean ± standard deviation (SD).
2.8. In Vivo Antifungal Assay
2.8.1. Galleria Mellonella Survival Assay
The survival assay was carried out as described by Cairone and colleagues [52]. G. mellonella larvae weighed 0.3 ± 0.03 g and were obtained from Todaro Sport (Rome, Italy). Nine groups of larvae each containing 10 larvae were inoculated in the last left proleg with C. albicans suspension and 10 μL of compounds 1–2 at concentrations of 512 μg/mL, 256 μg/mL, and 128 μg/mL, or DF3 at concentrations of 2048 μg/mL, 1024 μg/mL, and 512 μg/mL. Three control groups were used, one with no treatment applied, one pierced and inoculated with sterile saline solution, and one treated with C. albicans suspension. The larvae were subsequently placed in an incubator set at 37 °C and observed for 120 h. They were considered to be deceased when they showed no response to gentle pressure applied with forceps. Each trial was replicated three times, and the outcomes were documented as the survival percentage.
2.8.2. In Vivo Toxicity Studies
The toxicity of compounds 1 and 2 and extract DF3 was investigated in vivo using G. mellonella larvae. G. mellonella larvae were the same as reported in Section 2.8.1. Three groups of ten larvae were pierced in the last left proleg with 10 μL of the compounds (concentrations of 512 μg/mL, 256 μg/mL, and 128 μg/mL) or of the extract (concentrations of 2048 μg/mL, 1024 μg/mL, and 512 μg/mL). Three control groups (each consisting of 10 larvae) were established: one group underwent no treatment; one group was treated with sterile saline solution; one group was treated with C. albicans suspension. The larvae were subsequently incubated at 37 °C and observed for 120 h, with death determined as reported in Section 2.8.1. Each experiment was replicated three times, and the results were reported as the percentage of survival.
2.9. Statistical Analysis
Results are expressed as the mean ± standard error (SE) of at least three experiments each with three technical replicates. GraphPad Prism™ (Version 6.00) software (GraphPad Software, Inc., San Diego, CA, USA) was used to perform the statistical analysis and graphical representation of data. The one-way analysis of variance (one-way ANOVA), followed by Dunnett’s multiple comparison post test, was applied to assess statistically significant differences (p value < 0.05) among multiple treatments, the Student’s t-test for comparison of data between two groups, and the extra sum-of-square F test for evaluating if the IC50 values differ for each dataset.
3. Results and Discussion
3.1. Extraction and Spectrophotometric Analysis of Total Polyphenols and Tannins
R. tinctoria was successively extracted using Soxhlet apparatus with solvents of increased polarity, i.e., n-hexane, dichloromethane, and methanol, giving extracts named DF1, DF2, and DF3, respectively. Extraction with both apolar solvents resulted in a lower yield (0.17–1.3%), while a higher amount of extract was obtained with methanol (36%). In addition, a methanolic extract (DF4) of R. tinctoria was obtained by maceration; as expected, the yield was lower (24%) than DF3 because of a lower temperature of extraction. The spectrophotometric analysis of the methanolic extracts (DF3 and DF4) highlighted the presence of total polyphenols and tannins in both the tested extracts, especially in DF3; in both samples, tannins accounted for approximately two-thirds of the total polyphenols (Table 1). Our results agree with studies highlighting that phenolic compounds are the most relevant secondary metabolites in lichenized fungi [35,53]. For instance, Mendili et al. [54] showed that the Flavoparmelia caperata (L.) Hale and Squamarina cartilaginea (With.) P. James lichens were richest in total phenolic and proanthocyaninds, respectively. Similarly, phenolic compounds were detected in the Ramalina pacifica Asahina as well as in R. montagnei and Roccella phycopsis Ach. [55,56].

Table 1.
Amounts of total polyphenols and tannins in DF3 and DF4 extracts from R. tinctoria, determined as tannic acid equivalents (TAEs). Data are expressed as mean ± standard error (SE) of at least two experiments, each one with at least three technical replicates (n = 6).
3.2. Isolation, Characterization, and Quantification of Erythrin (1), Methyl Orsellinate (2), and Montagnetol (3)
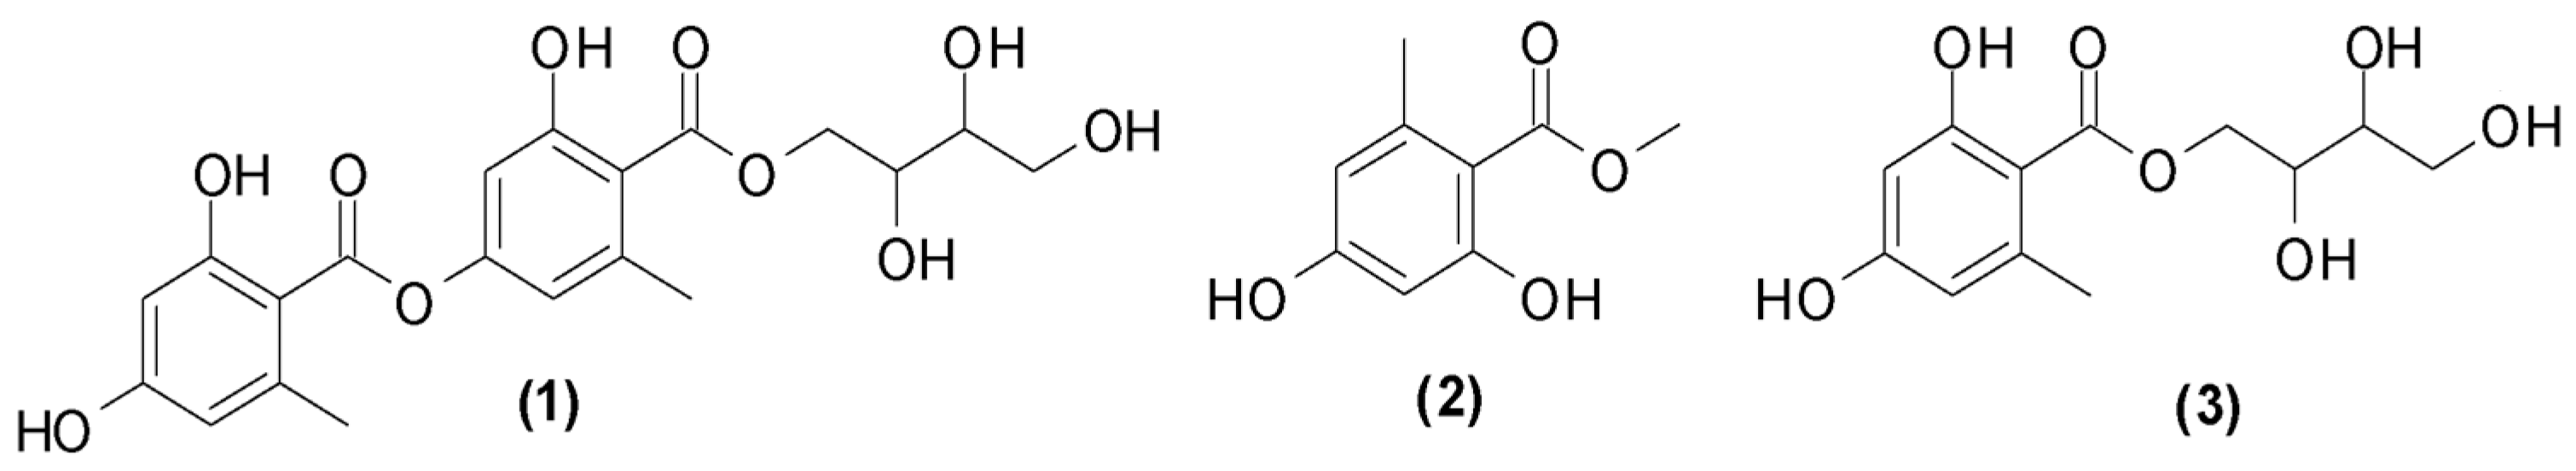
The fractionation of DF3 and DF4 by column chromatography on silica gel gave three pure compounds that were identified as erythrin (1), methyl orsellinate (2), and montagnetol (3) through Fourier-transform infrared spectroscopy (FTIR), mass spectrometry (MS), and melting point (MP) analysis as well as a comparison with proton nuclear magnetic resonance (1H-NMR) data in the literature (Figure 1) [57,58].
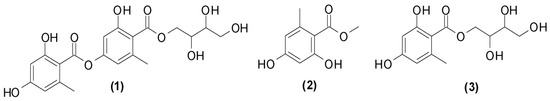
Figure 1.
Non-volatile compounds isolated from R. tinctoria methanolic extracts.
The presence of these compounds has previously been reported in the species [12,13,14,15]. The quantification of 1–3 in DF3 and DF4 was carried out by HPLC-DAD. As shown in Table 2, erythrin is the main component in DF4, while methyl orsellinate is the main one in DF3.
Table 2.
Amounts of 1–3 in DF3 and DF4 extracts from R. tinctoria. Data are expressed in mg of compounds/100 mg extract.
3.3. SPME-GC-MS Chemical Composition
To describe the chemical profile of untreated R. tinctoria, the matrix was analyzed via SPME-GC-MS. In total, 14 components belonging to different chemical classes were identified (Table 3). The main classes were terpenoids, aliphatic aldehydes, and carbonyl compounds. The main molecule was the hydrocarbon 8-heptadecene (73.5%). The three detected and identified terpenoids were β-cyclocitral, trans-β-ionone, and sandaracopimaradiene. Two furan derivatives were also found, namely 2-pentylfuran and 2(4H)-benzofuranone,5,6,7,7a-tetrahydro-4,4,7a-trimethyl. The present work is the first to describe the volatile chemical components of untreated R. tinctoria via the SPME-GC/MS technique.
Table 3.
Chemical composition (percentages mean values ± standard deviation) of the volatile compounds of R. tinctoria.
3.4. Chemical Composition of the Volatile Components of the Extracts
The GC analyses carried out on the extracts allowed us to detect the volatile compounds present in these samples (Table 4). DF1 was qualitatively the richest extract, with seven identified components; DF3 was characterized by only two components, whereas DF2 and DF4 by only one. In detail, in DF1 palmitic acid (44.2%) and 2,5-furandione, dihydro-3-tatradecyl (35.3%) was the most abundant, followed by 2(4H)-benzofuranone and 5,6,7,7a-tetrahydro-4,4,7a-trimethyl (11.5%). In DF2 and DF4, 2,5-furandione,dihydro-3-tatradecyl and orcinol were found, respectively. On the other side, in DF3, methyl orsellinate (51.0%) and 2,5-furandione,dihydro-3-tatradecyl (49.0%) were detected.
Table 4.
Chemical composition (percentages mean values ± standard deviation) of R. tinctoria extracts.
3.5. Chemical Composition of Extracts DF3 and DF4 after Derivatization
Direct injection analyses of the silylated extracts allowed for the identification of only erythritol in DF3 and DF4 extracts, as reported in Table 5.
Table 5.
Chemical composition (percentages mean values) of R. tinctoria DF3 and DF4 extracts.
3.6. In Vitro Cytotoxicity Assay
The antiproliferative activity of DF3 and DF4 extracts (concentration range from 10 to 1000 µg/mL; 1:1.3 to 1:5 dilution factor) and 1–3 (concentration range from 10 to 500 µg/mL; 1:1.3 to 1:5 dilution factor) was assayed in terms of viability inhibition in human A549 lung cancer and Mz-ChA-1 cholangiocarcinoma cells. In addition, tolerability studies in human epithelial BEAS-2B bronchial cells and H69 cholangiocytes were performed in order to establish the possible selective cytotoxicity of the tested samples to cancer cells.
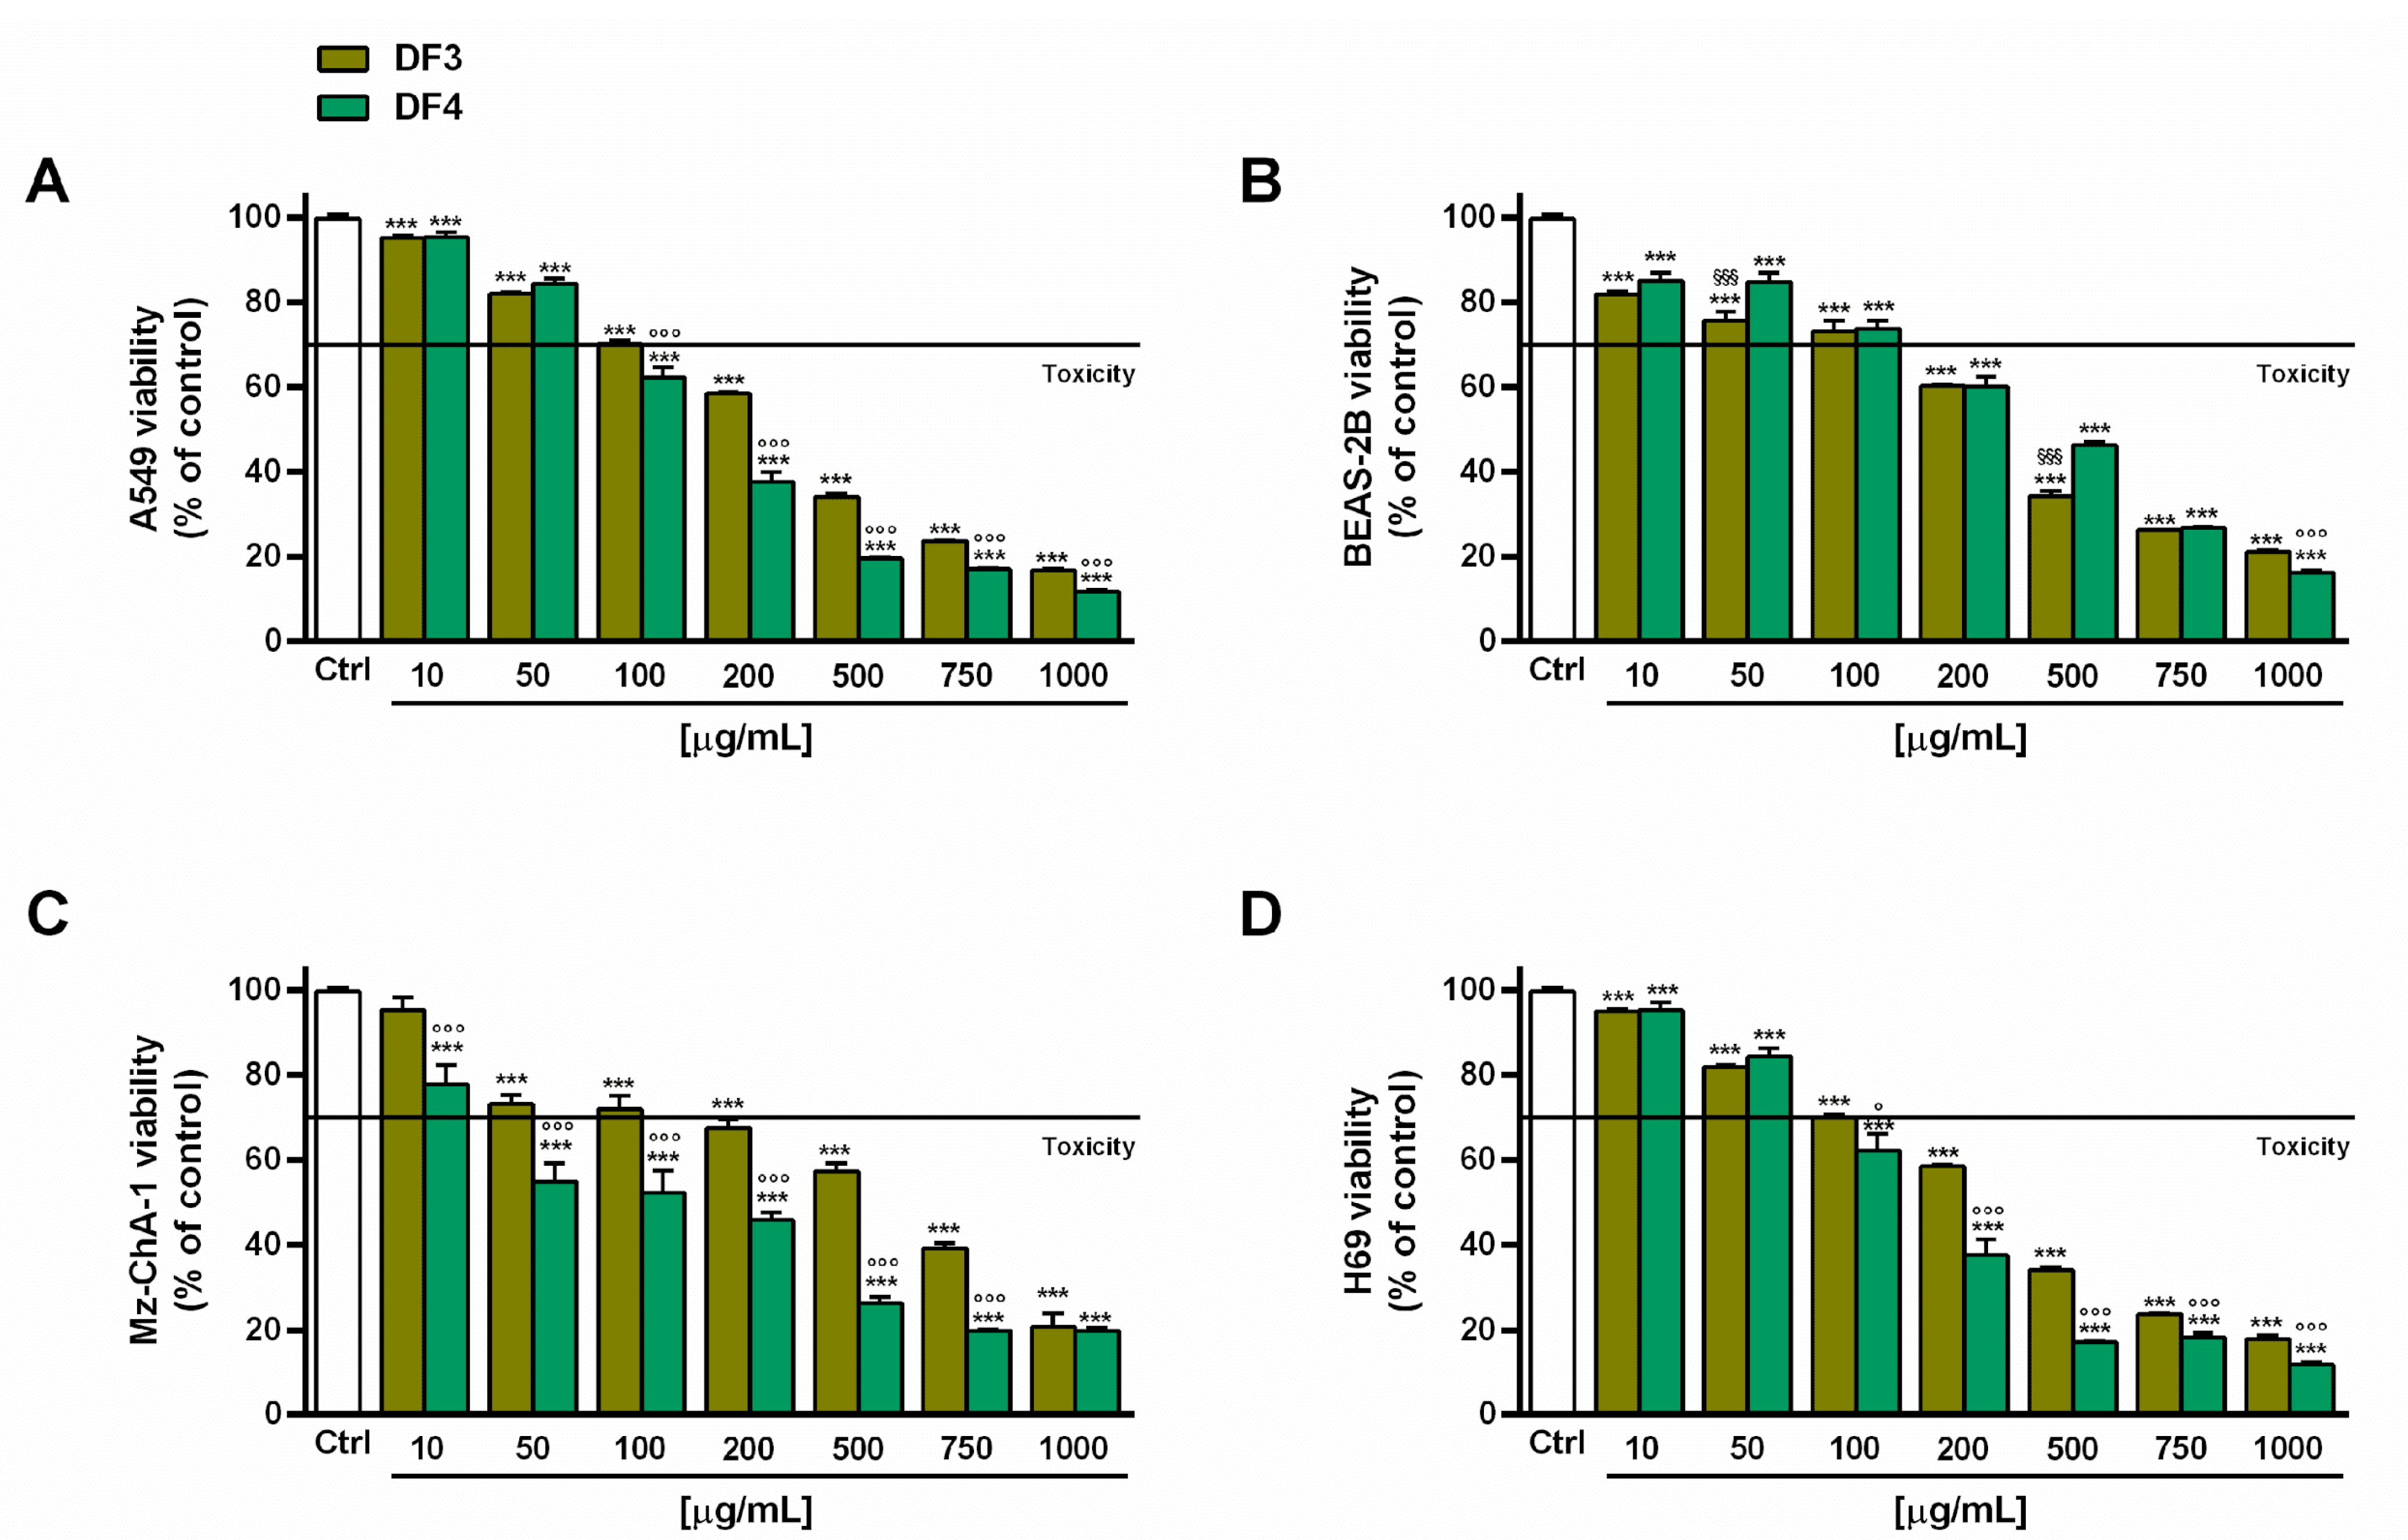
DF3 and DF4 extracts induced progressive cytotoxic effects, starting from concentrations of 100 and 50 µg/mL, respectively (Figure 2A,C), in both A549 and Mz-ChA-1 cells. DF4 was found to be more potent than DF3; in fact, at a concentration of 100 µg/mL, it induced a 40% and almost 50% inhibition in A549 and Mz-ChA-1 cells, respectively, despite around 30% cell viability inhibition by DF3. This evidence was further confirmed by the IC50 values of DF3, which were about 1.5- and 4-fold higher than those of DF4 in A549 and Mz-ChA-1 cells, respectively (Table 6).
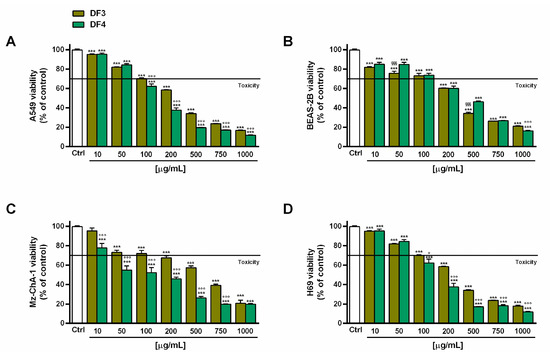
Figure 2.
Effect of DF3 and DF4 extracts on the viability of the the A549 lung cancer cells (A), noncancerous epithelial bronchial BEAS-2B cells (B), Mz-ChA-1 cholangiocarcinoma cells (C) and H69 cholangiocytes (D). Data represent the average and standard error of at least three independent experiments, each one with at least three technical replicates (n = 9). *** p < 0.001, significantly different with respect to control (ANOVA followed by Dunnett’s multiple comparison post test). ° p < 0.05 and °°° p < 0.001, significantly lower than DF3 (Student’s t-test). §§§ p < 0.001, significantly lower than DF4 (Student’s t-test).
Table 6.
Half-maximal inhibitory concentration (IC50) values of the cytotoxic effect of DF3 and DF4 extracts, 1–3 and the positive control doxorubicin in A549 lung cancer and Mz-ChA-1 cholangiocarcinoma cells, in noncancerous epithelial bronchial BEAS-2B cells and in H69 cholangiocytes. Data represent the mean ± SE of at least three independent experiments with at least three technical replicates (n = 9).
In the noncancerous BEAS-2B cells, the extracts exhibited a similar toxicity profile, as also confirmed by the IC50 values. In particular, they were nontoxic up to 100 µg/mL, with early toxicity signs (about 40% cytotoxicity) at a concentration of 200 µg/mL (Figure 2B). Conversely, DF3 appeared to be slightly less toxic than DF4 in H69 cholangiocytes; indeed, at 100 µg/mL, it induced about 30% inhibition of cell viability, despite 40% inhibition by DF4 (Figure 2D). The IC50 value of DF3 was 1.6-fold higher than that of DF4 (Table 6). Interestingly, DF4 exhibited a toxicity profile about 2-fold lower than that highlighted in cancerous cells (Table 6).
Under our experimental conditions, compounds 2 and 3 exhibited weak in vitro anticancer properties (lower than 50% cytotoxicity at the highest concentration tested) in A549 and Mz-ChA-1 cells. Compound 1 was slightly more potent than 2 and 3, producing at least 60% inhibition at the highest concentration of 500 µg/mL (Figure 3A,B). For all compounds, the IC50 values were not evaluable since the maximum cytotoxicity was lower than 80% (Table 6). The compounds, especially 1 and 2, were markedly toxic in noncancerous BEAS-2B and H69 cells, respectively. Conversely, 3 showed cytotoxic effects starting from a concentration of 200 µg/mL in BEAS-2B cells and from a concentration of 50 µg/mL in H69 cholangiocytes (Figure 3B,D). In fact, at a concentration of 50 µg/mL, 1 and 2 induced at least 40% inhibition of BEAS-2B cell viability, whereas 3 induced lower inhibition (less than 20%). At the same concentration, 2 lowered the H69 cell viability by 60%, while 1 and 3 by about 40% (Figure 3B,D).
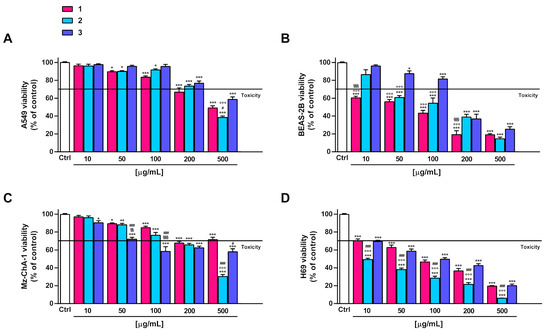
Figure 3.
Effect of 1–3 on the viability of the A549 lung cancer cells (A), noncancerous epithelial bronchial BEAS-2B cells (B), Mz-ChA-1 cholangiocarcinoma cells (C) and H69 cholangiocytes (D). Data represent the average and standard error of at least three independent experiments, each one with at least three technical replicates (n = 9). * p < 0.05, ** p < 0.01 and *** p < 0.001, significantly different with respect to control (ANOVA followed by Dunnett’s multiple comparison post test). # p < 0.05 and ### p < 0.001, significantly lower than 1 (Student’s t-test). §§ p < 0.01 and §§§ p < 0.001, significantly lower than 2 (Student’s t-test). °°° p < 0.001, significantly lower than 3 (Student’s t-test).
Although several lichen-derived compounds have been assessed as potential anticancer agents [19,20,22], the investigations into isolated compounds 1–3 were limited or lacking. Huy and Bui [59] isolated compounds 1 and 3 from the lichen Roccella sinensis and showed they were nontoxic in MCF-7 (breast cancer cell line), HeLa (cervical cancer cell line), HepG2 (liver hepatocellular carcinoma cell line), and NCI-H460 (human lung cancer cell line) at a concentration of 100 µg/mL. Accordingly, these substances were nontoxic or low-toxic at the same concentration in A549 and Mz-ChA-1 cells under our experimental conditions. Conversely, Roser et al. [60] reported that lecanoric acid, which is a structural analogue of compound 1, affected the cell viability and colony formation, and it induced a cell cycle block in HCT-116 colon cancer cells, despite exhibiting lower cytotoxic effects in noncancerous primary human immune and endothelial cells. Under our experimental conditions, the pure compounds 1, 2, and 3 exhibited higher toxicity in noncancerous cells (specifically, 1 > 2 > 3 in BEAS-2B cells and 2 > 1 > 3 in H69 cells) compared to cancerous ones, despite an opposite trend for the extracts. This suggests that the harmful effects of the pure compounds may be mitigated within the phytocomplex by the presence of protective or antagonistic agents. Further studies are needed to elucidate the contribution of 1–3 to the in vitro anticancer activity of DF3 and DF4 extracts from R. tinctora lichen and their tolerability in vivo.
3.7. In Vitro Antifungal Activity
3.7.1. Antifungal Susceptibility Test
The antifungal activity of extracts and isolated compounds against C. albicans planktonic cells was examined following the standardized broth microdilution method for yeasts (CLSI M27-A3) [45,46]. The results presented in Table 7 showed that compound 2 inhibited C. albicans planktonic cell growth by 50% at a concentration of 87 μg/mL. Indeed, compounds 1 and 3 and DF4 and DF3 extracts showed no activity against the planktonic growth of C. albicans at the highest concentration (512 μg/mL)
Table 7.
Antifungal activity of 1–3, DF4, and DF3 against C. albicans planktonic cells.
The reported results in Table 7 are perfectly in accordance with previous studies on the same topic. In fact, erythrin (1) has not shown any antifungal activity against different fungal strains including C. albicans [61]. Indeed, compound 2 has already shown high antifungal effects against Alternaria solani and Fusarium oxysporum, with inhibition percentages of 58.41% and 67.39% at a concentration of 100 µg/mL [62]. Lastly, montagnetol (3) has shown very poor effects against C. albicans, with an inhibition zone diameter of 0.125 mm [33]. From the literature survey, it was possible to observe that the absence of the alcoholic chain seems to favor the activity as well as the presence of only one aromatic group. Yet, this hypothesis needs more in-depth pharmacological studies to be fully verified.
3.7.2. Anti-Candida Adhesion Activity
Given the importance of C. albicans adhesion to abiotic surfaces in the establishment of hard-to-treat infections, the following investigation focused on the ability of the extracts to inhibit this virulence factor [50,63]. An anti-adhesion assay was conducted following the method previously described by Bandara and colleagues [47] on polystyrene flat-bottomed plates. The total biomass of the biofilm was evaluated using a crystal violet (CV) assay, and the results were reported as the percentage of inhibition.
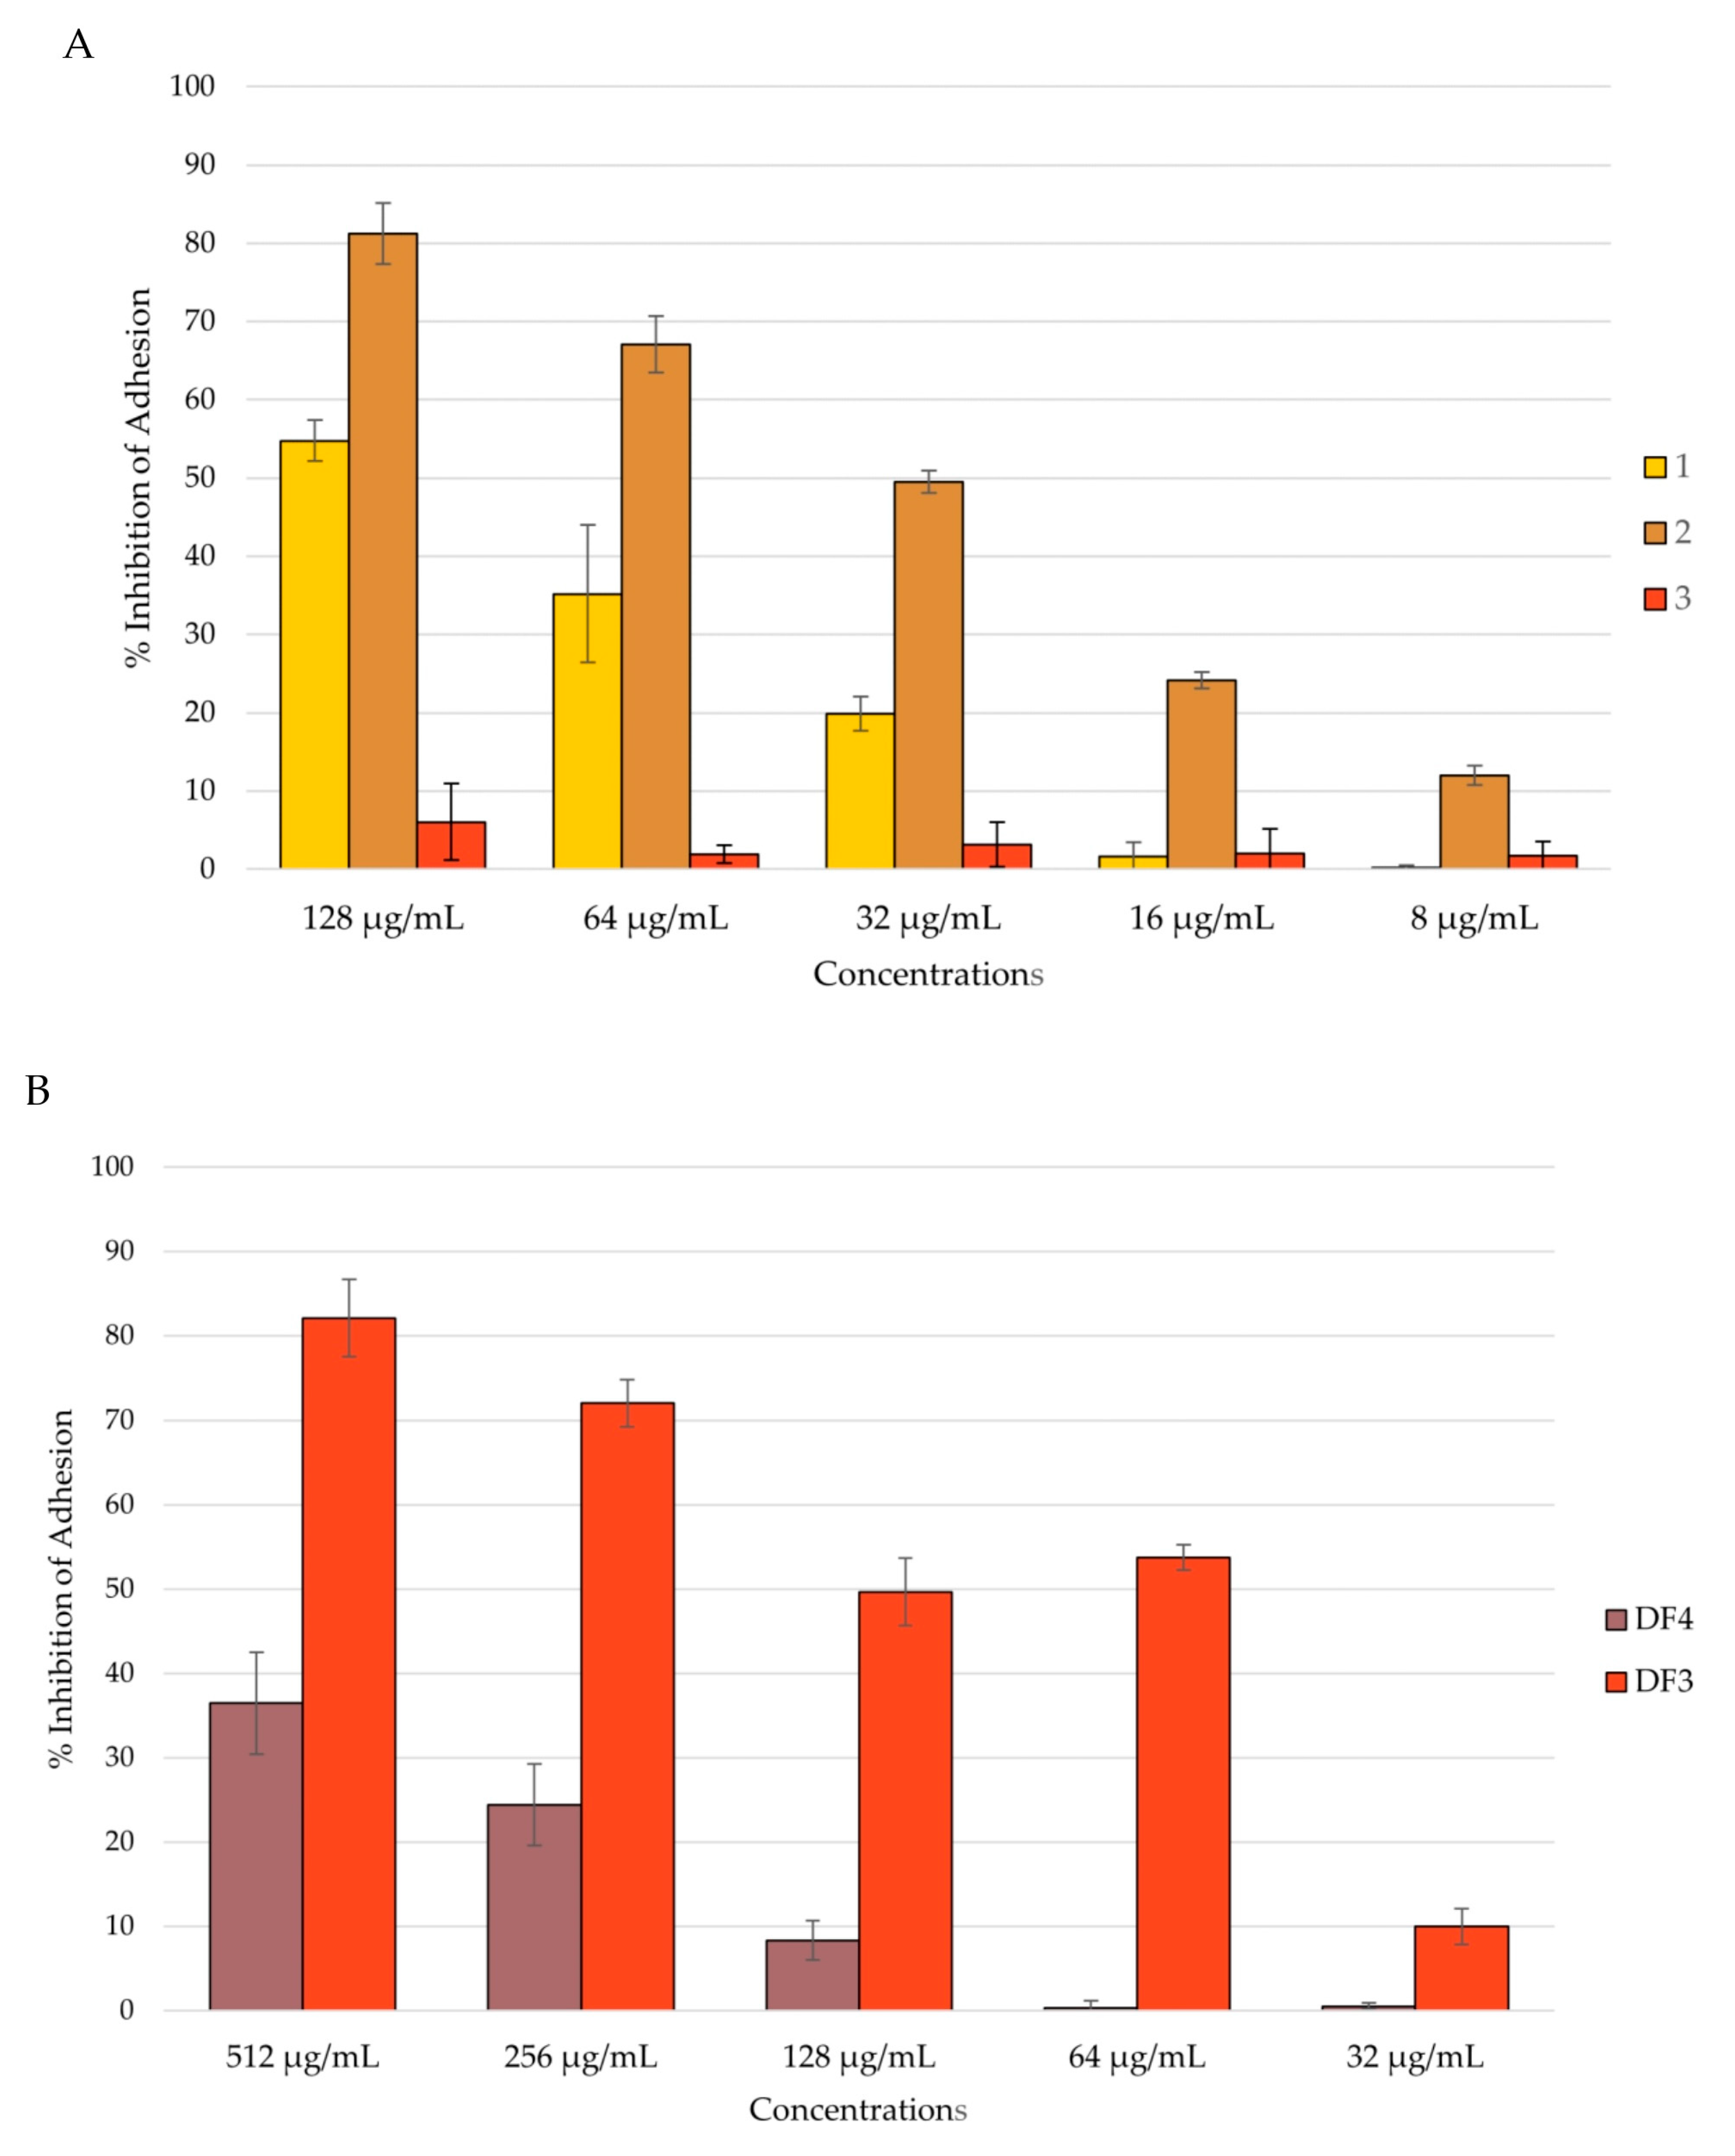
Among the isolated compounds, 2 showed the highest percentage of inhibition of C. albicans adhesion, with a reduction of 81% at a concentration of 128 μg/mL. Compound 1 inhibited C. albicans adhesion by 55% at a concentration of 128 μg/mL. Compound 3 had no activity against C. albicans adhesion (Figure 4A). Among the extracts, DF3 showed the best activity, with around a 50% reduction in adhesion at a concentration of 64 μg/mL (Figure 4B).

Figure 4.
Percent rate of inhibition of C. albicans adhesion after 90 min of incubation: (A) by compounds 1–3; (B) by DF4 and DF3. The results are expressed as mean ± standard deviation (SD) of three different experiments conducted on different dates.
3.7.3. Anti-Candida Biofilm Formation
Candida adhesion is followed by the colonization and formation of the biofilm, which is a community of cells with the ability to secrete the extracellular matrix (ECM). Biofilm-characterized infections are the most difficult to treat, and preventing biofilm formation could be of major importance. An anti-Candida biofilm formation assay was conducted after 24 h and 48 h of biofilm incubation, and the total biomass was evaluated using the CV assay [49,64]. All tested extracts showed the ability to inhibit C. albicans biofilm formation in a dose-dependent manner after 24 h of incubation. Even in this case, compound 2 and extract DF3 were shown to be the most active. In fact, compound 2 inhibited the biofilm formation by 86% at a concentration of 128 μg/mL (Figure 5A), and DF3 showed a percent rate of inhibition of nearly 90% at a concentration of 512 μg/mL (Figure 5B). Further, 1 and DF4 had a percent rate of inhibition lower than 40%, while 3 was confirmed to have no activity against C. albicans mean virulence factors, such as adhesion and biofilm formation (Figure 5A).
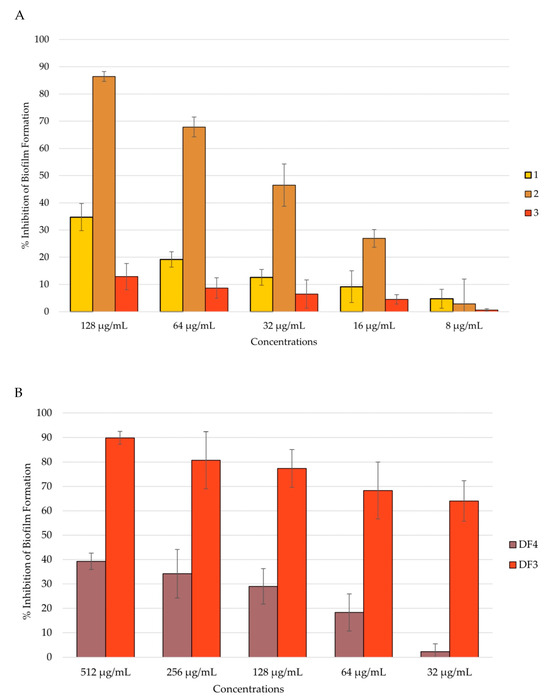
Figure 5.
Percent rate of inhibition of C. albicans biofilm after 24 h of incubation: (A) by 1–3; (B) by DF4 and DF3. The results are expressed as mean ± standard deviation (SD) of three different experiments conducted on different dates.
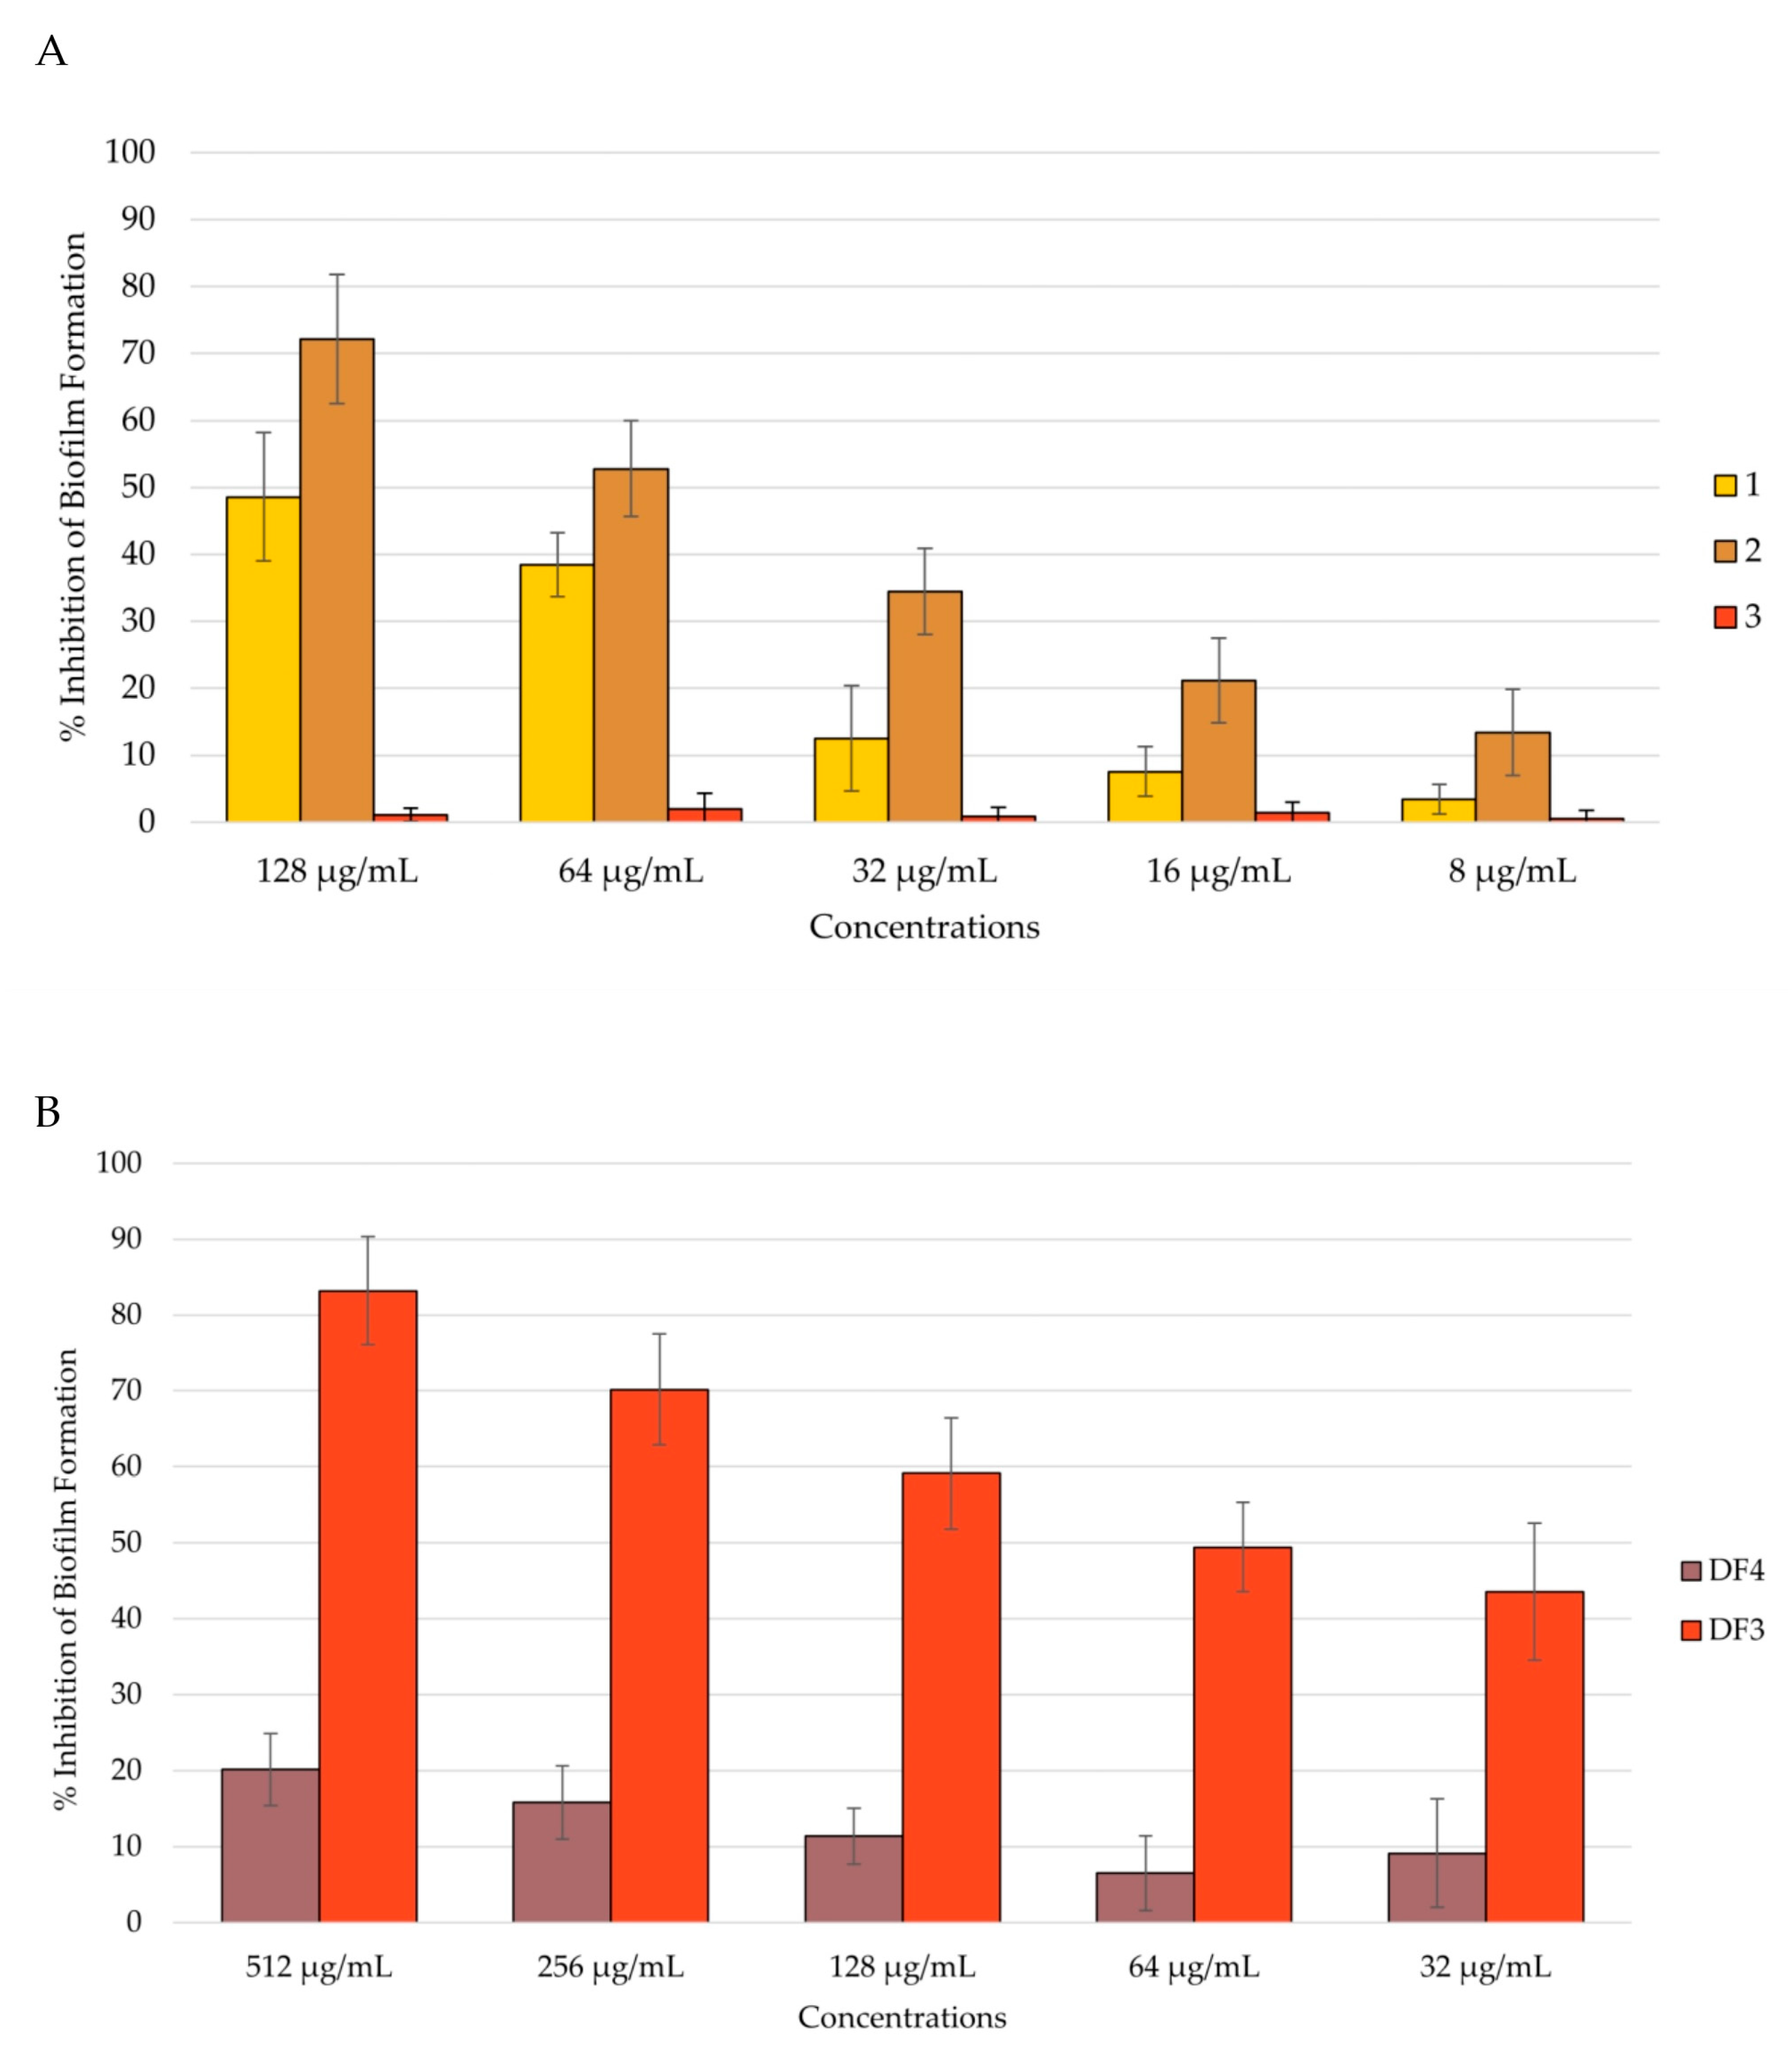
After 48 h of incubation, 2’s anti-biofilm formation activity decreased to 72% at 512 μg/mL (Figure 6A), remaining the most active together with DF3, which inhibited biofilm formation by 83% after 48 h at 512 μg/mL (Figure 6B). Compound 1 inhibited biofilm formation by 49% after 48 h at 128 μg/mL, while 3 remained inactive (Figure 6B). DF4 anti-biofilm formation considerably decreased at 48 h, with respect to the result obtained at 24 h (percent rate of 20% at 512 μg/mL). All tested extracts showed dose-dependent capacity to inhibit biofilm formation, even after 48 h of incubation (Figure 6B).
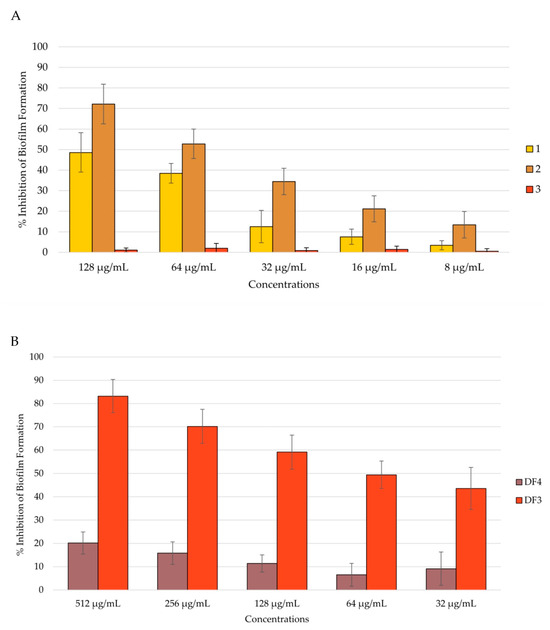
Figure 6.
Percent rate of inhibition of C. albicans formation after 48 h of incubation: (A) by 1–3; (B) by DF4 and DF3. The results are expressed as mean ± standard deviation (SD) of three different experiments conducted on different dates.
3.7.4. Anti-Candida Mature Biofilm Inhibition
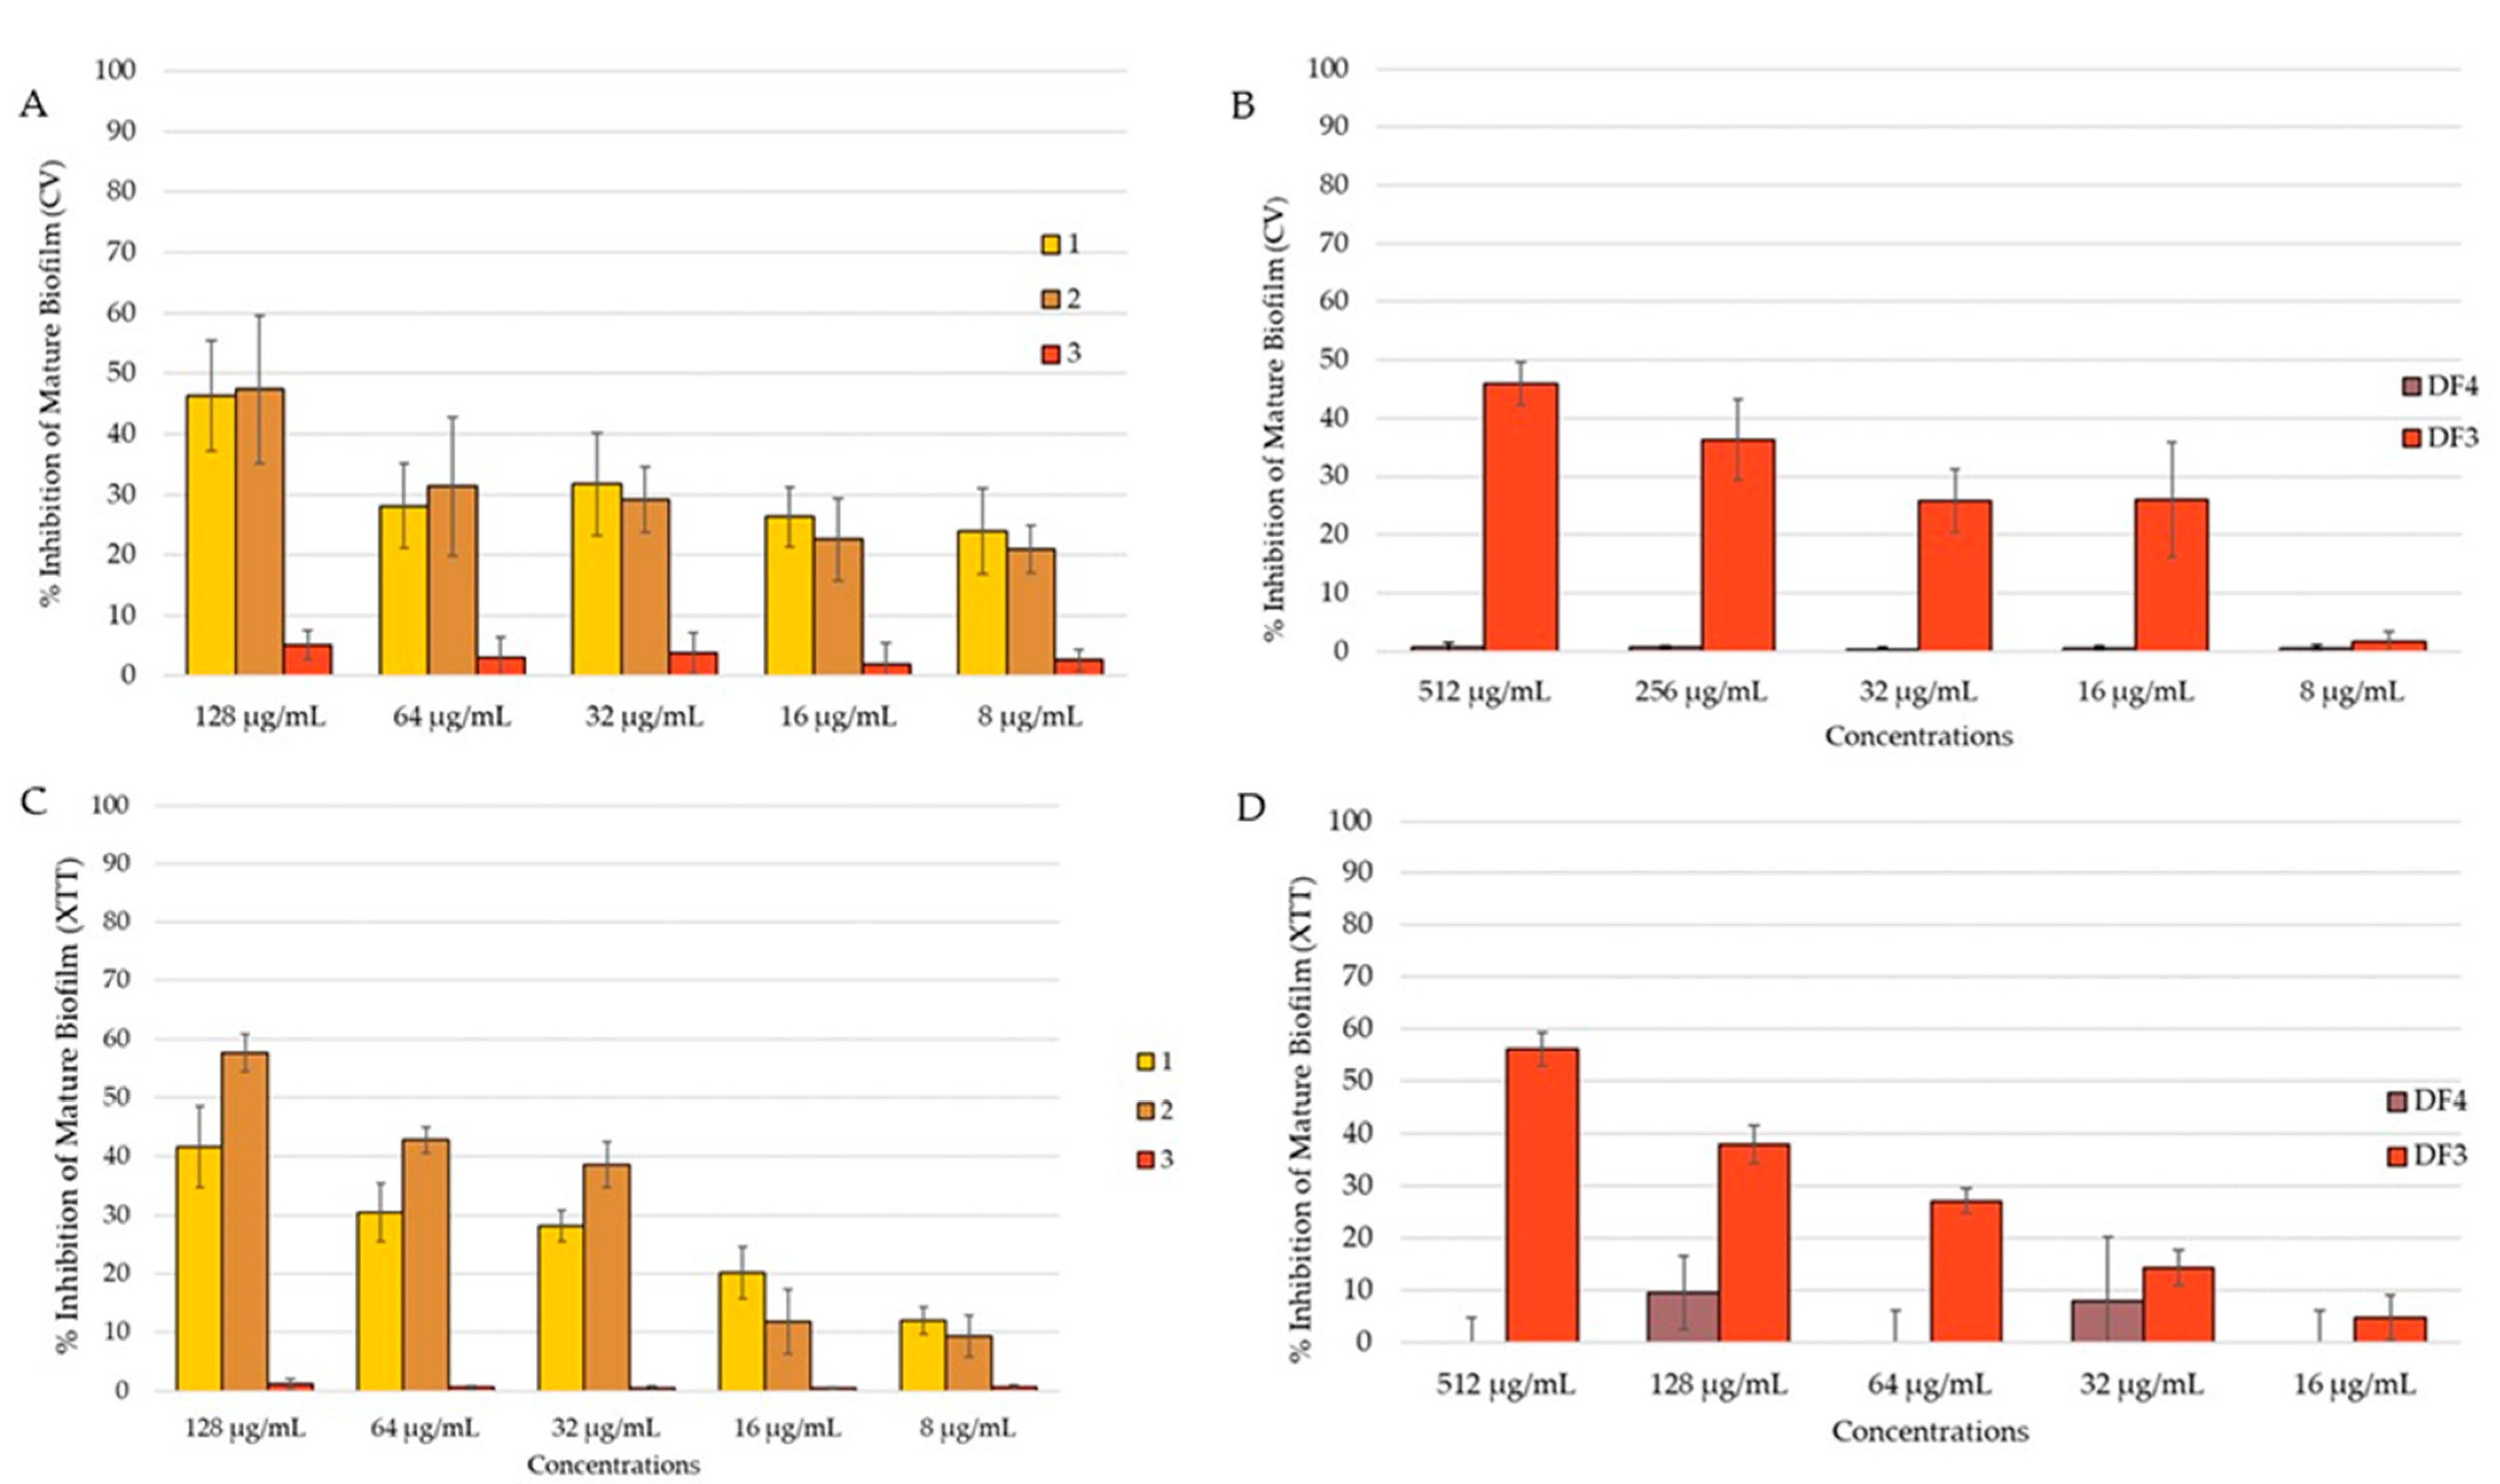
The C. albicans mature biofilm was grown for 24 h on polystyrene flat-bottomed plates, before adding the extract solutions at different concentrations and incubated for an additional 24 h. A reduction in the mature biofilm was investigated using both CV and XTT assays, with the aim to evaluate the total biomass and the metabolic activity, respectively. Due to the high resistance of the biofilm, the activity of the extracts decreased against the preformed biofilm. Compound 2 reduced the mature biofilm by 47% in the CV assay (Figure 7A) and by 58% in the XTT assay (Figure 7C) at 128 μg/mL. At the same concentration, 1 reduced the mature biofilm by 46% (Figure 7A). DF3 showed percent rate of inhibition of 46% and 56%, respectively, in the quantification of the biofilm (CV assay, Figure 7B) and in the evaluation of biofilm metabolic activity (XTT assay, Figure 7D) at a concentration of 512 μg/mL. Compound 3 and DF4 had no activity against the C. albicans mature biofilm.
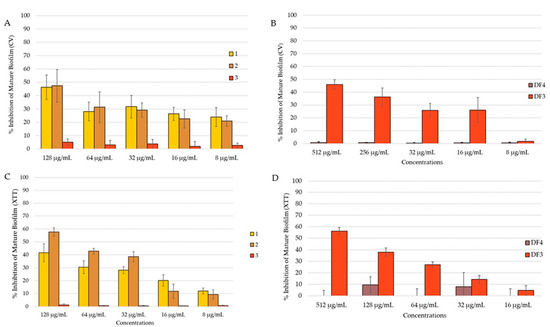
Figure 7.
Percent rate of reduction in C. albicans mature biofilm: (A) by 1–3 obtained using CV assay; (B) by DF4 and DF3 obtained using CV assay; (C) by 1–3 obtained using XTT assay; (D) by DF4 and DF3 obtained using XTT assay. The results are expressed as mean ± standard deviation (SD) of three different experiments conducted on different dates. Percent rate of reduction in C. albicans mature biofilm obtained using XTT assay. The results are expressed as mean ± standard deviation (SD) of three different experiments conducted on different dates.
3.8. In Vivo Antifungal Assays
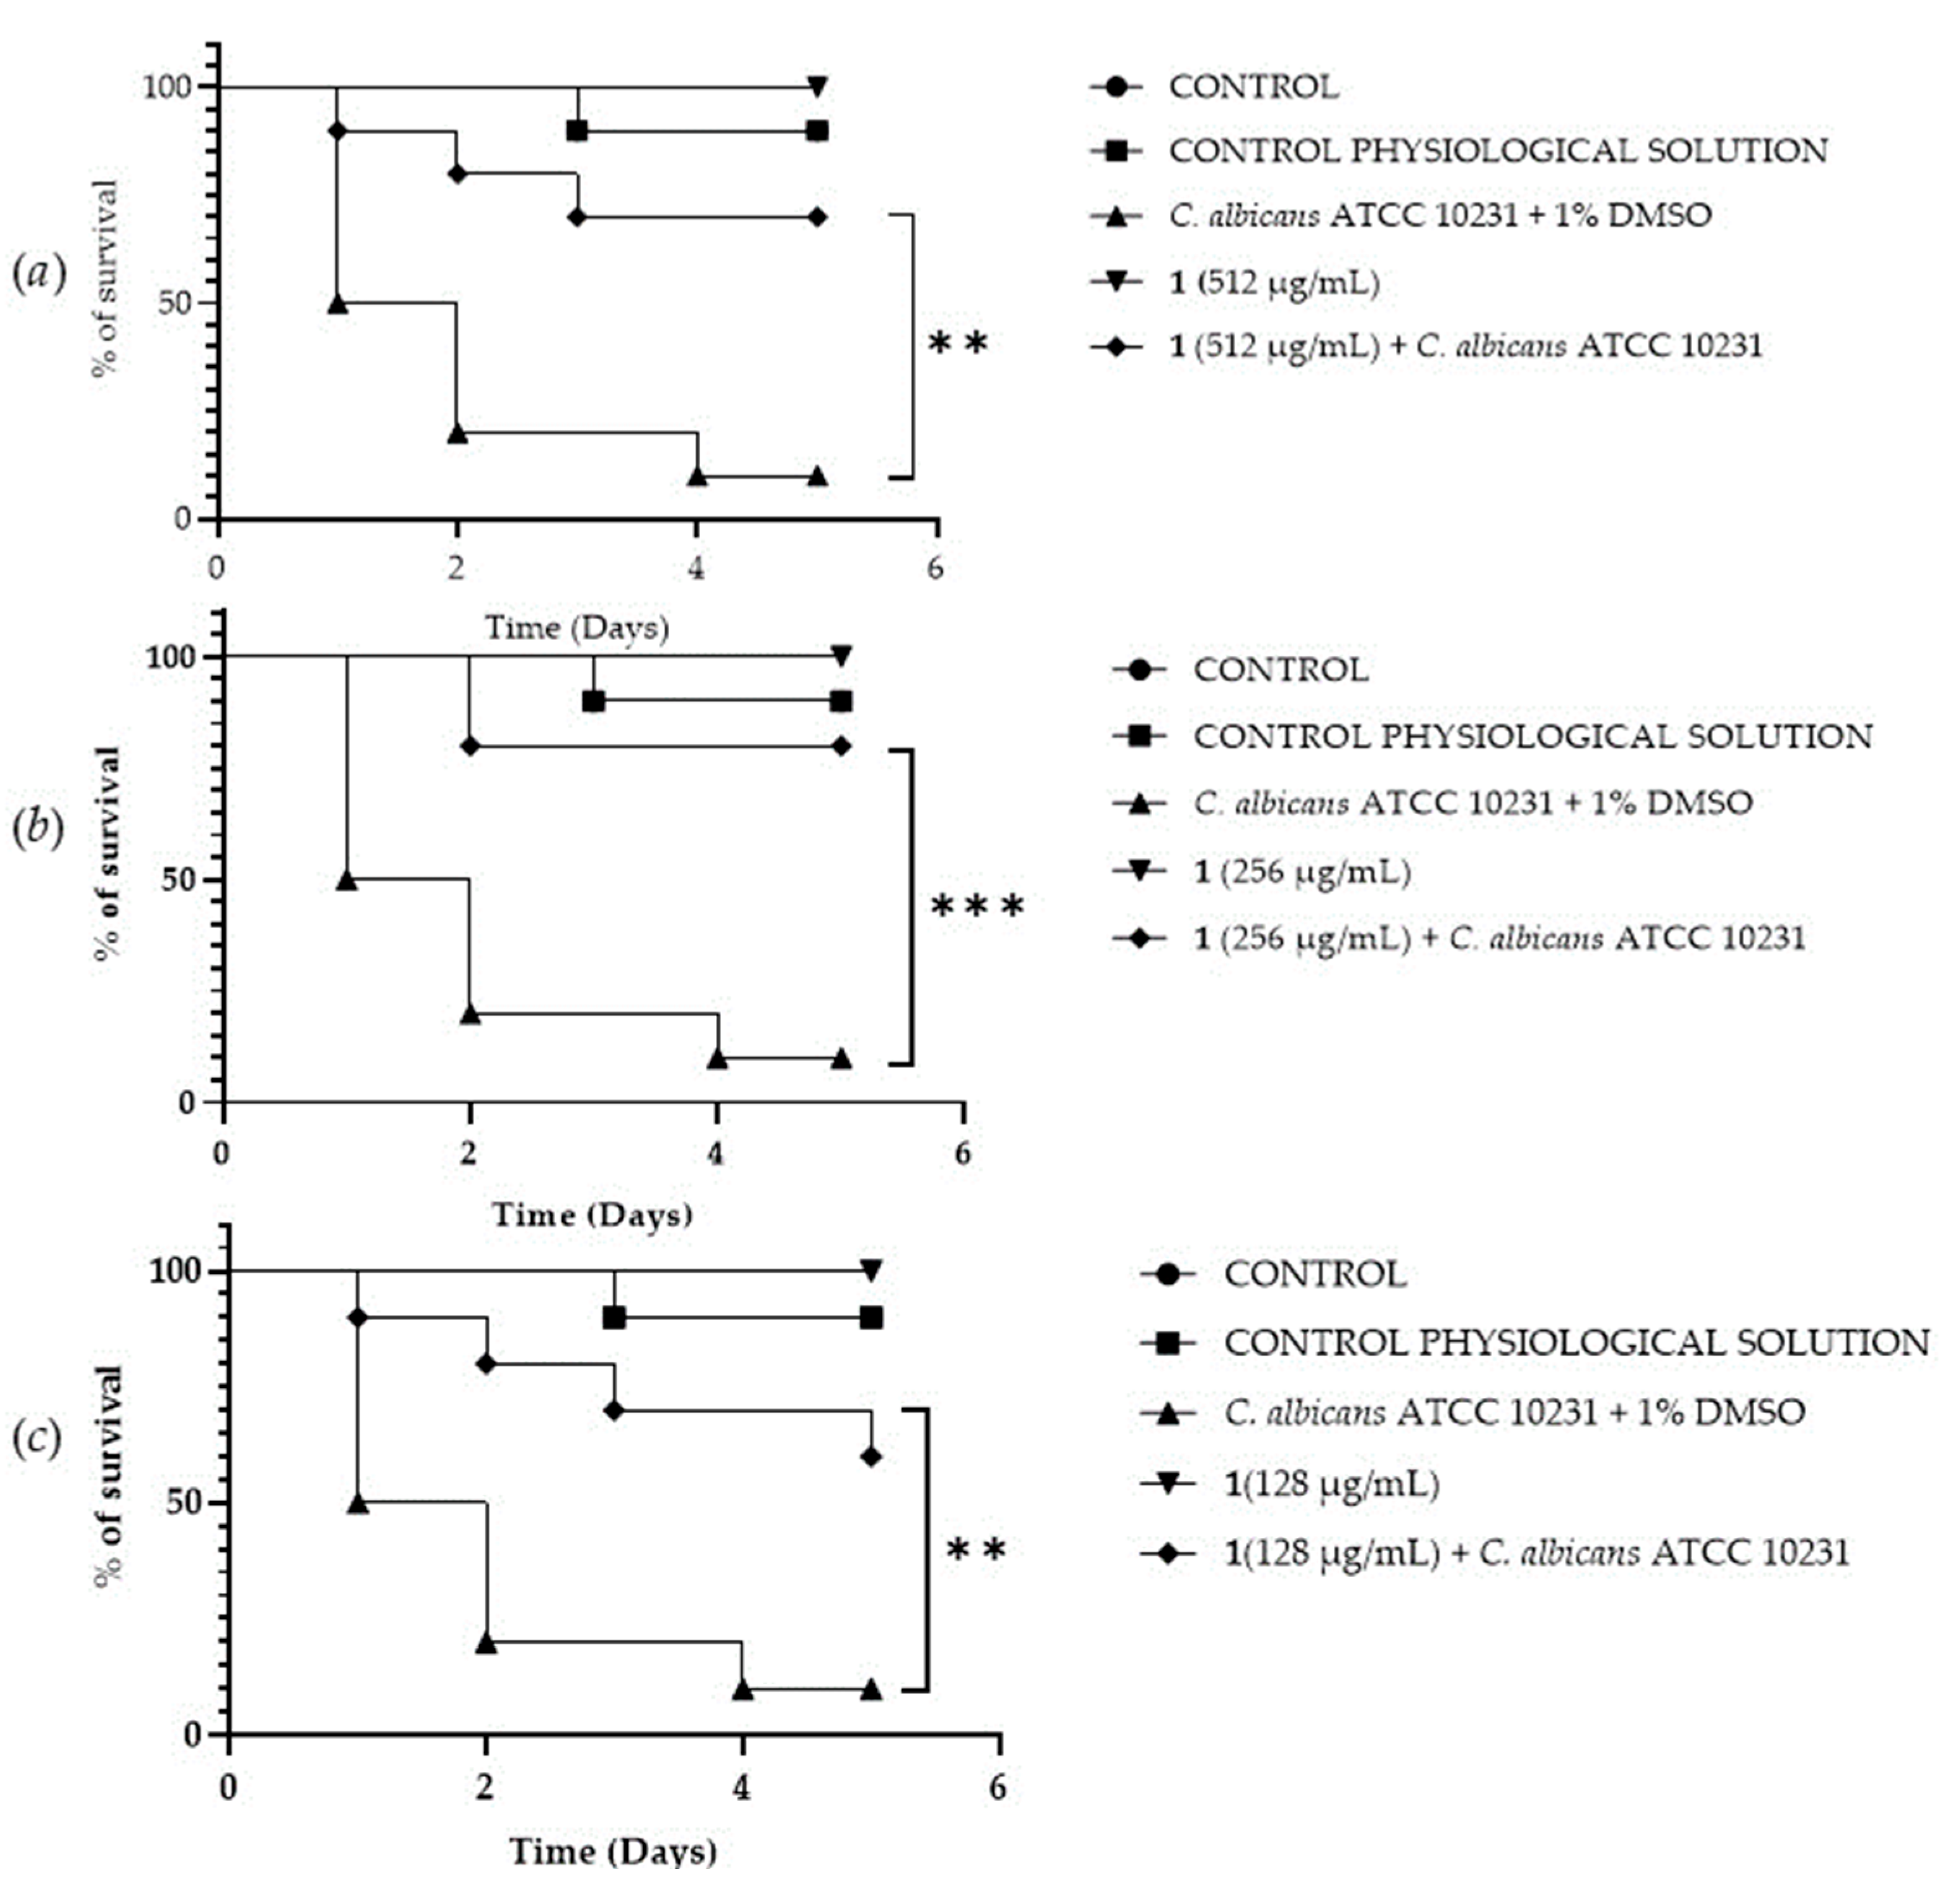
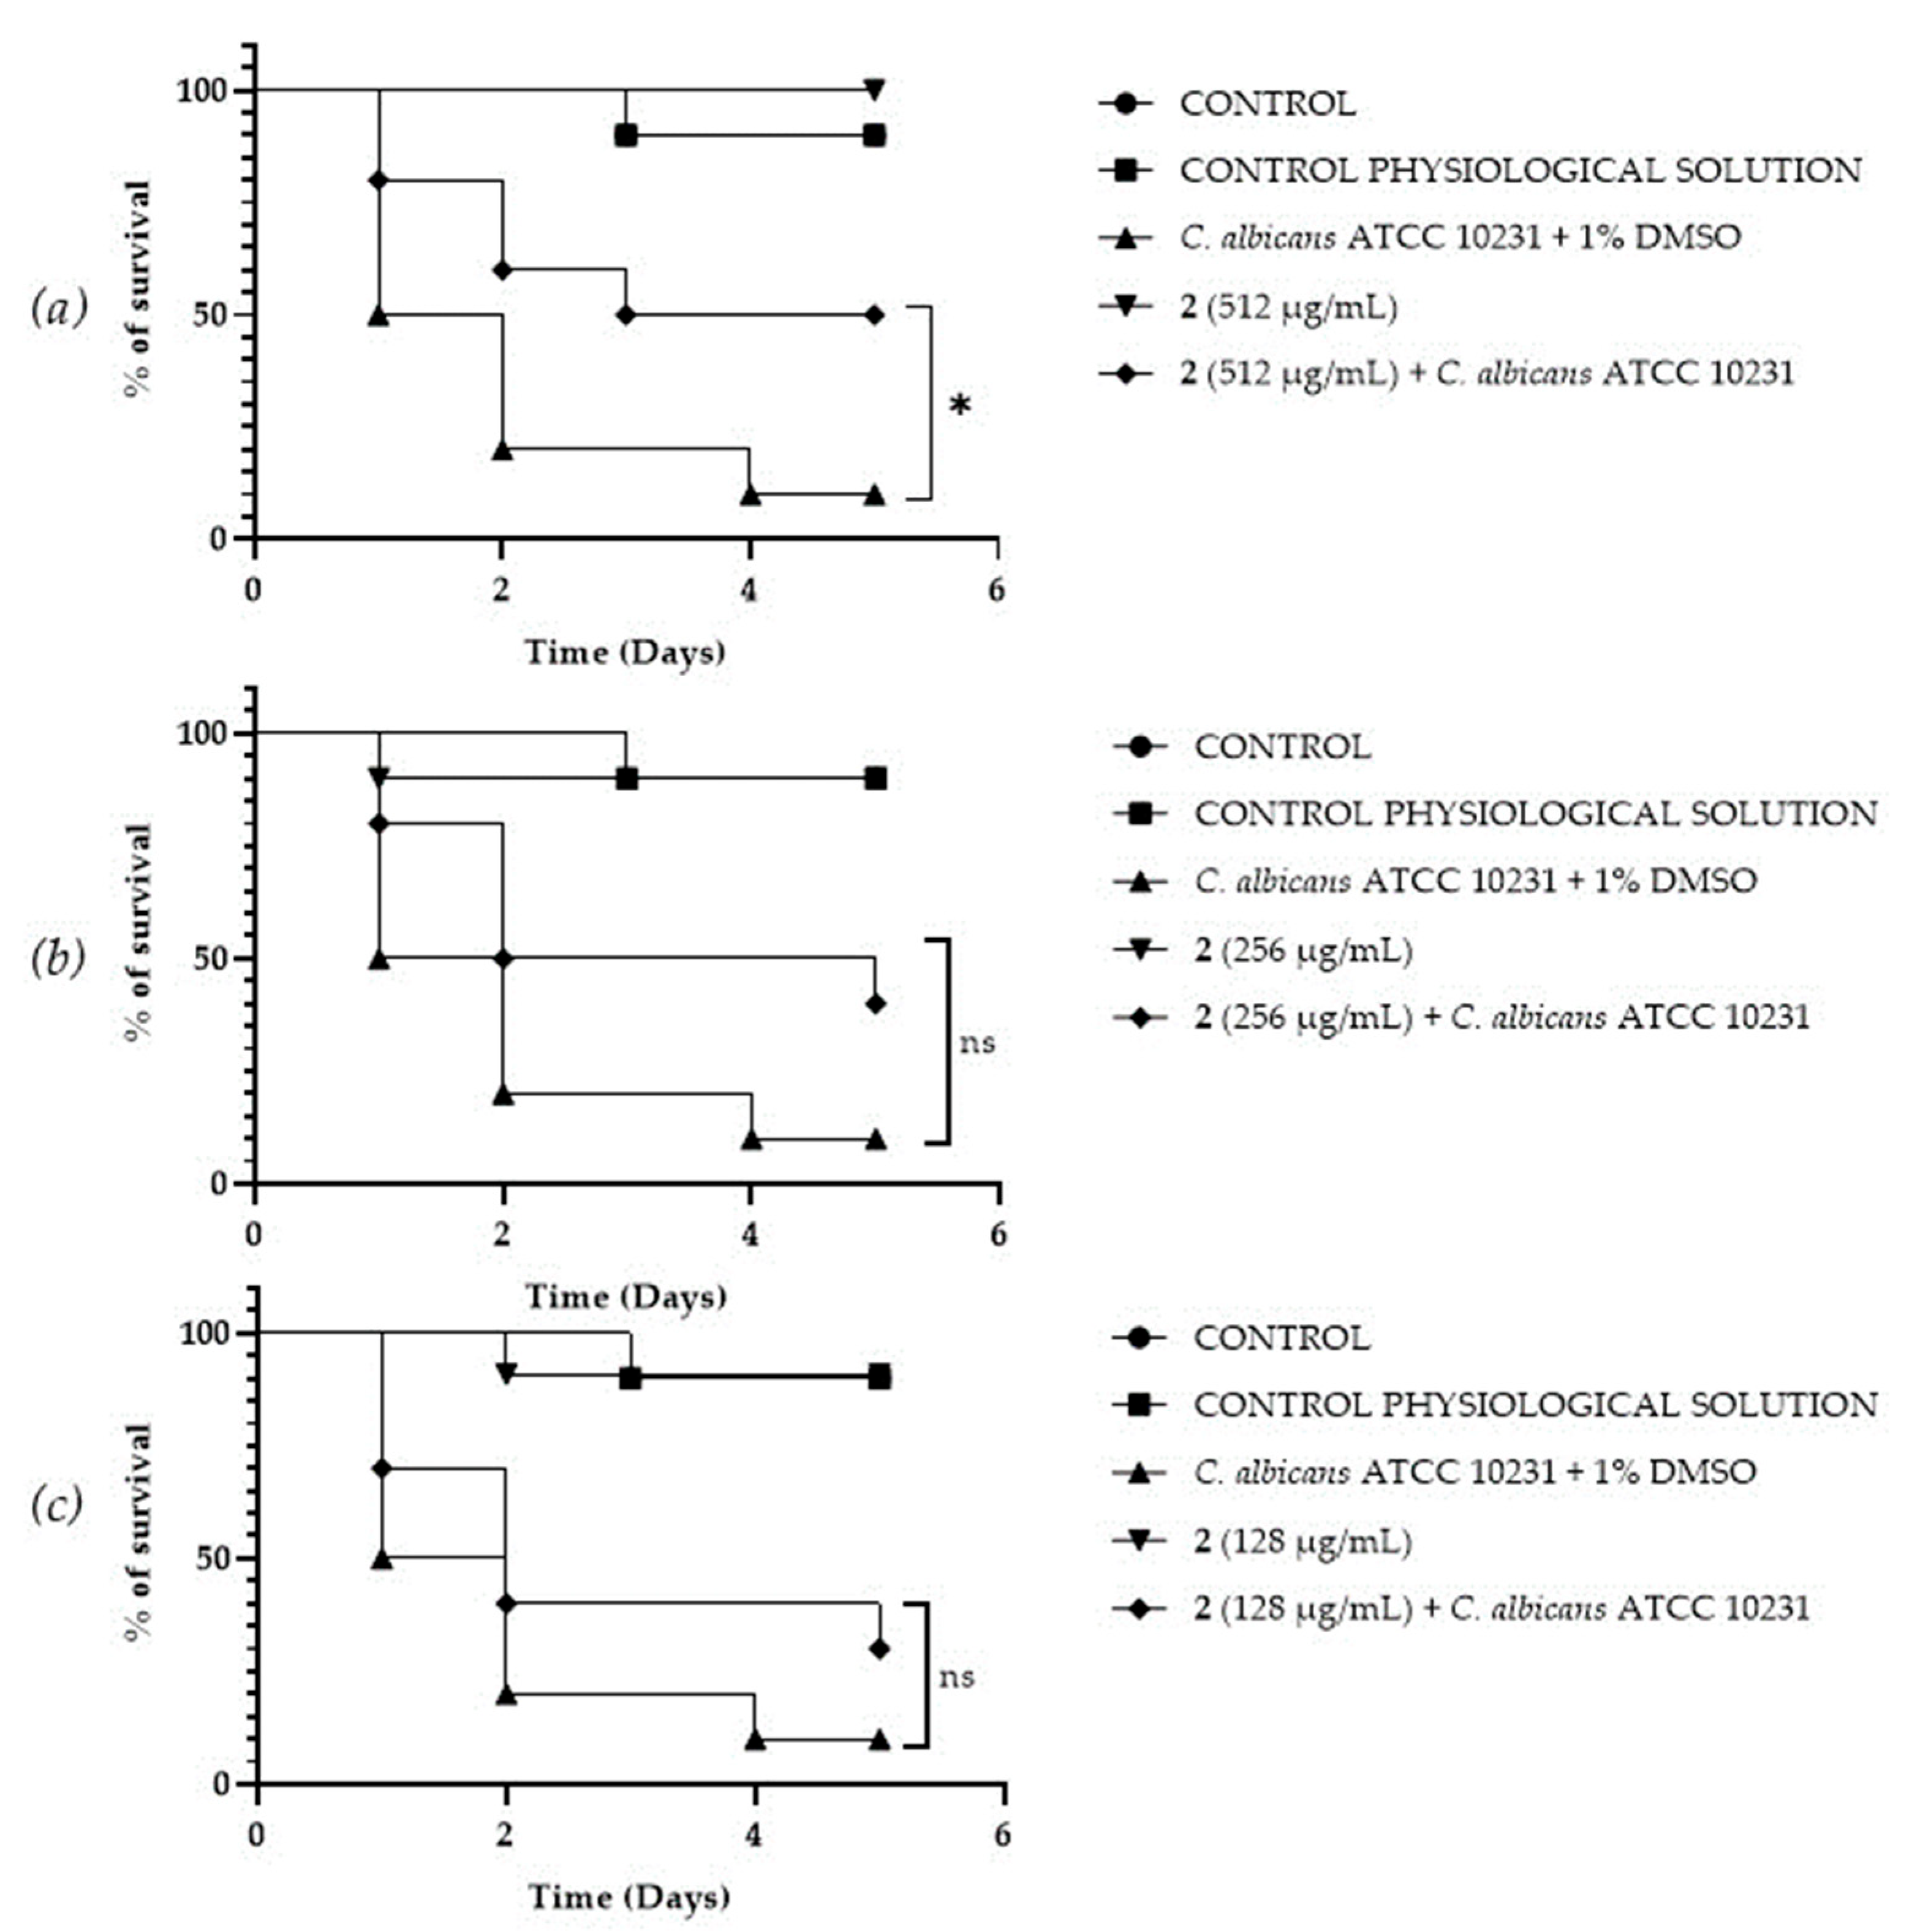
A Galleria mellonella survival assay was conducted to investigate the antifungal activity and toxicity of 1, 2 and DF3. G. mellonella larvae as an in vivo model were chosen due to the similarities between their immunity system and the mammalian one. Furthermore, G. mellonella larvae provide a well-established in vivo model known for its ease of handling and utilization. They are extensively employed to assess the antimicrobial efficacy of both chemical and natural compounds, aligning with the ethical guidelines of the 3Rs (Replacement, Reduction, and Refinement) in animal research [50]. Our findings suggest the ability of the extract and compounds to significantly increase the survival of G. mellonella larvae infected with C. albicans ATCC 10231. When treated with 256 μg/mL of 1, the infected larvae mortality rate was significantly (p value < 0.001) lower (20%) when compared with the control group mortality rate (90%) (Figure 8b). Compound 2 showed a significant result (p value < 0.05) only at 512 μg/mL, increasing the larvae survival rate up to 50% after 5 days, with respect to the infected control survival rate (10%) (Figure 9a). DF3 was found to be significantly active at all three tested concentrations, 2048 μg/mL (p value < 0.001), 1024 μg/mL (p value < 0.05), and 512 μg/mL (p value < 0.05), with respect to infected larvae control (Figure 10). At a concentration of 2048 μg/mL, DF3 decreased the mortality rate to 20%, with respect to the 90% mortality rate of the control. The concentrations of 1024 μg/mL and 512 μg/mL of DF3 decreased mortality to 60% and 70% with respect to the control. The literature data indicate that effective quantities in larvae are comparable to doses applicable in humans [65]. Therefore, considering the highest dose used in the larvae (2048 µg/mL), one might hypothesize that 3.4 g of DF3 should be administered to a 50 kg individual, while for the lowest effective extract dose (512 µg/mL), the amount to be administered to a 50 kg individual should be 0.850 g.
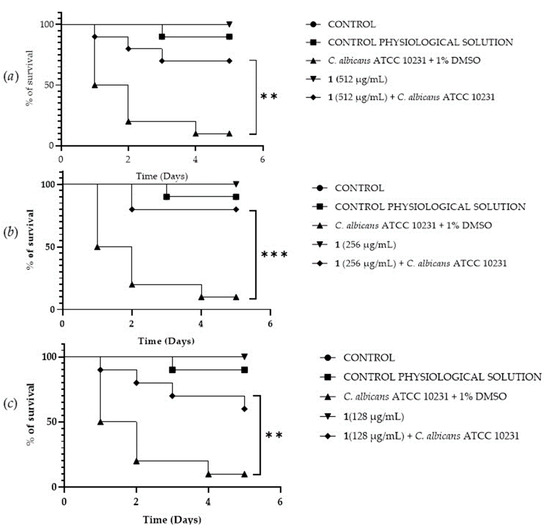
Figure 8.
Survival curves of G. mellonella larvae infected with C. albicans and treated with 512 µg/mL (a), 256 µg/mL (b), 128 µg/mL (c) of 1. The Mantel–Cox log-rank test was employed to assess the statistical significance with respect to the control. *** indicates p < 0.001 compared to the control; ** indicates p < 0.01 compared to the control.
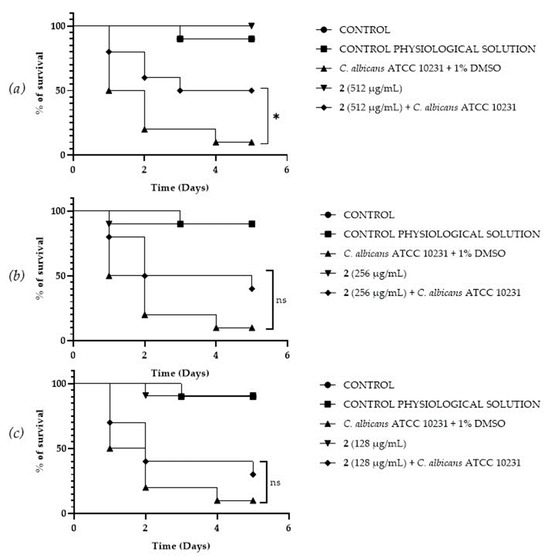
Figure 9.
Survival curves of G. mellonella larvae infected with C. albicans and treated with different concentrations (512 µg/mL (a), 256 µg/mL (b), 128 µg/mL (c)) of 2. The Mantel–Cox log-rank test was utilized to determine the statistical significance with respect to the control. * denotes p < 0.05 compared to the control; ns indicates not significant.
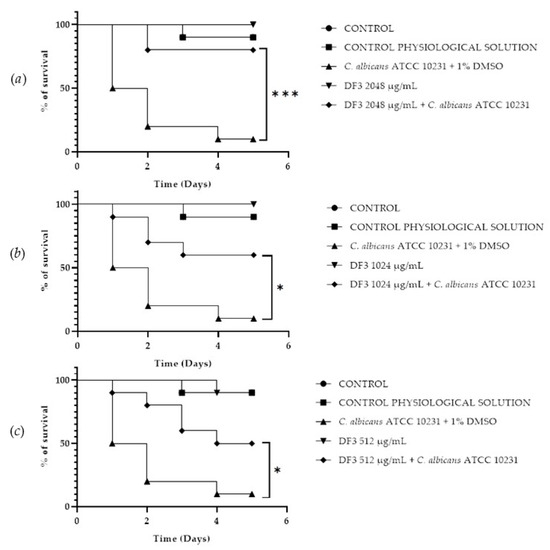
Figure 10.
Survival curves of G. mellonella larvae infected with C. albicans and subjected to treatment with 2048 µg/mL (a), 1024 µg/mL (b), and 512 µg/mL (c) of DF3. The Mantel–Cox log-rank test was employed to assess the statistical significance with respect to the control. *** indicates p < 0.001 compared to the control; * indicates p < 0.05 compared to the control.
4. Conclusions
The phytochemical analysis performed for the first time on different extracts of R. tinctoria led to the identification of several compounds, some of which are new for the species. In addition, the biological tests on some of these extracts and their components led to the discovery of new activities associated with them, with good efficacy values. Future research must surely focus on the investigation of the mechanisms of action of the active compounds and extracts for each biological assay reported in this work as well as on testing directly this species, their different extracts, and their singular components for other possible biological assays, given the relatively scarce data in the literature in this context.
Author Contributions
Conceptualization, A.D.S., G.S. and D.D.V.; methodology, G.S. and D.D.V.; investigation, C.F., D.R.F., F.C., R.M.N., L.S., R.P., P.D.M., D.R., S.D.G., A.D.S., G.B., G.S., S.G. and D.D.V.; resources: I.S.; writing—original draft preparation, C.F., D.R.F., F.C., I.S., P.D.M., S.D.G., D.R., G.B., R.M.N. and S.G.; writing—review and editing, L.S., R.P., A.D.S., G.S., S.G. and D.D.V.; supervision, D.D.V. and S.F.; project administration, S.F.; funding acquisition, D.D.V. and S.F. All authors have read and agreed to the published version of the manuscript.
Funding
This research received no external funding.
Institutional Review Board Statement
Not applicable.
Informed Consent Statement
Not applicable.
Data Availability Statement
Data are contained within the article.
Conflicts of Interest
The authors declare no conflicts of interest.
References
- Surridge, C. Symbiosis: Triple trouble with lichen. Science 2016, 353, 488–492. [Google Scholar] [CrossRef]
- Nascimbene, J.; Nimis, P.L.; Thüs, H. Lichens as bioindicators in freshwater ecosystems—Challenges and perspectives. Ann. Bot. 2013, 3, 45–50. [Google Scholar]
- Piovano, M.; Garbarino, J.A.; Giannini, F.A.; Correche, E.R.; Feresin, G.; Tapia, A.; Zacchino, S.; Enriz, R.D. Evaluation of antifungal and antibacterial activities of aromatic metabolites from lichens. Bol. Soc. Chil. Quím. 2002, 47, 235–240. [Google Scholar] [CrossRef]
- Tehler, A.; Dahlkid, U.; Eldenas, P.; Feige, G.B. The phylogeny and taxonomy of Macaronesian, European and Mediterranean Roccella (Roccellaceae, Arthoniales). Symb. Bot. Upsal. 2004, 34, 405–428. [Google Scholar]
- Ferron, S.; Berry, O.; Olivier-Jimenez, D.; Rouaud, I.; Boustie, J.; Lohézic-Le Dévéhat, F.; Poncet, R. Chemical diversity of five coastal Roccella species from mainland France, the Scattered Islands, and São Tomé and Príncipe. Plant Fung. Syst. 2020, 65, 247–260. [Google Scholar] [CrossRef]
- Bohnert, M.; Nützmann, H.-W.; Schroeckh, V.; Horn, F.; Dahse, H.-M.; Brakhage, A.A.; Hoffmeister, D. Cytotoxic and antifungal activities of melleolide antibiotics follow dissimilar structure–activity relationships. Phytochemistry 2014, 105, 101–108. [Google Scholar] [CrossRef]
- Tuan, N.T.; Dam, N.P.; Hie, M.V.; Trang, D.T.X.; Danh, L.T.; Men, T.T.; De, T.Q.; Bach, L.T.; Kanaori, K. Chemical Constituents of the Lichen Parmotrema Tinctorum and their Antifungal Activity. Chem. Nat. Compd. 2020, 56, 315–317. [Google Scholar] [CrossRef]
- Brakni, R.; Ahmed, M.A.; Burger, P.; Schwing, A.; Michel, G.; Pomares, C.; Hasseine, L.; Boyer, L.; Fernandez, X.; Landreau, A.; et al. UHPLC-HRMS/MS Based Profiling of Algerian Lichens and Their Antimicrobial Activities. Chem. Biodivers. 2018, 15, e1800031. [Google Scholar] [CrossRef]
- Conti, F.; Abbate, G.; Alessandrini, A.; Blasi, C. An Annotated Checklist of the Italian Vascular Flora; Palombi Editore: Rome, Italy, 2005. [Google Scholar]
- Pignatti, S. Flora d’Italia; Edagricole: Bologna, Italy, 1982. [Google Scholar]
- Melo, M.J. History of Natural Dyes in the Ancient Mediterranean Civilization. In Handbook of Natural Colorants Historical Development; Stevens, C., Bechtold, T., Manian, A., Pham, T., Eds.; Wiley: Hoboken, NJ, USA, 2023; pp. 3–26. [Google Scholar]
- Doherty, B.; Gabrieli, F.; Clementi, C.; Cardon, D.; Sgamellotti, A.; Brunetti, B.; Miliani, C. Surface enhanced Raman spectroscopic investigation of orchil dyed wool from Roccella tinctoria and Lasallia pustulata. J. Raman Spectrosc. 2014, 45, 723–729. [Google Scholar] [CrossRef]
- Lech, K.; Fornal, E. A Mass Spectrometry-Based Approach for Characterization of Red, Blue, and Purple Natural Dyes. Molecules 2020, 25, 3223. [Google Scholar] [CrossRef]
- Calà, E.; Benzi, M.; Gosetti, F.; Zanin, A.; Gulmini, M.; Idone, A.; Serafini, I.; Ciccola, A.; Curini, R.; Whitworth, I.; et al. Towards the identification of the lichen species in historical orchil dyes by HPLC-MS/MS. Microchem. J. 2019, 150, 104140. [Google Scholar] [CrossRef]
- Aceto, M.; Arrais, A.; Marsano, F.; Agostino, A.; Fenoglio, G.; Idone, A.; Gulmini, M. A diagnostic study on folium and orchil dyes with non-invasive and micro-destructive methods. Spectrochim. Acta Part A Mol. Biomol. Spectr. 2015, 142, 159–168. [Google Scholar] [CrossRef]
- Girardot, M.; Millot, M.; Hamion, G.; Billard, J.L.; Juin, C.; Ntoutoume, G.N.; Sol, V.; Mambu, L.; Imbert, C. Lichen polyphenolic compounds for the eradication of Candida albicans biofilms. Front. Cell. Infect. Microbiol. 2021, 11, 698883. [Google Scholar] [CrossRef] [PubMed]
- Chang, W.; Li, Y.; Zhang, L.; Cheng, A.; Liu, Y.; Lou, H. Retigeric acid B enhances the efficacy of azoles combating the virulence and biofilm formation of Candida albicans. Biol. Pharm. Bull. 2012, 35, 1794–1801. [Google Scholar] [CrossRef]
- Bucar, F.; Schneider, I.; Ögmundsdóttir, H.; Ingólfsdóttir, K. Anti-proliferative lichen compounds with inhibitory activity on 12 (S)-HETE production in human platelets. Phytomed. 2004, 11, 602–606. [Google Scholar] [CrossRef] [PubMed]
- Burlando, B.; Ranzato, E.; Volante, A.; Appendino, G.; Pollastro, F.; Verotta, L. Antiproliferative effects on tumour cells and promotion of keratinocyte wound healing by different lichen compounds. Planta Med. 2009, 75, 607–613. [Google Scholar] [CrossRef] [PubMed]
- Mohammadi, M.; Bagheri, L.; Badreldin, A.; Fatehi, P.; Pakzad, L.; Suntres, Z.; van Wijnen, A.J. Biological effects of gyrophoric acid and other lichen derived metabolites, on cell proliferation, apoptosis and cell signaling pathways. Chem. Biol. Interact. 2022, 351, 109768. [Google Scholar] [CrossRef] [PubMed]
- Qi, W.; Lu, C.; Huang, H.; Zhang, W.; Song, S.; Liu, B. (+)-Usnic Acid Induces ROS-Dependent Apoptosis via Inhibition of Mitochondria Respiratory Chain Complexes and Nrf2 Expression in Lung Squamous Cell Carcinoma. Int. J. Mol. Sci. 2020, 21, 876, Erratum in Int. J. Mol. Sci. 2020, 21, 2915. [Google Scholar] [CrossRef]
- Tripathi, A.H.; Negi, N.; Gahtori, R.; Kumari, A.; Joshi, P.; Tewari, L.M.; Joshi, Y.; Bajpai, R.; Upreti, D.K.; Upadhyay, S.K. A review of anti-cancer and related properties of lichen-extracts and metabolites. Anticancer Agents Med. Chem. 2022, 22, 115–142. [Google Scholar]
- Lopes, J.P.; Lionakis, M.S. Pathogenesis and virulence of Candida albicans. Virulence 2022, 13, 89–121. [Google Scholar] [CrossRef]
- Mukherjee, P.K.; Chandra, J.; Kuhn, D.M.; Ghannoum, M.A. Mechanism of Fluconazole Resistance in Candida albicans Biofilms: Phase-Specific Role of Efflux Pumps and Membrane Sterols. Infect. Immun. 2003, 71, 4333–4340. [Google Scholar] [CrossRef]
- Pereira, R.; dos Santos Fontenelle, R.O.; de Brito, E.H.S.; de Morais, S.M. Biofilm of Candida albicans: Formation, regulation and resistance. J. Appl. Microbiol. 2021, 131, 11–22. [Google Scholar] [CrossRef]
- Pandolfi, F.; D’Acierno, F.; Bortolami, M.; De Vita, D.; Gallo, F.; De Meo, A.; Di Santo, R.; Costi, R.; Simonetti, G.; Scipione, L. Searching for new agents active against Candida albicans biofilm: A series of indole derivatives, design, synthesis and biological evaluation. Eur. J. Med. Chem. 2019, 165, 93–106. [Google Scholar] [CrossRef] [PubMed]
- Atanasov, A.G.; Zotchev, S.B.; Dirsch, V.M.; The International Natural Product Sciences Taskforce; Supuran, C.T. Natural products in drug discovery: Advances and opportunities. Nat. Rev. Drug Discov. 2021, 20, 200–216. [Google Scholar] [CrossRef] [PubMed]
- De Vita, D.; Messore, A.; Toniolo, C.; Frezza, C.; Scipione, L.; Bertea, C.M.; Micera, M.; Di Sarno, V.; Madia, V.N.; Pindinello, I.; et al. Towards a new application of amaranth seed oil as an agent against Candida albicans. Nat. Prod. Res. 2021, 35, 4621–4626. [Google Scholar] [CrossRef] [PubMed]
- Fernandes Correia, A.; Silveira, D.; Fonseca-Bazzo, Y.M.; Oliveira Magalhães, P.; Fagg, C.W.; da Silva, E.C.; Gomes, S.M.; Gandolfi, L.; Pratesi, R.; de Medeiros Nóbrega, Y.C. Activity of crude extracts from Brazilian cerrado plants against clinically relevant Candida species. BMC Complement. Altern. Med. 2016, 16, 203. [Google Scholar]
- Setzer, M.C.; Setzer, W.N.; Jackes, B.R.; Gentry, G.A.; Moriarity, D.M. The Medicinal Value of Tropical Rainforest Plants from Paluma, North Queensland, Australia. Pharma. Biol. 2001, 39, 67–78. [Google Scholar] [CrossRef]
- Millot, M.; Girardot, M.; Dutreix, L.; Mambu, L.; Imbert, I. Antifungal and Anti-Biofilm Activities of Acetone Lichen Extracts against Candida albicans. Molecules 2017, 22, 651. [Google Scholar] [CrossRef] [PubMed]
- Hanuš, L.O.; Temin, M.; Dembitsky, V.M. Antibacterial and Antifungal Activities of Some Phenolic Metabolites Isolated from the Lichenized Ascomycete Ramalina lacera. Nat. Prod. Comm. 2008, 3, 233–236. [Google Scholar] [CrossRef]
- Mallavadhani, U.V.; Boddu, R.; Rathod, B.B.; Setty, P.R. Stereoselective synthesis of the lichen metabolite, (+) montagnetol and its congeners as antimicrobial agents. Synth. Comm. 2018, 48, 2992–2999. [Google Scholar] [CrossRef]
- Basile, A.; Rigano, D.; Loppi, S.; Di Santi, A.; Nebbioso, A.; Sorbo, S.; Conte, B.; Paoli, L.; De Ruberto, F.; Molinari, A.M.; et al. Antiproliferative, Antibacterial and Antifungal Activity of the Lichen Xanthoria parietina and Its Secondary Metabolite Parietin. Int. J. Mol. Sci. 2015, 16, 7861–7875. [Google Scholar] [CrossRef]
- Mitrović, T.; Stamenković, S.; Cvetković, V.; Tošić, S.; Stanković, M.; Radojević, I.; Stefanović, O.; Čomić, L.; Đačić, D.; Ćurčić, M.; et al. Antioxidant, Antimicrobial and Antiproliferative Activities of Five Lichen Species. Int. J. Mol. Sci. 2011, 12, 5428–5448. [Google Scholar] [CrossRef]
- De Jesus, E.; Hur, J.S.; Notarte, K.I.R.; Santiago, K.A.A.; Dela Cruz, T.E.E. Antibacterial, antioxidant, and cytotoxic activities of the corticolous lichens Canoparmelia aptata, Pannaria sp., and Parmotrema gardneri collected from Mt. Banahaw, Quezon, Philippines. Banahaw Quezon Philipp. Curr. Res. Environ. Appl. Mycol. 2016, 6, 173–183. [Google Scholar] [CrossRef]
- Kosanić, M.; Ristić, S.; Stanojković, T.; Manojlović, N.; Ranković, B. Extracts of five Cladonia lichens as sources of biologically active compounds. Farmacia 2018, 66, 644–651. [Google Scholar] [CrossRef]
- Ozturk, S.; Erkisa, M.; Oran, S.; Ulukaya, E.; Celikler, S.; Ari, F. Lichens exerts an anti-proliferative effect on human breast and lung cancer cells through induction of apoptosis. Drug Chem. Toxicol. 2021, 44, 259–267. [Google Scholar] [CrossRef] [PubMed]
- Mishra, T.; Shukla, S.; Meena, S.; Singh, R.; Pal, M.; Upreti, D.K.; Datta, D. Isolation and identification of cytotoxic compounds from a fruticose lichen Roccella montagnei, and it’s in silico docking study against CDK-10. Rev. Bras. Farmacogn. 2017, 27, 724–728. [Google Scholar] [CrossRef]
- Di Sotto, A.; Locatelli, M.; Macone, A.; Toniolo, C.; Cesa, S.; Carradori, S.; Eufemi, M.; Mazzanti, G.; Di Giacomo, S. Hypoglycemic, antiglycation, and cytoprotective properties of a phenol-rich extract from waste peel of Punica granatum L. var. Dente di Cavallo DC2. Molecules. 2019, 27, 3103. [Google Scholar] [CrossRef] [PubMed]
- Grubman, S.A.; Perrone, R.D.; Lee, D.W.; Murray, S.L.; Rogers, L.C.; Wolkoff, L.I.; Mulberg, A.E.; Cherington, V.; Jefferson, D.M. Regulation of intracellular pH by immortalized human intrahepatic biliary epithelial cell lines. Am. J. Physiol. 1994, 266, 1060–1070. [Google Scholar] [CrossRef] [PubMed]
- Di Sotto, A.; Gullì, M.; Acquaviva, A.; Tacchini, M.; Di Simone, S.C.; Chiavaroli, A.; Recinella, L.; Leone, S.; Brunetti, L.; Orlando, G.; et al. Phytochemical and pharmacological profiles of the essential oil from the inflorescences of the Cannabis sativa L. Ind. Crops Prod. 2022, 183, 114980. [Google Scholar] [CrossRef]
- Di Sotto, A.; Di Giacomo, S.; Rubini, E.; Macone, A.; Gulli, M.; Mammola, C.L.; Eufemi, M.; Mancinelli, R.; Mazzanti, G. Modulation of stat3 signaling, cell redox defenses and cell cycle checkpoints by β-caryophyllene in cholangiocarcinoma cells: Possible mechanisms accounting for doxorubicin chemosensitization and chemoprevention. Cells 2020, 9, 858. [Google Scholar] [CrossRef] [PubMed]
- ISO 10993-5:2009; Biological Evaluation of Medical Devices Part 5: Tests for Invitro Cytotoxicity. 2nd ed. International Organization for Standardization/ANSI: Geneva, Switzerland, 2009.
- CLSI M27-A3(28); Reference Method for Broth Dilution Antifungal Susceptibility Testing of Yeasts. 3rd ed. Approved Standard. Clinical and Laboratory Standards Institute: Wayne, PA, USA, 2008.
- Clinical and Laboratory Standards Institute (CLSI). Reference Method for Broth Dilution Antifungal Susceptibility Testing of Yeasts—Fourth Informational Supplement, Document M27-A3; Clinical and Laboratory Standards Institute: Wayne, PA, USA, 2012. [Google Scholar]
- Bandara, H.M.H.N.; Cheung, B.P.K.; Watt, R.M.; Jin, L.J.; Samaranayake, L.P. Secretory products of Escherichia coli biofilm modulate Candida biofilm formation and hyphal development. J. Investig. Clin. Dent. 2013, 4, 186–199. [Google Scholar] [CrossRef]
- Matsubara, V.H.; Wang, Y.; Bandara, H.M.; Mayer, M.P.; Samaranayake, L.P. Probiotic lactobacilli inhibit early stages of Candida albicans biofilm development by reducing their growth, cell adhesion, and filamentation. Appl. Microbiol. Biotechnol. 2016, 100, 6415–6426. [Google Scholar] [CrossRef]
- Pierce, C.G.; Chaturvedi, A.K.; Lazzell, A.L.; Powell, A.T.; Saville, S.P.; McHardy, S.F.; Lopez-Ribot, J.L. A novel small molecule inhibitor of Candida albicans biofilm formation, filamentation and virulence with low potential for the development of resistance. NPJ Biofilms Microbiomes. 2015, 1, 15012. [Google Scholar] [CrossRef]
- Ourabah, A.; Atmani-Kilani, D.; Debbache-Benaida, N.; Kolesova, O.; Azib, L.; Yous, F.; Benloukil, M.; Botta, B.; Atmani, D.; Simonetti, G. Anti-Candida albicans biofilm activity of extracts from two selected indigenous Algerian plants: Clematis flammula and Fraxinus angustifolia. J. Herb. Med. 2020, 20, 100319. [Google Scholar] [CrossRef]
- Simonetti, G.; Palocci, C.; Valletta, A.; Kolesova, O.; Chronopoulou, L.; Donati, L.; Di Nitto, A.; Brasili, E.; Tomai, P.; Gentili, A.; et al. Anti-Candida biofilm activity of pterostilbene or crude extract from non-fermented grape pomace entrapped in biopolymeric nanoparticles. Molecules 2019, 24, 2070. [Google Scholar] [CrossRef]
- Cairone, F.; Simonetti, G.; Orekhova, A.; Casadei, M.A.; Zengin, G.; Cesa, S. Health potential of clery strawberries: Enzymatic inhibition and anti-Candida activity evaluation. Molecules 2021, 26, 1731. [Google Scholar] [CrossRef]
- Shukla, V.; Joshi, G.P.; Rawat, M.S.M. Lichens as a potential natural source of bioactive compounds: A review. Phytochem. Rev. 2010, 9, 303–314. [Google Scholar] [CrossRef]
- Mendili, M.; Bannour, M.; Araújo, M.E.M.; Seaward, M.R.; Khadhri, A. Lichenochemical screening and antioxidant capacity of four Tunisian lichen species. Chem. Biodivers. 2021, 18, e2000735. [Google Scholar] [CrossRef] [PubMed]
- Smitha, K.C.; Garampalli, R.H. Evaluation of phytochemicals and in vitro antioxidant activity of Ramalina pacifica and Roccella montagnei. J. Pharmacogn. Phytochem. 2016, 5, 270–274. [Google Scholar]
- Aydin, S.; Kinalioğlu, K. Comparison of antioxidant activity of Roccella phycopsis Ach.(Roccellaceae) and Flavoparmelia caperata L. Hale (Parmeliaceae) lichens. Düzce Üniv. Bilim Teknol. Derg. 2016, 4, 837–847. [Google Scholar]
- Basset, J.F.; Leslie, C.; Hamprecht, D.; White, A.J.; Barrett, A.G. Studies on the resorcylates: Biomimetic total syntheses of (+)-montagnetol and (+)-erythrin. Tetrahedron Lett. 2010, 51, 783–785. [Google Scholar] [CrossRef]
- Mohapatra, D.K.; Maity, S.; Banoth, S.; Gonnade, R.G.; Yadav, J. S Total synthesis of isocladosporin and 3-epi-isocladosporin. Tetrahedron Lett. 2016, 57, 53–55. [Google Scholar] [CrossRef]
- Duong, H.T.; Bui, H.X. Chemical constituents of the lichen Roccella sinensis growing in Binh Thuan province. VNUHCM J. Nat. Sci. 2018, 2, 63–67. [Google Scholar] [CrossRef]
- Roser, L.A.; Erkoc, P.; Ingelfinger, R.; Henke, M.; Ulshöfer, T.; Schneider, A.K.; Lau, V.; Geisslinger, G.; Schmitt, I.; Fürst, R.; et al. Lecanoric acid mediates anti-proliferative effects by an M phase arrest in colon cancer cells. Biomed. Pharmacother. 2022, 148, 112734. [Google Scholar] [CrossRef]
- Liu, B.-L.; Hu, X.; He, H.-L.; Qiu, L.; Li, Y.-Z.; Ding, W.-B. A new epicatechin glucopyranoside derivative from Styrax suberifolius. Nat. Prod. Res. 2020, 34, 1977–1983. [Google Scholar] [CrossRef]
- Thadhani, V.M.; Choudhary, M.I.; Khan, S.; Karunaratne, V. Antimicrobial and toxicological activities of some depsides and depsidones. J. Natn. Sci. Found. Sri Lanka 2012, 40, 43–48. [Google Scholar] [CrossRef]
- Simonetti, G.; Passariello, C.; Rotili, D.; Mai, A.; Garaci, E.; Palamara, A.T. Histone deacetylase inhibitors may reduce pathogenicity and virulence in Candida albicans. FEMS Yeast Res. 2007, 7, 1371–1380. [Google Scholar] [CrossRef]
- Serrano, I.; Verdial, C.; Tavares, L.; Oliveira, M. The virtuous Galleria mellonella model for scientific experimentation. Antibiotics. 2023, 12, 505. [Google Scholar] [CrossRef]
- Ignasiak, K.; Maxwell, A. Galleria mellonella (greater wax moth) larvae as a model for antibiotic susceptibility testing and acute toxicity trials. BMC Res Notes. 2017, 10, 428. [Google Scholar] [CrossRef]


Disclaimer/Publisher’s Note: The statements, opinions and data contained in all publications are solely those of the individual author(s) and contributor(s) and not of MDPI and/or the editor(s). MDPI and/or the editor(s) disclaim responsibility for any injury to people or property resulting from any ideas, methods, instructions or products referred to in the content. |
© 2024 by the authors. Licensee MDPI, Basel, Switzerland. This article is an open access article distributed under the terms and conditions of the Creative Commons Attribution (CC BY) license (https://creativecommons.org/licenses/by/4.0/).