
Porous Chitosan/Hydroxyapatite Composite Microspheres for Vancomycin Loading and Releasing


Abstract
1. Introduction
2. Materials and Methods
2.1. Materials
2.2. Synthesis of the Porous Chitosan/Hydroxyapatite Composite Microspheres
2.3. Characterization of the Chi-HAp
2.3.1. Morphology Observations
2.3.2. X-ray Diffraction (XRD)
2.3.3. Functional Group Identification
2.3.4. Specific Surface Area (SSA) and Porosity
2.3.5. Thermal Analysis
2.4. Drug Loading and Releasing Kinetics
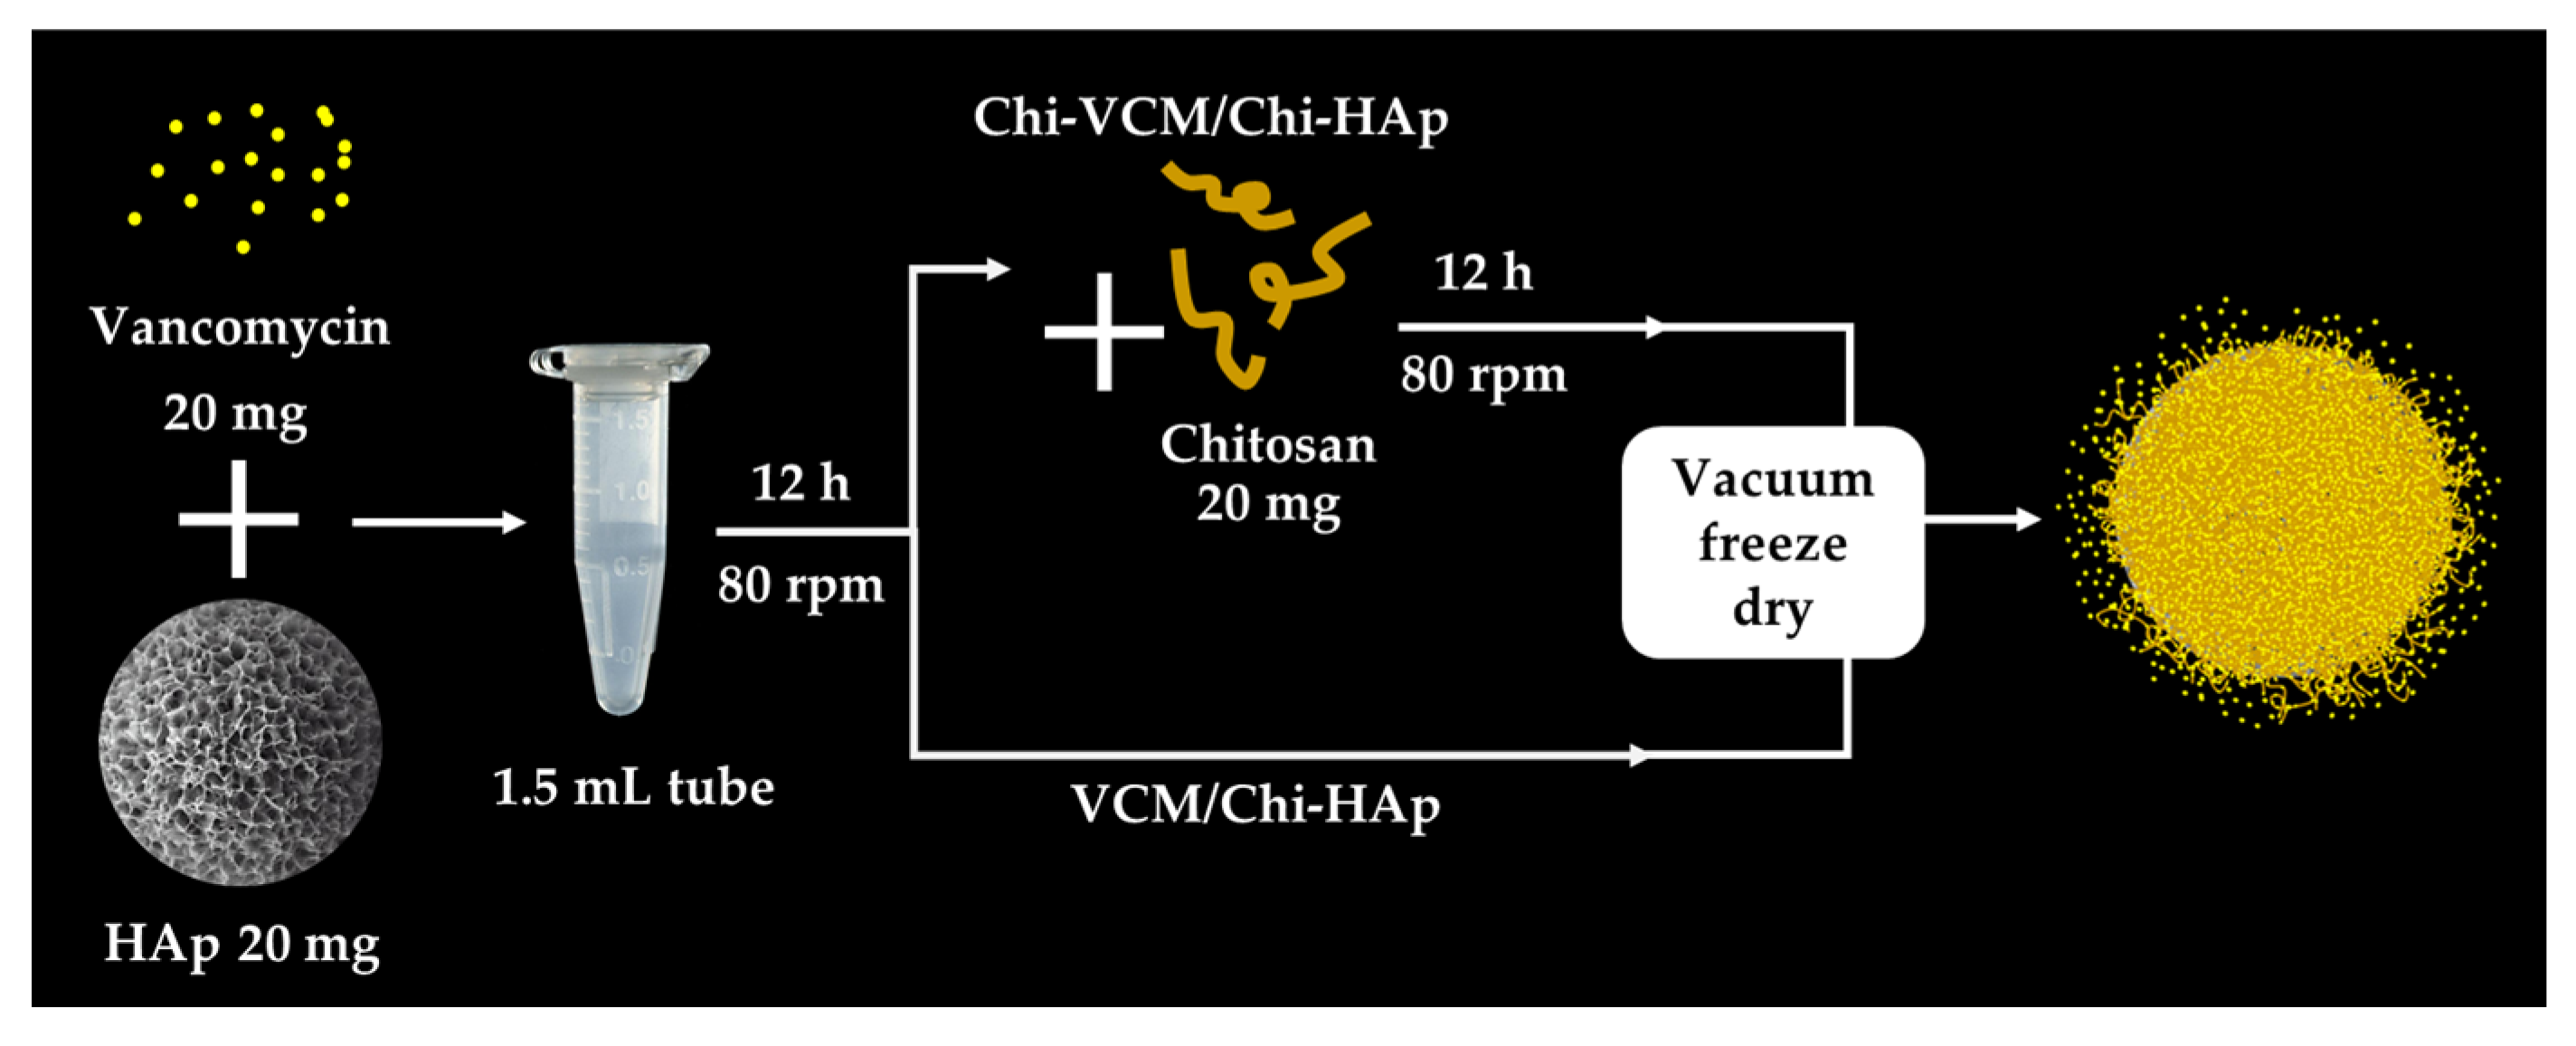
2.4.1. Loading the VCM on the Chi-HAp and the VCM Content Determination
2.4.2. In Vitro Release of VCM from the VCM/Chi-HAp
2.5. Antibacterial Assessment
3. Results
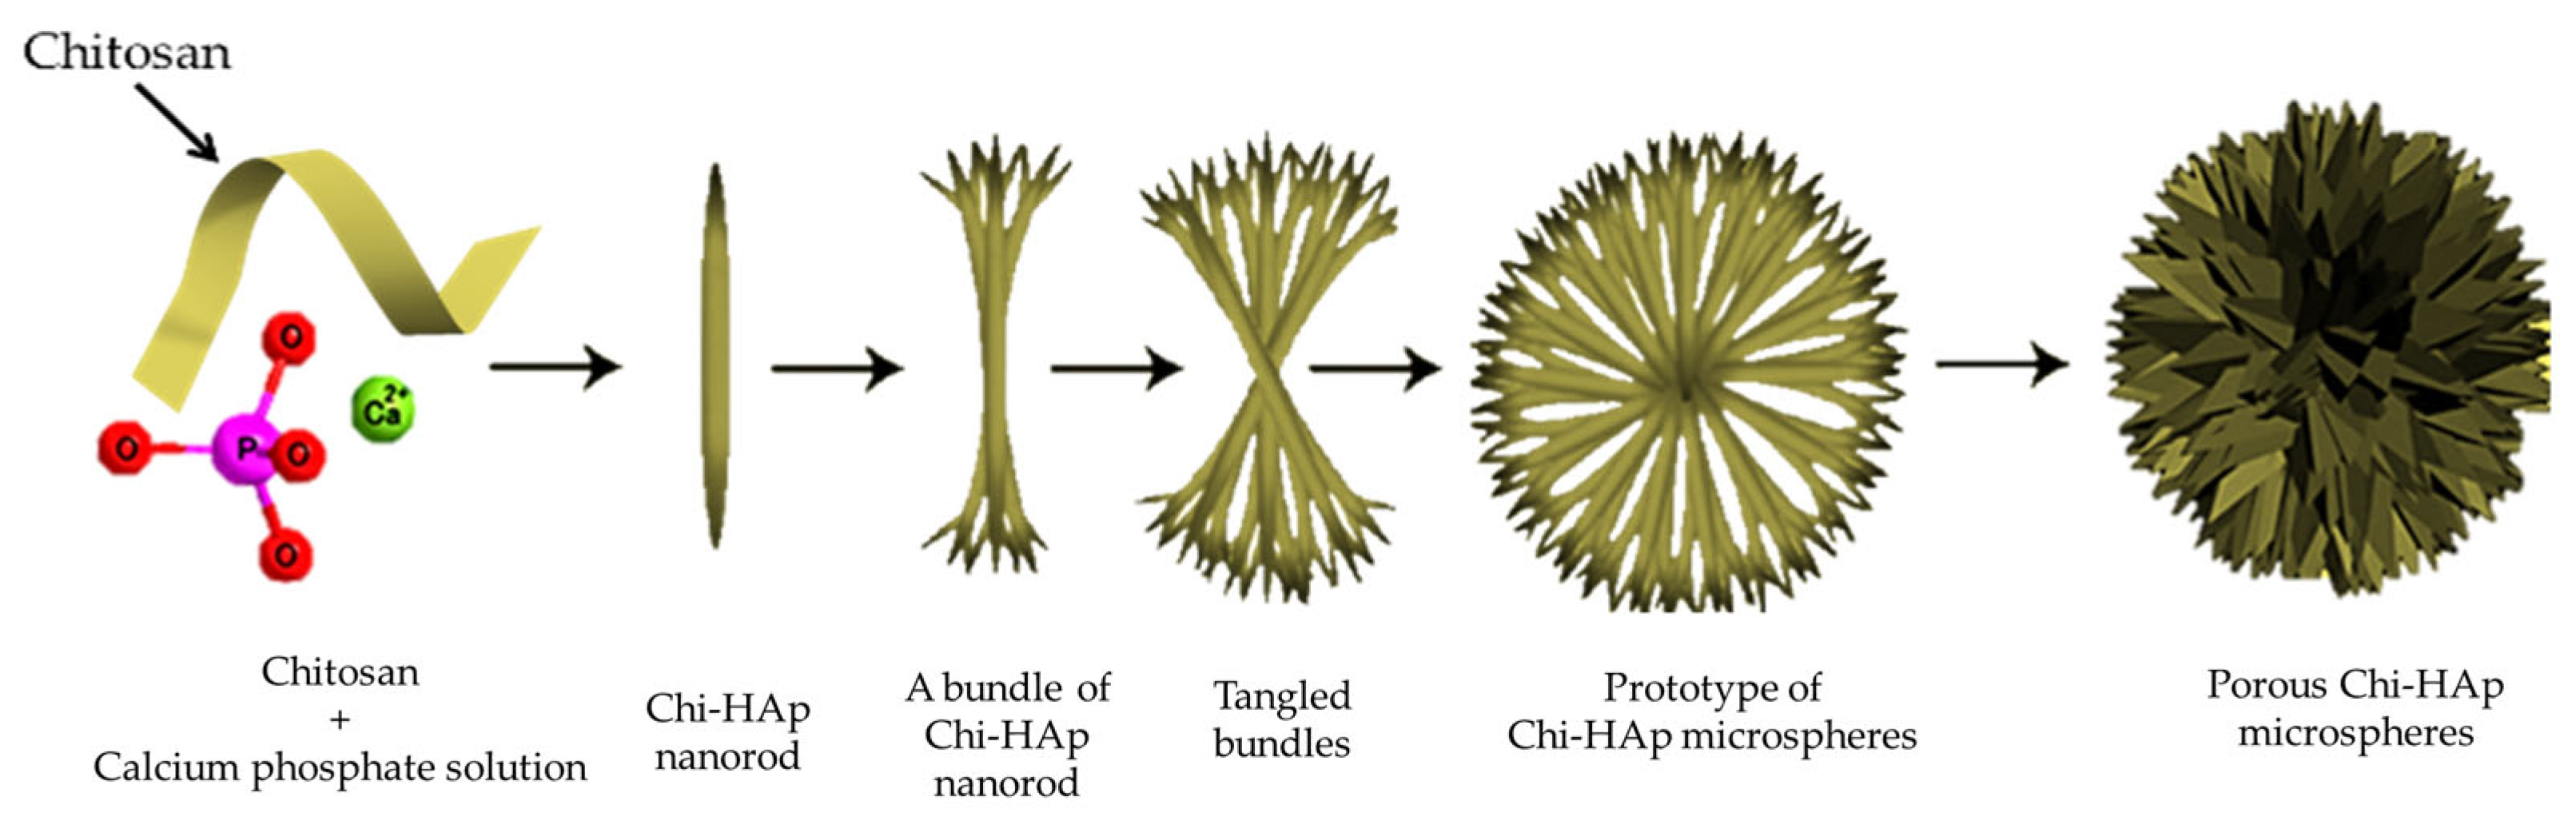
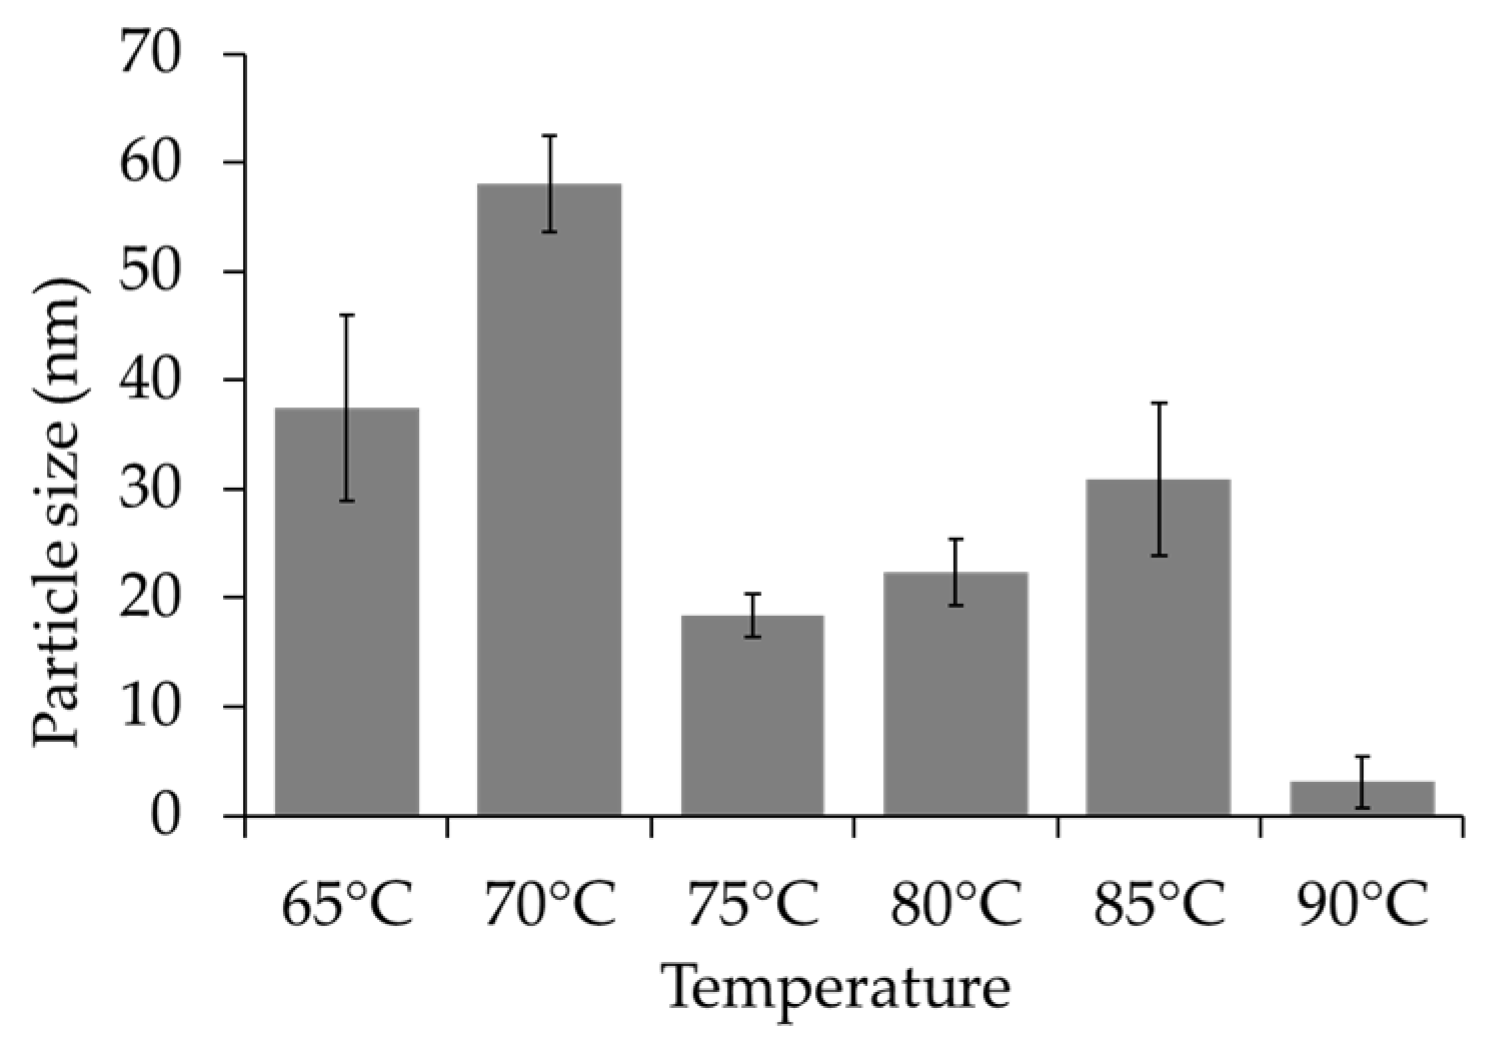
3.1. Fabrication of the Porous Chi-HAp Powders via a Hydrothermal Method
The Influence of Temperature on the Synthesis Process of the Chi-HAp Composite Microspheres
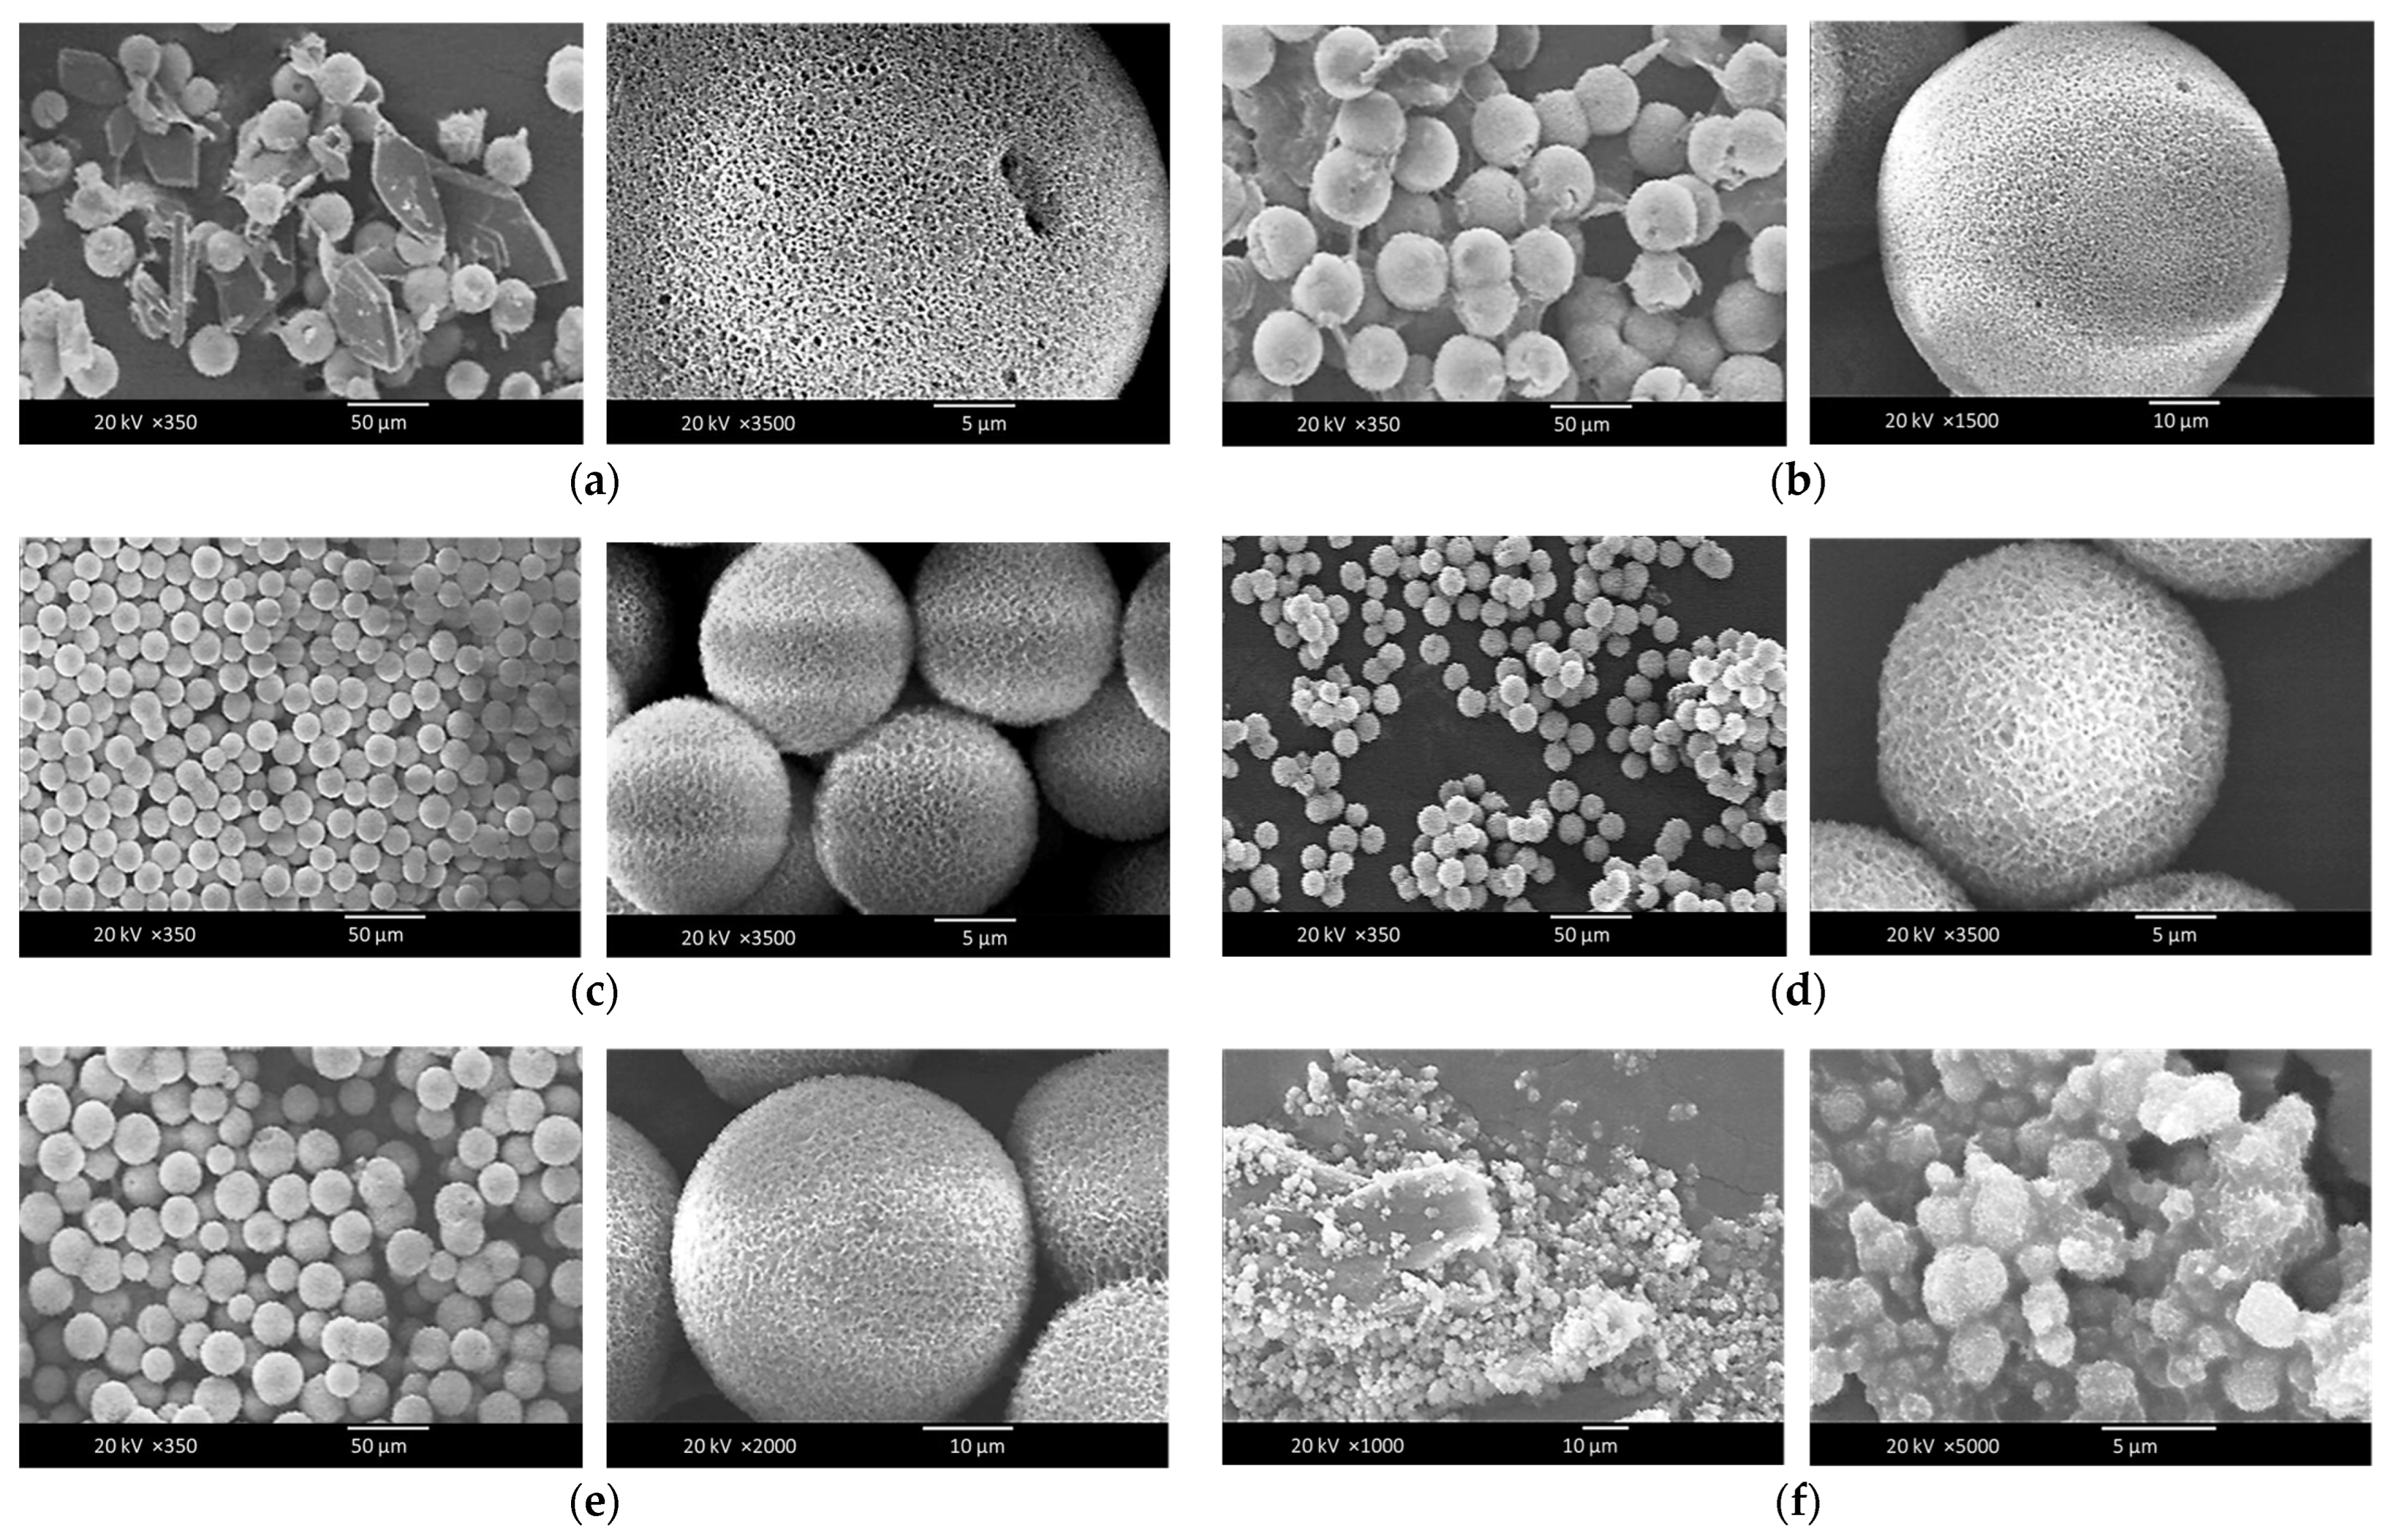
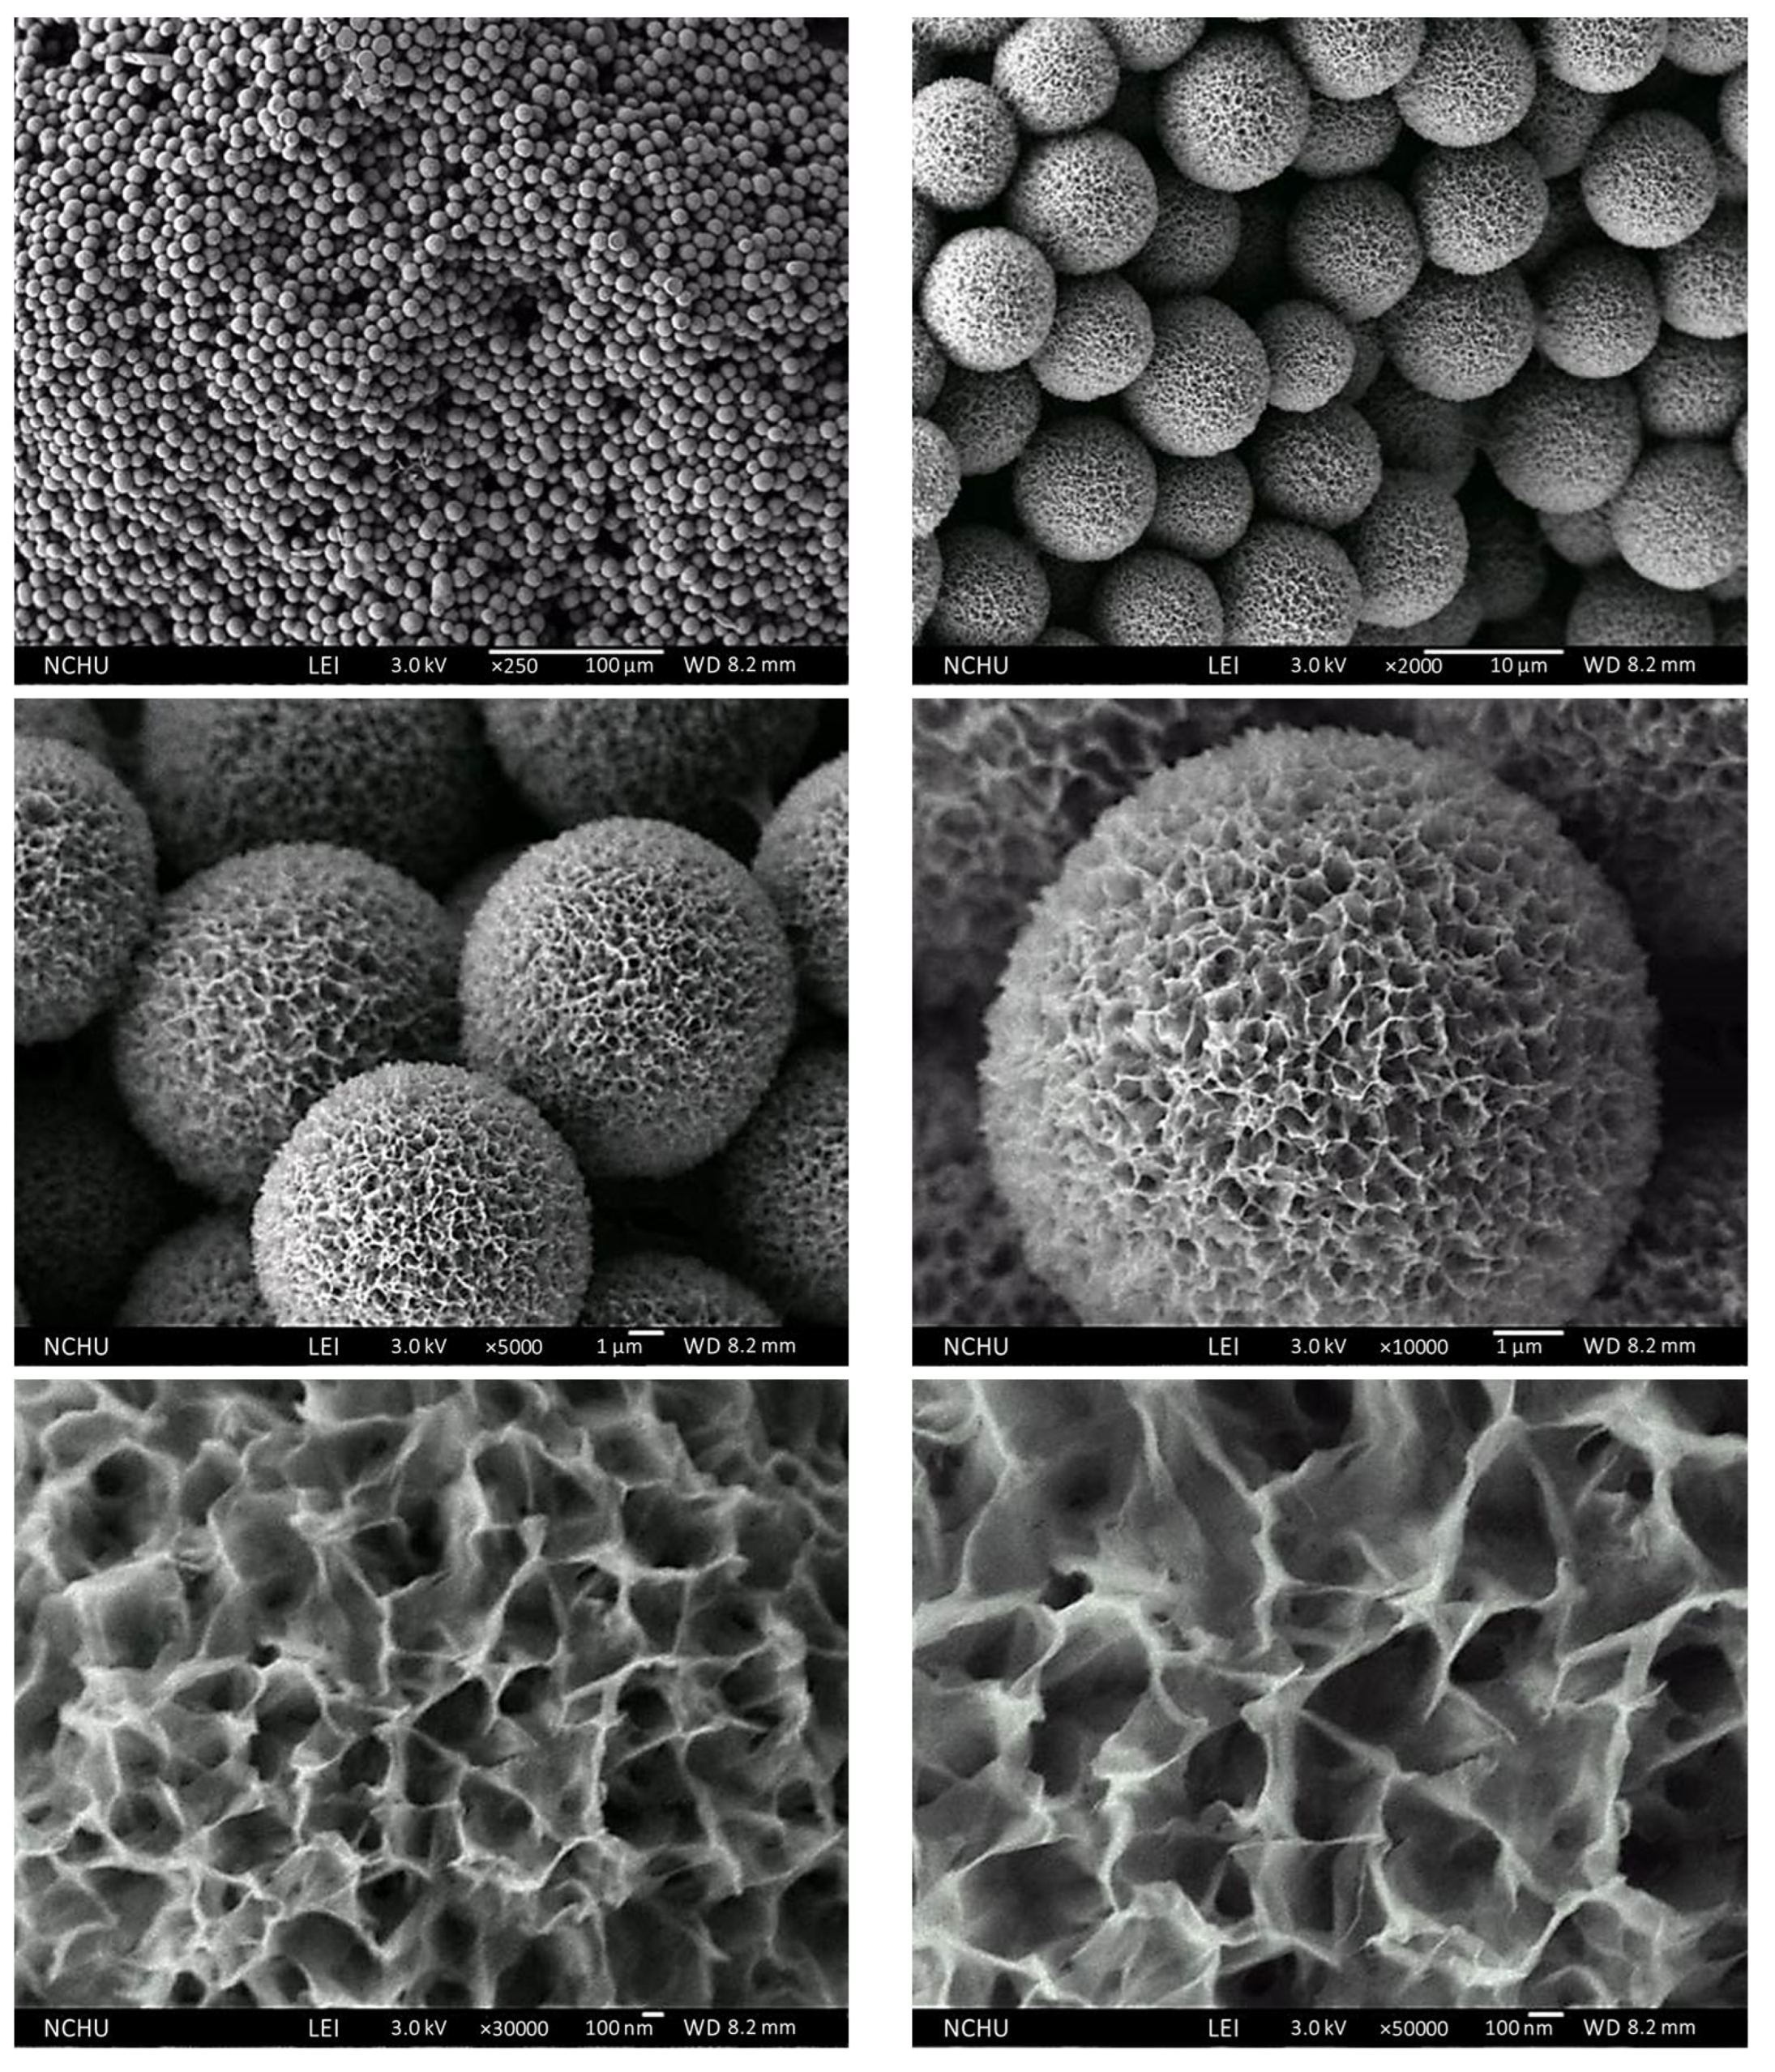
3.2. Characterization of the Surface Morphologies and Compositions of the Chi-HAp Composite Microspheres through FE-SEM and EDS Analyses
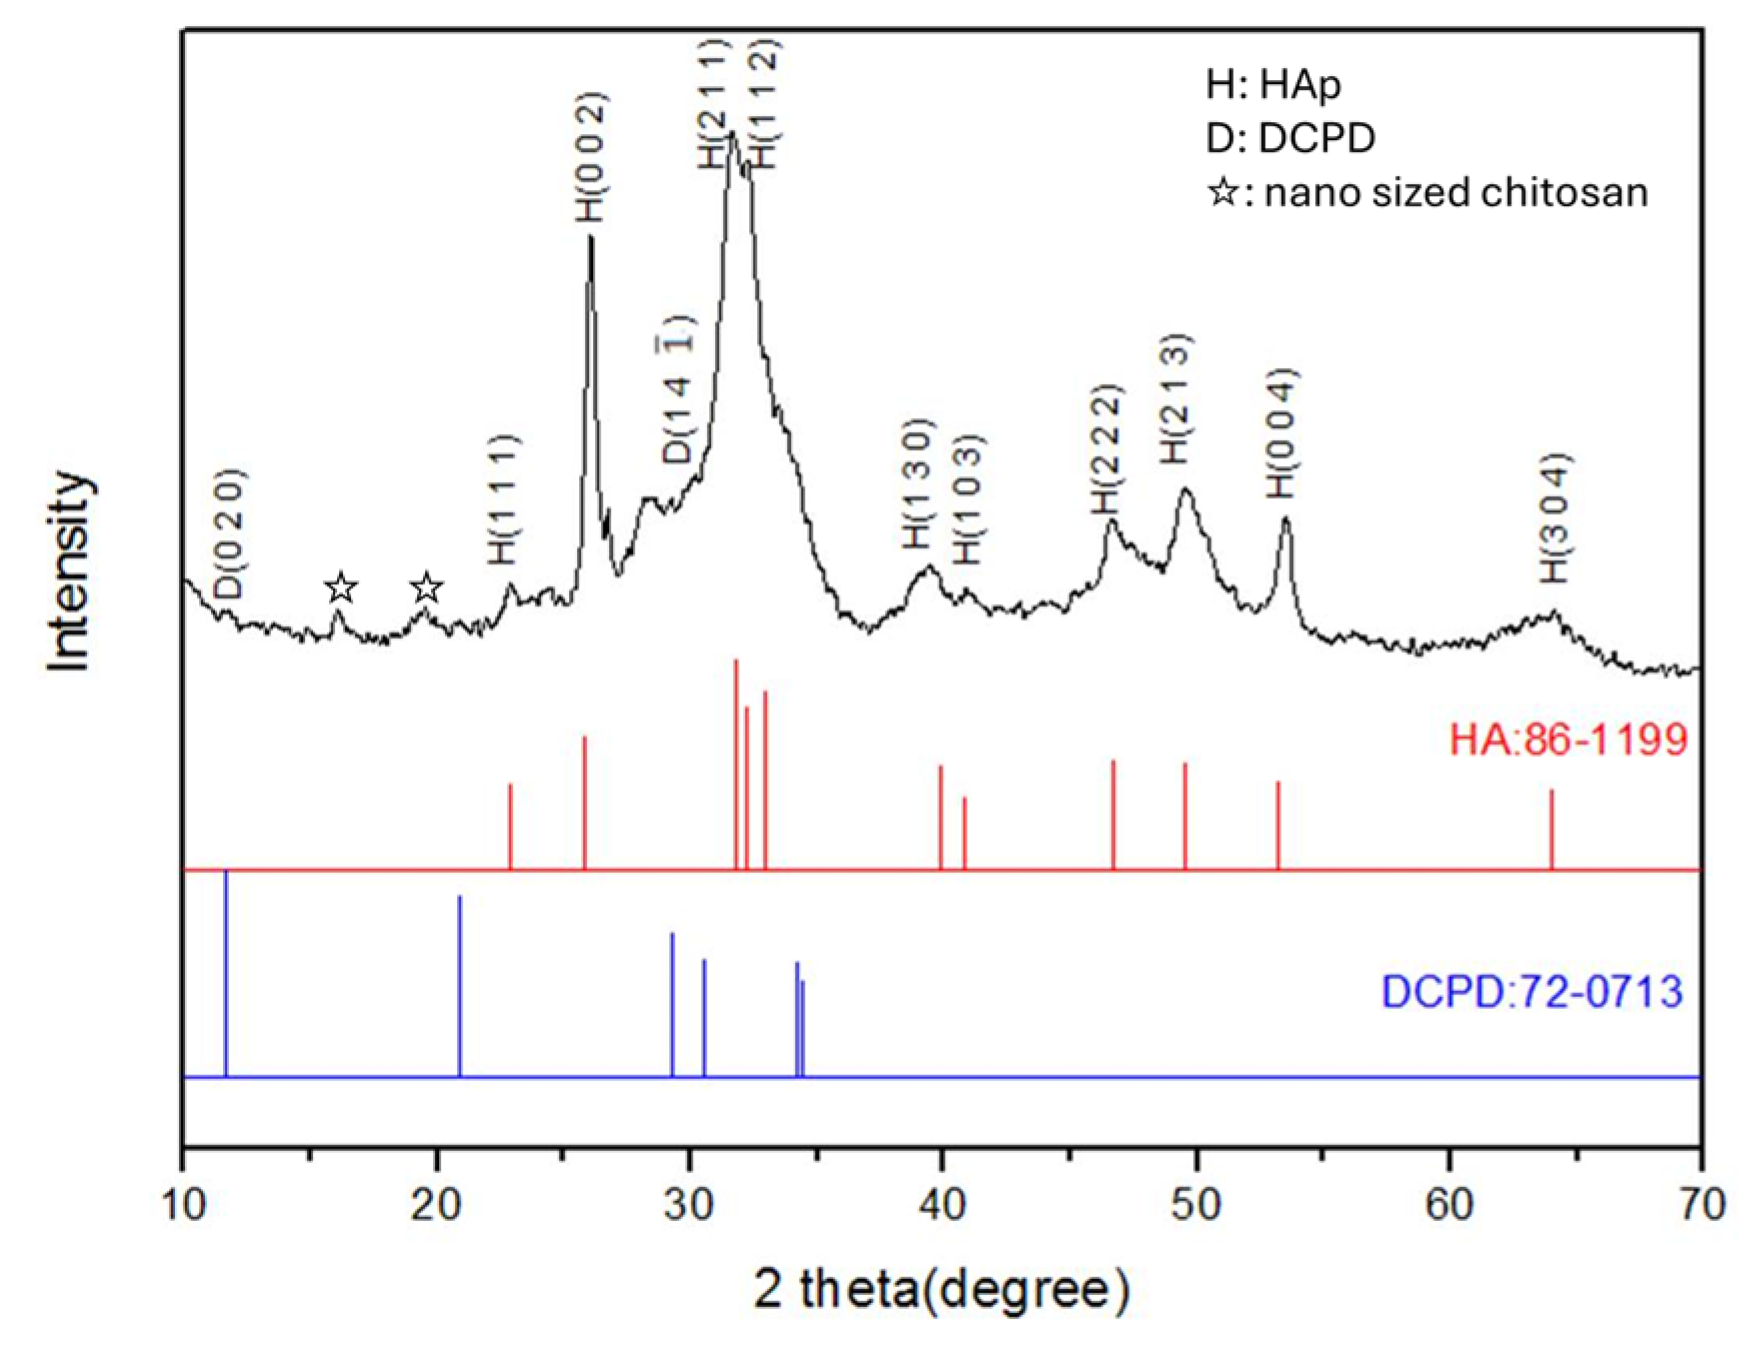
3.3. Crystal Structures
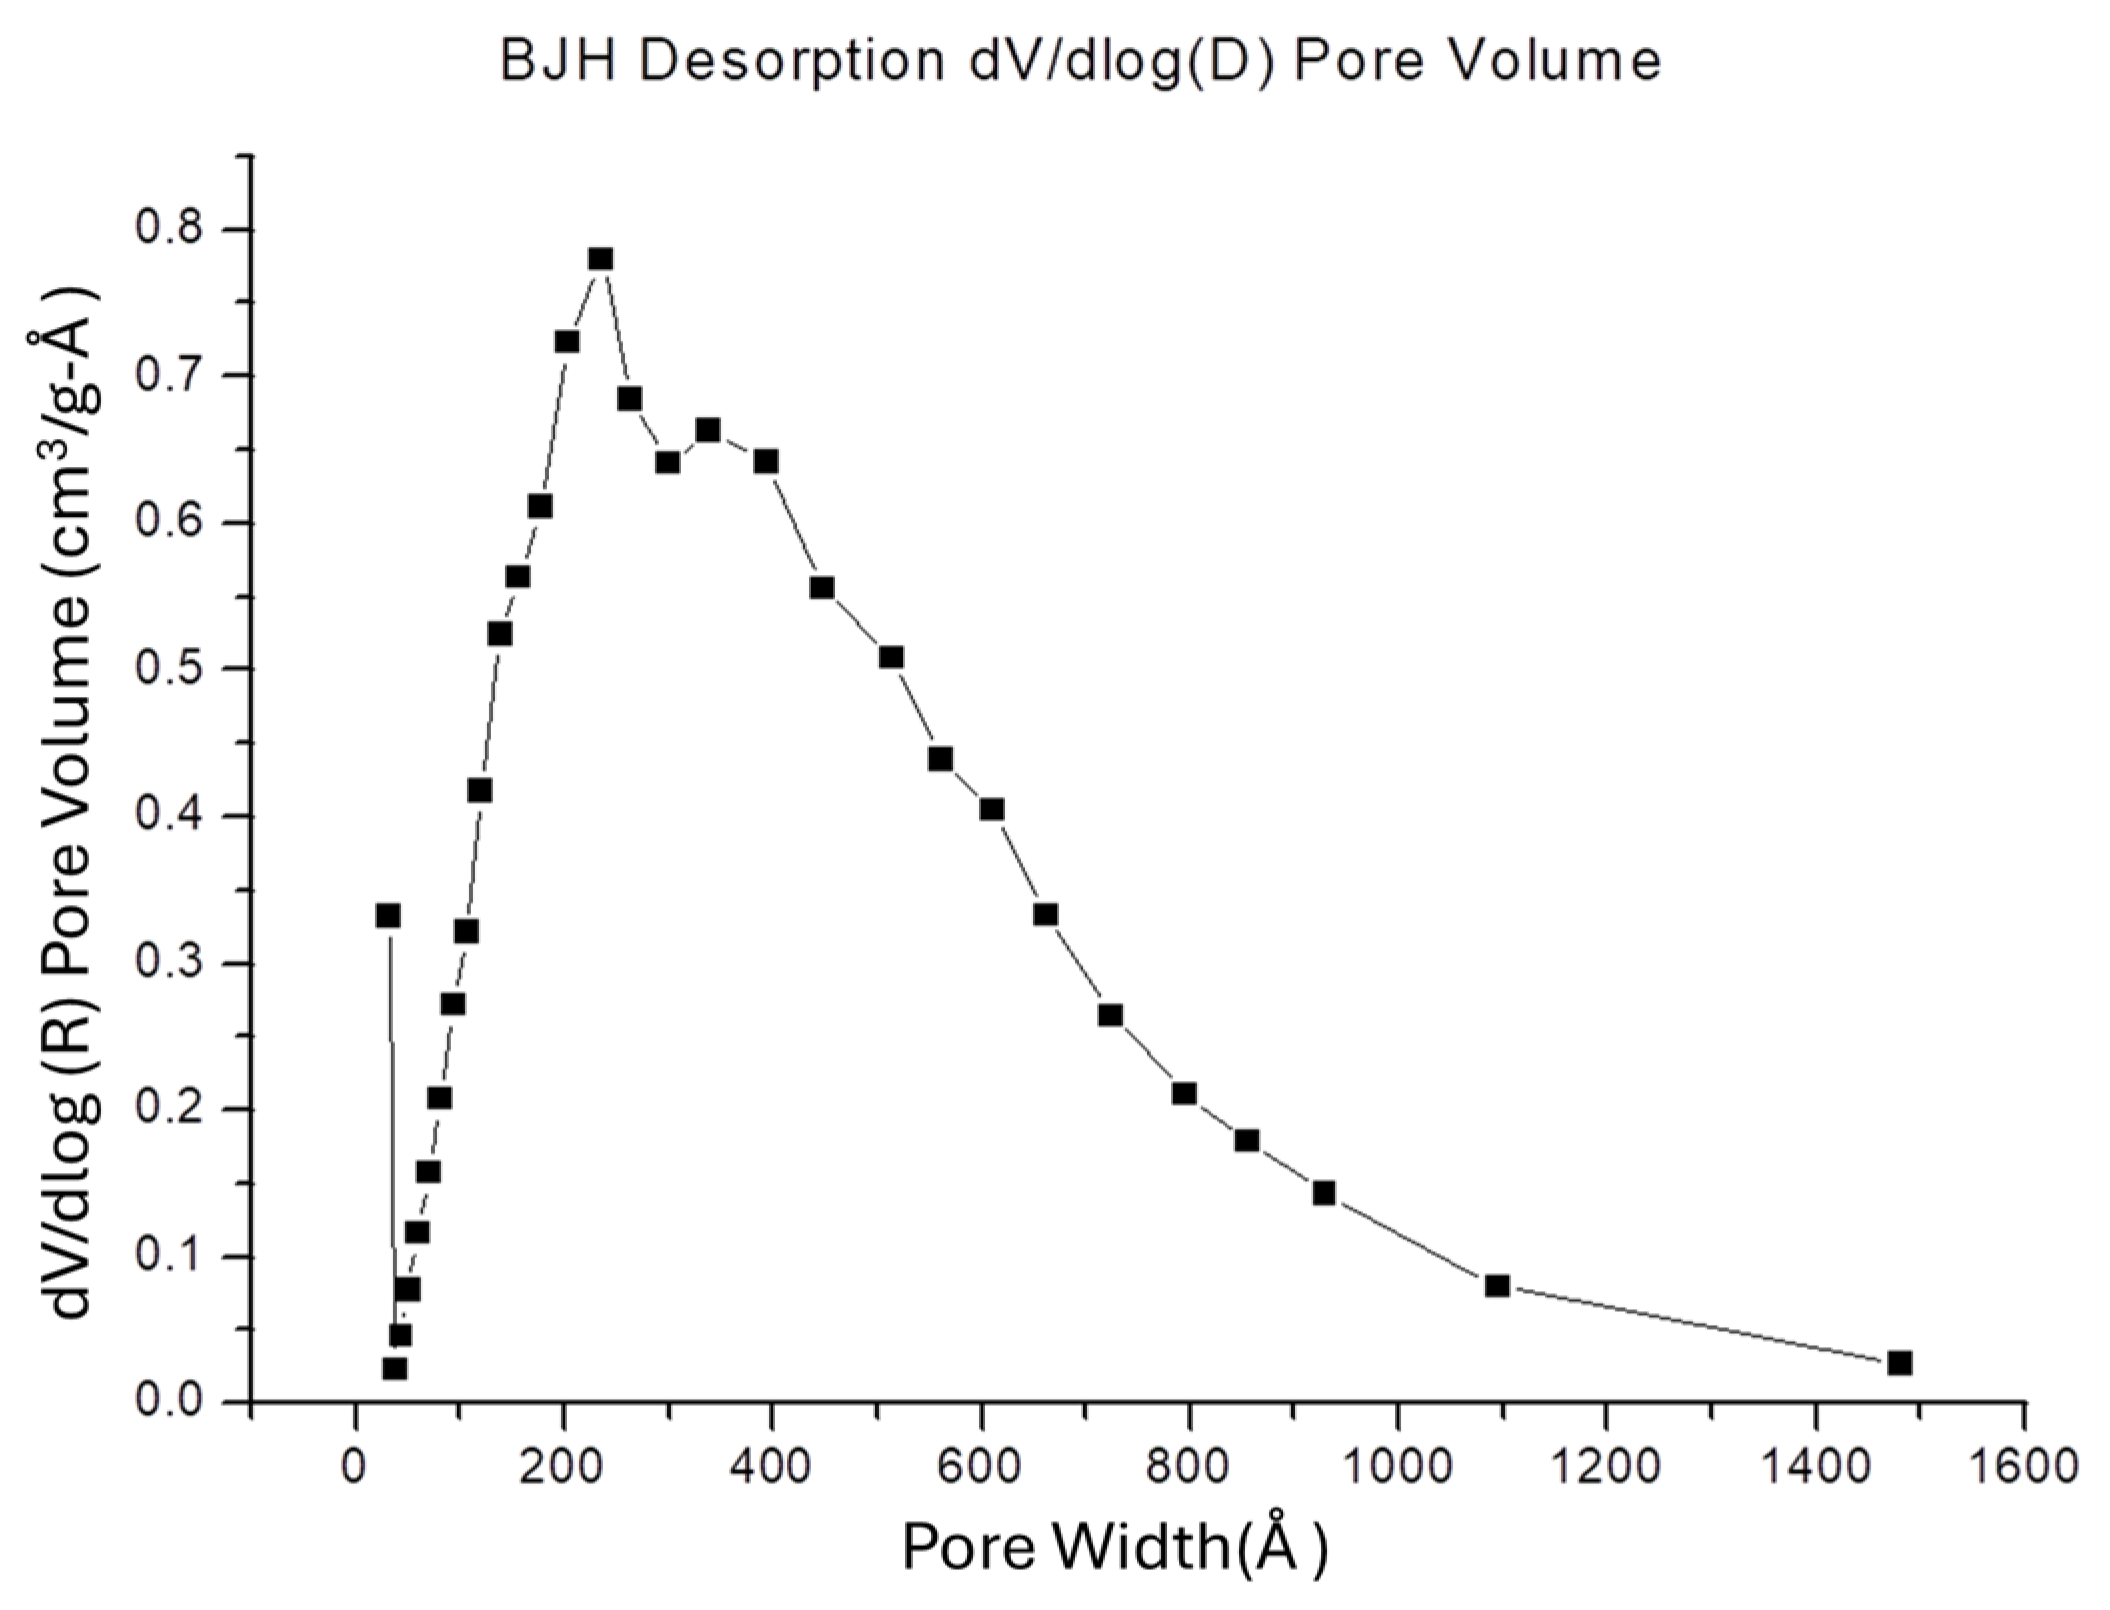
3.4. SSA and Porosity of the Chi-HAp
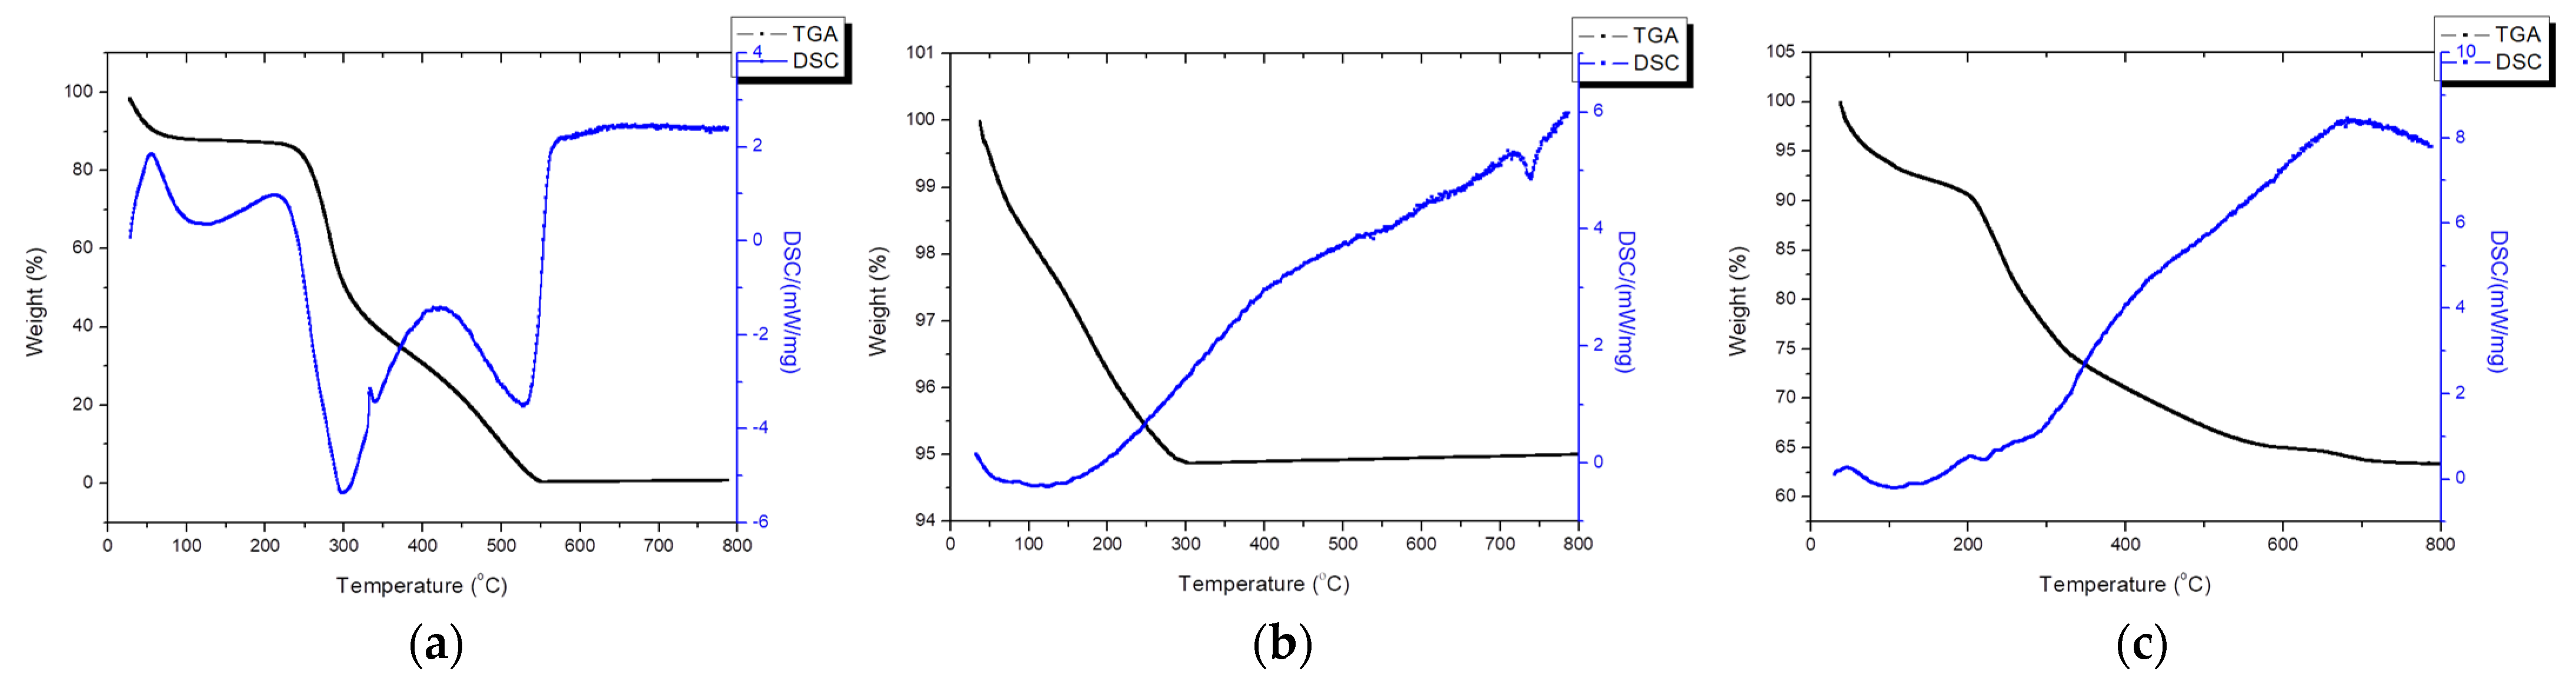
3.5. Thermal Analysis
3.6. Functional Group Identification through an FTIR Spectrograph Spectrometer
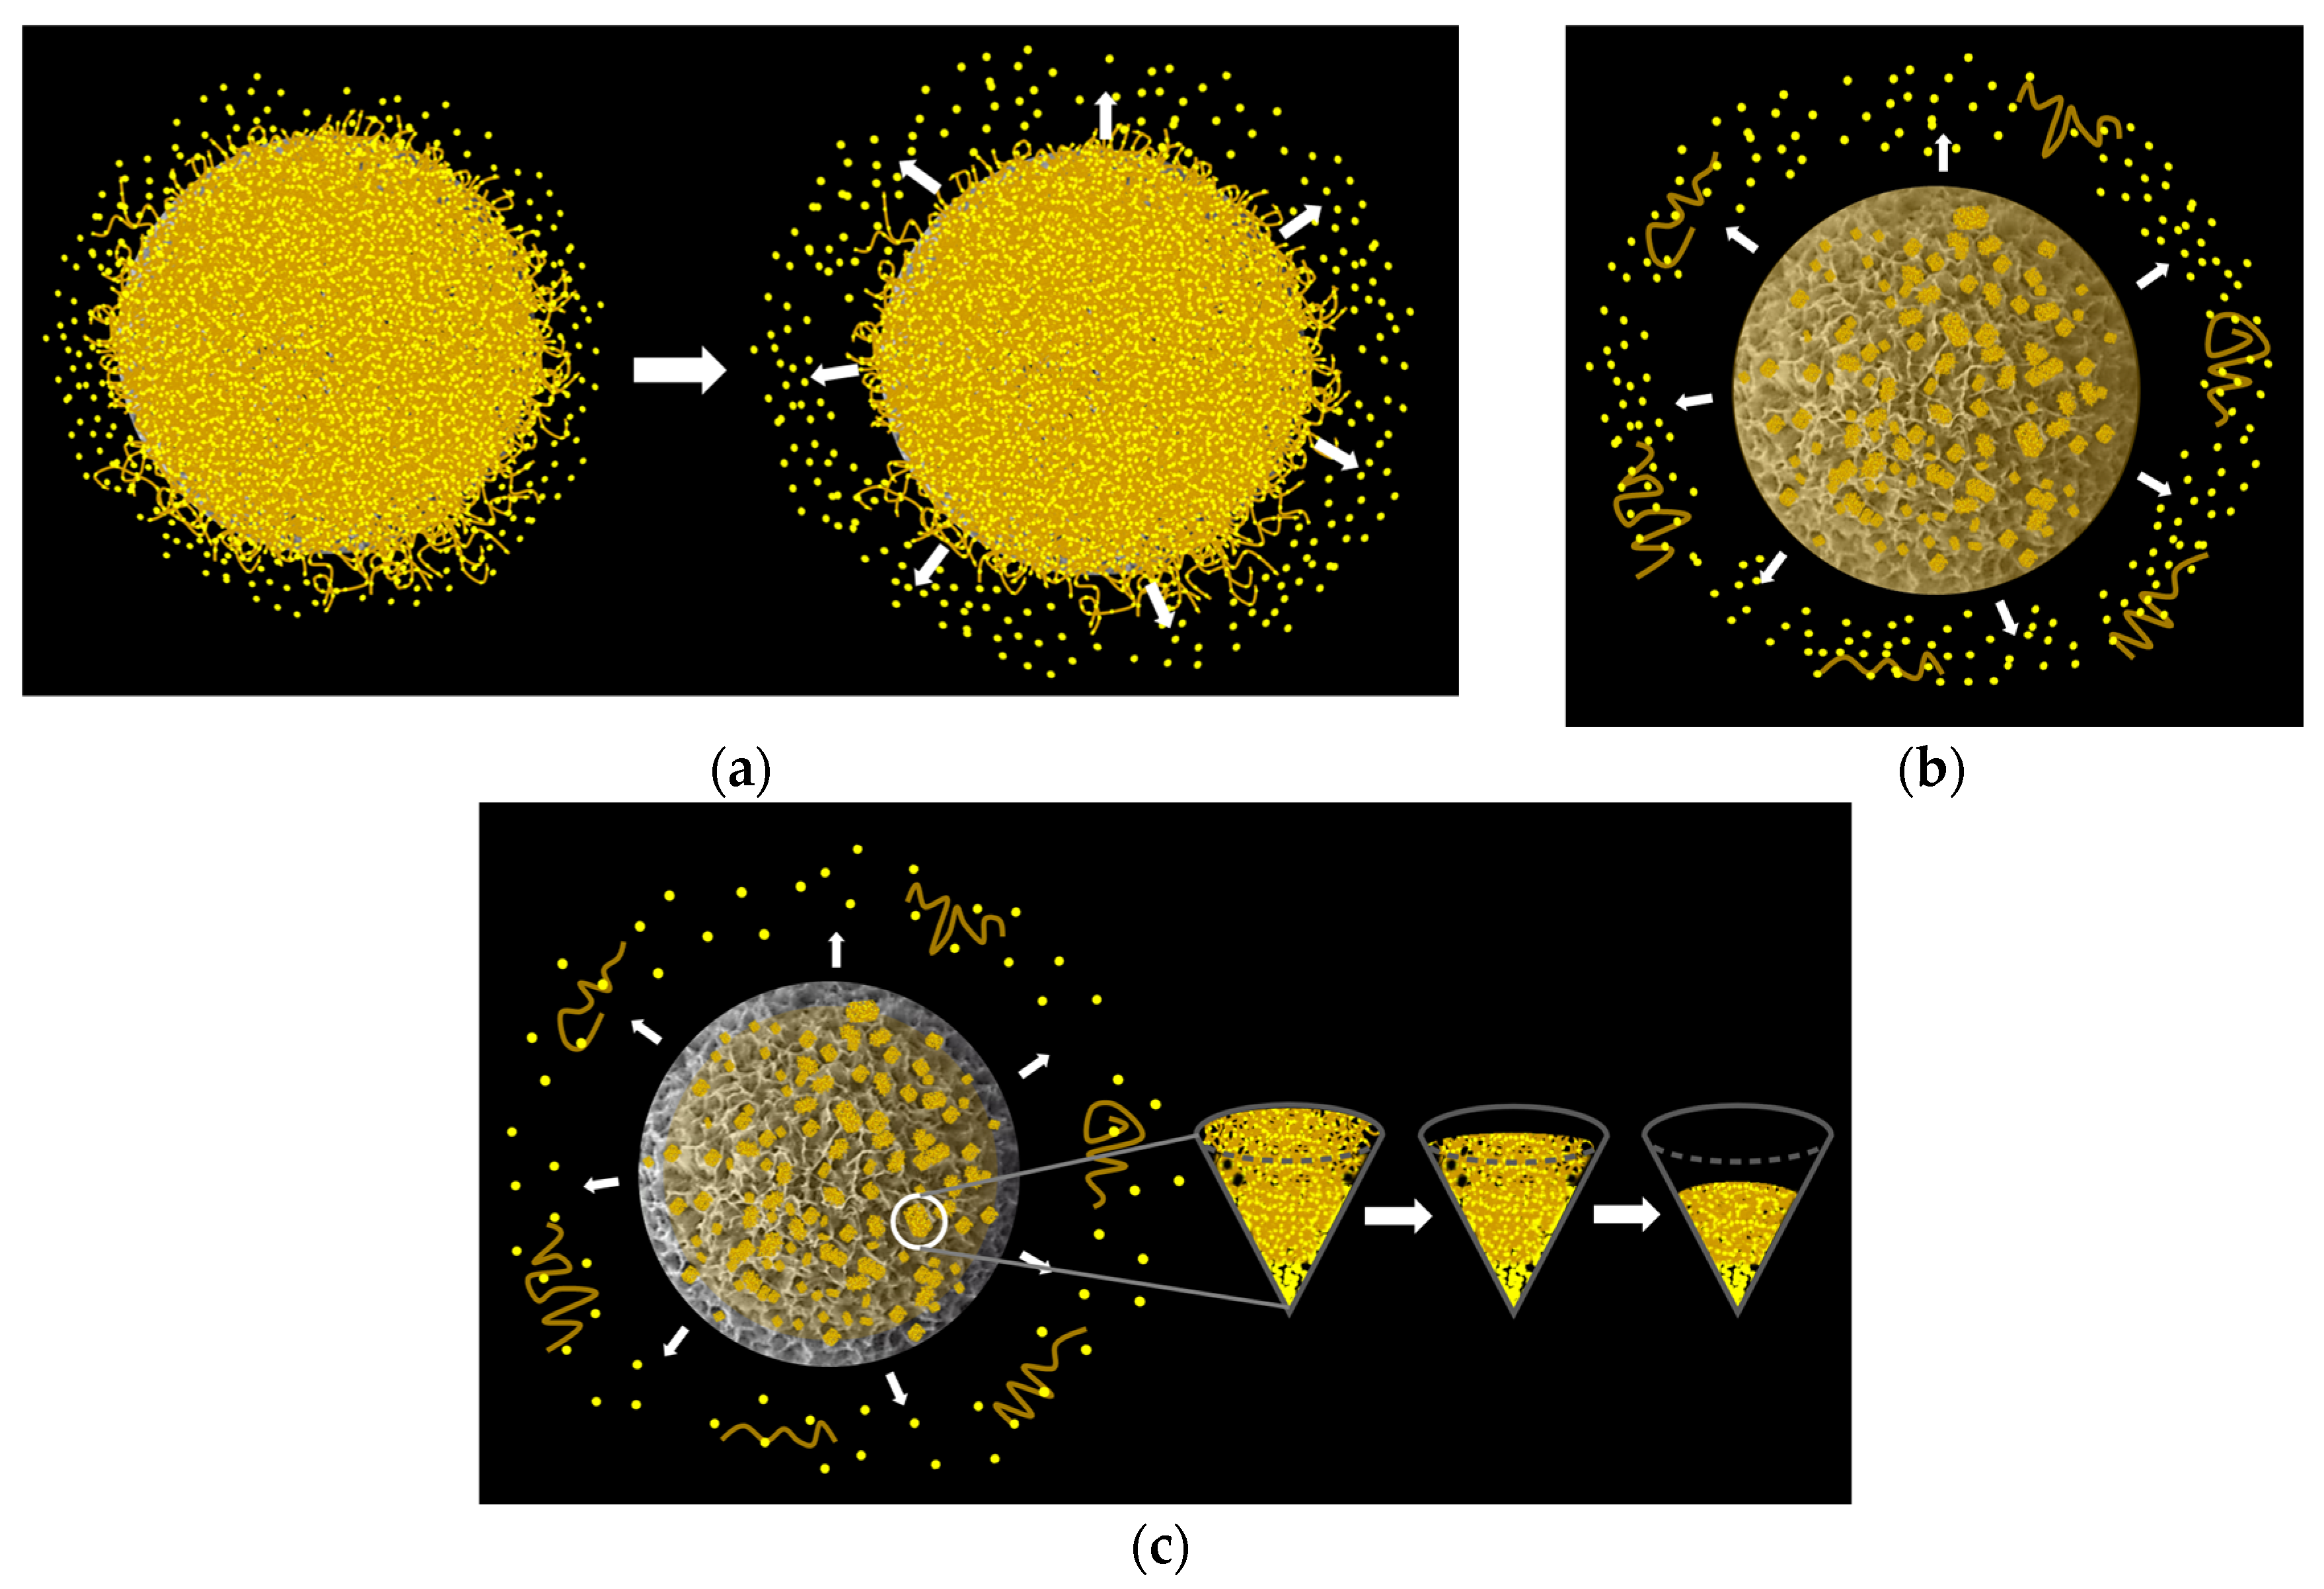
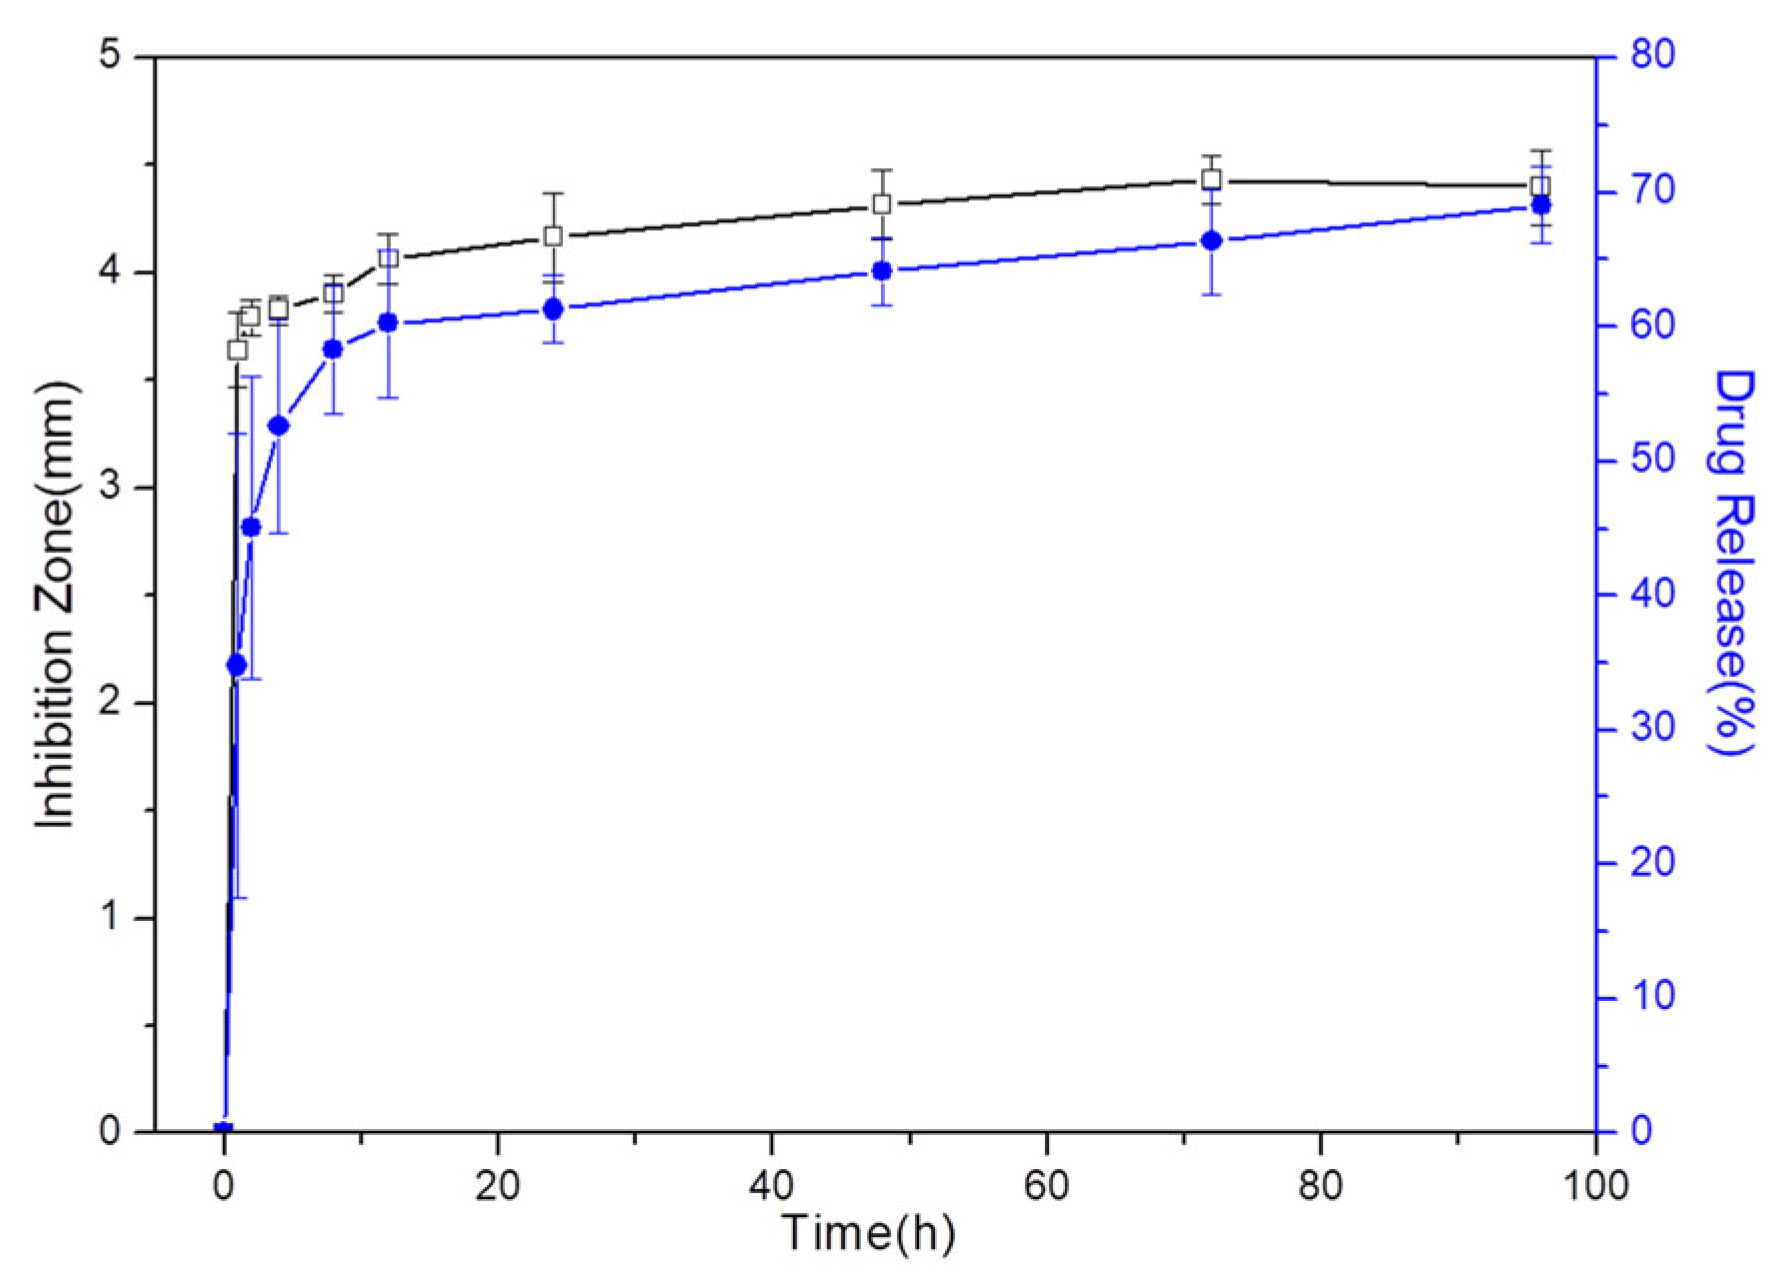
3.7. Drug Release
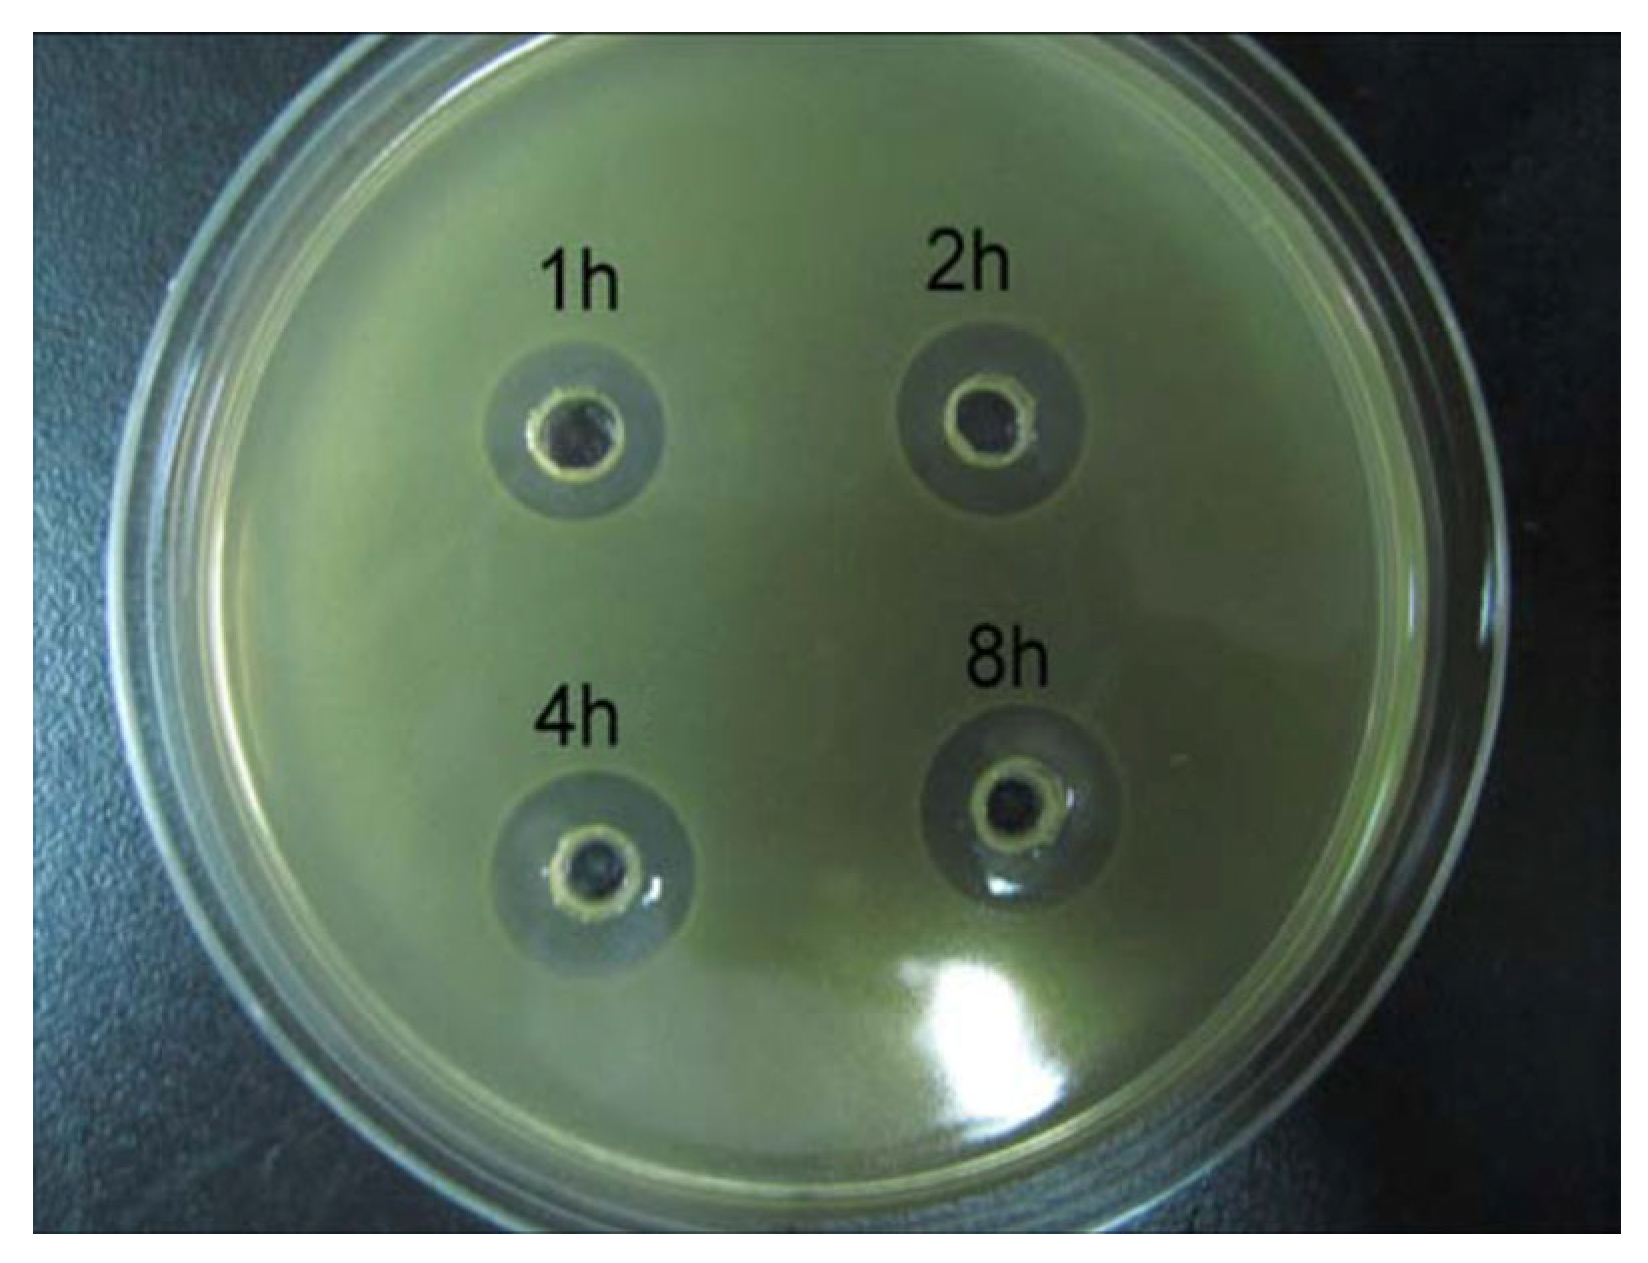
3.8. Antibacterial Assessment
4. Conclusions
Author Contributions
Funding
Institutional Review Board Statement
Informed Consent Statement
Data Availability Statement
Acknowledgments
Conflicts of Interest
References
- Schnieders, J.; Gbureck, U.; Thull, R.; Kissel, T. Controlled release of gentamicin from calcium phosphate—Poly(lactic acid-co-glycolic acid) composite bone cement. Biomaterials 2006, 27, 4239–4249. [Google Scholar] [CrossRef]
- Vallet-Regí, M.; Lozano, D.; González, B.; Izquierdo-Barba, I. Biomaterials against Bone Infection. Adv. Healthc. Mater. 2020, 9, 2000310. [Google Scholar] [CrossRef]
- Gisbert-Garzarán, M.; Manzano, M.; Vallet-Regí, M. Mesoporous Silica Nanoparticles for the Treatment of Complex Bone Diseases: Bone Cancer, Bone Infection and Osteoporosis. Pharmaceutics 2020, 12, 83. [Google Scholar] [CrossRef]
- Nie, B.E.; Huo, S.; Qu, X.; Guo, J.; Liu, X.; Hong, Q.; Wang, Y.; Yang, J.; Yue, B. Bone infection site targeting nanoparticle-antibiotics delivery vehicle to enhance treatment efficacy of orthopedic implant related infection. Bioact. Mater. 2022, 16, 134–148. [Google Scholar] [CrossRef]
- e Silva, G.L.G.; de Bustamante, M.S.D.S.; de Abreu Garófalo, D.; Dias, M.L.; Rossi, A.M.; Tude, E.M.O.; da Silva Cardoso, V.; Vermelho, A.B.; dos Santos Matos, A.P.; Santos-Oliveira, R.; et al. Nanofibers containing vancomycin for the treatment of bone infections: Development, characterization, efficacy and safety tests in cell cultures. J. Drug Deliv. Sci. Technol. 2023, 87, 104780. [Google Scholar] [CrossRef]
- Sivakumar, M.; Manjubala, I.; Panduranga Rao, K. Preparation, characterization and in-vitro release of gentamicin from coralline hydroxyapatite–chitosan composite microspheres. Carbohydr. Polym. 2002, 49, 281–288. [Google Scholar] [CrossRef]
- George, S.M.; Nayak, C.; Singh, I.; Balani, K. Multifunctional Hydroxyapatite Composites for Orthopedic Applications: A Review. ACS Biomater. Sci. Eng. 2022, 8, 3162–3186. [Google Scholar] [CrossRef]
- Arokiasamy, P.; Al Bakri Abdullah, M.M.; Abd Rahim, S.Z.; Luhar, S.; Sandu, A.V.; Jamil, N.H.; Nabiałek, M. Synthesis methods of hydroxyapatite from natural sources: A review. Ceram. Int. 2022, 48, 14959–14979. [Google Scholar] [CrossRef]
- Ielo, I.; Calabrese, G.; De Luca, G.; Conoci, S. Recent Advances in Hydroxyapatite-Based Biocomposites for Bone Tissue Regeneration in Orthopedics. Int. J. Mol. Sci. 2022, 23, 9721. [Google Scholar] [CrossRef]
- Jinawath, S.; Pongkao, D.; Yoshimura, M. Hydrothermal synthesis of hydroxyapatite from natural source. J. Mater. Sci. Mater. Med. 2002, 13, 491–494. [Google Scholar] [CrossRef]
- Feng, P.; Zhao, R.; Yang, L.; Chen, S.; Wang, D.; Pan, H.; Shuai, C. Hydrothermal synthesis of hydroxyapatite nanorods and their use in PCL bone scaffold. Ceram. Int. 2022, 48, 33682–33692. [Google Scholar] [CrossRef]
- Szterner, P.; Biernat, M. The Synthesis of Hydroxyapatite by Hydrothermal Process with Calcium Lactate Pentahydrate: The Effect of Reagent Concentrations, pH, Temperature, and Pressure. Bioinorg. Chem. Appl. 2022, 2022, 3481677. [Google Scholar] [CrossRef]
- Rao, R.R.; Roopa, H.N.; Kannan, T.S. Solid state synthesis and thermal stability of HAP and HAP–Beta-TCP composite ceramic powders. J. Mater. Sci. Mater. Med. 1997, 8, 511–518. [Google Scholar] [CrossRef]
- Taghipour, P.; Zolfagharpour, F.; Daneshvar, H. Synthesis of hydroxyapatite through solid-state reaction method and study of its thermoluminesence dosimetric properties against gamma rays. Radiat. Phys. Eng. 2022, 3, 7–10. [Google Scholar] [CrossRef]
- Wang, F.; Li, M.-S.; Lu, Y.-P.; Qi, Y.-X. A simple sol–gel technique for preparing hydroxyapatite nanopowders. Mater. Lett. 2005, 59, 916–919. [Google Scholar] [CrossRef]
- Baladi, M.; Amiri, M.; Mohammadi, P.; Salih Mahdi, K.; Golshani, Z.; Razavi, R.; Salavati-Niasari, M. Green sol–gel synthesis of hydroxyapatite nanoparticles using lemon extract as capping agent and investigation of its anticancer activity against human cancer cell lines (T98, and SHSY5). Arab. J. Chem. 2023, 16, 104646. [Google Scholar] [CrossRef]
- Bernard, L.; Freche, M.; Lacout, J.L.; Biscans, B. Preparation of hydroxyapatite by neutralization at low temperature—Influence of purity of the raw material. Powder Technol. 1999, 103, 19–25. [Google Scholar] [CrossRef]
- Méndez-Lozano, N.; Apátiga-Castro, M.; Soto, K.M.; Manzano-Ramírez, A.; Zamora-Antuñano, M.; Gonzalez-Gutierrez, C. Effect of temperature on crystallite size of hydroxyapatite powders obtained by wet precipitation process. J. Saudi Chem. Soc. 2022, 26, 101513. [Google Scholar] [CrossRef]
- Nagata, F.; Miyajima, T.; Yokogawa, Y. A method to fabricate hydroxyapatite/poly(lactic acid) microspheres intended for biomedical application. J. Eur. Ceram. Soc. 2006, 26, 533–535. [Google Scholar] [CrossRef]
- Collins Arun Prakash, V.; Venda, I.; Thamizharasi, V. Synthesis and characterization of surfactant assisted hydroxyapatite powder using microemulsion method. Mater. Today Proc. 2022, 51, 1788–1792. [Google Scholar] [CrossRef]
- Wang, X.; Fan, H.; Xiao, Y.; Zhang, X. Fabrication and characterization of porous hydroxyapatite/β-tricalcium phosphate ceramics by microwave sintering. Mater. Lett. 2006, 60, 455–458. [Google Scholar] [CrossRef]
- Castro, M.A.M.; Portela, T.O.; Correa, G.S.; Oliveira, M.M.; Rangel, J.H.G.; Rodrigues, S.F.; Mercury, J.M.R. Synthesis of hydroxyapatite by hydrothermal and microwave irradiation methods from biogenic calcium source varying pH and synthesis time. Bol. Soc. Esp. Cerám. Vidr. 2022, 61, 35–41. [Google Scholar] [CrossRef]
- Masuko, T.; Iwasaki, N.; Yamane, S.; Funakoshi, T.; Majima, T.; Minami, A.; Ohsuga, N.; Ohta, T.; Nishimura, S.-I. Chitosan–RGDSGGC conjugate as a scaffold material for musculoskeletal tissue engineering. Biomaterials 2005, 26, 5339–5347. [Google Scholar] [CrossRef]
- Hoemann, C.D.; Sun, J.; Légaré, A.; McKee, M.D.; Buschmann, M.D. Tissue engineering of cartilage using an injectable and adhesive chitosan-based cell-delivery vehicle. Osteoarthr. Cartil. 2005, 13, 318–329. [Google Scholar] [CrossRef]
- Wang, J.; Zhuang, S. Chitosan-based materials: Preparation, modification and application. J. Clean. Prod. 2022, 355, 131825. [Google Scholar] [CrossRef]
- Desai, N.; Rana, D.; Salave, S.; Gupta, R.; Patel, P.; Karunakaran, B.; Sharma, A.; Giri, J.; Benival, D.; Kommineni, N. Chitosan: A Potential Biopolymer in Drug Delivery and Biomedical Applications. Pharmaceutics 2023, 15, 1313. [Google Scholar] [CrossRef]
- Cevher, E.; Orhan, Z.; Mülazımoğlu, L.; Şensoy, D.; Alper, M.; Yıldız, A.; Özsoy, Y. Characterization of biodegradable chitosan microspheres containing vancomycin and treatment of experimental osteomyelitis caused by methicillin-resistant Staphylococcus aureus with prepared microspheres. Int. J. Pharm. 2006, 317, 127–135. [Google Scholar] [CrossRef]
- Learoyd, T.P.; Burrows, J.L.; French, E.; Seville, P.C. Modified release of beclometasone dipropionate from chitosan-based spray-dried respirable powders. Powder Technol. 2008, 187, 231–238. [Google Scholar] [CrossRef]
- Kou, S.; Peters, L.; Mucalo, M. Chitosan: A review of molecular structure, bioactivities and interactions with the human body and micro-organisms. Carbohydr. Polym. 2022, 282, 119132. [Google Scholar] [CrossRef]
- Nsereko, S.; Amiji, M. Localized delivery of paclitaxel in solid tumors from biodegradable chitin microparticle formulations. Biomaterials 2002, 23, 2723–2731. [Google Scholar] [CrossRef]
- Zhang, Z.-L.; Li, L.-J.; Sun, D.; Wang, M.; Shi, J.-R.; Yang, D.; Wang, L.-H.; Zou, S.-C. Preparation and properties of chitosan-based microspheres by spray drying. Food Sci. Nutr. 2020, 8, 1933–1941. [Google Scholar] [CrossRef] [PubMed]
- Shi, X.-Y.; Tan, T.-W. Preparation of chitosan/ethylcellulose complex microcapsule and its application in controlled release of Vitamin D2. Biomaterials 2002, 23, 4469–4473. [Google Scholar] [CrossRef] [PubMed]
- Essa, D.; Choonara, Y.E.; Kondiah, P.P.D.; Pillay, V. Comparative Nanofabrication of PLGA-Chitosan-PEG Systems Employing Microfluidics and Emulsification Solvent Evaporation Techniques. Polymers 2020, 12, 1882. [Google Scholar] [CrossRef] [PubMed]
- Tsai, M.L.; Bai, S.W.; Chen, R.H. Cavitation effects versus stretch effects resulted in different size and polydispersity of ionotropic gelation chitosan–sodium tripolyphosphate nanoparticle. Carbohydr. Polym. 2008, 71, 448–457. [Google Scholar] [CrossRef]
- Algharib, S.A.; Dawood, A.; Zhou, K.; Chen, D.; Li, C.; Meng, K.; Zhang, A.; Luo, W.; Ahmed, S.; Huang, L.; et al. Preparation of chitosan nanoparticles by ionotropic gelation technique: Effects of formulation parameters and in vitro characterization. J. Mol. Struct. 2022, 1252, 132129. [Google Scholar] [CrossRef]
- Bayomi, M.A.; Al-Suwayeh, S.A.; El-Helw, A.M.; Mesnad, A.F. Preparation of casein–chitosan microspheres containing diltiazem hydrochloride by an aqueous coacervation technique. Pharm. Acta Helv. 1998, 73, 187–192. [Google Scholar] [CrossRef] [PubMed]
- Karabiyik Acar, O.; Kayitmazer, A.B.; Torun Kose, G. Hyaluronic Acid/Chitosan Coacervate-Based Scaffolds. Biomacromolecules 2018, 19, 1198–1211. [Google Scholar] [CrossRef] [PubMed]
- Sinha, V.R.; Singla, A.K.; Wadhawan, S.; Kaushik, R.; Kumria, R.; Bansal, K.; Dhawan, S. Chitosan microspheres as a potential carrier for drugs. Int. J. Pharm. 2004, 274, 1–33. [Google Scholar] [CrossRef]
- Tang, W.; Wang, J.; Hou, H.; Li, Y.; Wang, J.; Fu, J.; Lu, L.; Gao, D.; Liu, Z.; Zhao, F.; et al. Review: Application of chitosan and its derivatives in medical materials. Int. J. Biol. Macromol. 2023, 240, 124398. [Google Scholar] [CrossRef]
- Soriente, A.; Fasolino, I.; Gomez-Sánchez, A.; Prokhorov, E.; Buonocore, G.G.; Luna-Barcenas, G.; Ambrosio, L.; Raucci, M.G. Chitosan/hydroxyapatite nanocomposite scaffolds to modulate osteogenic and inflammatory response. J. Biomed. Mater. Res. Part A 2022, 110, 266–272. [Google Scholar] [CrossRef]
- Chacon, E.L.; Bertolo, M.R.V.; de Guzzi Plepis, A.M.; da Conceição Amaro Martins, V.; dos Santos, G.R.; Pinto, C.A.L.; Pelegrine, A.A.; Teixeira, M.L.; Buchaim, D.V.; Nazari, F.M.; et al. Collagen-chitosan-hydroxyapatite composite scaffolds for bone repair in ovariectomized rats. Sci. Rep. 2023, 13, 28. [Google Scholar] [CrossRef] [PubMed]
- Li, X.; Zeng, D.; Chen, L.; Ke, P.; Tian, Y.; Wang, G. Preparation and characterization of magnetic chitosan hydroxyapatite nanoparticles for protein drug delivery and antibacterial activity. J. Mater. Res. 2021, 36, 4307–4316. [Google Scholar] [CrossRef]
- Tao, J.; Zhang, Y.; Shen, A.; Yang, Y.; Diao, L.; Wang, L.; Cai, D.; Hu, Y. Injectable Chitosan-Based Thermosensitive Hydrogel/Nanoparticle-Loaded System for Local Delivery of Vancomycin in the Treatment of Osteomyelitis. Int. J. Nanomed. 2020, 15, 5855–5871. [Google Scholar] [CrossRef]
- Li, X.; Hetjens, L.; Wolter, N.; Li, H.; Shi, X.; Pich, A. Charge-reversible and biodegradable chitosan-based microgels for lysozyme-triggered release of vancomycin. J. Adv. Res. 2023, 43, 87–96. [Google Scholar] [CrossRef]
- Kucukler, S.; Darendelioğlu, E.; Caglayan, C.; Ayna, A.; Yıldırım, S.; Kandemir, F.M. Zingerone attenuates vancomycin-induced hepatotoxicity in rats through regulation of oxidative stress, inflammation and apoptosis. Life Sci. 2020, 259, 118382. [Google Scholar] [CrossRef]
- Wu, M.-Y.; Liang, Y.-H.; Yen, S.-K. Effects of Chitosan on Loading and Releasing for Doxorubicin Loaded Porous Hydroxyapatite–Gelatin Composite Microspheres. Polymers 2022, 14, 4276. [Google Scholar] [CrossRef]
- Wu, M.-Y.; Kao, I.F.; Fu, C.-Y.; Yen, S.-K. Effects of Adding Chitosan on Drug Entrapment Efficiency and Release Duration for Paclitaxel-Loaded Hydroxyapatite—Gelatin Composite Microspheres. Pharmaceutics 2023, 15, 2025. [Google Scholar] [CrossRef]
- Barrett, E.P.; Joyner, L.G.; Halenda, P.P. The Determination of Pore Volume and Area Distributions in Porous Substances. I. Computations from Nitrogen Isotherms. J. Am. Chem. Soc. 1951, 73, 373–380. [Google Scholar] [CrossRef]
- Bhusal, P.; Rahiri, J.L.; Sua, B.; McDonald, J.E.; Bansal, M.; Hanning, S.; Sharma, M.; Chandramouli, K.; Harrison, J.; Procter, G.; et al. Comparing human peritoneal fluid and phosphate-buffered saline for drug delivery: Do we need bio-relevant media? Drug Deliv. Transl. Res. 2018, 8, 708–718. [Google Scholar] [CrossRef]
- Hopkins, E.; Sanvictores, T.; Sharma, S. Physiology, Acid Base Balance; BTI—StatPearls: Treasure Island, FL, USA, 2024. [Google Scholar]
- Corrigan, O.I.; Devlin, Y.; Butler, J. Influence of dissolution medium buffer composition on ketoprofen release from ER products and in vitro–in vivo correlation. Int. J. Pharm. 2003, 254, 147–154. [Google Scholar] [CrossRef]
- Ferraz, M.P.; Mateus, A.Y.; Sousa, J.C.; Monteiro, F.J. Nanohydroxyapatite microspheres as delivery system for antibiotics: Release kinetics, antimicrobial activity, and interaction with osteoblasts. J. Biomed. Mater. Res. Part A 2007, 81, 994–1004. [Google Scholar] [CrossRef] [PubMed]
- Wu, M.-Y.; Huang, S.-W.; Kao, I.F.; Yen, S.-K. The Preparation and Characterization of Chitosan/Calcium Phosphate Composite Microspheres for Biomedical Applications. Polymers 2024, 16, 167. [Google Scholar] [CrossRef] [PubMed]
- Morsy, M.; Mostafa, K.; Amyn, H.; El-Ebissy, A.A.-H.; Salah, A.M.; Youssef, M.A. Synthesis and characterization of freeze dryer chitosan nano particles as multi functional eco-friendly finish for fabricating easy care and antibacterial cotton textiles. Egypt. J. Chem. 2019, 62, 1277–1293. [Google Scholar] [CrossRef]
- Sing, K.S. Reporting physisorption data for gas/solid systems with special reference to the determination of surface area and porosity (Recommendations 1984). Pure Appl. Chem. 1985, 57, 603–619. [Google Scholar] [CrossRef]
- Cerchiara, T.; Abruzzo, A.; di Cagno, M.; Bigucci, F.; Bauer-Brandl, A.; Parolin, C.; Vitali, B.; Gallucci, M.C.; Luppi, B. Chitosan based micro- and nanoparticles for colon-targeted delivery of vancomycin prepared by alternative processing methods. Eur. J. Pharm. Biopharm. 2015, 92, 112–119. [Google Scholar] [CrossRef] [PubMed]
- Zirak, N.; Maadani, A.M.; Salahinejad, E.; Abbasnezhad, N.; Shirinbayan, M. Fabrication, drug delivery kinetics and cell viability assay of PLGA-coated vancomycin-loaded silicate porous microspheres. Ceram. Int. 2022, 48, 48–54. [Google Scholar] [CrossRef]
- Chao, S.C.; Wang, M.-J.; Pai, N.-S.; Yen, S.-K. Preparation and characterization of gelatin–hydroxyapatite composite microspheres for hard tissue repair. Mater. Sci. Eng. C 2015, 57, 113–122. [Google Scholar] [CrossRef]
- Zhang, M.-X.; Zhao, W.-Y.; Fang, Q.-Q.; Wang, X.-F.; Chen, C.-Y.; Shi, B.-H.; Zheng, B.; Wang, S.-J.; Tan, W.-Q.; Wu, L.-H. Effects of chitosan-collagen dressing on wound healing in vitro and in vivo assays. J. Appl. Biomater. Funct. Mater. 2021, 19, 2280800021989698. [Google Scholar] [CrossRef]


| VCM (mg) | Chi-HAp (mg) | Chitosan (mg) | VCM:Chi-HAp | |
|---|---|---|---|---|
| Chitosan-coated VCM/Chi-HAp | 20 | 80 | 20 | 1:4 |
| VCM/Chi-HAp | 20 | 80 | 0 | 1:4 |
| BET | BJH Adsorption | BJH Desorption | |
|---|---|---|---|
| SSA | 36.66 ± 1.32 m2/g | 85.52 ± 2.85 m2/g | 140.99 ± 4.23 m2/g |
| Pore volume | 0.5874 ± 0.0125 cm3/g | 0.5953 ± 0.0274 cm3/g | |
| Pore size | 403.5 ± 9.65 Å | 271.6 ± 8.12 Å | 168.9 ± 5.94 Å |
| Time | 0 h | 1 h | 2 h | 4 h | 8 h | 1 Day | 7 Days | 28 Days |
|---|---|---|---|---|---|---|---|---|
| Content of C | 60.66 ± 1.85% | 56.89 ± 2.59% | 56.43 ± 1.63% | 56.01 ± 1.17% | 47.87 ± 1.24% | 34.03 ± 1.82% | 28.98 ± 1.54% | 20.01 ± 2.12% |
Disclaimer/Publisher’s Note: The statements, opinions and data contained in all publications are solely those of the individual author(s) and contributor(s) and not of MDPI and/or the editor(s). MDPI and/or the editor(s) disclaim responsibility for any injury to people or property resulting from any ideas, methods, instructions or products referred to in the content. |
© 2024 by the authors. Licensee MDPI, Basel, Switzerland. This article is an open access article distributed under the terms and conditions of the Creative Commons Attribution (CC BY) license (https://creativecommons.org/licenses/by/4.0/).
Share and Cite
Wu, M.-Y.; Kuo, Y.-T.; Kao, I.-F.; Yen, S.-K. Porous Chitosan/Hydroxyapatite Composite Microspheres for Vancomycin Loading and Releasing. Pharmaceutics 2024, 16, 730. https://doi.org/10.3390/pharmaceutics16060730
Wu M-Y, Kuo Y-T, Kao I-F, Yen S-K. Porous Chitosan/Hydroxyapatite Composite Microspheres for Vancomycin Loading and Releasing. Pharmaceutics. 2024; 16(6):730. https://doi.org/10.3390/pharmaceutics16060730
Chicago/Turabian StyleWu, Meng-Ying, Yi-Ting Kuo, I-Fang Kao, and Shiow-Kang Yen. 2024. "Porous Chitosan/Hydroxyapatite Composite Microspheres for Vancomycin Loading and Releasing" Pharmaceutics 16, no. 6: 730. https://doi.org/10.3390/pharmaceutics16060730
APA StyleWu, M.-Y., Kuo, Y.-T., Kao, I.-F., & Yen, S.-K. (2024). Porous Chitosan/Hydroxyapatite Composite Microspheres for Vancomycin Loading and Releasing. Pharmaceutics, 16(6), 730. https://doi.org/10.3390/pharmaceutics16060730