
The Immunosuppressive Properties of Cyclo-[D-Pro-Pro-β3-HoPhe-Phe-] Tetrapeptide Selected from Stereochemical Variants of Cyclo-[Pro-Pro-β3-HoPhe-Phe-] Peptide

 , , , , , and
Abstract
1. Introduction
2. Materials and Methods
2.1. Reagents
2.2. Isolation of Human Peripheral Blood Mononuclear Cells (PBMCs)
2.3. Proliferative Response of PBMC to PHA
2.4. The Toxicity Test
2.5. Determination of TNF-α Activity Using a Bioassay
2.6. Colorimetric MTT Assay for Cell Growth and Death
2.7. Mice
2.8. Isolation of Thymocytes
2.9. Analysis of the Peripheral Blood Picture
2.10. Contact Sensitivity to Oxazolone
2.11. Carrageenan-Induced Inflammation of Air Pouches
2.12. Dextran Sulfate-Induced Colitis
2.13. Statistics
2.14. In Silico Studies
2.15. UHPLC-MS Analysis
2.16. NMR Spectroscopy
2.17. Quantum-Chemical Calculations
3. Results
3.1. Estimation of the Purity of the D- and L-Stereoisomers
3.2. Evaluation of Activities of the Peptides In Vitro
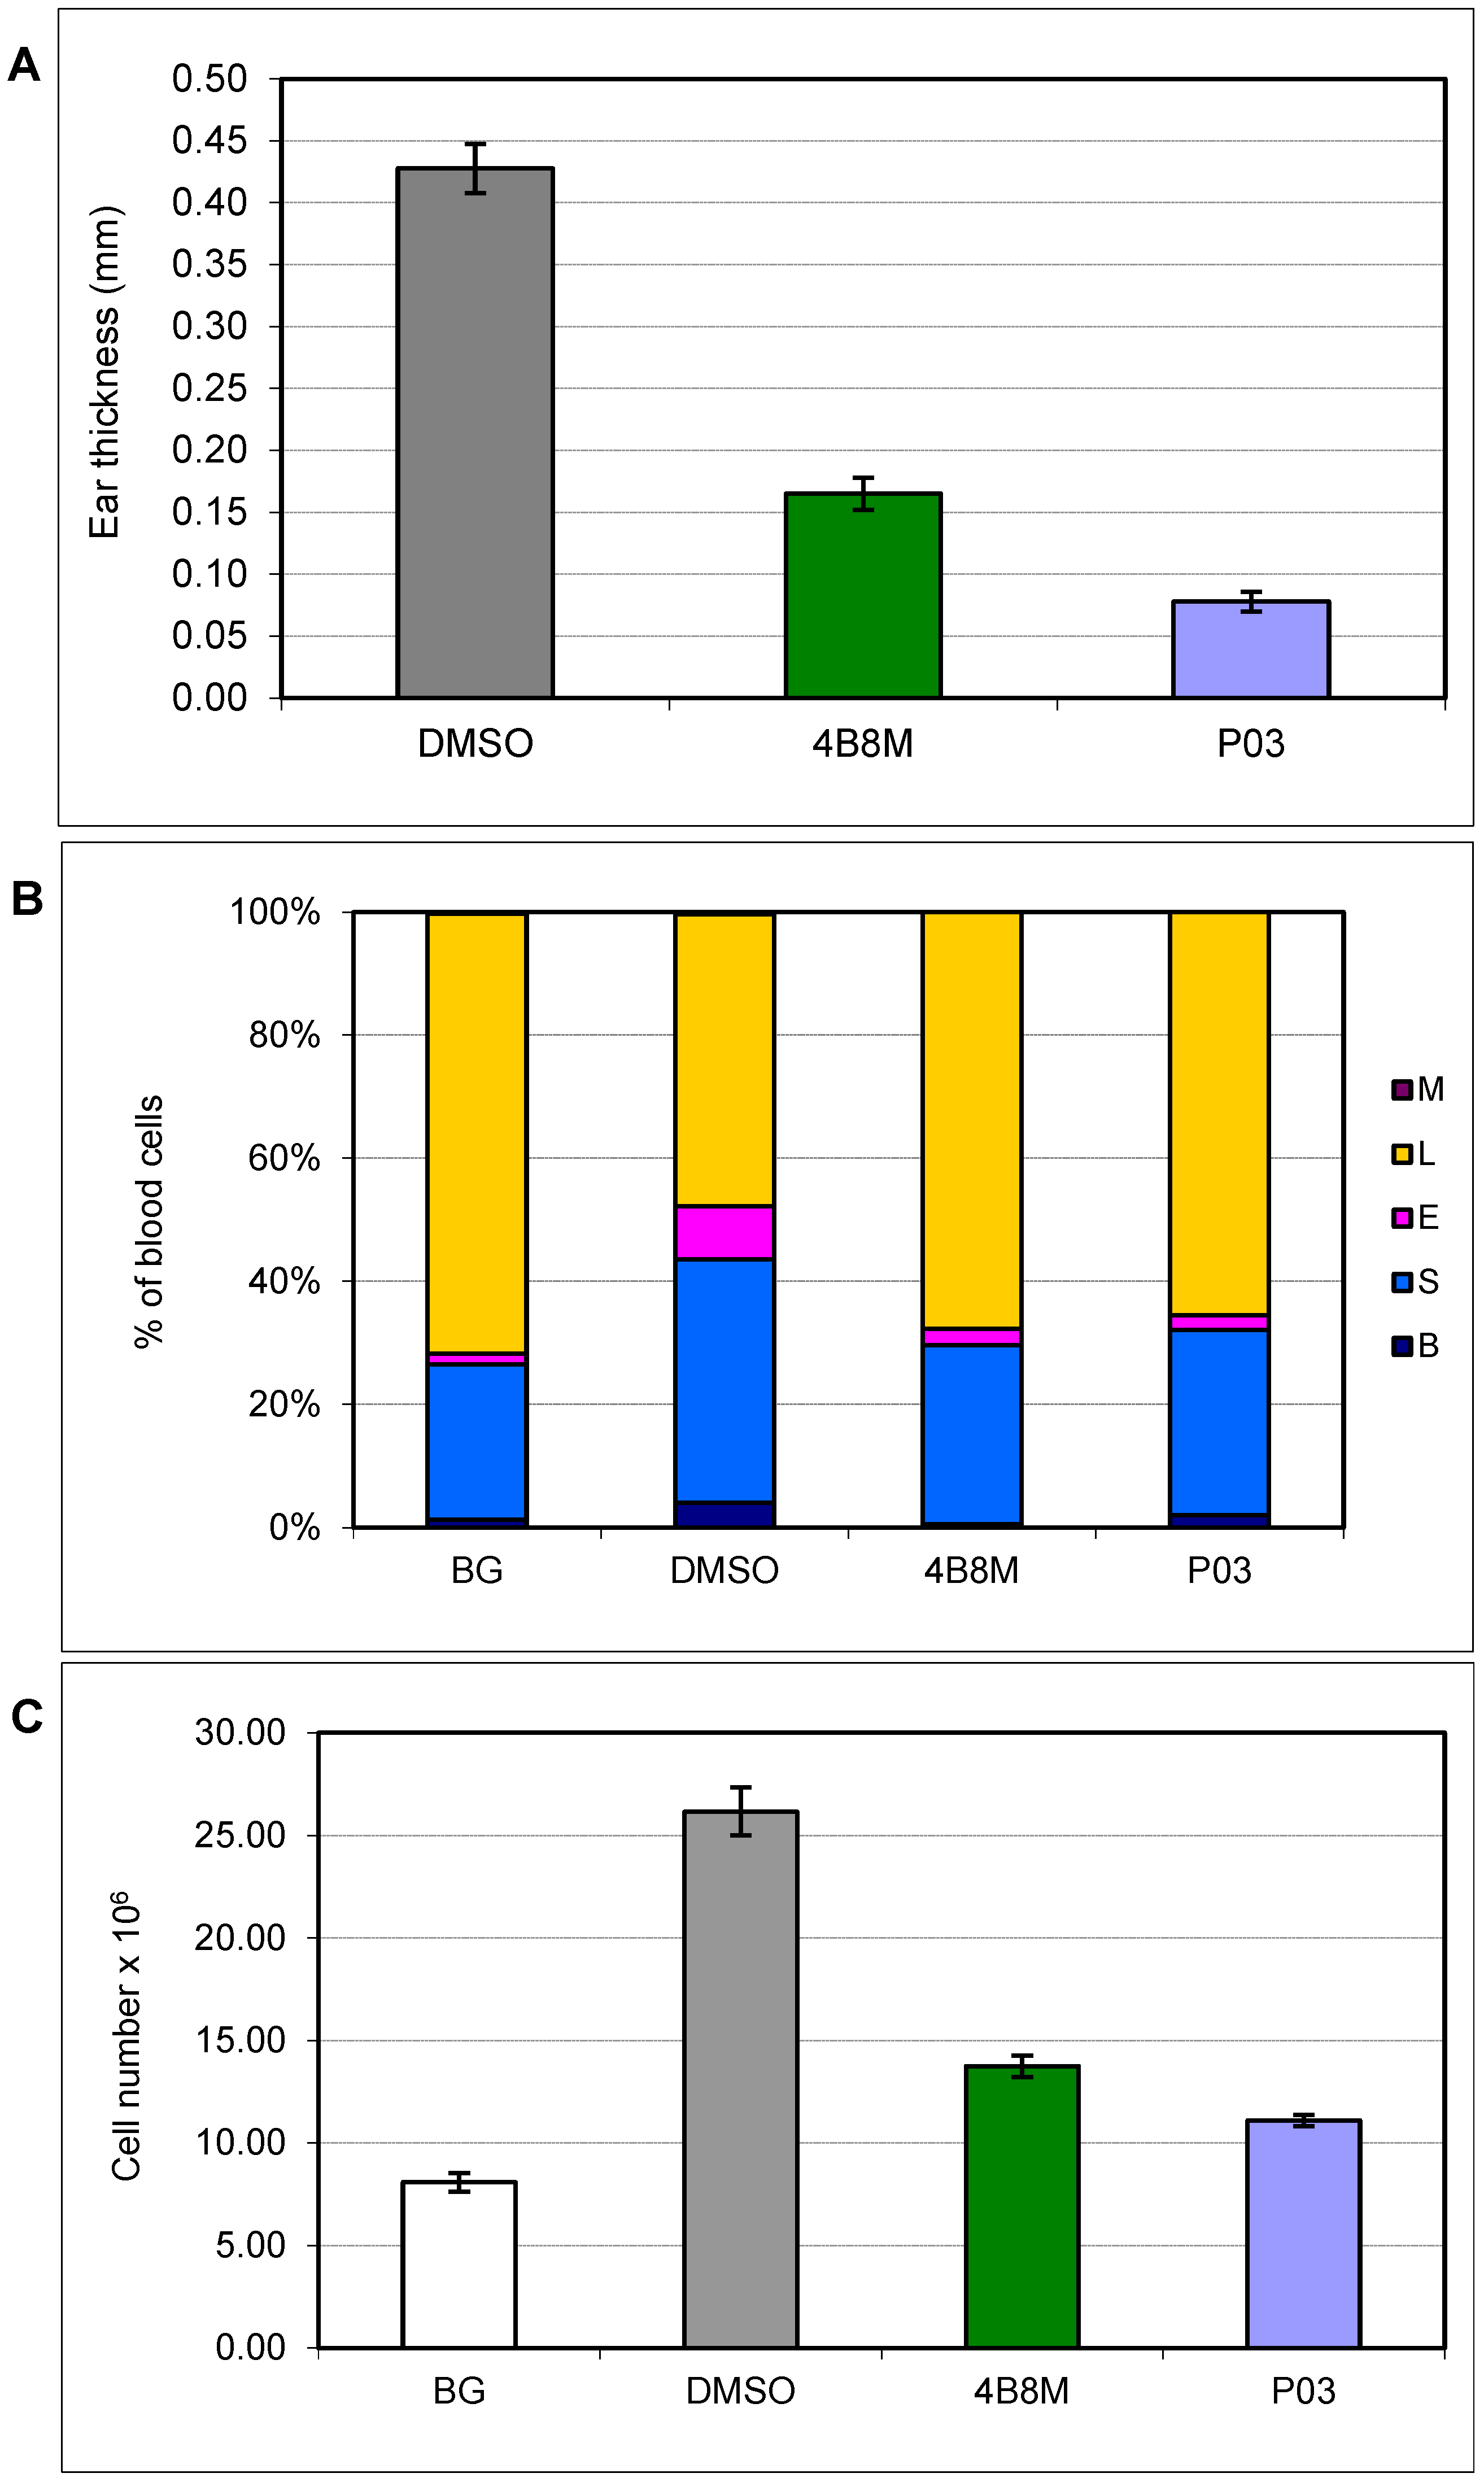
3.3. Contact Sensitivity to Oxazolone
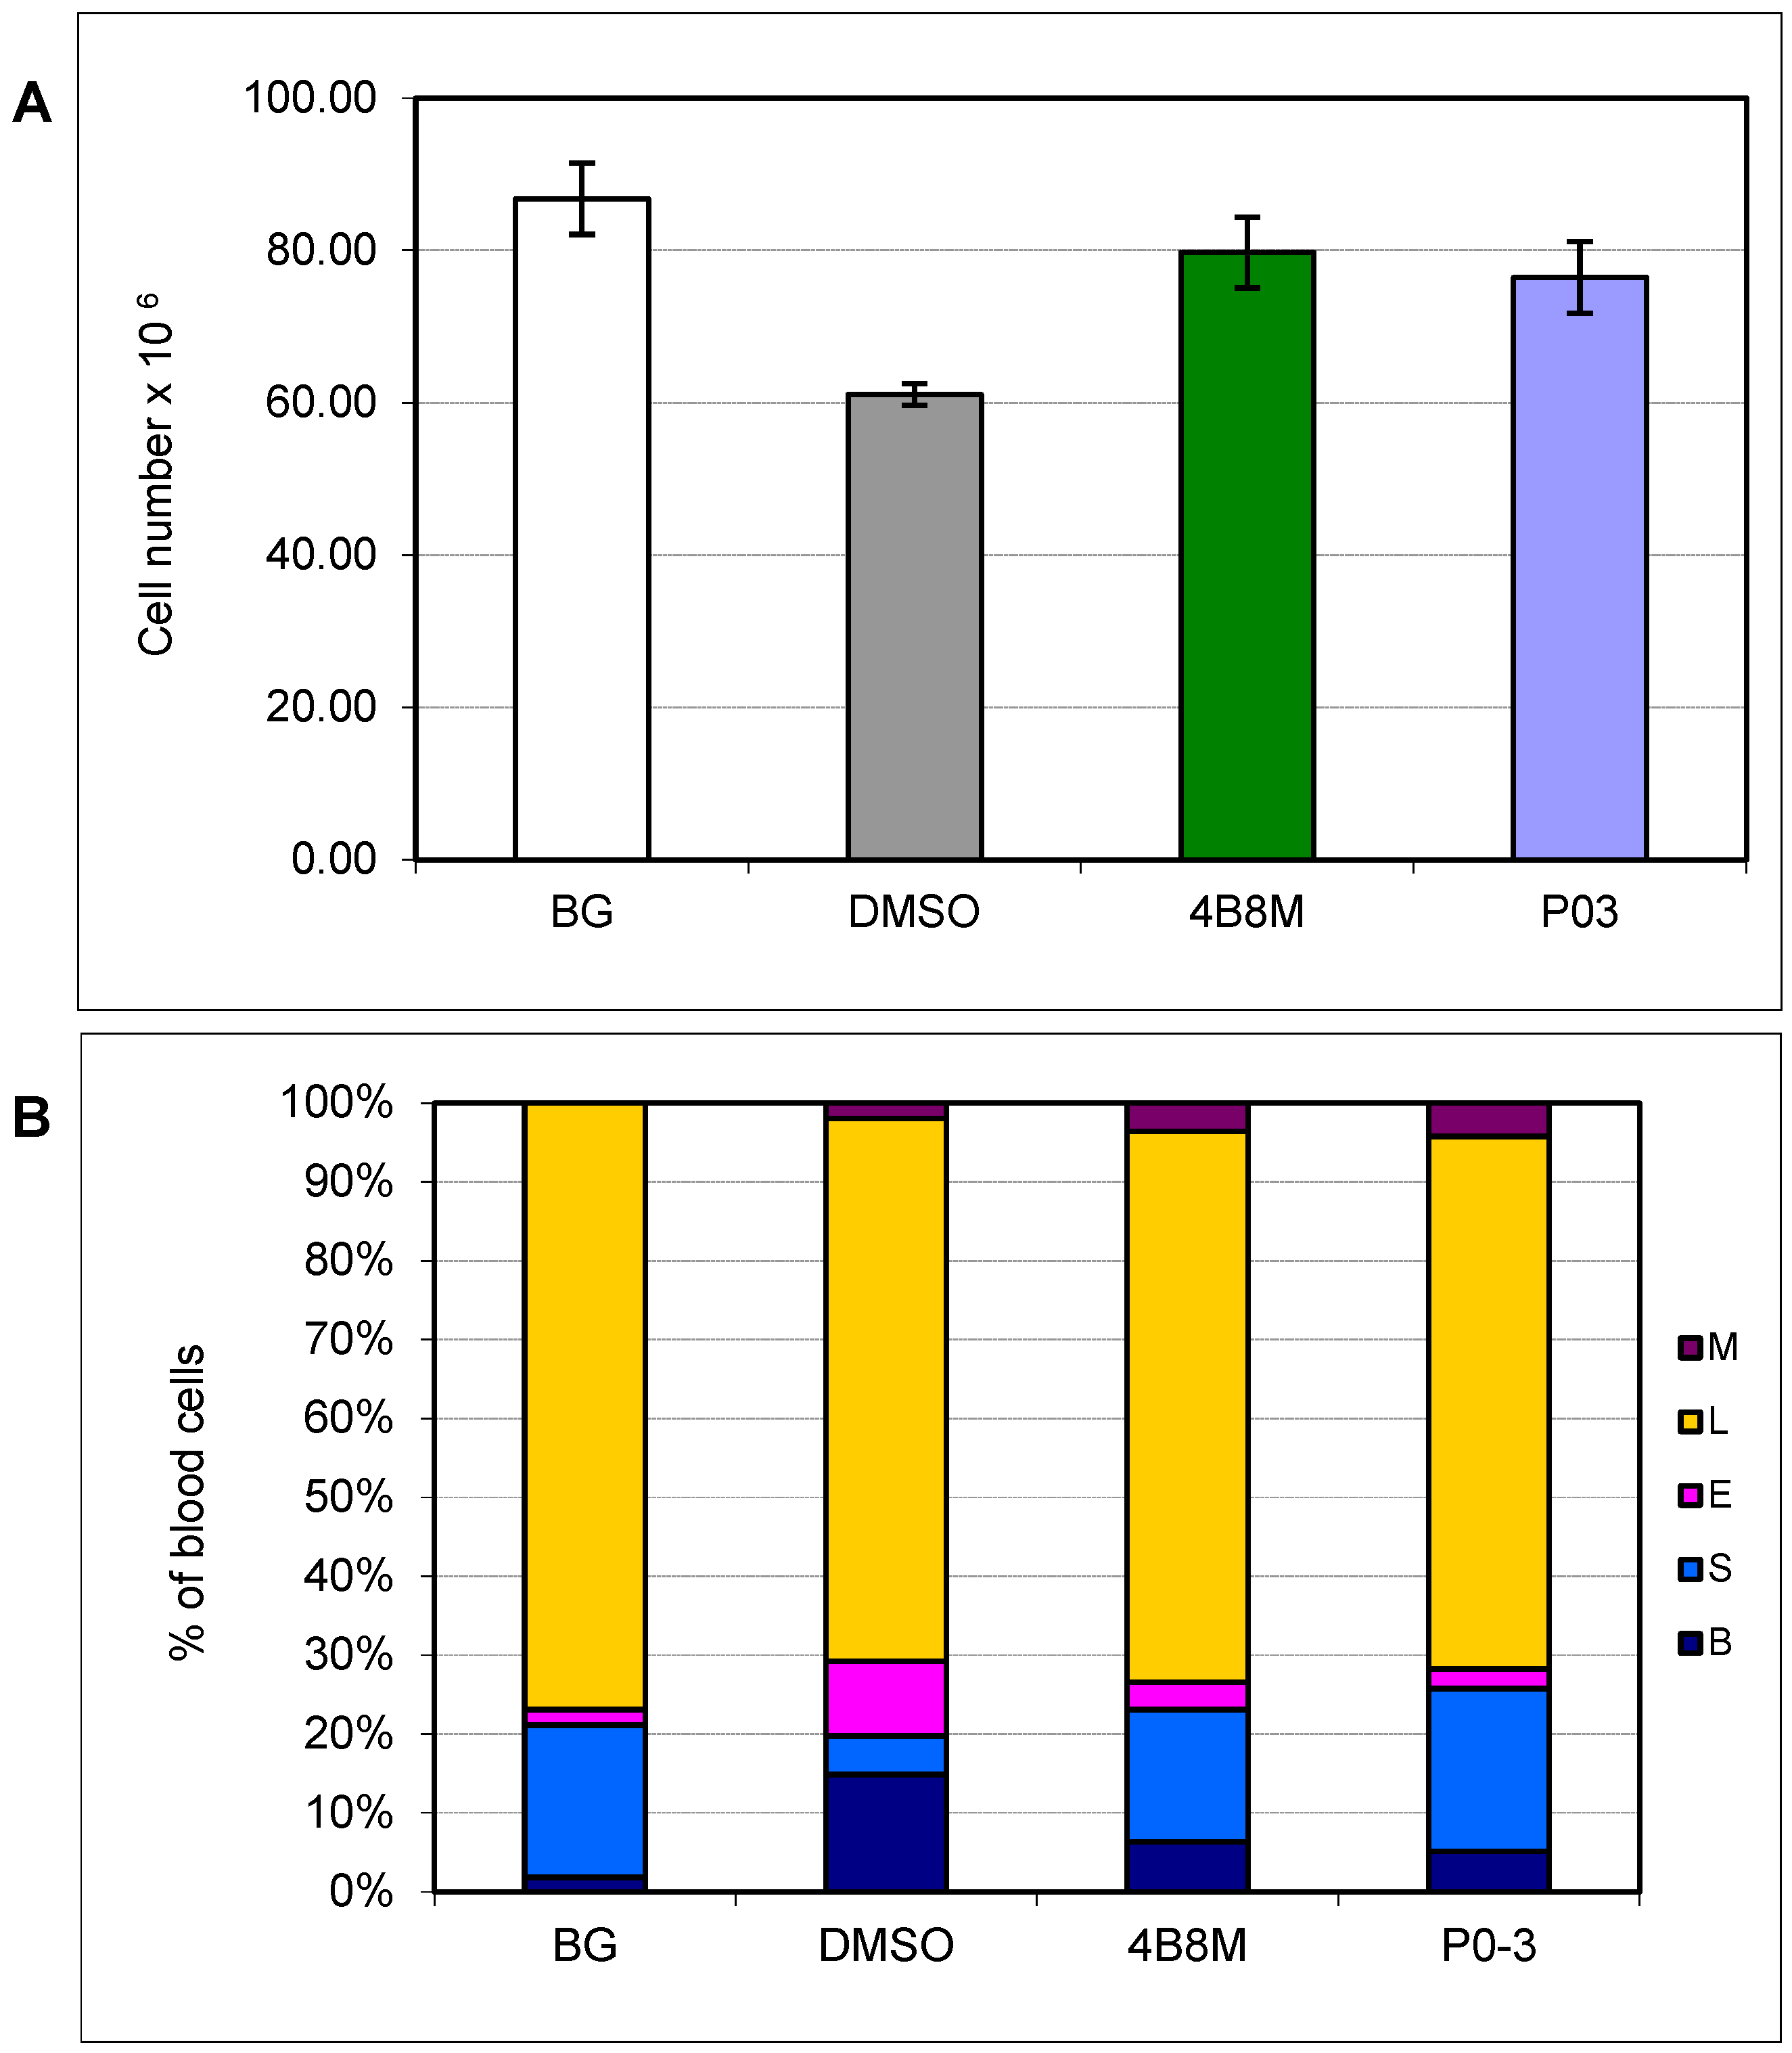
3.4. Carrageenan-Induced Inflammation in Air Pouches
3.5. Effect of P03 on Selected Parameters in Dextran Sulfate-Induced Colitis
3.6. In Silico Activity and Target Prediction Analysis
3.6.1. ADME-T Predictions and Beyond
3.6.2. Toxicity Potential Assessment
3.6.3. Prediction of Peptide Activity
3.6.4. Bioactivity Score Prediction
3.6.5. PASS Analysis
3.6.6. CLC-Pred: Cell-Line Cytotoxicity Prediction
3.6.7. Target Protein Identification
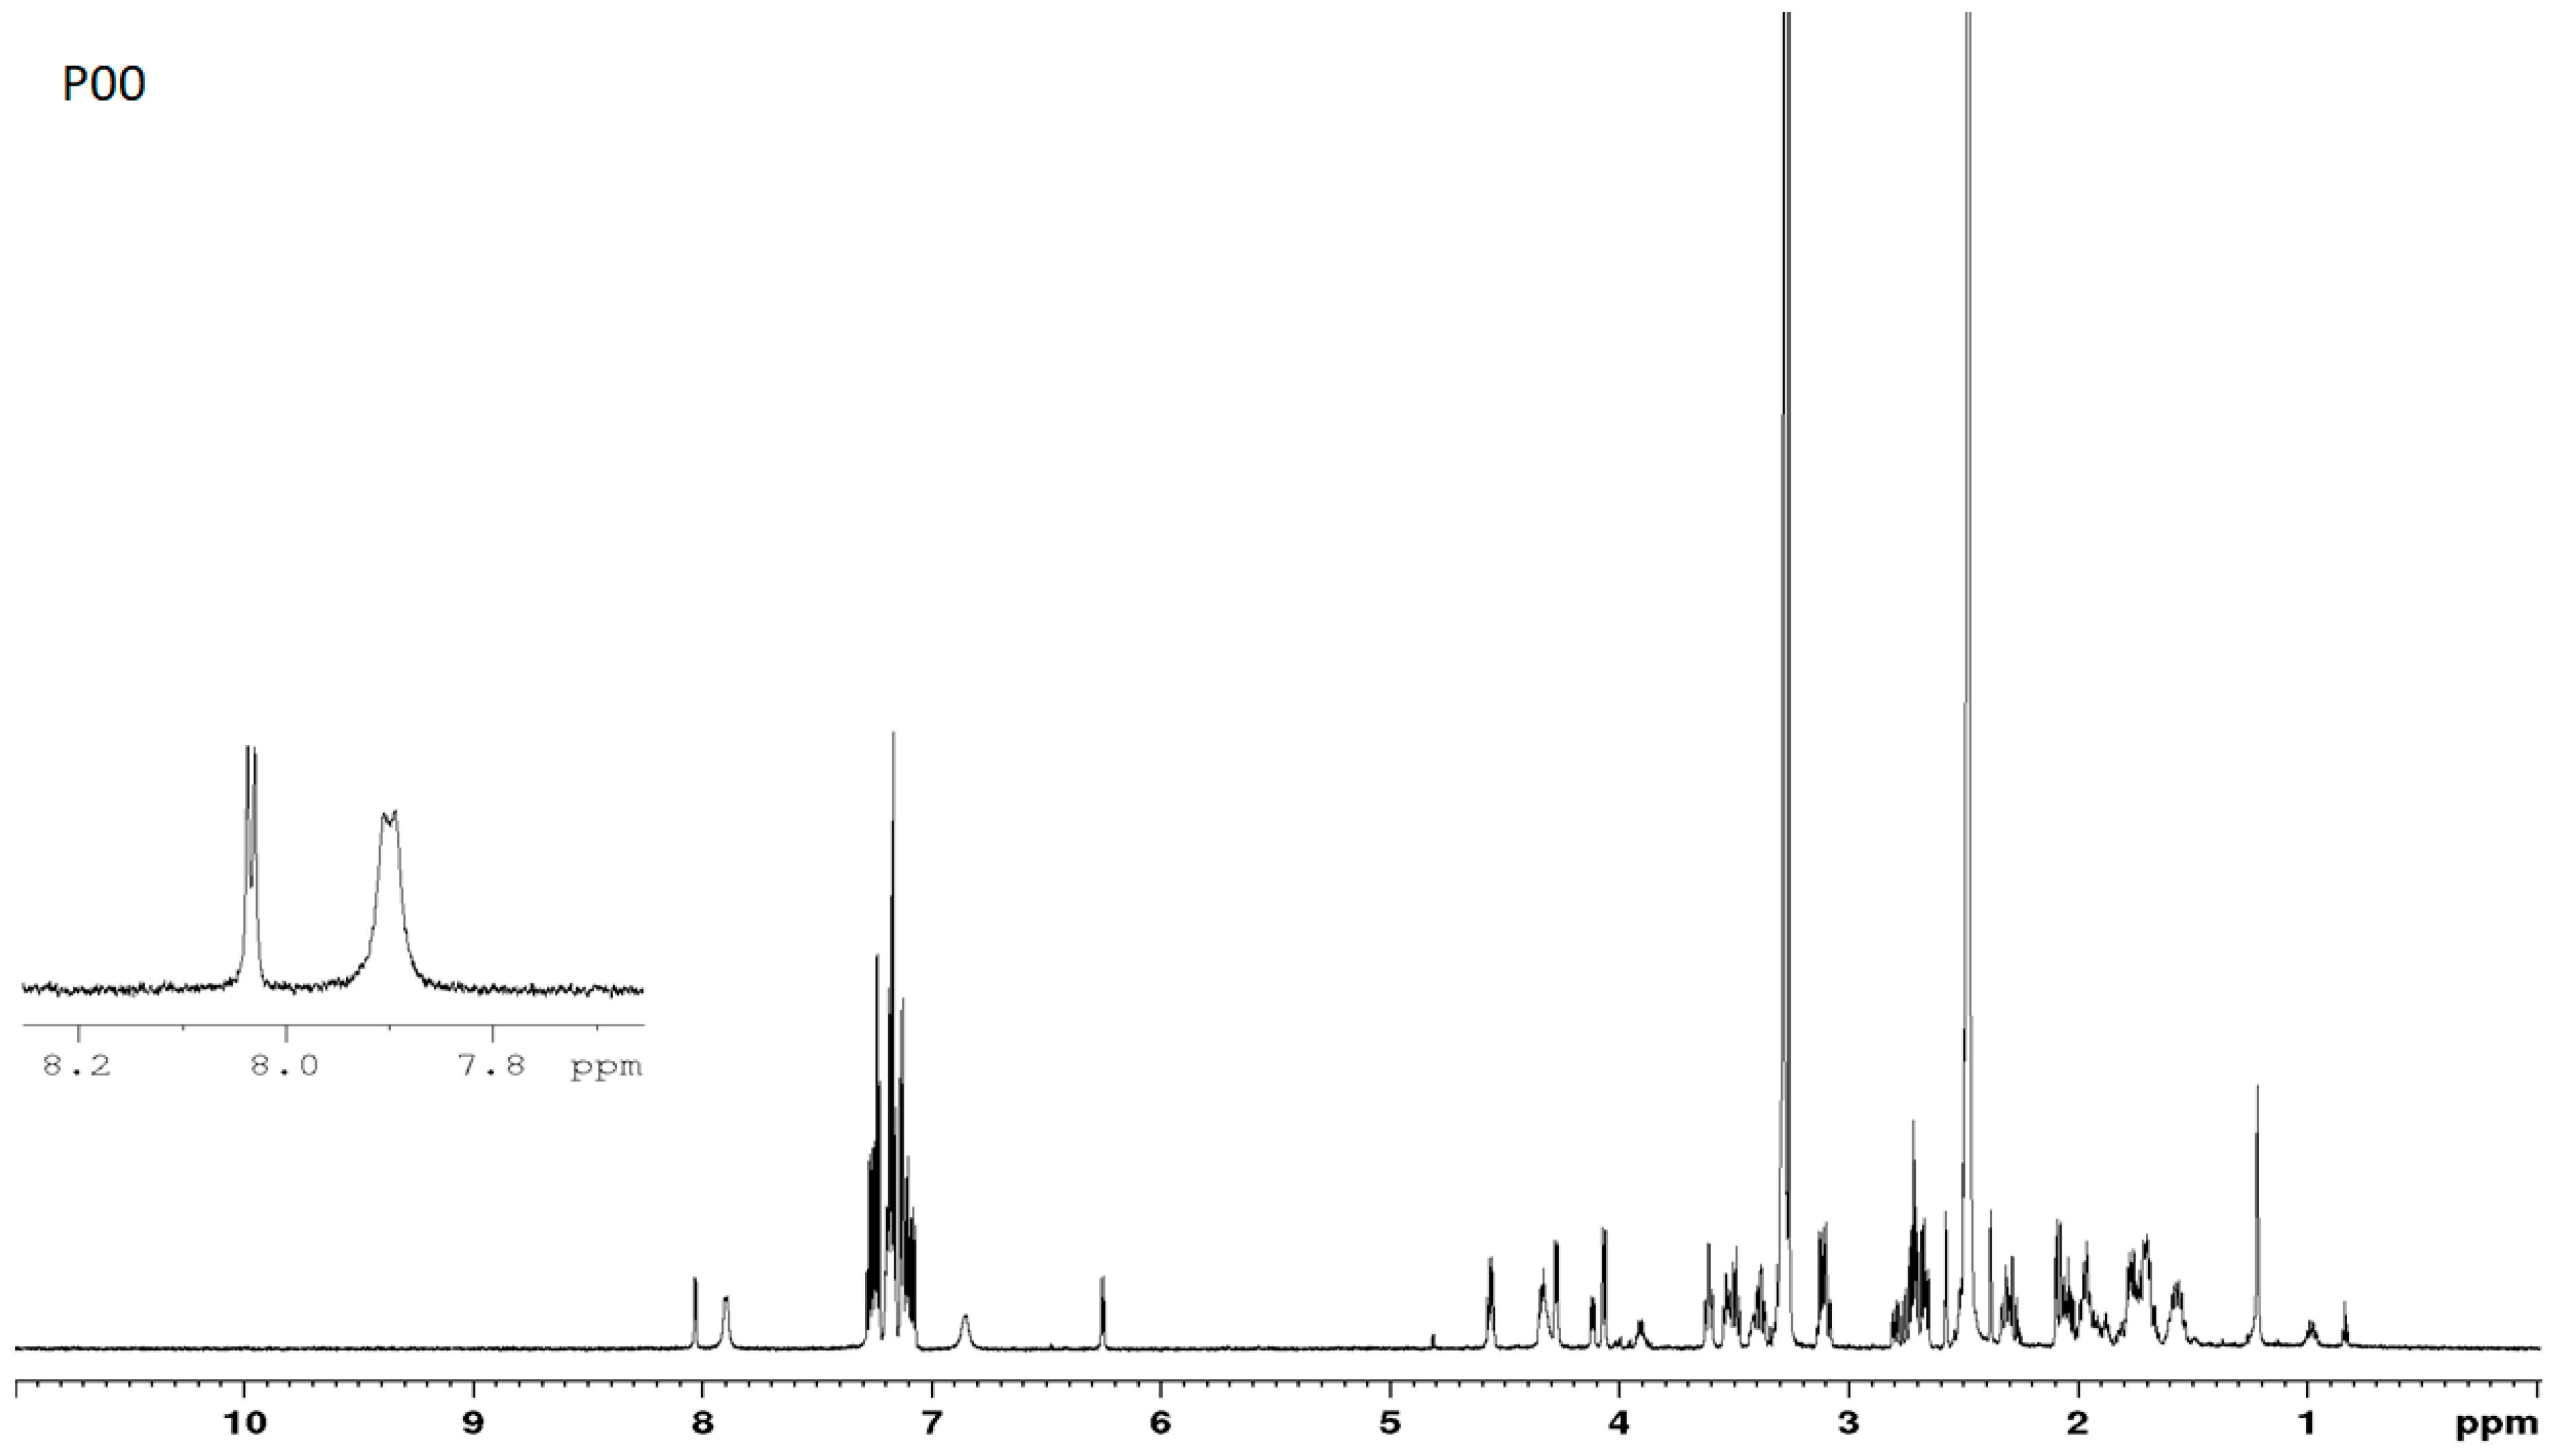
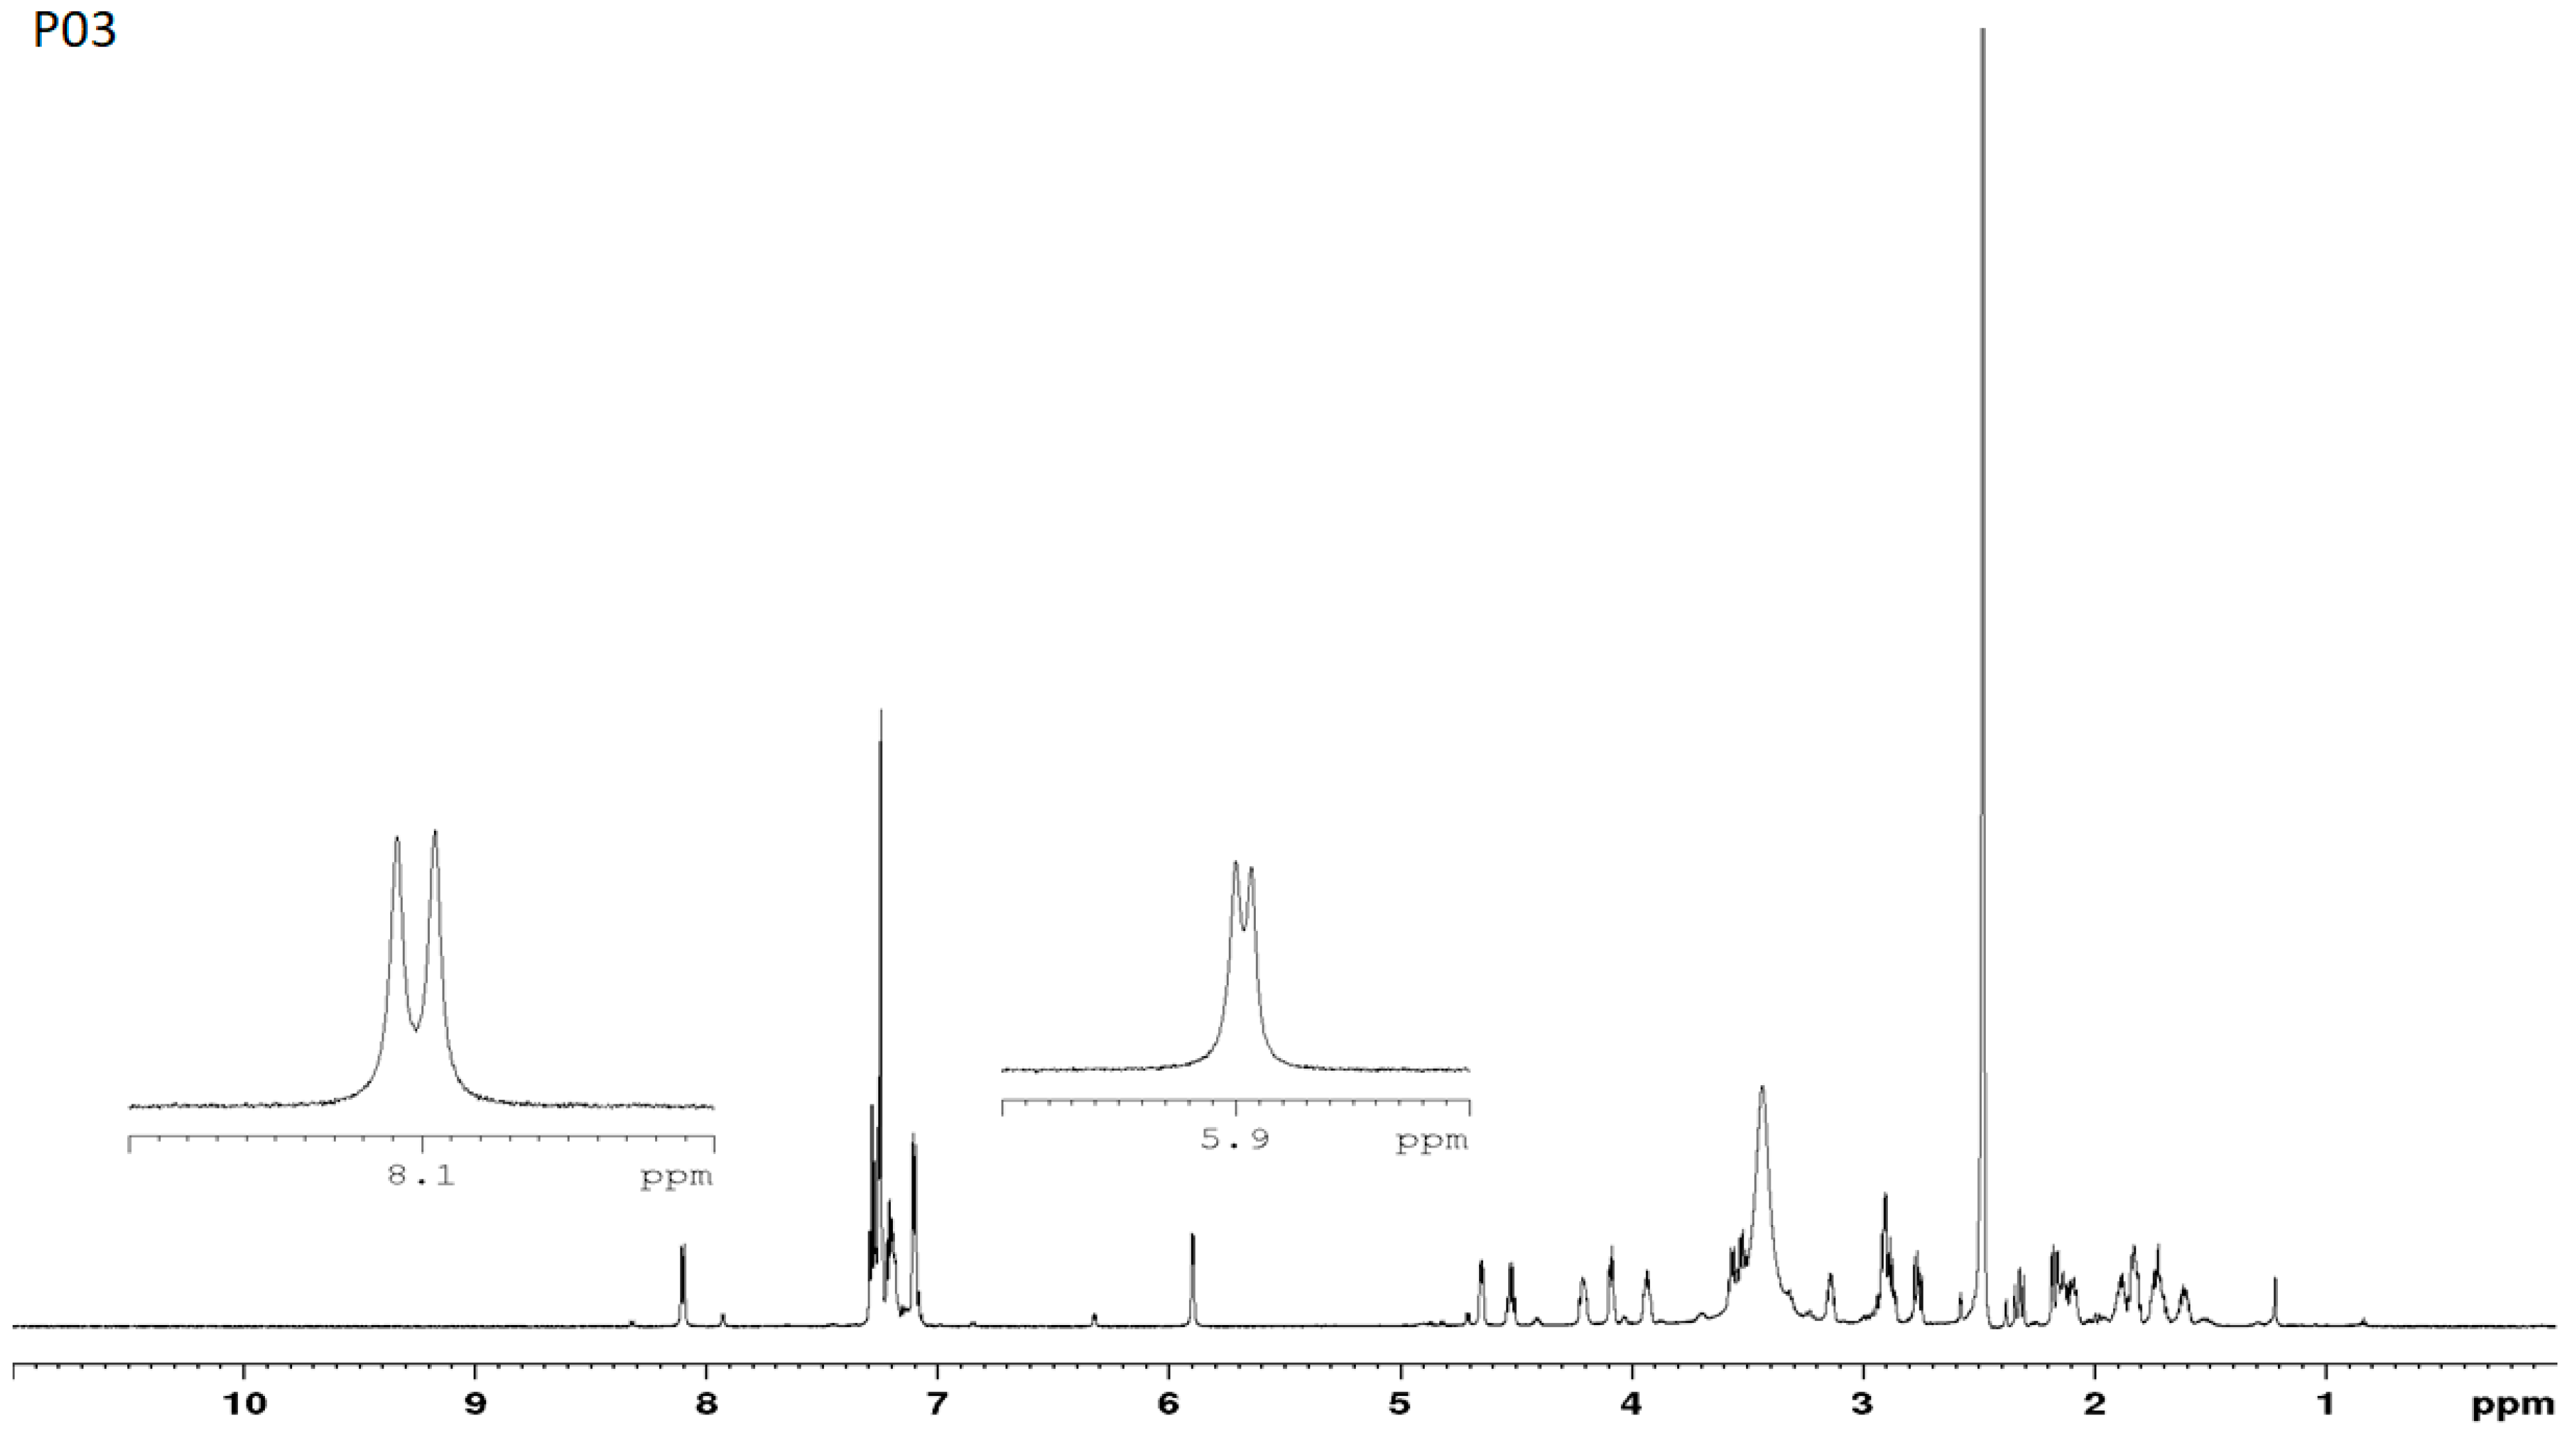
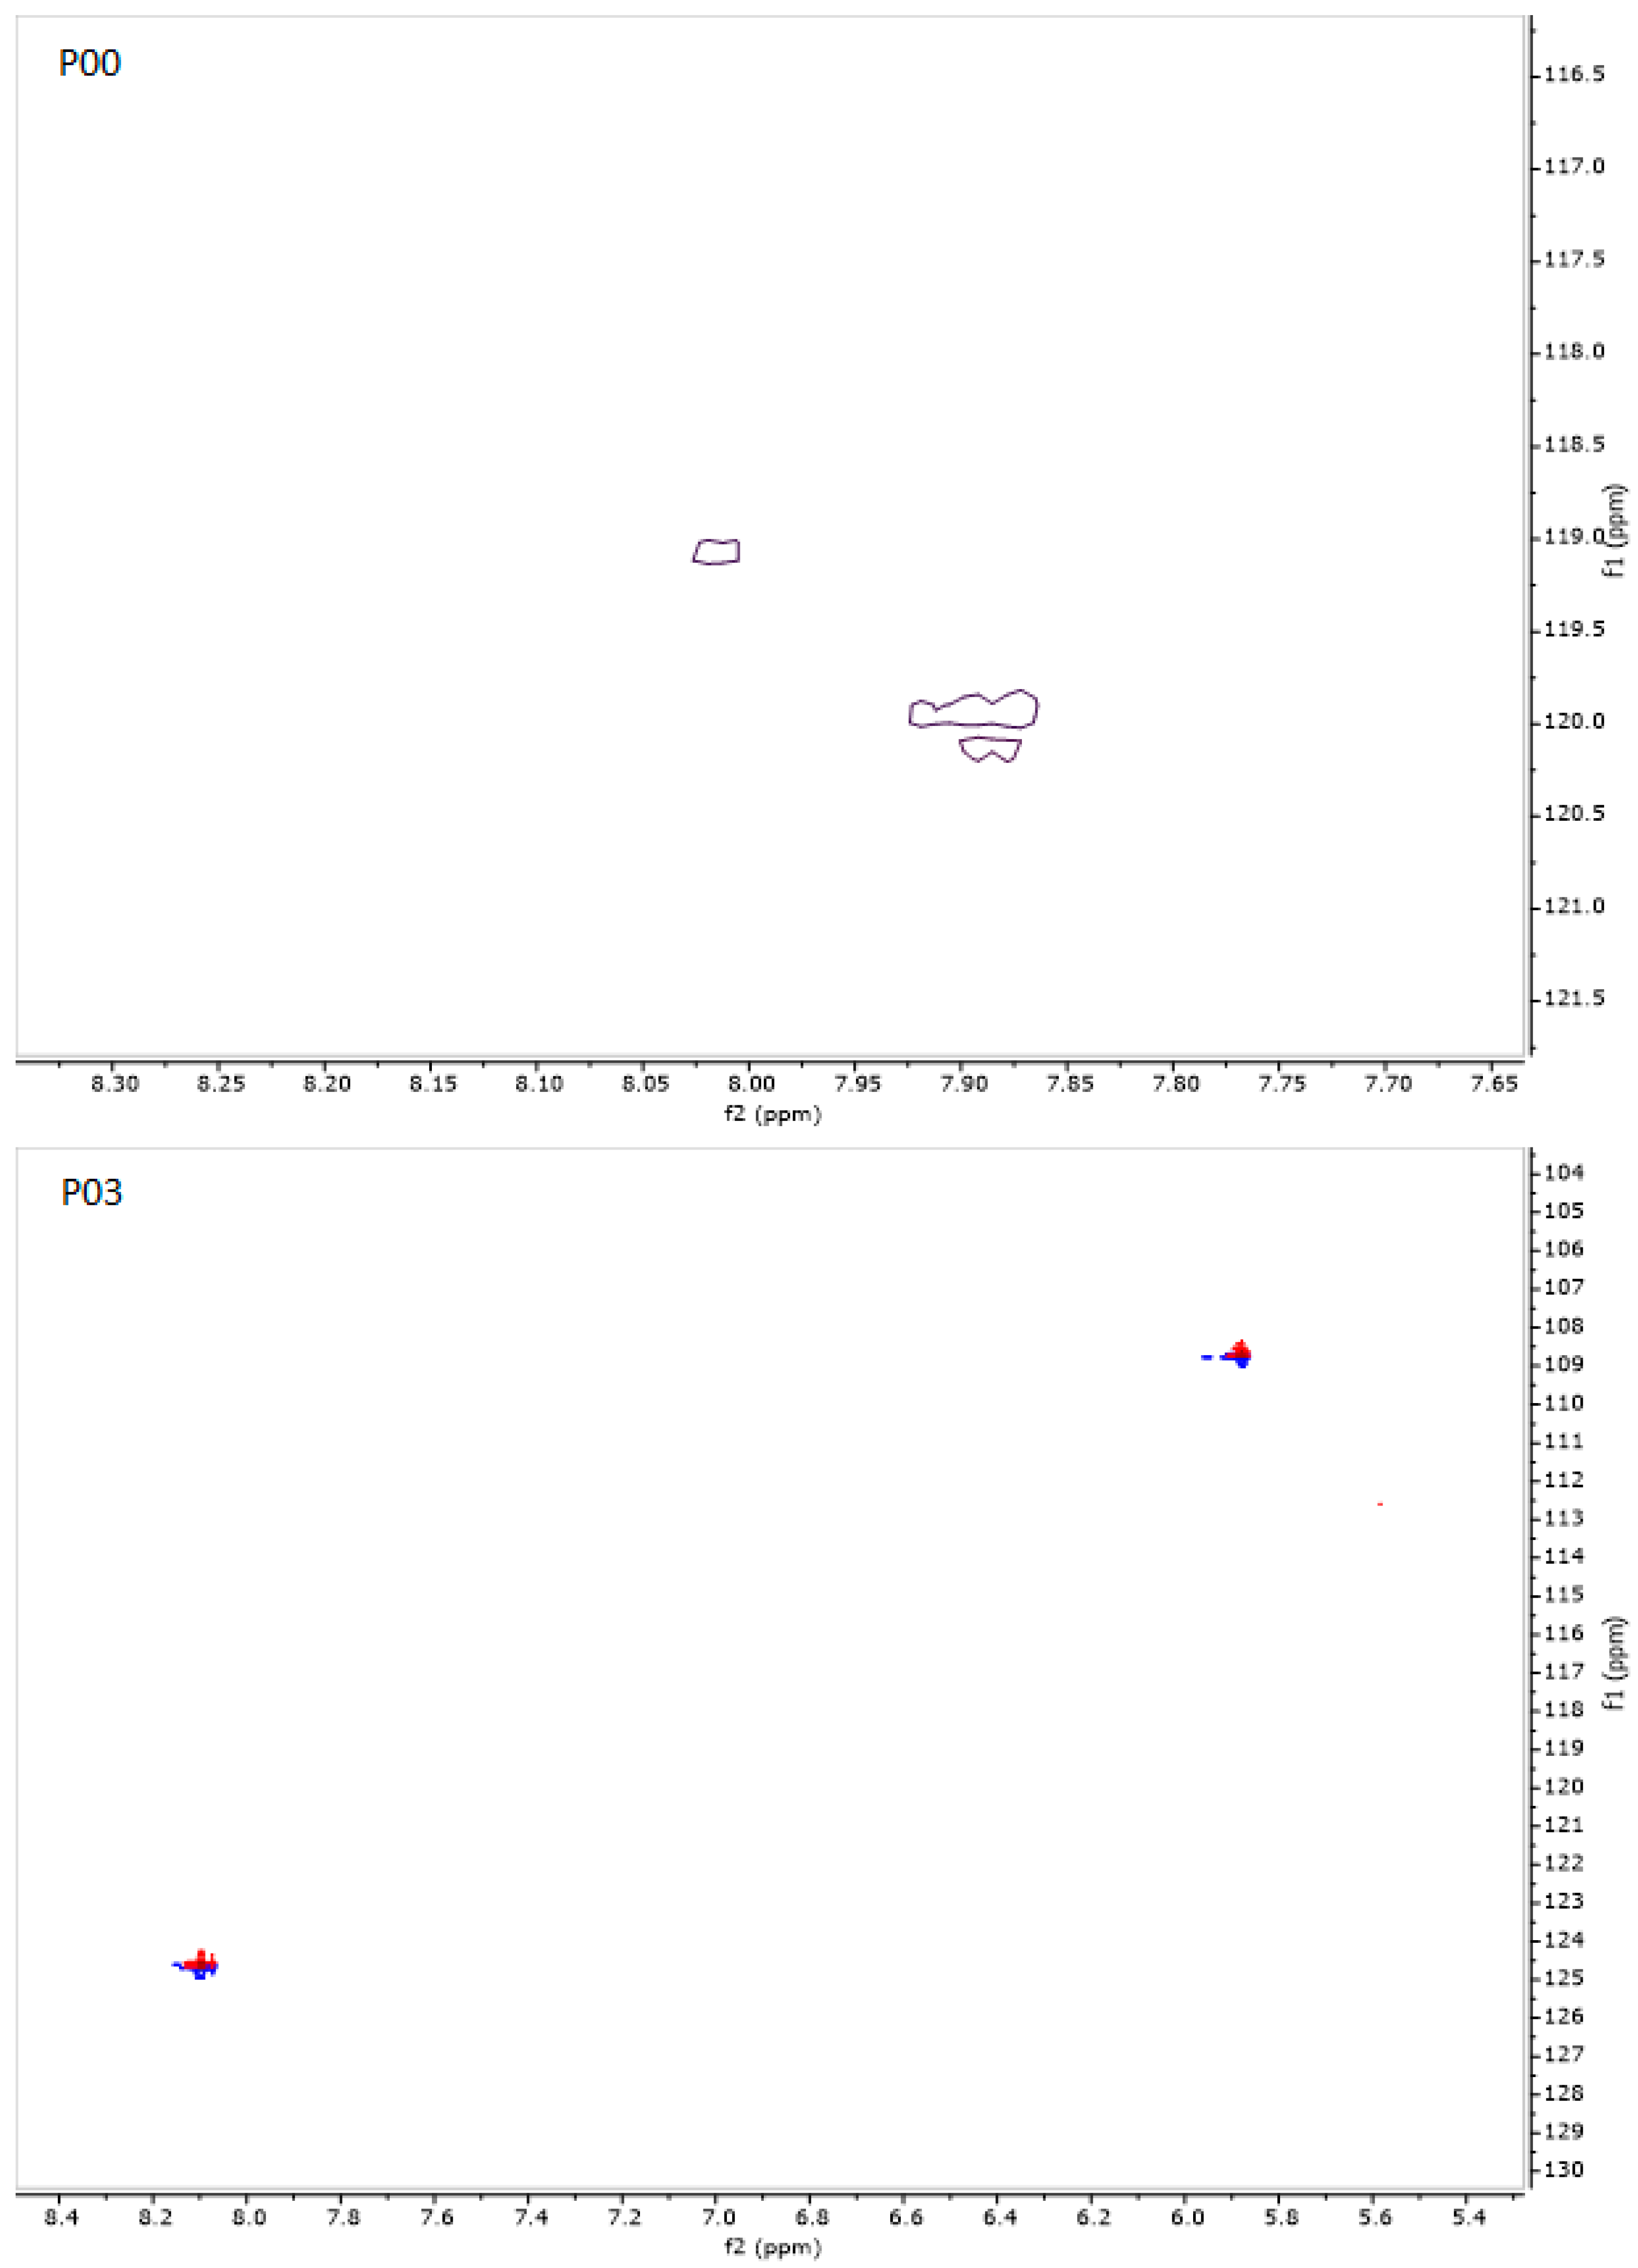
3.7. NMR Studies
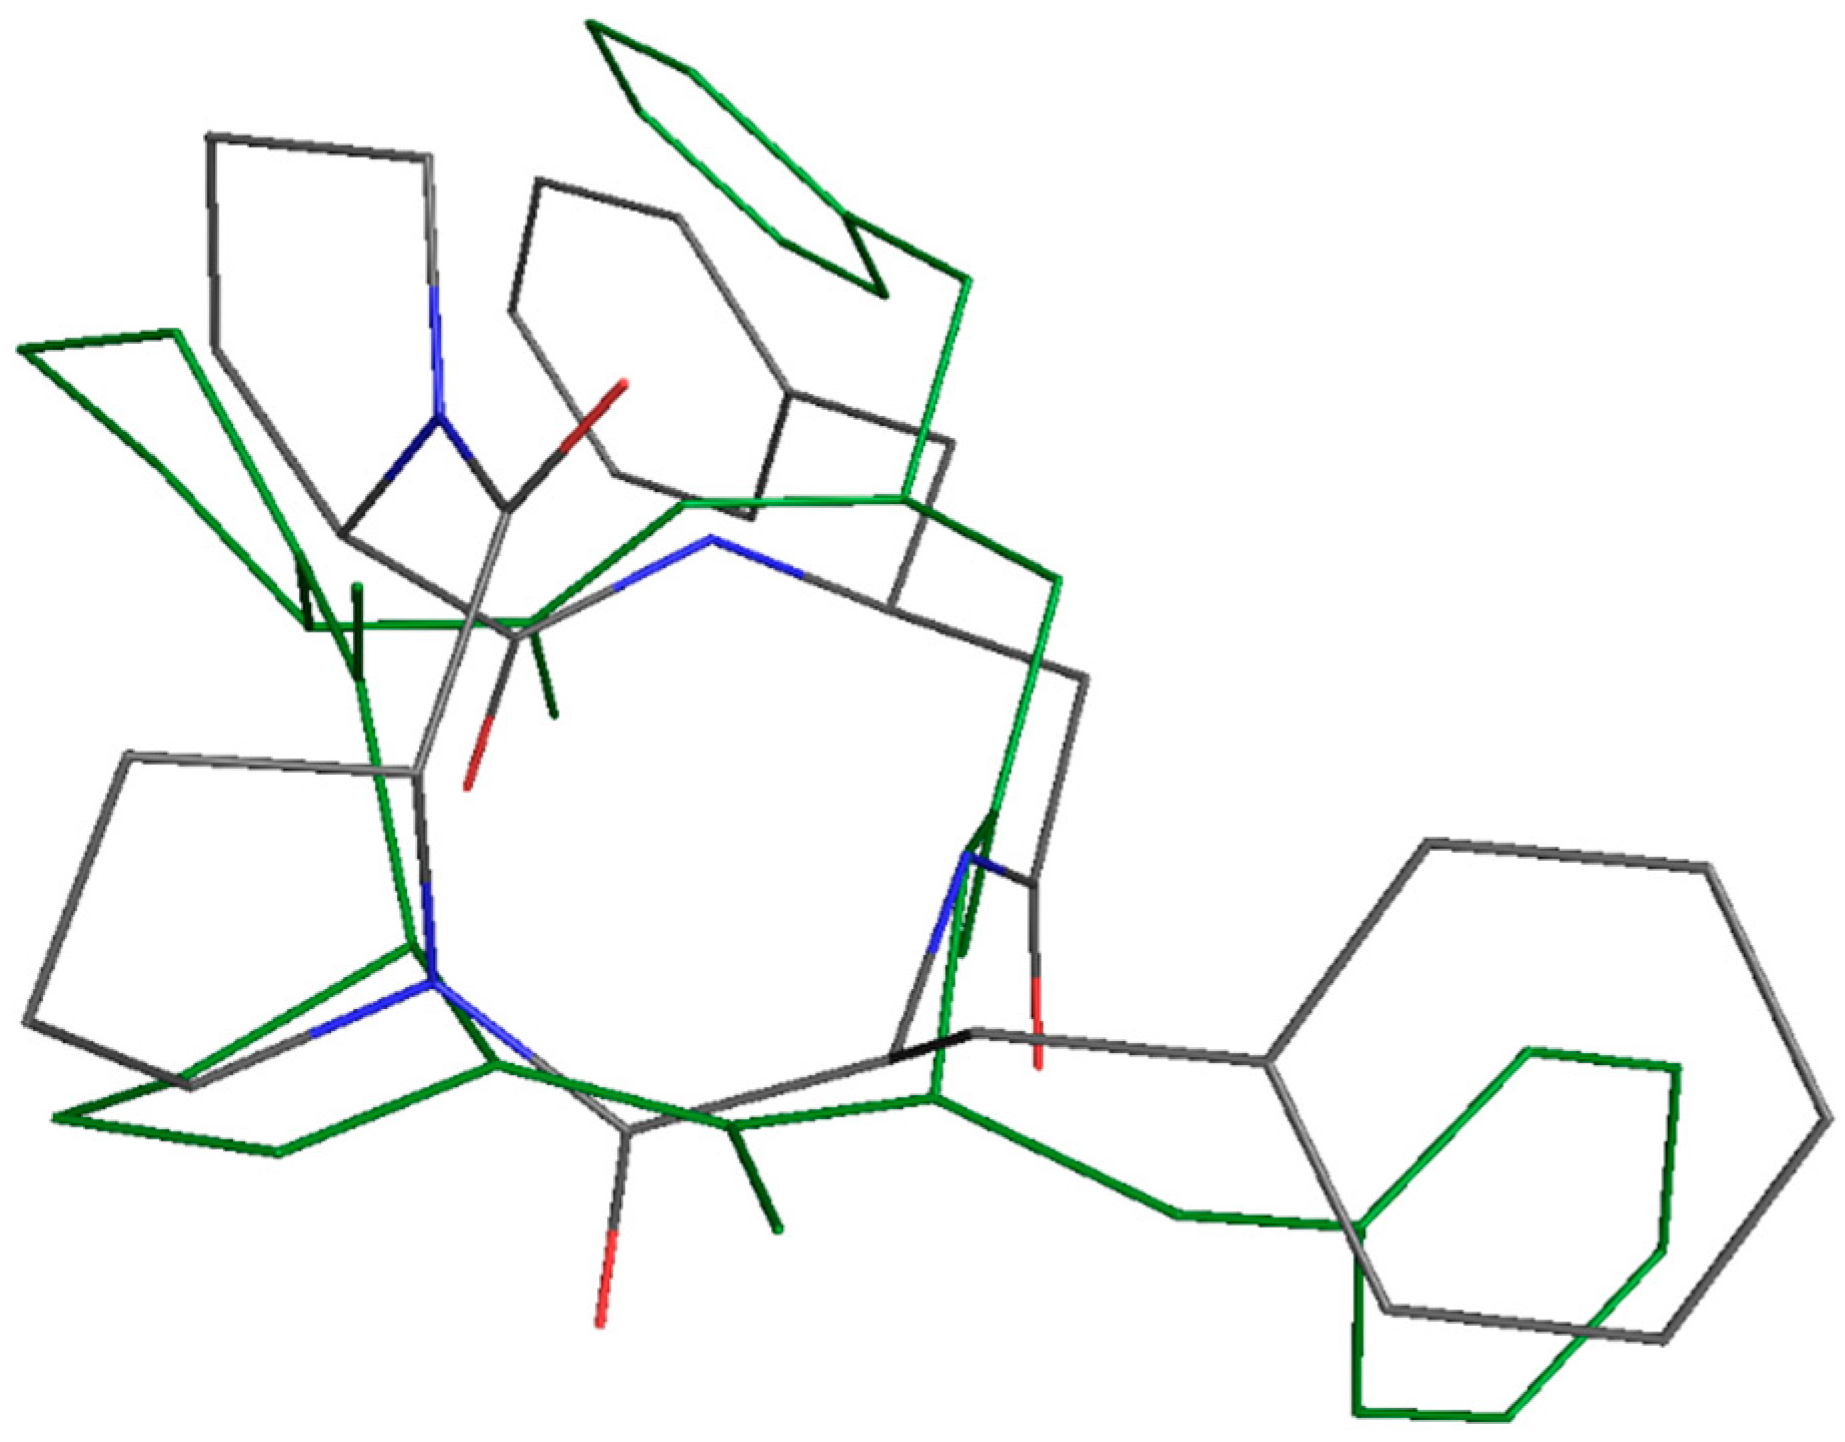
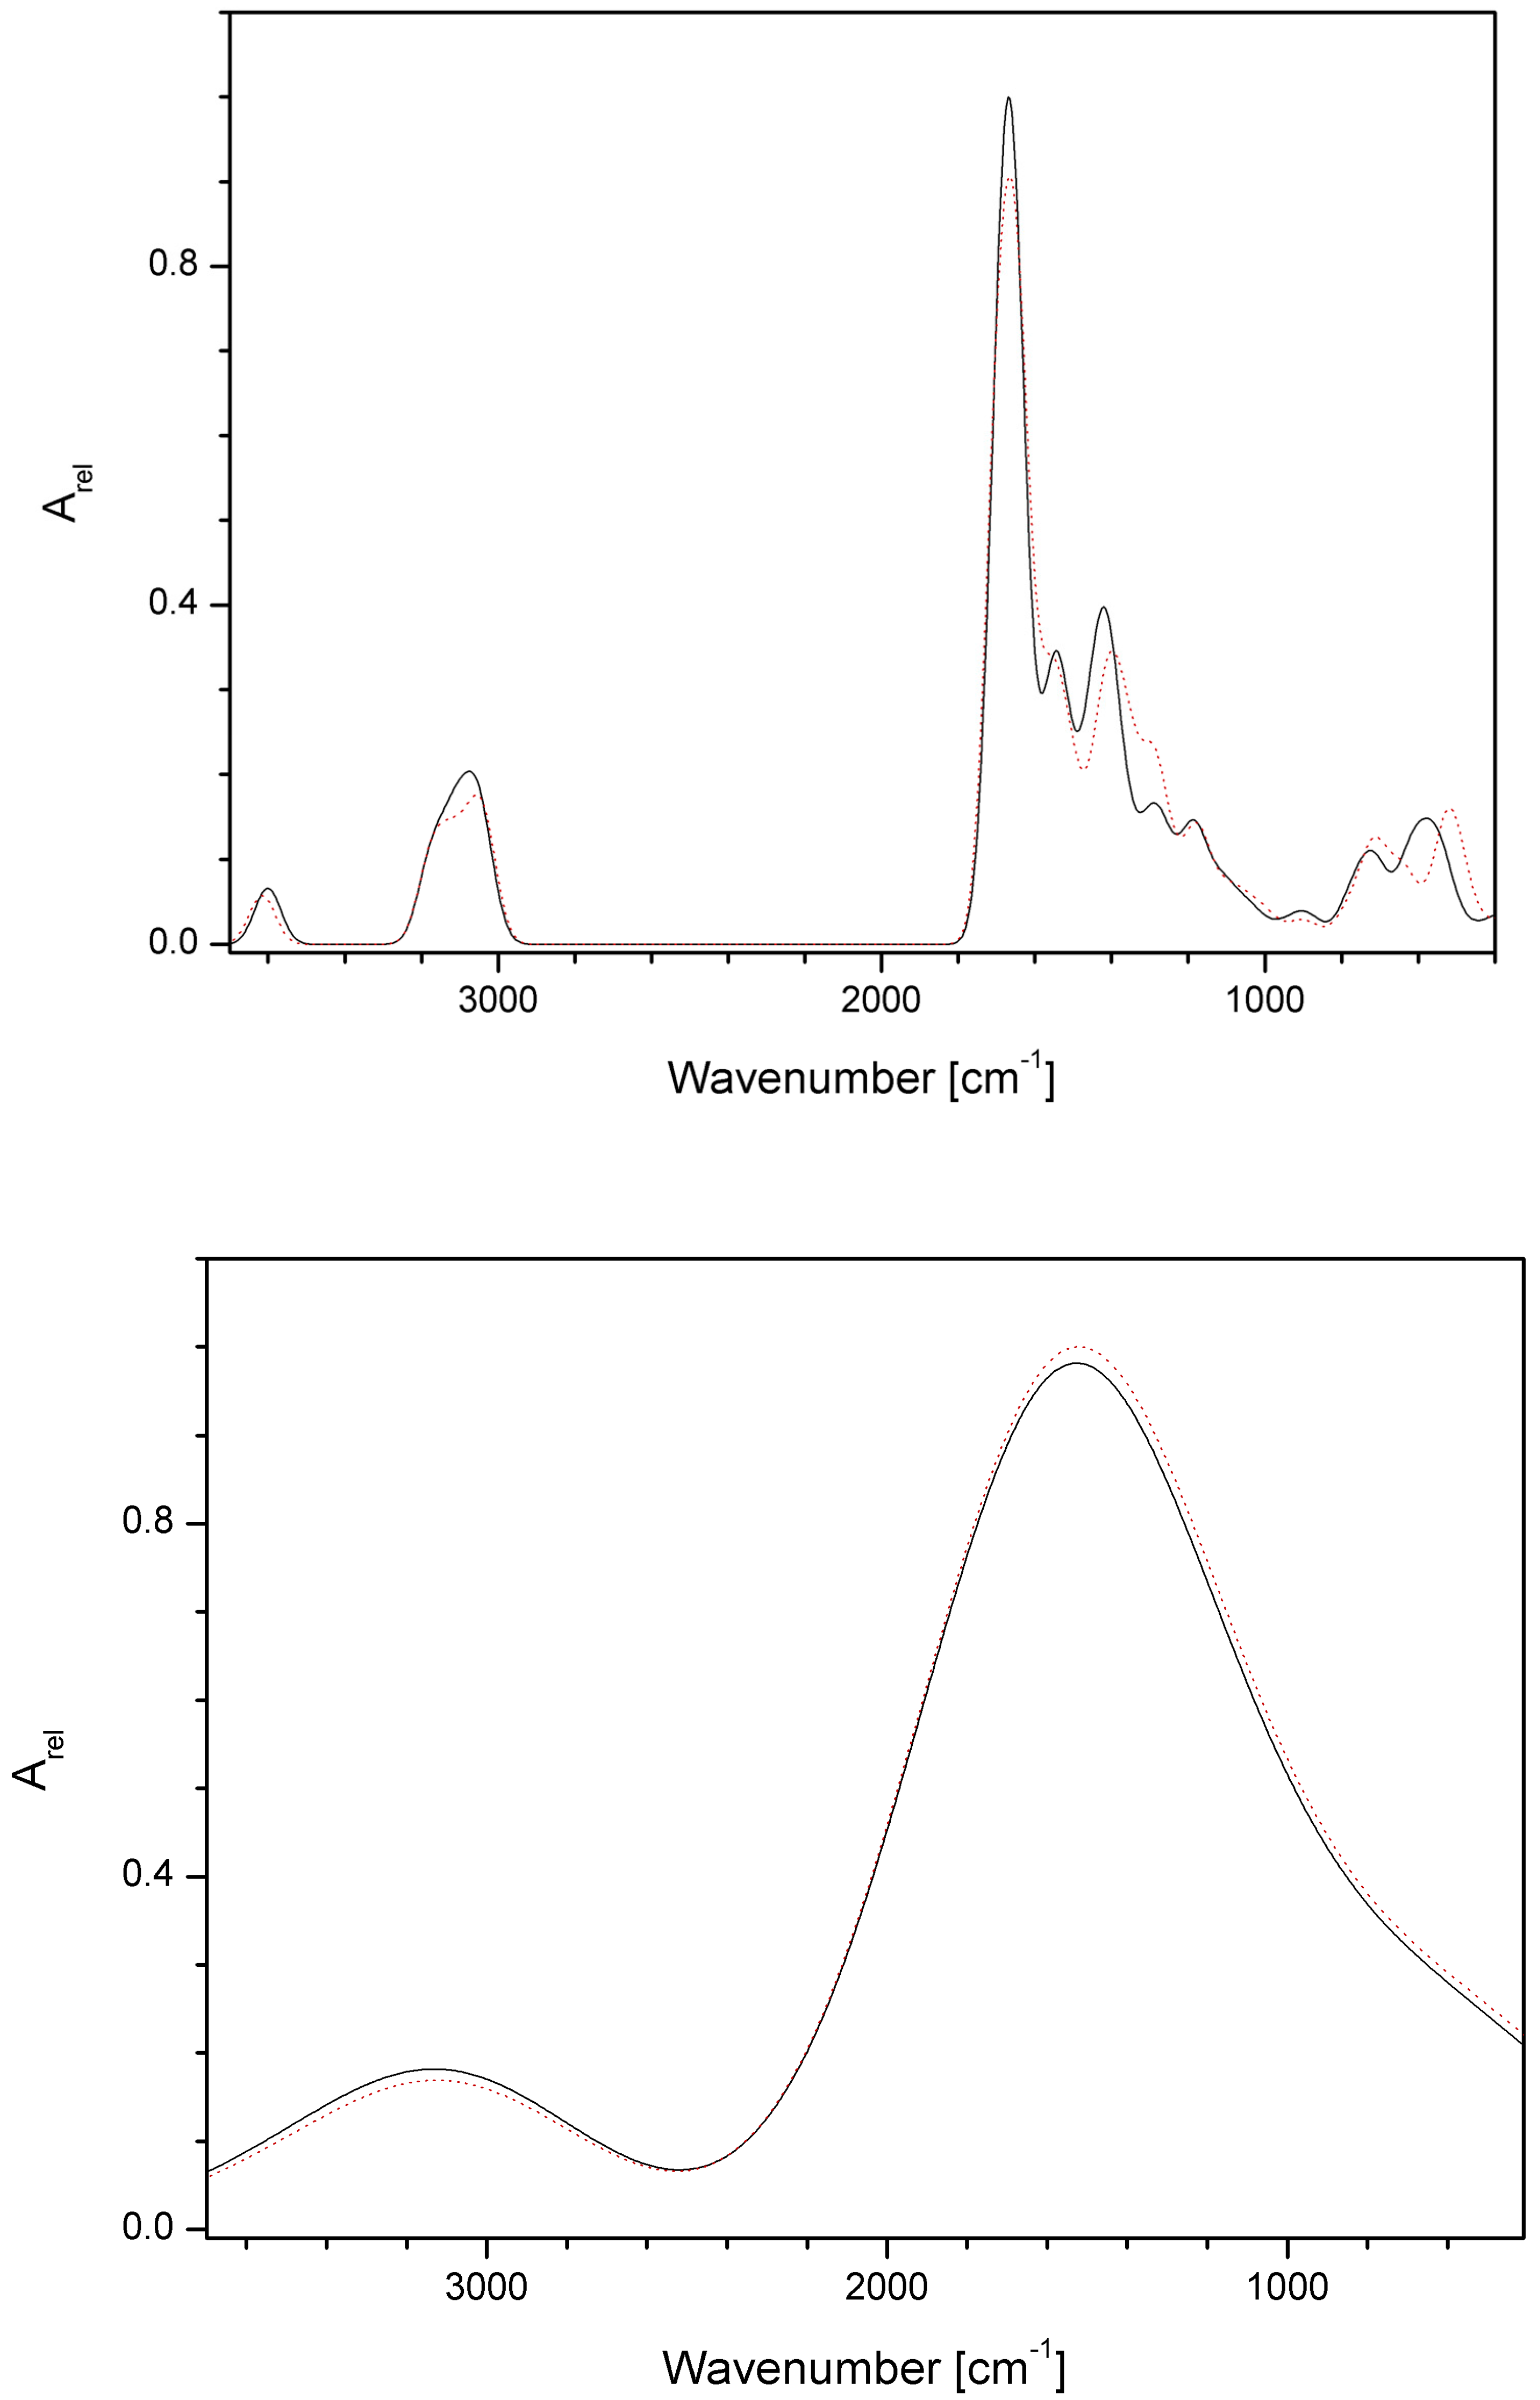
3.8. Results of Quantum-Chemical Calculations
4. Discussion
5. Conclusions
Supplementary Materials
Author Contributions
Funding
Institutional Review Board Statement
Informed Consent Statement
Data Availability Statement
Acknowledgments
Conflicts of Interest
References
- Apostolopoulos, V.; Bojarska, J.; Chai, T.T.; Elnagdy, S.; Kaczmarek, K.; Matsoukas, J.; New, R.; Parang, K.; Lopez, O.P.; Parhiz, H.; et al. A Global Review on Short Peptides: Frontiers and Perspectives. Molecules 2021, 26, 430. [Google Scholar] [CrossRef]
- Abdalla, M.A.; McGaw, L.J. Natural cyclic peptides as an attractive modality for therapeutics: A Mini Review. Molecules 2018, 23, 2080. [Google Scholar] [CrossRef]
- Wang, X.; Lin, M.; Xu, D.; Lai, D.; Zhou, L. Structural diversity and biological activities of fungal cyclic peptides, excluding cyclodipeptides. Molecules 2017, 22, 2069. [Google Scholar] [CrossRef]
- Bojarska, J.; Mieczkowski, A.; Ziora, Z.M.; Skwarczynski, M.; Toth, I.; Shalash, A.O.; Parang, K.; El-Mowafi, S.A.; Mohammed, E.H.M.; Elnagdy, S.; et al. Cyclic dipeptides: The biological and structural landscape with special focus on the anti-cancer proline-based scaffold. Biomolecules 2021, 11, 1515. [Google Scholar] [CrossRef]
- Dard, C.; Leforestier, B.; Hilário, F.F.; Traoré, M.D.M.; Lespinasse, M.-A.; Pérès, B.; Molina, M.-C.; Pereira de Freitas, R.; Milet, A.; Maubon, D.; et al. Crossing of the cystic barriers of Toxoplasma gondii by the fluorescent coumarin tetra-cyclopeptide. Molecules 2021, 26, 7506. [Google Scholar] [CrossRef]
- Wieczorek, Z.; Bengtsson, B.; Trojnar, J.; Siemion, I.Z. Immunosuppressive activity of cyclolinopeptide A. Pept. Res. 1991, 4, 75–83. [Google Scholar]
- Gallo, P.; Saviano, M.; Rossi, F.; Pavone, V.; Pedone, C.; Ragone, R.; Stiuso, P.; Colonna, G. Specific interaction between cyclophilin and cyclic peptides. Biopolymers 1995, 36, 273–281. [Google Scholar] [CrossRef]
- Gaymes, T.J.; Cebrat, M.; Siemion, I.Z.; Kay, E.J. Cyclolinopeptide A (CLA) mediates its immunosuppressive activity through cyclophilin-dependent calcineurin inactivation. FEBS Lett. 1997, 418, 224–227. [Google Scholar] [CrossRef]
- Zimecki, M.; Kaczmarek, K. Effects of modifications on the immunosuppressive properties of cyclolinopeptide A and its linear analogs in animal experimental models. Molecules 2021, 26, 2538. [Google Scholar] [CrossRef]
- Zabrocki, J.; Zimecki, M.; Kaszuba, A.; Kaczmarek, K. Cyclic Tetrapeptides and Therapeutic Applications Thereof. U.S. Patent 09382292, 5 July 2016. [Google Scholar]
- Zimecki, M.; Artym, J.; Kałas, W.; Strządała, L.; Kaleta-Kuratewicz, K.; Kuryszko, J.; Kaszuba, A.; Kaczmarek, K.; Zabrocki, J. Anti-inflammatory activity of a cyclic tetrapeptide in mouse and human experimental models. Pharmaceutics 2020, 12, 1030. [Google Scholar] [CrossRef]
- Zaczyńska, E.; Kaczmarek, K.; Zabrocki, J.; Artym, J.; Zimecki, M. Antiviral Activity of a Cyclic Pro-Pro-β3-HoPhe-Phe Tetrapeptide against HSV-1 and HAdV-5. Molecules 2022, 27, 3552. [Google Scholar] [CrossRef]
- Bojarska, J.; Breza, M.; Remko, M.; Czyz, M.; Gajos-Michniewicz, A.; Zimecki, M.; Kaczmarek, K.; Madura, I.D.; Wojciechowski, J.M.; Wolf, W.M. Structural and Biofunctional Insights into the Cyclo(Pro-Pro-Phe-Phe-) Scaffold from Experimental and In Silico Studies: Melanoma and Beyond. Int. J. Mol. Sci. 2022, 23, 7173. [Google Scholar] [CrossRef]
- Drygała, P.; Olejnik, J.; Mazur, A.; Kierus, K.; Jankowski, S.; Zimecki, M.; Zabrocki, J. Synthesis and immunosuppressive activity of cyclolinopeptide A analogues containing homophenylalanine. Eur. J. Med. Chem. 2009, 44, 3731–3738. [Google Scholar] [CrossRef]
- Jędrzejczak, K.; Hrynczyszyn, P.; Artym, J.; Kocięba, M.; Zimecki, M.; Zabrocki, J.; Jankowski, S. Synthesis and biological activity of cyclolinopeptide A analogues modified with γ3-bis(homophenylalanine). Eur. J. Med. Chem. 2014, 86, 515–527. [Google Scholar] [CrossRef]
- Jędrzejczak, K.; Hrynczyszyn, P.; Szczesio, M.; Artym, J.; Jastrząbek, T.; Kocięba, M.; Główka, M.; Huben, K.; Kochanowska, I.; Zimecki, M.; et al. Synthesis and biological activity of cyclolinopeptide A analogues modified with γ 4-bis(homo-phenylalanine). Bioorganic Med. Chem. 2017, 25, 4265–4276. [Google Scholar] [CrossRef]
- Katarzyńska, J.; Artym, J.; Kochanowska, I.; Jędrzejczak, K.; Zimecki, M.; Lisowski, M.; Wieczorek, R.; Piotrowski, Ł.; Marcinek, A.; Zabrocki, J.; et al. 4-Methylpseudoproline analogues of cyclolinopeptide A: Synthesis, structural analysis and evaluation of their suppressive effects in selected immunological assays. Peptides 2020, 132, 170365. [Google Scholar] [CrossRef]
- Kaczmarek, K.; Zabrocki, J.; Artym, J.; Zimecki, M. Screening activities of new analogs by single amino acid modifications of 4B8M, c(Pro-Pro-β 3-HoPhe-Phe-), cyclic tetrapeptide sequence. J. Biomed. Res. Ther. 2023, 2, 21–36. [Google Scholar]
- Akimov, M.G.; Nazimov, I.V.; Gretskaia, N.M.; Deĭgin, V.I.; Bezuglov, V.V. The study of peptide stability during hydrolysis by rat gastroenteric tract fragments. Bioorg Khim. 2010, 36, 753–759. [Google Scholar]
- Ali, M.; Amon, M.; Bender, V.; Bolte, A.; Separovic, F.; Benson, H.; Manolios, N. Cyclization enhances function of linear anti-arthritic peptides. Clin. Immunol. 2014, 150, 121–133. [Google Scholar] [CrossRef]
- Zhavoronkov, A.; Ivanenkov, Y.A.; Aliper, A.; Veselov, M.S.; Aladinskiy, V.A.; Aladinskaya, A.V.; Terentiev, V.A.; Polykovskiy, D.A.; Kuznetsov, M.D.; Asadulaev, A.; et al. Deep learning enables rapid identification of potent DDR1 kinase inhibitors. Nat. Biotechnol. 2019, 37, 1038–1040. [Google Scholar] [CrossRef]
- DiMasi, J.A.; Grabowski, H.G.; Hansen, R.W. Innovation in the pharmaceutical industry: New estimates of R&D costs. J. Health Econ. 2006, 47, 20–33. [Google Scholar]
- Chen, W.; Liu, X.; Zhang, S.; Chen, S. Artificial Intelligence for drug discovery: Resources, methods, and applications. Molecular Therapy. Nucleic Acids 2023, 31, 691–702. [Google Scholar] [CrossRef]
- Agrawal, P. Artificial Intelligence in Drug Discovery and Development. J. Pharmacovigil. 2018, 6, 1000e173. [Google Scholar] [CrossRef]
- Reddy, A.S.; Zhang, S. Polypharmacology: Drug discovery for the future. Expert Rev. Clin. Pharmacol. 2013, 6, 41–47. [Google Scholar] [CrossRef]
- Morrow, J.K.; Tian, L.; Zhang, S. Molecular networks in drug discovery. Crit. Rev. Biomed. Eng. 2010, 38, 143–156. [Google Scholar] [CrossRef]
- Knight-Schrijver, V.R.; Chelliah, V.; Cucurull-Sanchez, L.; Le Novere, N. The promises of quantitative systems pharmacology modelling for drug development. Comput. Struct. Biotechnol. J. 2016, 14, 363–370. [Google Scholar] [CrossRef]
- Hansen, M.B.; Nielsen, S.E.; Berg, K. Reexamination and further development of a precise and rapid dye method for measuring cell growth/cell kill. J. Immunol. Methods 1989, 119, 203–210. [Google Scholar] [CrossRef]
- Espevik, T.; Nissen-Meyer, J. A highly sensitive cell line WEHI 164 clone 13, for measuring cytotoxic factor/tumor necrosis factor from human monocytes. J. Immunol. Methods 1986, 95, 99–103. [Google Scholar] [CrossRef]
- Noonan, F.P.; Halliday, W.J. Studies on contact hypersensitivity and tolerance in vivo and in vitro. I. Basic characteristics of the reactions and confirmation of an immune response in tolerant mice. Int. Arch. Allergy Appl. Immunol. 1978, 56, 523–532. [Google Scholar] [CrossRef]
- Bottomley, K.M.; Griffiths, R.J.; Rising, T.J.; Steward, A. A modified mouse air pouch model for evaluating the effects of compounds on granuloma induced cartilage degradation. Br. J. Pharm. 1988, 93, 627–635. [Google Scholar] [CrossRef]
- Melgar, S.; Karlsson, A.; Michaelsson, E. Acute colitis induced by dextran sulfate sodium progresses to chronicity in C57BL/6 but not BALB/c mice: Correlation between symptoms and inflammation. Am. J. Physiol. Gastrointest. Liver Physiol. 2005, 288, G1328–G1338. [Google Scholar] [CrossRef]
- Daina, A.; Michielin, O.; Zoete, V. SwissADME: A free web tool to evaluate pharmacokinetics, drug-likeness and medicinal chemistry friendliness of small molecules. Sci. Rep. 2017, 7, 42717. [Google Scholar] [CrossRef]
- Douglas, P.E.V.; Blundell, T.I.; Ascher, D.B. pkCSM: Predicting small-molecule pharmacokinetic and toxicity properties using graph-based signatures. J. Med. Chem. 2015, 58, 4066–4072. [Google Scholar]
- Swanson, K.; Walther, P.; Leitz, J.; Mukherjee, S.; Wu, J.C.; Shivnaraine, R.V.; Zou, J. ADMET-AI: A machine learning ADMET platform for evaluation of large-scale chemical libraries. Bioinformatics 2024, 40, btae416. [Google Scholar] [CrossRef]
- Banerjee, P.; Eckert, A.O.; Schrey, A.K.; Preissner, R. ProToxII: A webserver for the prediction of toxicity of chemicals. Nucl. Ac. Res. 2018, 46, W257–W263. [Google Scholar] [CrossRef]
- OSIRIS Property Explorer: Drug Score Prediction 2023. Available online: http://www.cheminfo.org/Chemistry/Cheminformatics/Property_explorer/index.html (accessed on 22 June 2022).
- Rana, S.; Prakash, P. In Silico pharmacokinetic Prediction for New Fixed Dose Combinations—A Lesson to Learn. Inven. Rapid Pharmacokinet. Pharmacodyn. 2021, 2, 1–8. [Google Scholar]
- Proudfoot, J.R. Drugs, leads, and drug-likeness: An analysis of some recently launched drugs. Bioorg. Med. Chem. Lett. 2002, 12, 1647–1650. [Google Scholar] [CrossRef]
- Filimonov, D.A.; Lagunin, A.A.; Gloriozova, T.A.; Rudik, A.V.; Druzhilovskii, D.S.; Pogodin, P.V.; Poroikov, V.V. Prediction of the Biological Activity Spectra of Organic Compounds Using the Pass Online Web Resource. Chem. Het. Comp. 2014, 50, 444–457. [Google Scholar] [CrossRef]
- Goel, R.K.; Singh, D.; Lagunin, A.; Poroikov, V. PASS-assisted exploration of new therapeutic potential of natural products. Med. Chem. Res. 2011, 20, 1509–1514. [Google Scholar] [CrossRef]
- Marwaha, A.; Goel, R.K.; Mahajan, M.P. PASS-predicted design, synthesis and biological evaluation of cyclic nitrones as nootropics. Bioorg. Med. Chem. Lett. 2007, 17, 5251–5255. [Google Scholar] [CrossRef]
- Liu, X.; Xu, Y.; Li, S.; Wang, Y.; Peng, J.; Luo, C.; Luo, X.; Zheng, M.; Chen, K.; Jiang, H. In Silico target fishing: Addressing a ‘Big Data’ problem by ligand-based similarity rankings with data fusion. J. Cheminform. 2014, 6, 33. [Google Scholar] [CrossRef] [PubMed]
- Biovia, D.S. Discovery Studio Modeling Environment; Dassault Systèmes: San Diego, CA, USA, 2017. [Google Scholar]
- Frisch, M.J.; Trucks, G.W.; Schlegel, H.B.; Scuseria, G.E.; Robb, M.A.; Cheeseman, J.R.; Scalmani, G.; Barone, V.; Mennucci, B.; Petersson, G.A.; et al. Gaussian 09; Version D.01; Gaussian Inc.: Wallingford, CT, USA, 2011. [Google Scholar]
- Parr, R.G.; Wang, W. Density-Functional Theory of Atoms and Molecules; Oxford University Press: New York, NY, USA, 1994. [Google Scholar]
- Neumann, R.; Nobes, R.H.; Handy, N.C. Exchange functionals and potentials. Mol. Phys. 1996, 87, 1–36. [Google Scholar] [CrossRef]
- Bickelhaupt, F.M.; Baerends, E.J. Kohn-Sham Density Functional Theory: Predicting and Understanding Chemistry. In Reviews in Computational Chemistry; Lipkowitz, K.B., Boyd, D.B., Eds.; Wiley-VCH: New York, NY, USA, 2000; Volume 15, pp. 1–86. [Google Scholar]
- Becke, A.D. Density-functional exchange-energy approximation with correct asymptotic behavior. Phys. Rev. 1988, A38, 3098–3100. [Google Scholar] [CrossRef] [PubMed]
- Becke, A.D. Density-functional thermochemistry. III. The role of exact exchange. J. Chem. Phys. 1993, 98, 5648–5652. [Google Scholar] [CrossRef]
- Lee, C.; Yang, W.; Parr, R.G. Development of the Colle-Salvetti correlation-energy formula into a functional of the electron density. Phys. Rev. B 1998, 37, 785–789. [Google Scholar] [CrossRef]
- Klamt, A.; Schüürman, G. COSMO: A new approach to dielectric screening in solvents with explicit expressions for the screening energy and its gradient. Perkin Trans. 2 1993, 24, 799–805. [Google Scholar] [CrossRef]
- Barone, V.; Cossi, M. Quantum Calculation of Molecular Energies and Energy Gradients in Solution by a Conductor Solvent Model. J. Phys. Chem. A 1998, 102, 1995–2001. [Google Scholar] [CrossRef]
- Cossi, M.; Rega, N.; Scalmani, G.; Barone, V. Energies, structures, and electronic properties of molecules in solution with the C-PCM solvation model. J. Comput. Chem. 2003, 24, 669–681. [Google Scholar] [CrossRef]
- Cheeseman, J.R.; Frisch, M.J.; Devlin, F.J.; Stephens, P.J. Ab Initio Calculation of Atomic Axial Tensors and Vibrational Rotational Strengths Using Density Functional Theory. Chem. Phys. Lett. 1996, 252, 211–220. [Google Scholar] [CrossRef]
- Helgaker, T.; Jørgensen, P. An Electronic Hamiltonian for Origin Independent Calculations of Magnetic-Properties. J. Chem. Phys. 1991, 95, 2595–2601. [Google Scholar] [CrossRef]
- Autschbach, J.; Ziegler, T.; van Gisbergen, S.J.A.; Baerends, E.J. Chiroptical properties from time-dependent density functional theory. I. Circular dichroism spectra of organic molecules. J. Chem. Phys. 2002, 116, 6930–6940. [Google Scholar] [CrossRef]
- Bauernschmitt, R.; Ahlrichs, R. Treatment of electronic excitations within the adiabatic approximation of time dependent density functional theory. Chem. Phys. Lett. 1996, 256, 454–464. [Google Scholar] [CrossRef]
- Scalmani, G.; Frisch, M.J.; Mennucci, B.; Tomasi, J.; Cammi, R.; Barone, V. Geometries and properties of excited states in the gas phase and in solution: Theory and application of a time-dependent density functional theory polarizable continuum model. J. Chem. Phys. 2006, 124, 094107. [Google Scholar] [CrossRef]
- Koenis, M.A.J.; Visser, O.; Visscher, L.; Buma, W.J.; Nicu, V.P. GUI Implementation of VCDtools, A Program to Analyze Computed Vibrational Circular Dichroism Spectra. J. Chem. Inf. Model. 2020, 60, 259–267. [Google Scholar] [CrossRef] [PubMed]
- Nafie, L.A. Vibrational Circular Dichroism: A New Tool for the Solution-State Determination of the Structure and Absolute Configuration of Chiral Natural Product Molecules. Nat. Prod. Commun. 2008, 3, 451–466. [Google Scholar] [CrossRef]
- Monti, M.; Stener, M.; Aschi, M. A computational approach for modeling electronic circular dichroism of solvated chromophores. J. Comput. Chem. 2022, 43, 2023–2036. [Google Scholar] [CrossRef]
- Schrödinger, L.; DeLano, W. PyMOL, Version 1.8. 2015. Available online: http://www.pymol.org/pymol (accessed on 10 April 2016).
- Chervenick, P.A.; Boggs, D.R.; Marsh, J.C.; Cartwright, G.E.; Wintrobe, M.M. Quantitative studies of blood and bone marrow neutrophils in normal mice. Am. J. Physiol. 1968, 215, 353–360. [Google Scholar] [CrossRef]
- Ertl, P.; Rohde, B.; Selzer, P. Fast calculation of molecular polar surface area as a sum of fragment- based contributions and its application to the prediction of drug transport properties. J. Med. Chem. 2000, 43, 3714–3717. [Google Scholar] [CrossRef]
- Lipinski, C.A.; Lombardo, F.; Dominy, B.W.; Feeney, P. Experimental and computational approaches to estimate solubility and permeability in drug discovery and development settings. J. Adv. Drug. Deliv. Rev. 1997, 23, 3–25. [Google Scholar] [CrossRef]
- Lipinski, C.A. Lead-and drug-like compounds: The rule-of-five revolution. Drug Discov. Today Technol. 2004, 1, 337–341. [Google Scholar] [CrossRef]
- Zhao, Y.H.; Abraham, M.H.; Le, J.; Hersey, A.; Luscombe, C.N.; Beck, G.; Sherborne, B.; Cooper, I. Rate-limited steps of human oral absorption and QSAR studies. Pharm. Res. 2002, 19, 1446–1457. [Google Scholar] [CrossRef] [PubMed]
- Mooney, C.; Haslam, N.J.; Pollastri, G.; Shields, D.S. Towards the improved discovery and design of functional peptides: Common features of diverse classes permit generalized prediction of bioactivity. PLoS ONE 2012, 7, 45012. [Google Scholar] [CrossRef]
- Lagunin, A.; Stepanchikova, A.; Filimonov, D.; Poroikov, V. PASS: Prediction of activity spectra for biologically active substances. Bioinformatics 2000, 16, 747–748. [Google Scholar] [CrossRef] [PubMed]
- Kadir, A.; Kassim, N.M.; Abdulla, M.A.; Yehye, W.A. PASS-predicted vitex negundo activity: Antioxidant and antiproliferative properties on human hepatoma cells-an in vitro study. BMC Complement. Altern. Med. 2013, 13, 343. [Google Scholar] [CrossRef] [PubMed]
- Tharmatt, A.; Sharma, M. Recent activities predicted by pass software online for hypertrophic cardiomyopathy. Asian J. Pharm. Pharmacol. 2019, 5, 1211–1215. [Google Scholar] [CrossRef]
- Daina, A.; Michielin, O.; Zoete, V. SwissTargetPrediction: Updated data and new features for efficient prediction of protein targets of small molecules. Nucleic Acids Res. 2019, 47, w357–w364. [Google Scholar] [CrossRef]
- Gfeller, D.; Grosdidier, A.; Wirth, M.; Daina, A.; Michielin, O.; Zoete, V. SwissTargetPrediction: A web server for target prediction of bioactive small molecules. Nucleic Acids Res. 2014, 42, W32–W38. [Google Scholar] [CrossRef]
- Wang, X.; Shen, Y.; Wang, S.; Li, S.; Zhang, W.; Liu, X.; Lai, L.; Pei, J.; Li, H. PharmMapper 2017 update: A web server for potential drug target identification with a comprehensive target pharmacophore database. Nucleic Acids Res. 2017, 45, W356–W360. [Google Scholar] [CrossRef]
- Di Remigio Eikas, K.; Krupova, M.; Kristoffersen, T.; Beerepoot, M.T.P.; Ruud, K. Can the absolute configuration of cyclic peptides be determined with vibrational circular dichroism? Phys. Chem. Chem. Phys. 2023, 25, 14520. [Google Scholar] [CrossRef]
- Lozano, T.; Gorraiz, M.; Lasarte-Cía, A.; Ruiz, M.; Rabal, O.; Oyarzabal, J.; Hervás-Stubbs, S.; Llopiz, D.; Sarobe, P.; Prieto, J.; et al. Blockage of FOXP3 transcription factor dimerization and FOXP3/AML1 interaction inhibits T regulatory cell activity: Sequence optimization of a peptide inhibitor. Oncotarget 2017, 8, 71709–71724. [Google Scholar] [CrossRef]


| Peptide | Sequence | |
|---|---|---|
| P00 (4B8M) | cyclo[Pro-Pro-β3-HoPhe-Phe-] |  |
| P01 | cyclo[Pro-Pro-β3-HoPhe-D-Phe-] |  |
| P02 | cyclo- [D-Pro-D-Pro-β3-HoPhe-D-Phe-] |  |
| P03 | cyclo-[D-Pro-Pro-β3-HoPhe-Phe-] |  |
| P04 | cyclo-[Pro-Pro-D-β3-HoPhe-Phe-] | 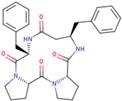 |
| P05 | cyclo-[Pro-D-Pro-β3-HoPhe-Phe-] |  |
| P06 | cyclo-[D-Pro-D-Pro-D-β3-HoPhe-D-Phe-] | 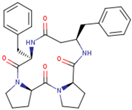 |
| P07 | cyclo-[D-Pro-D-Pro-β3-HoPhe-Phe-] |  |
| Compound Concentration (µg/mL) | TNF-α (pg/mL) | % of Inhibition vs. DMSO Control | Compound Concentration (µg/mL) |
|---|---|---|---|
| (-) | - | 92 | - |
| (LPS) | - | 6668 | - |
| DMSO | 1 | 8167 | - |
| 10 | 8006 | - | |
| P00 (4B8M) | 1 | 7364 | 9.8 |
| 10 | 7176 | 10.4 | |
| P01 | 1 | 7016 | 14.1 |
| 10 | 5757 | 28.1 | |
| P02 | 1 | 6614 | 19.0 |
| 10 | 6346 | 20.7 | |
| P03 | 1 | 6052 | 25.9 |
| 10 | 5222 | 34.8 | |
| P04 | 1 | 5463 | 33.1 |
| 10 | 5302 | 33.8 | |
| P05 | 1 | 7123 | 12.8 |
| 10 | 7203 | 10.0 | |
| P06 | 1 | 8033 | 1.6 |
| 10 | 7658 | 4.4 | |
| P07 | 1 | 6453 | 21.0 |
| 10 | 7284 | 9.0 |
| Name | Structure | Suppressive Effect on Cell Proliferation | Suppressive Effect on TNF-α Production |
|---|---|---|---|
| P01 | cyclo(Pro-Pro-β3-HoPhe-D-Phe-) | NS | marginal |
| P02 | cyclo(D-Pro-D-Pro-β3-HoPhe-D-Phe-) | NS | small |
| P03 | cyclo(D-Pro-Pro-β3-HoPhe-Phe-) | significant at 100 µg/mL | strong |
| P04 | cyclo(Pro-Pro-D-β3-HoPhe-Phe-) | NS | strong |
| P05 | cyclo(Pro-D-Pro-β3-HoPhe-Phe-) | NS | moderate |
| P06 | cyclo(D-Pro-D-Pro-D-β3-HoPhe-D-Phe-) | NS | absent |
| P07 | cyclo(D-Pro-D-Pro-β3-HoPhe-Phe-) | NS | small |
| P00 | P01 | P02 | P03 | P04 | P05 | P06 | P07 | |
|---|---|---|---|---|---|---|---|---|
| PHYSICOCHEMICAL Physicochemical | ||||||||
| Molecular weight [Daltons] | 502.62 | 502.62 | 502.62 | 502.62 | 502.62 | 502.62 | 502.62 | 502.62 |
| Log P | 1.83 | 1.83 | 1.83 | 1.83 | 1.83 | 1.83 | 1.83 | 1.83 |
| H-bond acceptors | 4 | 4 | 4 | 4 | 4 | 4 | 4 | 4 |
| H-bond donors | 2 | 2 | 2 | 2 | 2 | 2 | 2 | 2 |
| Lipinski rule of 5 | 3 | 3 | 3 | 3 | 3 | 3 | 3 | 3 |
| Quantitative estimate of drug-likeness | 0.67 | 0.67 | 0.67 | 0.67 | 0.67 | 0.67 | 0.67 | 0.67 |
| Stereo centers | 4 | 4 | 4 | 4 | 4 | 4 | 4 | 4 |
| Topological polar surface area (TPSA) [Å2] | 98.82 | 98.82 | 98.82 | 98.82 | 98.82 | 98.82 | 98.82 | 98.82 |
| Absorption | ||||||||
| Human intestinal absorption | 0.58 | 0.62 | 0.62 | 0.52 | 0.54 | 0.59 | 0.61 | 0.56 |
| Oral bioavailability | 0.64 | 0.63 | 0.63 | 0.66 | 0.65 | 0.62 | 0.63 | 0.64 |
| Aqueous solubility [log mol/L] | −3.80 | −3.89 | −3.91 | −3.79 | −3.75 | −3.84 | −3.87 | −3.82 |
| lipophilicity | 1.88 | 1.97 | 1.97 | 1.85 | 1.83 | 1.90 | 1.93 | 1.88 |
| Hydration free energy [kcal/mol] | −10.89 | −10.82 | −10.80 | −10.91 | −10.92 | −10.85 | −10.82 | −10.87 |
| Cell effective permeability [cm/s] | −5.41 | −5.39 | −5.39 | −5.41 | −5.41 | −5.41 | −5.40 | −5.41 |
| PAMPA permeability | 0.50 | 0.52 | 0.52 | 0.50 | 0.51 | 0.51 | 0.52 | 0.50 |
| P-glycoprotein inhibition | 0.39 | 0.41 | 0.40 | 0.38 | 0.38 | 0.39 | 0.40 | 0.38 |
| Distribution | ||||||||
| Blood–brain barrier penetration | 0.16 | 0.16 | 0.16 | 0.16 | 0.15 | 0.15 | 0.16 | 0.16 |
| Plasma protein binding rate [%] | 82.16 | 83.23 | 83.34 | 81.84 | 81.55 | 82.57 | 82.77 | 82.28 |
| Volume of distribution at steady state [L/kg] | −4.36 | −4.25 | −4.26 | −4.40 | −4.39 | −4.32 | −4.28 | −4.35 |
| Metabolism | ||||||||
| CYP1A2 inhibition | 1.93 × 10³ | 2.31 × 10³ | 2.30 × 10³ | 1.69 × 10³ | 1.90 × 10³ | 2.17 × 10³ | 2.26 × 10³ | 1.92 × 10³ |
| CYP2C19 inhibition | 0.06 | 0.08 | 0.08 | 0.06 | 0.06 | 0.07 | 0.07 | 0.06 |
| CYP2C9 substrate | 0.14 | 0.14 | 0.14 | 0.14 | 0.13 | 0.14 | 0.14 | 0.14 |
| CYP2C9 inhibition | 0.03 | 0.04 | 0.03 | 0.02 | 0.02 | 0.03 | 0.03 | 0.03 |
| CYP2D6 substrate | 0.08 | 0.08 | 0.07 | 0.08 | 0.08 | 0.07 | 0.08 | 0.08 |
| CYP2D6 inhibition | 0.01 | 0.01 | 0.01 | 0.01 | 0.01 | 0.01 | 0.01 | 0.01 |
| CYP3A4 substrate | 0.77 | 0.78 | 0.78 | 0.77 | 0.78 | 0.77 | 0.79 | 0.77 |
| CYP3A4 inhibition | 0.37 | 0.43 | 0.42 | 0.33 | 0.36 | 0.40 | 0.42 | 0.36 |
| Excretion | ||||||||
| Half-life [hr] | 74.20 | 74.69 | 74.44 | 73.33 | 73.75 | 74.75 | 73.95 | 73.91 |
| Drug clearance (hepatocyte) [μ L·min−1 (106 cells)−1 | 29.25 | 30.80 | 31.02 | 29.01 | 28.38 | 29.64 | 30.18 | 29.53 |
| Drug clearance (microsome) [mL·min−1·g−1] | 51.72 | 54.14 | 54.42 | 51.25 | 50.71 | 52.47 | 53.48 | 52.09 |
| Toxicity | ||||||||
| hERG blocking | 0.29 | 0.31 | 0.31 | 0.28 | 0.29 | 0.30 | 0.32 | 0.29 |
| Clinical toxicity | 0.14 | 0.14 | 0.14 | 0.15 | 0.15 | 0.14 | 0.15 | 0.14 |
| Mutagenicity | 0.14 | 0.15 | 0.15 | 0.14 | 0.15 | 0.15 | 0.16 | 0.14 |
| Drug-induced liver injury | 0.65 | 0.67 | 0.67 | 0.64 | 0.64 | 0.66 | 0.66 | 0.65 |
| Carcinogenicity | 0.19 | 0.19 | 0.19 | 0.20 | 0.18 | 0.18 | 0.19 | 0.19 |
| Acute toxicity LD50 [log(1/mol/kg)] | 3.86 | 3.87 | 3.87 | 3.85 | 3.87 | 3.87 | 3.87 | 3.85 |
| Skin reaction | 0.210.12 | 0.21 | 0.21 | 0.20 | 0.21 | 0.21 | 0.22 | 0.21 |
| Androgen receptor (full length) | 0.03 | 0.12 | 0.12 | 0.11 | 0.12 | 0.12 | 0.12 | 0.12 |
| Androgen receptor (ligand-binding domain) | 0.01 | 0.03 | 0.04 | 0.03 | 0.04 | 0.04 | 0.04 | 0.03 |
| Aryl hydrocarbon receptor | 0.01 | 0.01 | 0.01 | 0.01 | 0.01 | 0.01 | 0.01 | 0.01 |
| Aromatase | 0.15 | 0.01 | 0.01 | 0.01 | 0.01 | 0.01 | 0.01 | 0.01 |
| Estrogen receptor (full length) | 0.03 | 0.15 | 0.15 | 0.15 | 0.15 | 0.16 | 0.16 | 0.15 |
| Estrogen receptor (ligand-binding domain) | 0.03 | 0.03 | 0.03 | 0.02 | 0.03 | 0.03 | 0.03 | 0.03 |
| Peroxisome proliferator-activated receptor gamma | 0.03 | 0.04 | 0.04 | 0.03 | 0.03 | 0.04 | 0.04 | 0.03 |
| Nuclear factor (erythroid-derived 2)-like 2/antioxidant responsive element | 0.25 | 0.28 | 0.28 | 0.23 | 0.26 | 0.27 | 0.28 | 0.25 |
| ATPase family AAA domain-containing protein 5 (ATAD5) | 0.02 | 0.03 | 0.03 | 0.02 | 0.02 | 0.03 | 0.03 | 0.02 |
| Heat shock factor response element | 0.03 | 0.04 | 0.04 | 0.03 | 0.03 | 0.04 | 0.04 | 0.03 |
| Mitochondrial membrane potential | 0.04 | 0.05 | 0.04 | 0.03 | 0.04 | 0.04 | 0.04 | 0.04 |
| Tumor protein p53 | 0.09 | 0.11 | 0.11 | 0.08 | 0.09 | 0.11 | 0.11 | 0.09 |
| GPCR | Ion Channel Modulator | Kinase Inhibitor | Nuclear Receptor Ligand | Protease Inhibitor | Enzyme Inhibitor |
|---|---|---|---|---|---|
| 0.33 | 0.02 | −0.02 | 0.00 | 0.52 | 0.12 |
| Pa | Pi | Activity |
|---|---|---|
| 0.715 | 0.037 | Nootropic |
| 0.710 | 0.03 | Uterine relaxant |
| 0.702 | 0.026 | Nicotinic alpha2beta2 receptor antagonist |
| 0.702 | 0.057 | CYP2C12 substrate |
| 0.684 | 0.006 | Chitinase inhibitor |
| 0.678 | 0.004 | Antibiotic glycopeptide-like |
| 0.657 | 0.048 | Nicotinic alpha6beta3beta4alpha5 receptor antagonist |
| 0.610 | 0.005 | Interleukin 2 agonist |
| 0.585 | 0.017 | Antineoplastic (non-Hodgin’s lymphoma) |
| 0.577 | 0.028 | Membrane integrity antagonist |
| 0.555 | 0.056 | Nicotinic alpha4beta4 receptor agonist |
| 0.543 | 0.017 | Na+ transporting two-sector ATPase inhibitor |
| 0.509 | 0.003 | Somatostatin 2 agonist |
| Pa | Pi | Cell Line | Description | Tissue/Organ | Type | IAP * |
|---|---|---|---|---|---|---|
| 0.582 | 0.005 | PANC-1 | Pancreatic carcinoma | Pancreas | Carcinoma | 0.933 |
| 0.568 | 0.004 | RS4-11 | Adult B acute lymphoblastic leukemia | Bone marrow | Leukemia | 0.835 |
| 0.496 | 0.015 | RPMI-8226 | Multiple myeloma | Hematopoietic and lymphoid tissue | Myeloma | 0.883 |
| 0.486 | 0.044 | HeLa | Cervical adenocarcinoma | Cervix | Adenocarcinoma | 0.885 |
| 0.482 | 0.073 | OCI-AML2 | Adult acute myeloid leukemia | Blood | Leukemia | 0.803 |
| 0.449 | 0.006 | MKN-74 | Gastric tubular adenocarcinoma | Stomach | Adenocarcinoma | 0.856 |
| 0.426 | 0.032 | SK-MEL-28 | Melanoma | Skin | Melanoma | 0.879 |
| 0.418 | 0.029 | CCRF-CEM | Childhood T acute lymphoblastic leukemia | Blood | Leukemia | 0.913 |
| 0.411 | 0.162 | TMD8 | Diffuse large B-cell lymphoma activated B-cell type | Lymphocytes | Lymphoma | 0.811 |
| 0.406 | 0.027 | CA46 | Burkitts lymphoma | Blood | Lymphoma | 0.810 |
| 0.403 | 0.212 | A2780cisR | Cisplatin-resistant ovarian carcinoma | ovarium | carcinoma | 0.838 |
| Atoms | ||||||||||||||||
|---|---|---|---|---|---|---|---|---|---|---|---|---|---|---|---|---|
| Amino acids | Cα | Cβ | Cβ’ | Cγ | Cδ | Cε | Cζ | Hα | Hβ1 Hβ2 | Hβ1’ Hβ2’ | Hγ1 Hγ2 | Hδ1 Hδ2 | Hε1 Hε2 | Hζ1 Hζ2 | NH | N |
| 1Pro | 63.36 | 30.97 | - | 21.56 | 47.39 | - | - | 4.12 | 1.97 1.77 | - | 1.74 1.58 | 3.60 3.29 | - | - | - | - |
| 2Pro | 60.64 | 31.38 | - | 20.46 | 47.63 | - | - | 4.06 | 2.06 1.71 | - | 1.70 1.56 | 3.49 3.38 | - | - | - | - |
| Phe | 54.23 | 37.97 | - | 139.32 | 129.79 | 128.29 | 129.18 | 4.56 | 3.12 2.70 | - | - | 7.16 | 7.19 | 7.07 | 7.89 | 119.93 |
| HoPhe | 54.08 | 38.48 | 41.23 | 138.64 | 129.86 | 128.47 | 128.87 | 4.33 | 3.10 2.74 | 2.32 2.08 | - | 7.13 | 7.23 | 7.11 | 8.02 | 119.07 |
| Atoms | ||||||||||||||||
|---|---|---|---|---|---|---|---|---|---|---|---|---|---|---|---|---|
| Amino acids | Cα | Cβ | Cβ’ | Cγ | Cδ | Cε | Cζ | Hα | Hβ1 Hβ2 | Hβ1’ Hβ2’ | Hγ1 Hγ2 | Hδ1 Hδ2 | Hε1 Hε2 | Hζ1 Hζ2 | NH | N |
| Pro | 56.85 | 27.43 | - | 25.23 | 46.33 | - | - | 4.08 | 1.88 1.83 | - | 2.13 1.61 | 3.52 3.14 | - | - | - | - |
| D-Pro | 61.97 | 29.57 | - | 24.74 | 47.35 | - | - | 4.65 | 2.13 1.61 | - | 1.82 1.72 | 4.21 3.56 | - | - | - | - |
| Phe | 54.72 | 35.67 | - | 137.84 | 130.16 | 128.70 | 127.02 | 4.52 | 2.87 2.75 | - | - | 7.19 | 7.26 | 7.11 | 8.10 | 124.59 |
| HoPhe | 50.25 | 39.01 | 38.78 | 138.56 | 129.67 | 128.59 | 126.71 | 3.93 | 2.91 2.89 | 2.32 2.16 | - | 7.10 | 7.28 | 7.20 | 5.88 | 108.76 |
| Compound | P00 | P03 |
|---|---|---|
| G298 [Hartree] | −1645.48329 | −1645.47100 |
| ΔG298 [kJ/mol] | 0.00 | 32.27 |
| [α]D [deg] | 177.0 | −30.3 |
| Dipole moment [Debye] | 7.04 | 12.09 |
Disclaimer/Publisher’s Note: The statements, opinions and data contained in all publications are solely those of the individual author(s) and contributor(s) and not of MDPI and/or the editor(s). MDPI and/or the editor(s) disclaim responsibility for any injury to people or property resulting from any ideas, methods, instructions or products referred to in the content. |
© 2024 by the authors. Licensee MDPI, Basel, Switzerland. This article is an open access article distributed under the terms and conditions of the Creative Commons Attribution (CC BY) license (https://creativecommons.org/licenses/by/4.0/).
Share and Cite
Kaczmarek, K.; Artym, J.; Bojarska, J.; Pacholczyk-Sienicka, B.; Waśko, J.; Jelemenska, I.; Wolf, W.M.; Breza, M.; Zimecki, M. The Immunosuppressive Properties of Cyclo-[D-Pro-Pro-β3-HoPhe-Phe-] Tetrapeptide Selected from Stereochemical Variants of Cyclo-[Pro-Pro-β3-HoPhe-Phe-] Peptide. Pharmaceutics 2024, 16, 1106. https://doi.org/10.3390/pharmaceutics16081106
Kaczmarek K, Artym J, Bojarska J, Pacholczyk-Sienicka B, Waśko J, Jelemenska I, Wolf WM, Breza M, Zimecki M. The Immunosuppressive Properties of Cyclo-[D-Pro-Pro-β3-HoPhe-Phe-] Tetrapeptide Selected from Stereochemical Variants of Cyclo-[Pro-Pro-β3-HoPhe-Phe-] Peptide. Pharmaceutics. 2024; 16(8):1106. https://doi.org/10.3390/pharmaceutics16081106
Chicago/Turabian StyleKaczmarek, Krzysztof, Jolanta Artym, Joanna Bojarska, Barbara Pacholczyk-Sienicka, Joanna Waśko, Ingrid Jelemenska, Wojciech M. Wolf, Martin Breza, and Michał Zimecki. 2024. "The Immunosuppressive Properties of Cyclo-[D-Pro-Pro-β3-HoPhe-Phe-] Tetrapeptide Selected from Stereochemical Variants of Cyclo-[Pro-Pro-β3-HoPhe-Phe-] Peptide" Pharmaceutics 16, no. 8: 1106. https://doi.org/10.3390/pharmaceutics16081106
APA StyleKaczmarek, K., Artym, J., Bojarska, J., Pacholczyk-Sienicka, B., Waśko, J., Jelemenska, I., Wolf, W. M., Breza, M., & Zimecki, M. (2024). The Immunosuppressive Properties of Cyclo-[D-Pro-Pro-β3-HoPhe-Phe-] Tetrapeptide Selected from Stereochemical Variants of Cyclo-[Pro-Pro-β3-HoPhe-Phe-] Peptide. Pharmaceutics, 16(8), 1106. https://doi.org/10.3390/pharmaceutics16081106