
Synergetic Effect of β-Cyclodextrin and Its Simple Carbohydrate Substituents on Complexation of Folic Acid and Its Structural Analog Methotrexate

 ,
,
Abstract
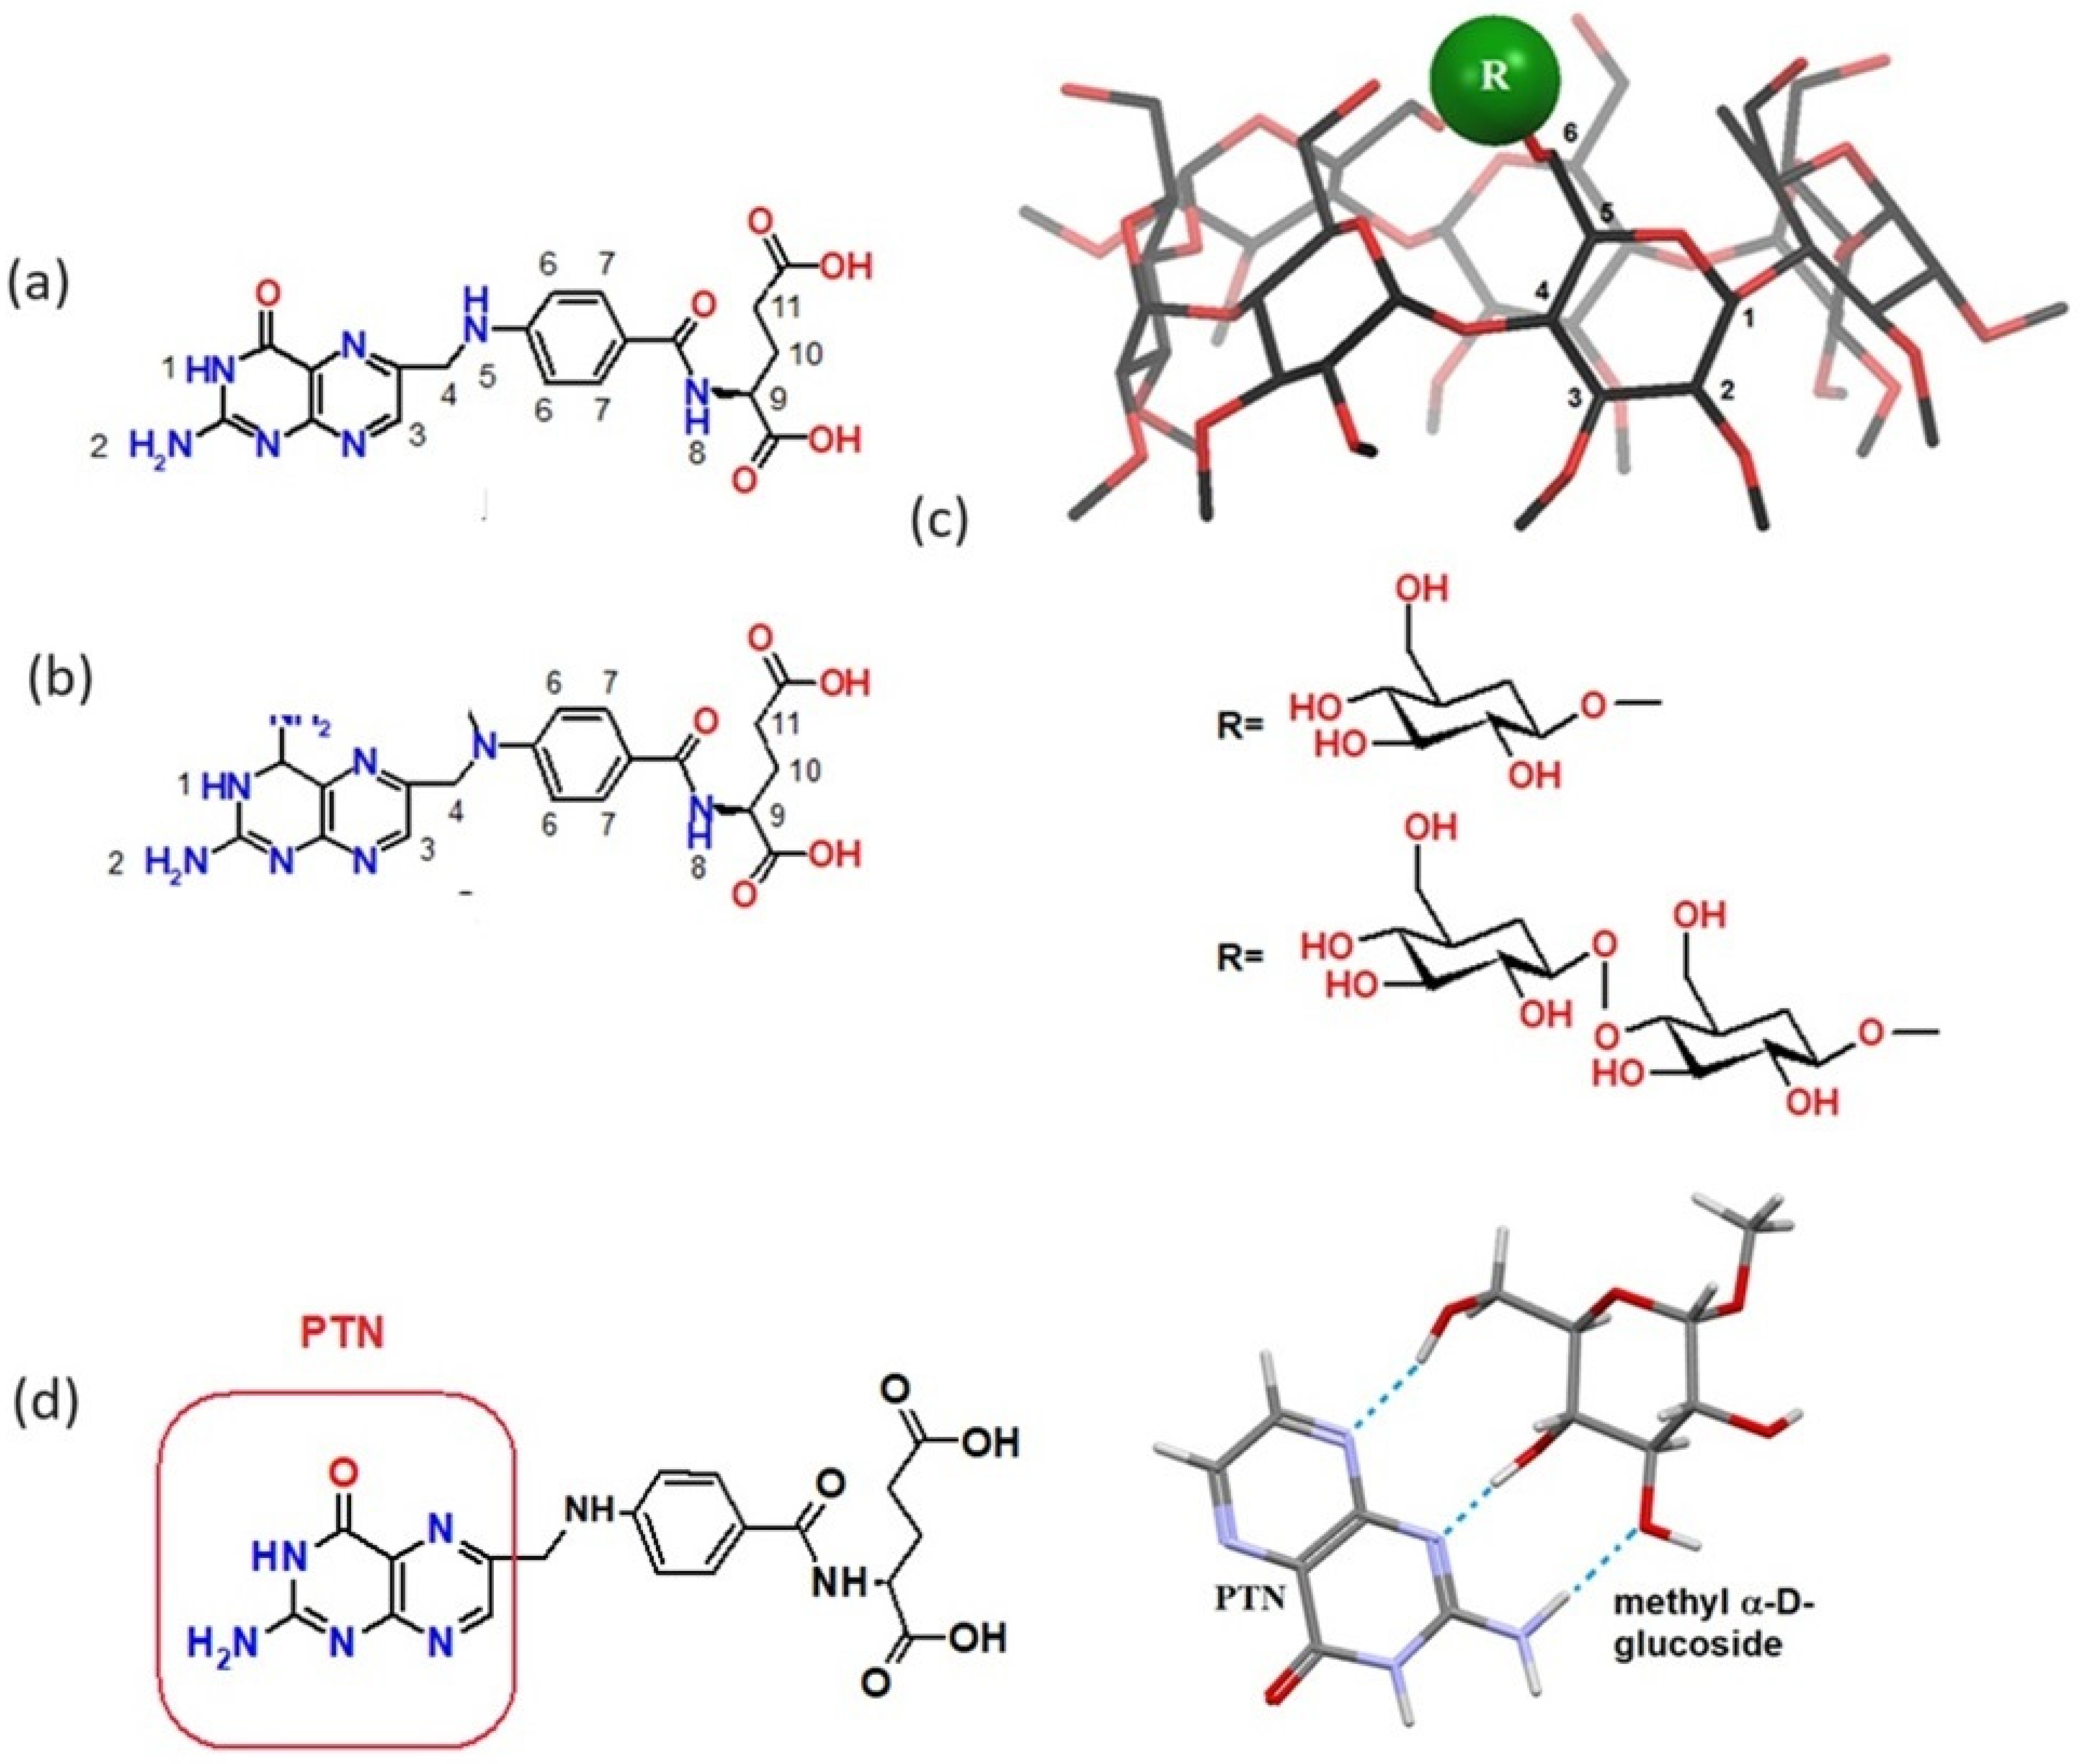
:1. Introduction
2. Materials and Methods
2.1. Materials
2.2. Preparation of Solid-State Complexes
2.3. Methods
2.3.1. Ultraviolet–Visible Spectroscopy (UV-Vis)
- UV-vis titration experiments
2.3.2. NMR Spectroscopy
2.3.3. Molecular Modeling
2.3.4. Thermal Analysis: Differential Scanning Calorimetry (DSC) and Thermogravimetry (TG) Analysis
2.3.5. Infrared Spectroscopy
3. Results
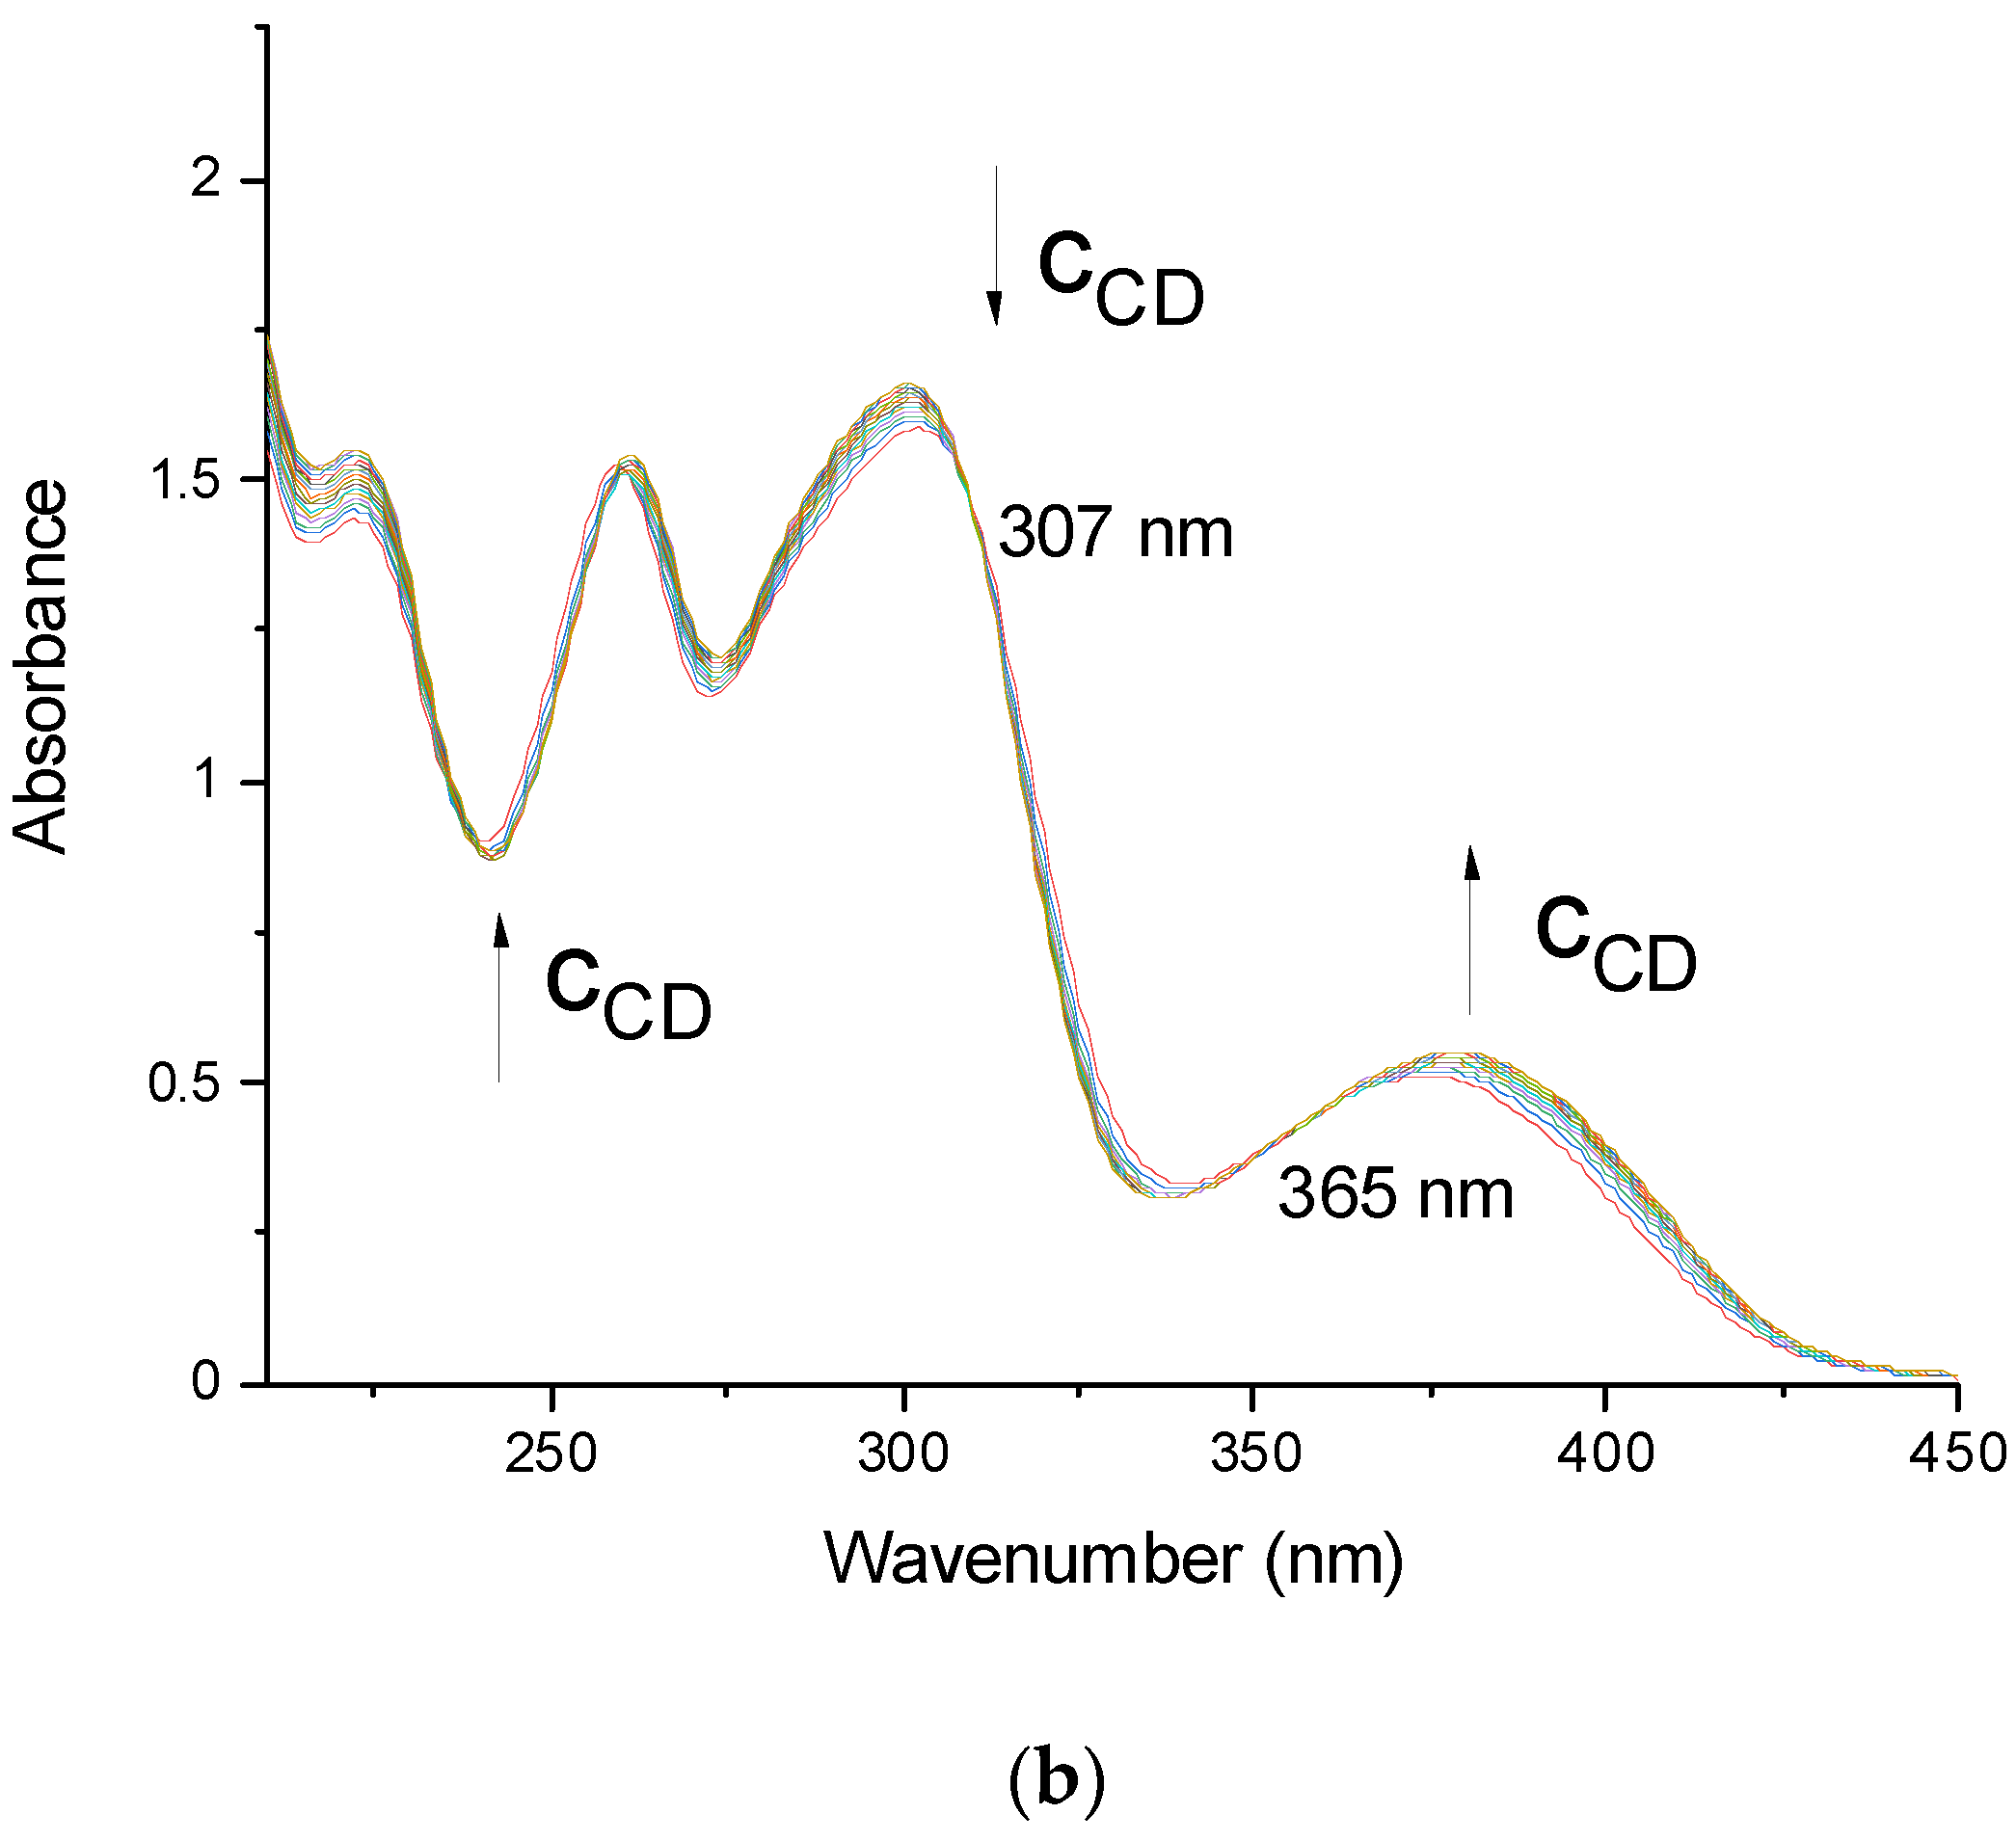
3.1. UV-Visible Spectroscopy (UV-Vis)
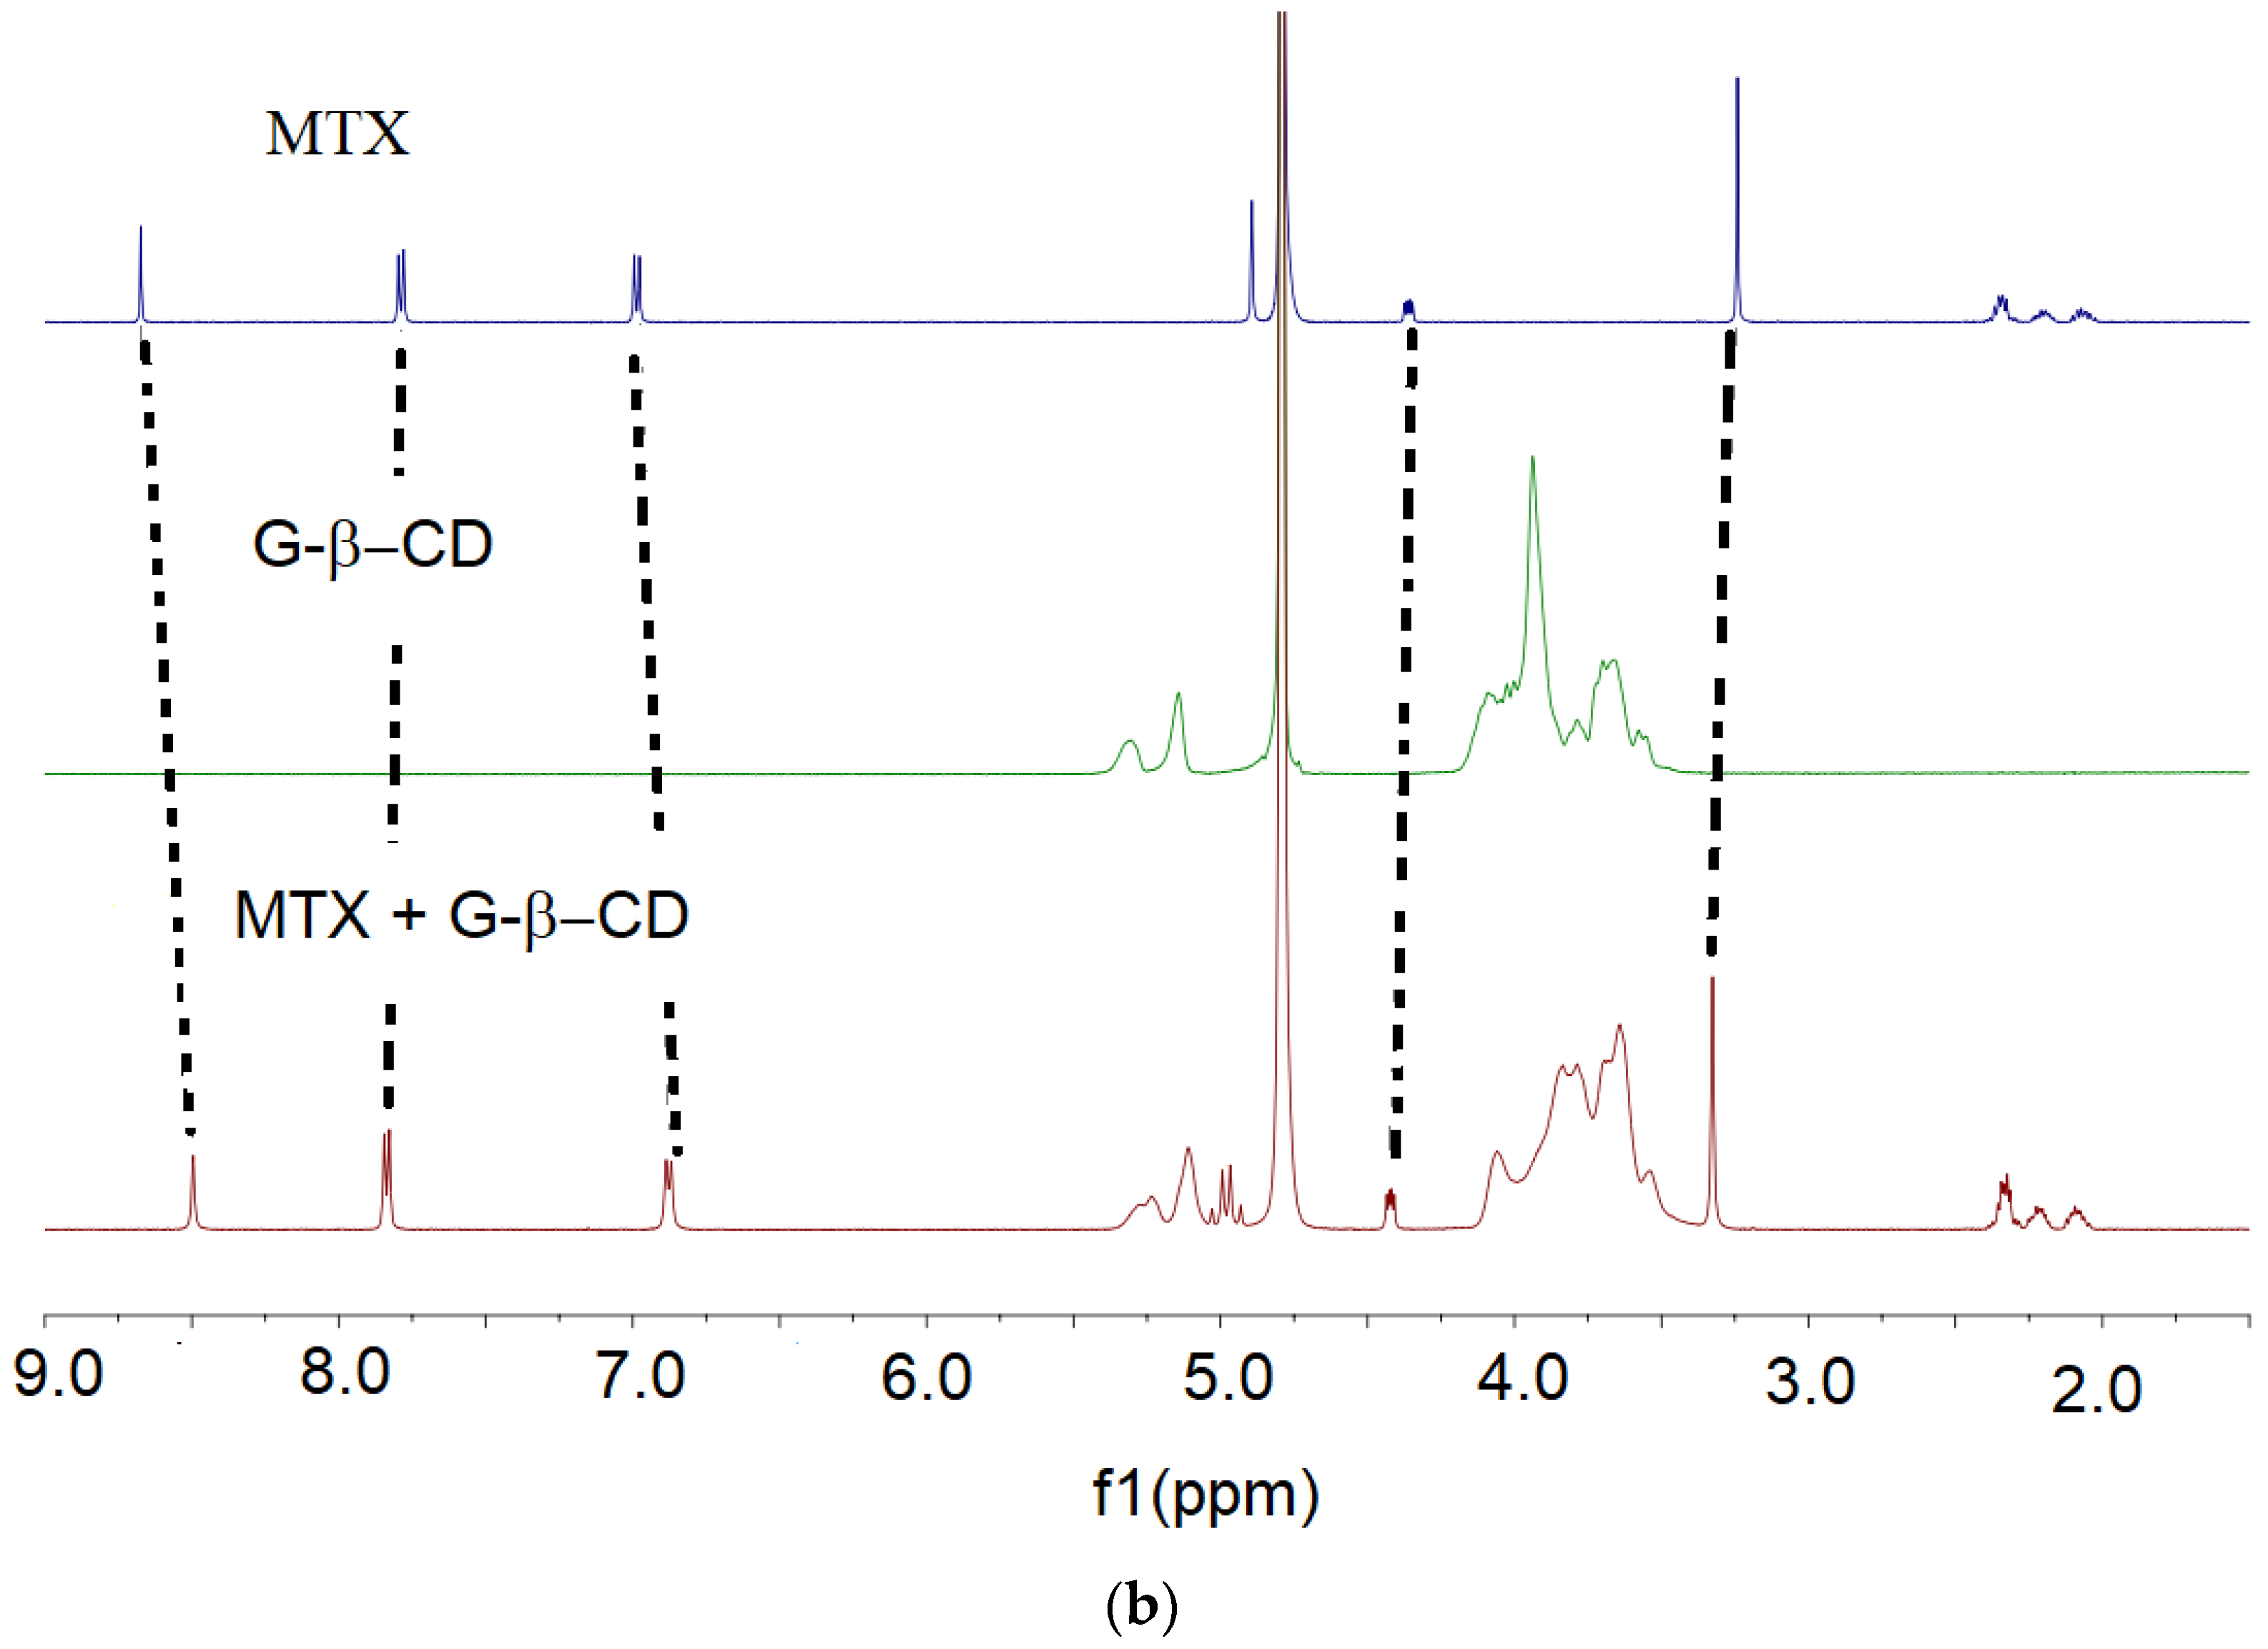
3.2. NMR Spectroscopy
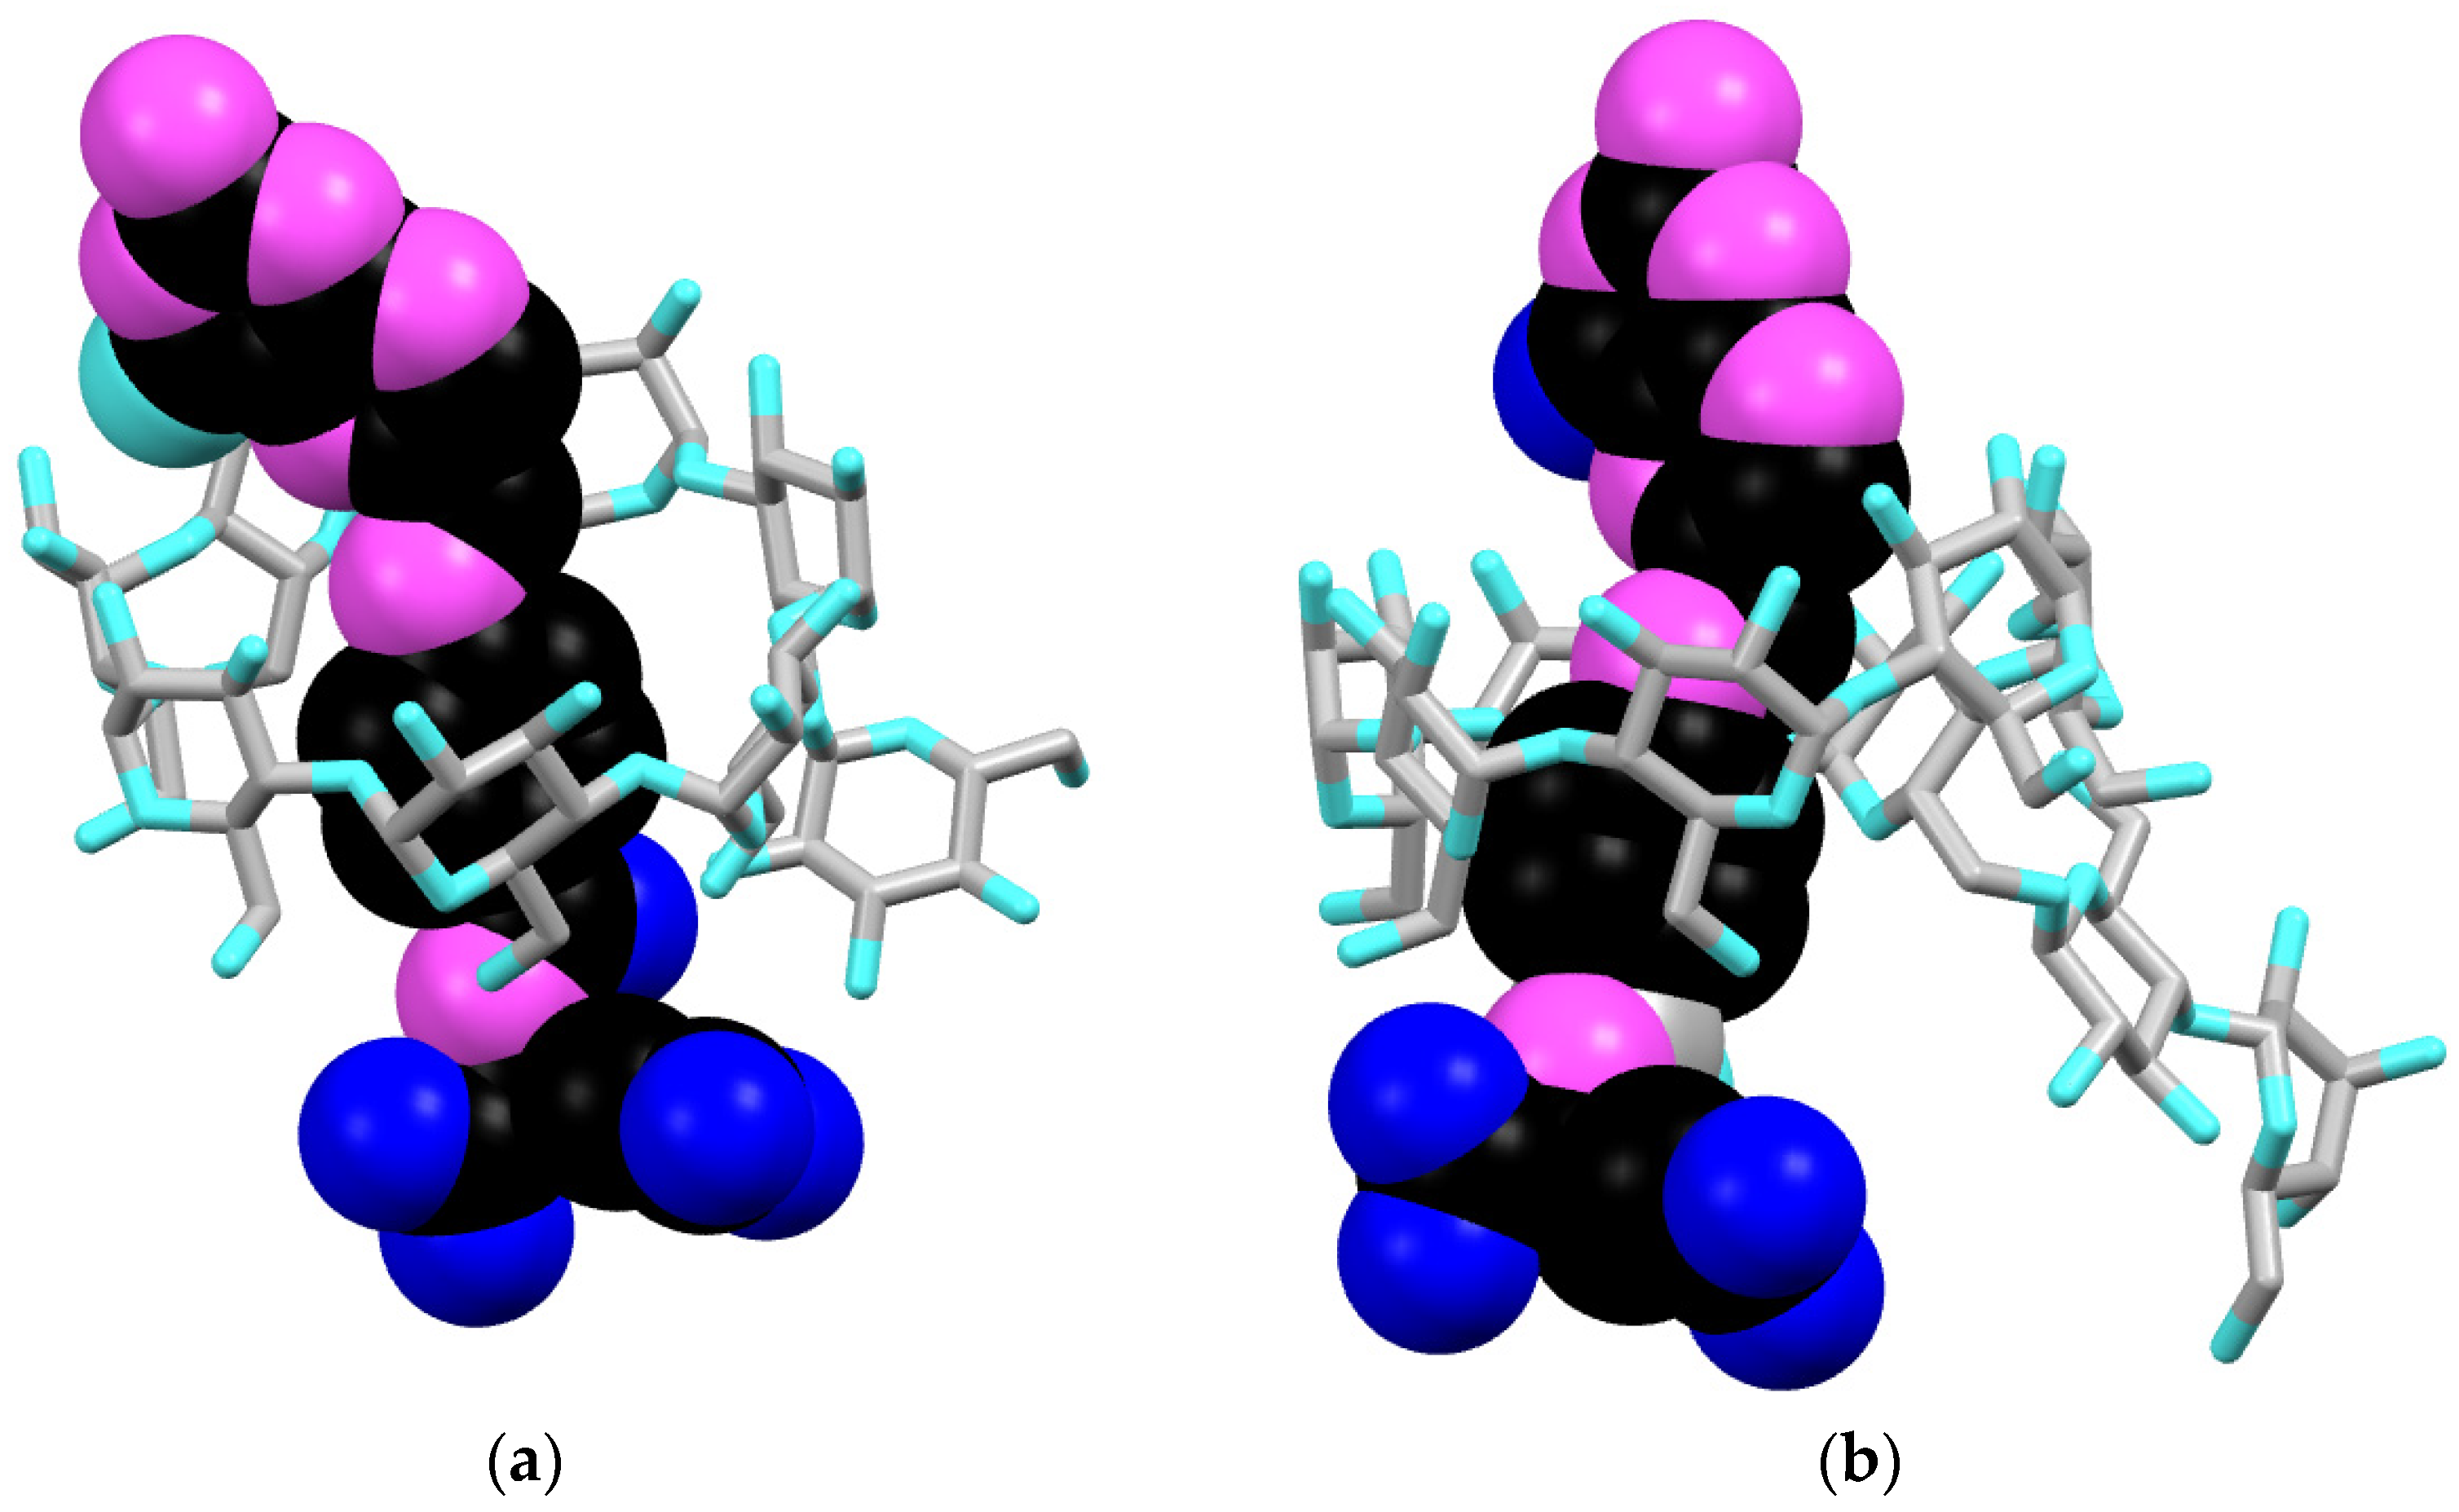
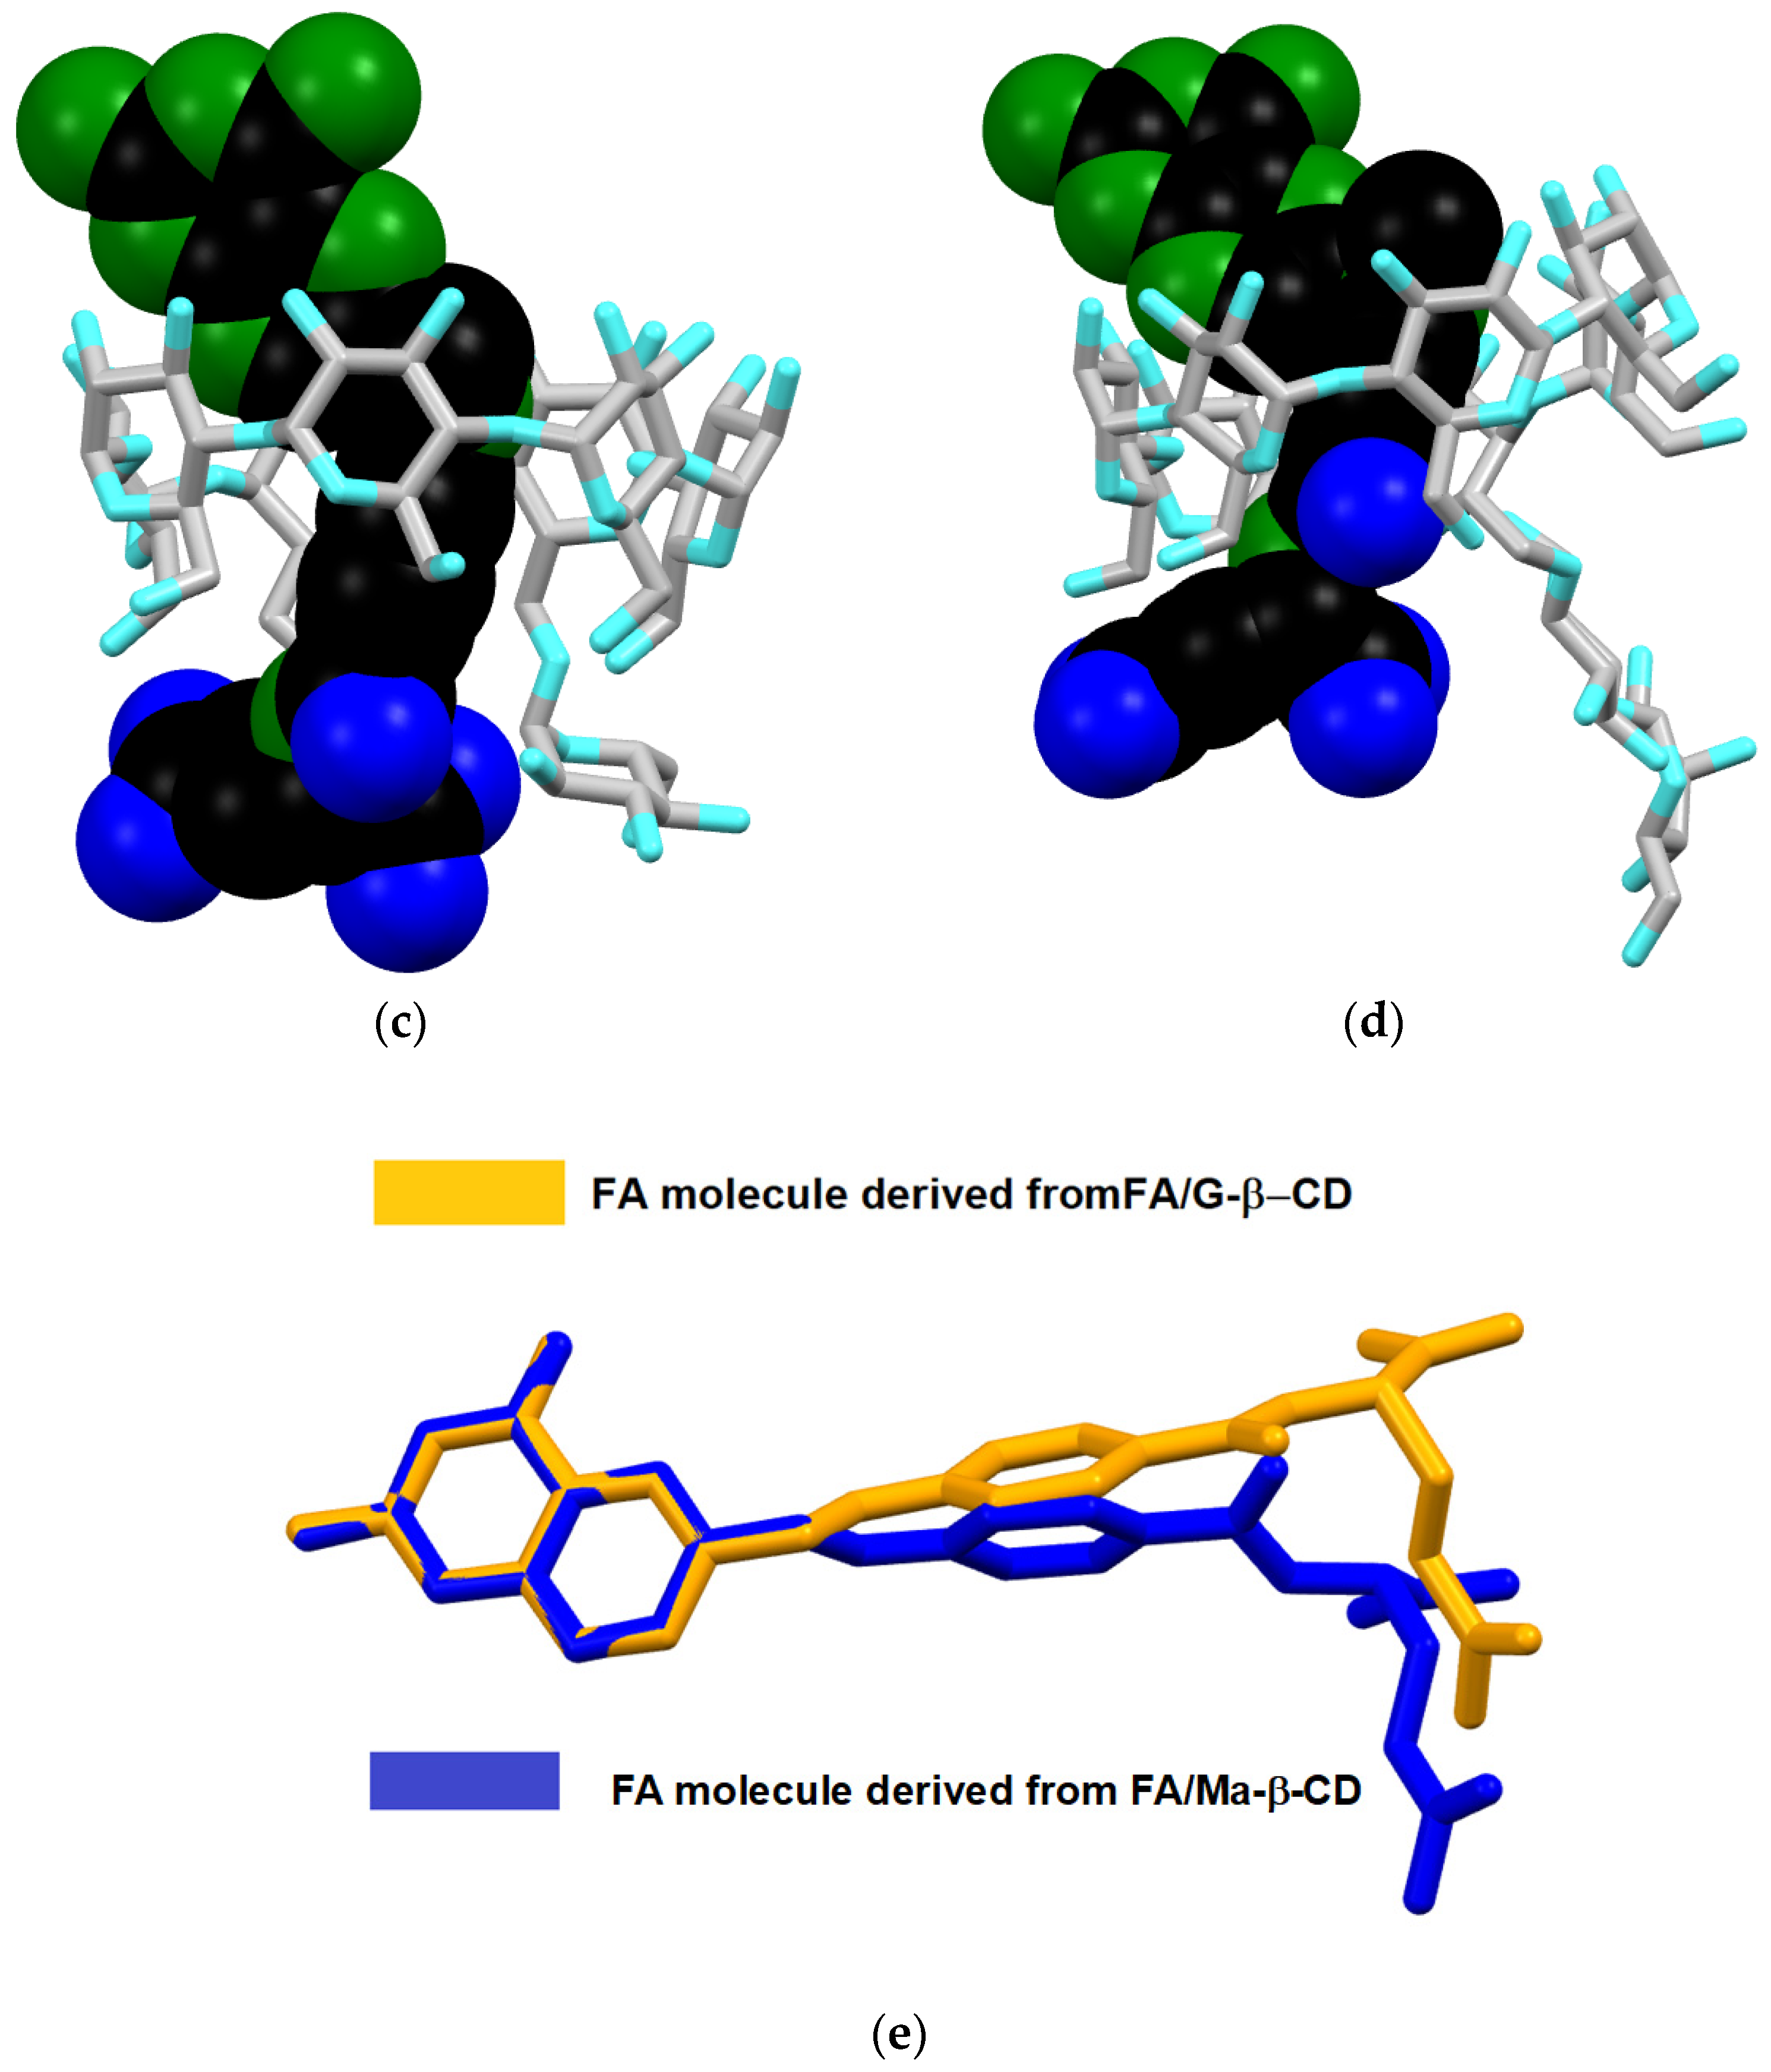
3.3. Molecular Modeling
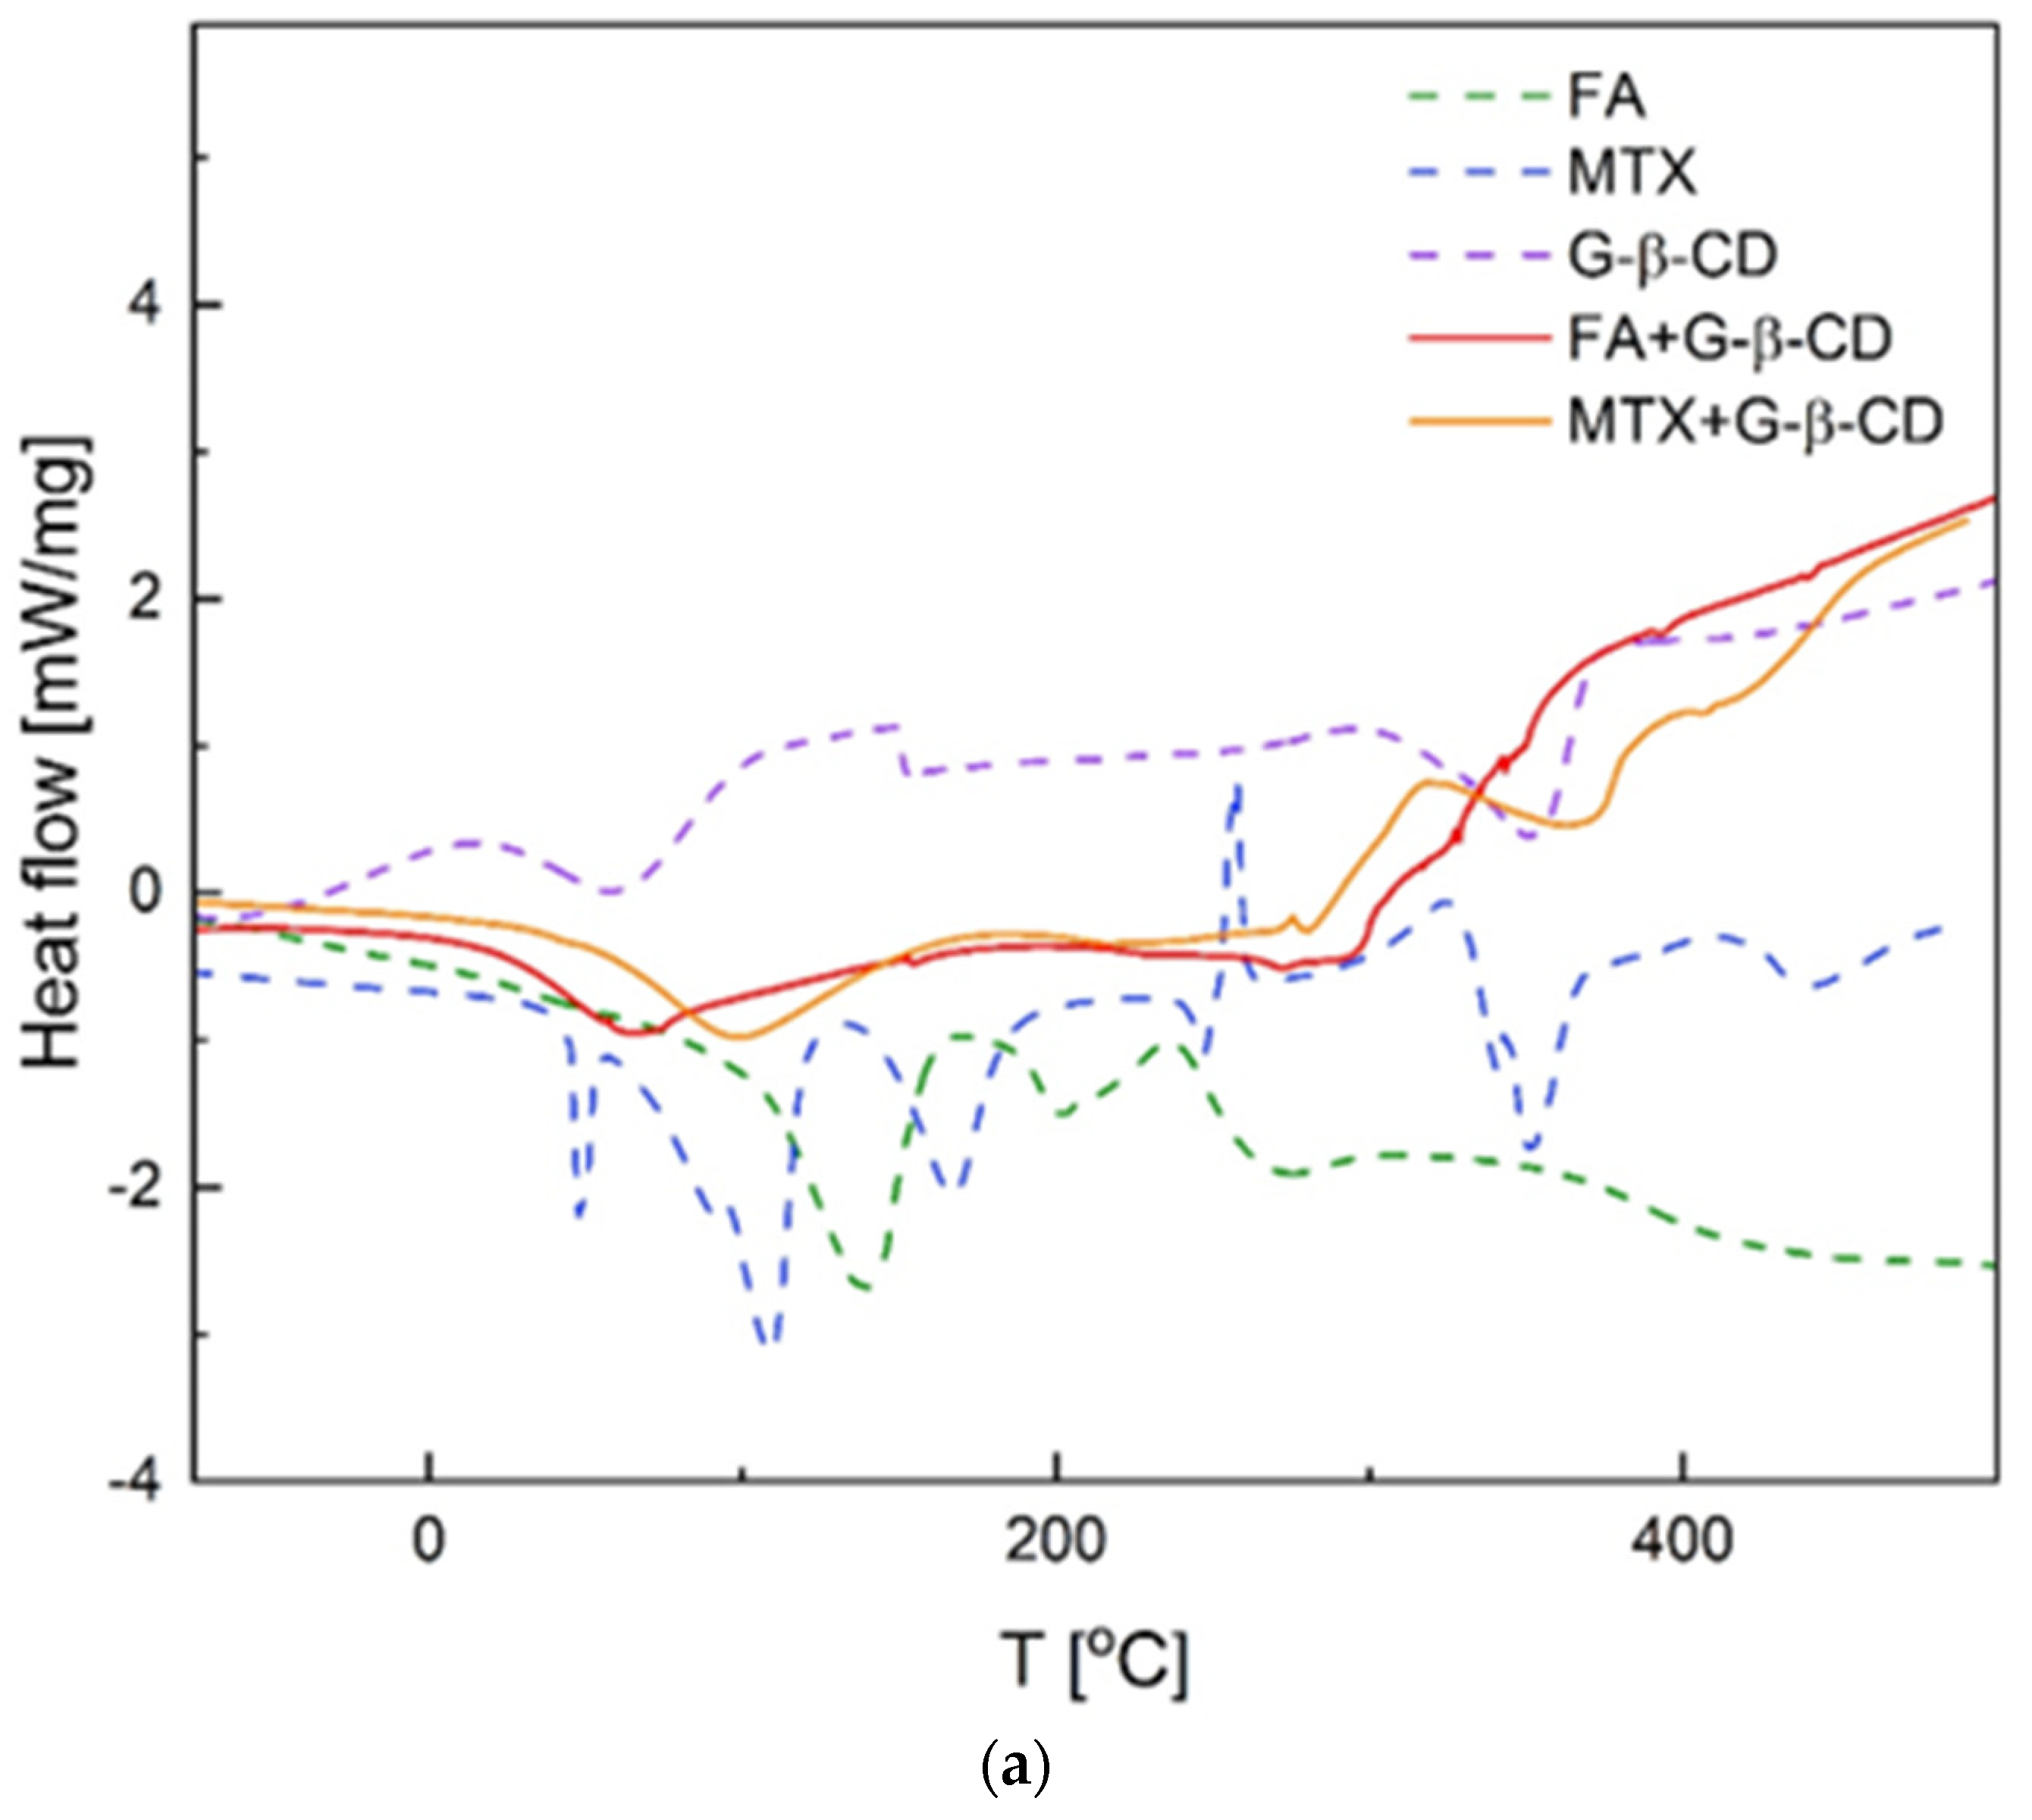
3.4. Thermal Analysis
3.5. Infrared Spectroscopy
4. Conclusions
Supplementary Materials
Author Contributions
Funding
Institutional Review Board Statement
Informed Consent Statement
Data Availability Statement
Conflicts of Interest
References
- Yan, M.; Wu, S.; Wang, Y.; Liang, M.; Wang, M.; Hu, W.; Yu, G.; Mao, Z.; Huang, F.; Zhou, J. Recent Progress of Supramolecular Chemotherapy Based on Host–Guest Interactions. Adv. Mater. 2024, 36, 2304249. [Google Scholar] [CrossRef] [PubMed]
- Brewster, M.E. Cyclodextrins as pharmaceutical solubilizers. Adv. Drug Deliv. Rev. 2007, 59, 645–666. [Google Scholar] [CrossRef] [PubMed]
- Zhang, J.X.; Ma, P.X. Cyclodextrin-based supramolecular systems for drug delivery: Recent progress and future perspective. Adv. Drug Deliv. Rev. 2013, 65, 1215–1233. [Google Scholar] [CrossRef] [PubMed]
- Tian, B.; Hua, S.; Liu, J. Cyclodextrin-based delivery systems for chemotherapeutic anticancer drugs: A review. Carbohydr. Polym. 2020, 232, 115805. [Google Scholar] [CrossRef]
- Geng, W.-C.; Sessler, J.L.; Guo, D.S. Supramolecular prodrugs based on host–guest interactions. Chem. Soc. Rev. 2020, 49, 2303–2315. [Google Scholar] [CrossRef]
- Ceborska, M. Interactions of Native Cyclodextrins with Biorelevant Molecules in the Solid State: A Review. Curr. Org. Chem. 2014, 18, 1878–1885. [Google Scholar] [CrossRef]
- Colombeau, L.; Acherar, S.; Azaïs, H.; Mordon, S.; Arnoux, P.; Baros, F.; Vanderesse, R.; Frochot, C. Stability of folic acid under several parameters. Eur. J. Pharm. Biopharm. 2016, 93, 419–430. [Google Scholar]
- Lee, J.W.; Lu, J.Y.; Low, P.S.; Fuchs, P.L. Synthesis and Evaluation of Taxol–Folic Acid Conjugates as Targeted Antineoplastics. Bioorg. Med. Chem. 2002, 10, 2397–2414. [Google Scholar] [CrossRef]
- Santra, S.; Kaittanis, C.; Santiesteban, O.J.; Perez, M.J. Cell-Specific, Activatable, and Theranostic Prodrug for Dual-Targeted Cancer Imaging and Therapy. J. Am. Chem. Soc. 2011, 133, 16680–16688. [Google Scholar] [CrossRef]
- De Santo, M.; Giovinazzo, A.; Fava, M.; Mazzotta, E.; De Napoli, I.E.; Greco, M.; Comandé, A.; Nigro, A.; Argurio, P.; Perrotta, I.; et al. Engineered Mesoporous Silica-Based Nanoparticles as Smart Chemotherapy Nanodevice for Bortezomib Administration. Mater. Chem. Front. 2023, 7, 216–229. [Google Scholar] [CrossRef]
- Sudimack, J.; Lee, R.J. Targeted drug delivery via the folate receptor. Adv. Drug Deliv. Rev. 2000, 41, 147–162. [Google Scholar] [CrossRef]
- Ceborska, M. Folate appended cyclodextrins for drug, DNA, and siRNA delivery. Eur. J. Pharm. Biopharm. 2017, 120, 133–145. [Google Scholar] [CrossRef]
- Narmani, A.; Rezvani, M.; Farhood, B.; Darkhor, P.; Mohammadnejad, J.; Amini, B.; Refahi, S.; Goushbolagh, N. Folic acid functionalized nanoparticles as pharmaceutical carriers in drug delivery systems. Drug Develop. Res. 2019, 80, 404–424. [Google Scholar] [CrossRef] [PubMed]
- Gonen, N.; Assaraf, Y.G. Antifolates in cancer therapy: Structure, activity and mechanisms of drug resistance. Drug Resist. Updat. 2012, 15, 183–210. [Google Scholar] [CrossRef] [PubMed]
- Ceborska, M.; Zimnicka, M.; Pietrzak, M.; Troć, A.; Koźbiał, M.; Lipkowski, J. Structural diversity in native cyclodextrins/folic acid complexes–from [2]-rotaxane to exclusion compound. Org. Biomol. Chem. 2012, 10, 5186–5188. [Google Scholar] [CrossRef]
- Ceborska, M.; Zimnicka, M.; Wszelaka-Rylik, M.; Troć, A. Characterization of folic acid/native cyclodextrins host-guest complexes in solution. J. Mol. Struct. 2016, 1109, 114–118. [Google Scholar] [CrossRef]
- Ceborska, M.; Kędra-Królik, K.; Kowalska, A.A.; Koźbiał, M. Comparative structural study of folic acid subunits with native cyclodextrins. Carbohydr. Polym. 2018, 184, 47–56. [Google Scholar] [CrossRef]
- Zimnicka, M.; Troć, A.; Ceborska, M.; Jakubczak, M.; Koliński, M.; Danikiewicz, W. Structural Elucidation of Specific Noncovalent Association of Folic Acid with Native Cyclodextrins Using an Ion Mobility Mass Spectrometry and Theoretical Approach. Anal. Chem. 2014, 86, 4249–4255. [Google Scholar] [CrossRef]
- Pattarino, F.; Giovanelli, L.; Giovenzana, G.B.; Rinaldi, M.; Trotta, M. Inclusion of methotrexate in alkyl-cyclodextrins: Effects of host substitutents on the stability of complexes. J. Drug Deliv. Sci. Technol. 2005, 15, 465–468. [Google Scholar] [CrossRef]
- Schonbeck, C.; Holm, R. Exploring the Origins of Enthalpy–Entropy Compensation by Calorimetric Studies of Cyclodextrin Complexes. J. Phys. Chem. B 2019, 123, 6686–6693. [Google Scholar] [CrossRef]
- Liu, L.; Yang, C.; Guo, Q.-X. Enthalpy–Entropy Compensation of Cyclodextrin Complexation with Different Classes of Substrates Compensation Effect in Cyclodextrin Complexation. Bull. Chem. Soc. Jpn. 2001, 74, 2311–2314. [Google Scholar] [CrossRef]
- Schonbeck, C.; Westh, P.; Madsen, J.C.; Larsen, K.L.; Stade, L.W.; Holm, R. Methylated β-Cyclodextrins: Influence of Degree and Pattern of Substitution on the Thermodynamics of Complexation with Tauro- and Glyco-Conjugated Bile Salts. Langmuir 2011, 27, 5832–5841. [Google Scholar] [CrossRef]
- Ceborska, M.; Zimnicka, M.; Kowalska, A.A.; Dąbrowa, K.; Repeć, B. Structural diversity in the host–guest complexes of the antifolate pemetrexed with native cyclodextrins: Gas phase, solution and solid-state studies. Beilstein J. Org. Chem. 2017, 13, 2252–2263. [Google Scholar] [CrossRef]
- Ceborska, M.; Dąbrowa, K.; Cędrowski, J.; Zimnicka, M. Hydrogen-bonded supramolecular assemblies of folic acid with simple hexoses. J. Mol. Struct. 2022, 1250, 131904. [Google Scholar] [CrossRef]
- Yoshikiyo, K.; Sugimoto, M.; Aso, Y.; Takahashi, T.; Matsui, Y.; Yamamoto, T. The effect of glucosyl-β-cyclodextrin on the hydrogen deuterium exchange rate constant of the peptide bonds of chicken egg white lysozyme in a D2O solution. J. Mol. Struct. 2008, 888, 375–378. [Google Scholar] [CrossRef]
- Liu, B.; Zhao, J.; Liu, Y.; Zhu, X.; Zeng, J. Physiochemical Properties of the Inclusion Complex of Puearin and Glucosyl-β-Cyclodextrin. J. Agric. Food Chem. 2012, 60, 12501–12507. [Google Scholar] [CrossRef] [PubMed]
- Akita, T.; Matsui, Y.; Yamamoto, T. A 1H NMR titration study on the binding constants for D- and L-tryptophan inclusion complexes with 6-O-α-D-glucosyl-β-cyclodextrin. Formation of 1:1 and 2:1 (host:guest) complexes. J. Mol. Struc. 2014, 1060, 138–141. [Google Scholar] [CrossRef]
- Liu, B.; Li, Y.; Xiao, H.; Liu, Y.; Mo, H.; Ma, H.; Liang, G. Characterization of the Supermolecular Structure of Polydatin/6-O-α-Maltosyl-β-cyclodextrin Inclusion Complex. J. Food Sci. 2015, 80, C1156–C1160. [Google Scholar] [CrossRef]
- Gans, P.; Sabatini, A.; Vacca, A. Investigation of equilibria in solution. Determination of equilibrium constants with the HYPERQUAD suite of programs. Talanta 1996, 43, 1739–1753. [Google Scholar] [CrossRef]
- Gans, P.; Sabatini, A.; Vacca, A. Determination of equilibrium constants from spectrophometric data obtained from solutions of known pH: The program pHab. Ann. Chim. 1999, 89, 45–49. [Google Scholar]
- Gans, P.; Sabatini, A.; Vacca, A. Hypspec. Protonic Software: Leeds, UK; Florence, Italy, 2000. [Google Scholar]
- Thordarson, P. Determining association constants from titration experiments in supramolecular chemistry. Chem. Soc. Rev. 2011, 40, 1305–1323. [Google Scholar] [CrossRef]
- Ulatowski, F.; Dąbrowa, K.; Bałakier, T.; Jurczak, J. Recognizing the Limited Applicability of Job Plots in Studying Host-Guest Interactions in Supramolecular Chemistry. J. Org. Chem. 2016, 81, 1746–1756. [Google Scholar] [CrossRef] [PubMed]
- Hibbert, D.B.; Thordarson, P. The death of the Job plot, transparency, open science and online tools, uncertainty estimation methods and other developments in supramolecular chemistry data analysis. Chem. Commun. 2016, 52, 12792–12805. [Google Scholar] [CrossRef] [PubMed]
- Groom, C.R.; Bruno, I.J.; Lightfoot, M.P.; Ward, S.C. The Cambridge Structural Database. Acta Cryst. 2016, B72, 171–179. [Google Scholar] [CrossRef] [PubMed]
- Neese, F. Software update: The ORCA program system—Version 5.0. Wiley Interdiscip. Rev. Comput. Mol. Sci. 2022, 12, e1606. [Google Scholar] [CrossRef]
- Becke, A.D. Density-functional exchange-energy approximation with correct asymptotic behavior. Phys. Rev. A 1988, 38, 3098–3100. [Google Scholar] [CrossRef]
- Grimme, S.; Antony, J.; Ehrlich, S.; Krieg, H. A consistent and accurate ab initio parametrization of density functional dispersion correction (DFT-D) for the 94 elements H-Pu. J. Chem. Phys. 2010, 132, 154104. [Google Scholar] [CrossRef]
- Grimme, S.; Ehrlich, S.; Goerigk, L. Efect of the damping function in dispersion corrected density functional theory. J. Comput. Chem. 2011, 32, 1456–1465. [Google Scholar] [CrossRef]
- Kruse, H.; Grimme, S. A geometrical correction for the inter- and intra-molecular basis set superposition error in Hartree-Fock and density functional theory calculations for large systems. J. Chem. Phys. 2012, 136, 154101. [Google Scholar] [CrossRef]
- Chai, J.D.; Head-Gordon, M. Systematic optimization of long-range corrected hybrid density functionals. J. Chem. Phys. 2008, 128, 84106. [Google Scholar] [CrossRef]
- Stewart, J.J.P. Optimization of parameters for semiempirical methods I. Method. J. Comput. Chem. 1989, 10, 209–220. [Google Scholar] [CrossRef]
- Sure, R.; Grimme, S. Corrected small basis set Hartree-Fock method for large systems. J. Comput. Chem. 2013, 34, 1672–1685. [Google Scholar] [CrossRef] [PubMed]
- Hofsäss, M.A.; Souza, J.; Silva-Barcellos, N.M.; Bellavinha, K.R.; Abrahamsson, B.; Cristofoletti, R.; Groot, D.W.; Parr, A.; Langguth, P.; Polli, J.E.; et al. Biowaiver Monographs for Immediate-Release Solid Oral Dosage Forms: Folic Acid. J. Pharm. Sci. 2017, 106, 3421–3430. [Google Scholar] [CrossRef] [PubMed]
- Pile, K.D.; Graham, G.G. Methotrexate. In Compendium of Inflammatory Diseases; Parnham, M.J., Ed.; Springer: Basel, Switzerland, 2016. [Google Scholar]
- Magri, V.R.; Rocha, M.A.; de Matos, C.S.; Petersen, P.A.D.; Leroux, F.; Petrilli, H.M.; Constantino, V.R.L. Folic Acid and Sodium Folate Salts: Thermal Behavior and Spectroscopic (IR, Raman, and Solid-State 13C NMR) Characterization. Spectrochim. Acta Part A Mol. Biomol. Spectrosc. 2022, 273, 120981. [Google Scholar] [CrossRef]
- Okada, Y.; Kubota, Y.; Koizumi, K.; Hizukuri, S.; Ohfuji, T.; Ogata, K. Some properties and Inclusion Behavior of Branched Cyclodextrins. Chem. Pharm. Bull. 1988, 36, 2176–2185. [Google Scholar] [CrossRef]


| FA | MTX | |||
|---|---|---|---|---|
| Stoichiometry (H:G) | Ka [M−1] | Stoichiometry (H:G) | Ka [M−1] | |
| β-CD | 1:1 | 131 ± 10.5 [16] | 1:1 | 389.7 ± 104.5 [19] |
| G-β-CD | 1:1 | 264 ± 0.9 | 1:1 | 630 ± 5.5 |
| Ma-β-CD | 1:1 | 251 ± 0.8 | 1:1 | 637 ± 8.6 |
| (a) Signal | FA | FA + G-β-CD | |
| δ/ppm | δ/ppm | Δδ/ppm | |
| FA#H3 | 8.65 | 8.69 | +0.04 |
| FA #H4 | 4.57 | ns* | Ns * |
| FA #H6 | 6.79 | 6.84 | +0.05 |
| FA #H7 | 7.70 | 7.74 | +0.04 |
| FA #H10A | 2.05 | 2.07 | +0.02 |
| FA #H10B | 2.17 | 2.22 | +0.05 |
| FA #H11 | 2.25 | 2.32 | +0.07 |
| (b) Signal | MTX | MTX + G-β-CD | |
| δ/ppm | δ/ppm | Δδ/ppm | |
| MTX#H3 | 8.67 | 8.50 | −0.17 |
| MTX #H4 | 4.86 | 4.96 | −0.1 |
| MTX #H5 | 3.24 | 3.33 | −0.07 |
| MTX #H6 | 6.99 | 6.68 | −0.31 |
| MTX #H7 | 7.79 | 7.72 | −0.07 |
| MTX #H9 | 4.36 | 4.42 | −0.06 |
Disclaimer/Publisher’s Note: The statements, opinions and data contained in all publications are solely those of the individual author(s) and contributor(s) and not of MDPI and/or the editor(s). MDPI and/or the editor(s) disclaim responsibility for any injury to people or property resulting from any ideas, methods, instructions or products referred to in the content. |
© 2024 by the authors. Licensee MDPI, Basel, Switzerland. This article is an open access article distributed under the terms and conditions of the Creative Commons Attribution (CC BY) license (https://creativecommons.org/licenses/by/4.0/).
Share and Cite
Ceborska, M.; Siklitskaya, A.; Kowalska, A.A.; Kędra, K. Synergetic Effect of β-Cyclodextrin and Its Simple Carbohydrate Substituents on Complexation of Folic Acid and Its Structural Analog Methotrexate. Pharmaceutics 2024, 16, 1161. https://doi.org/10.3390/pharmaceutics16091161
Ceborska M, Siklitskaya A, Kowalska AA, Kędra K. Synergetic Effect of β-Cyclodextrin and Its Simple Carbohydrate Substituents on Complexation of Folic Acid and Its Structural Analog Methotrexate. Pharmaceutics. 2024; 16(9):1161. https://doi.org/10.3390/pharmaceutics16091161
Chicago/Turabian StyleCeborska, Magdalena, Aleksandra Siklitskaya, Aneta Aniela Kowalska, and Karolina Kędra. 2024. "Synergetic Effect of β-Cyclodextrin and Its Simple Carbohydrate Substituents on Complexation of Folic Acid and Its Structural Analog Methotrexate" Pharmaceutics 16, no. 9: 1161. https://doi.org/10.3390/pharmaceutics16091161