
Enhancing the Oral Bioavailability of Glutathione Using Innovative Analogue Approaches


 , ,
, ,  ,
,  and
and
Abstract
1. Introduction
2. Materials and Methods
2.1. Materials
2.2. Synthesis of Glutathione and Analogues
2.3. Characterisation and Purification
2.3.1. Reverse-Phase High-Performance Liquid Chromatography
2.3.2. Electrospray Ionisation Mass Spectra
2.3.3. Fourier Transformed Infra-Red Spectroscopy
2.3.4. Nuclear Magnetic Resonance
2.4. Biological Screening
2.4.1. Stability
2.4.2. Enzymatic and Cellular Degradation
2.4.3. γ-Glutamyl Transferase Degradation
2.4.4. Glutathione S-Transferase Assay
2.4.5. Glutathione Reductase and Glutathione Peroxidase Assay
2.4.6. Cell Culture
2.4.7. Cytotoxicity
2.4.8. UV Rescue
2.4.9. In Vivo Study
2.5. Statistical Analysis
3. Results and Discussion
3.1. Synthesis of 1.61–1.65 and 1.70–1.71
3.2. Characterisation Studies
3.2.1. Analogue 1.61
3.2.2. Analogue 1.62
3.2.3. Analogue 1.63
3.2.4. Analogue 1.64
3.2.5. Analogue 1.70
3.3. Biological Screening
3.3.1. Stability
3.3.2. Enzymatic and Cell Degradation
3.3.3. γ-Glutamyl Transferase Degradation
3.3.4. Glutathione S-Transferase Efficacy
3.3.5. Glutathione Peroxidase and Glutathione Reductase Efficacy
3.3.6. Cytotoxicity
3.3.7. UV Rescue
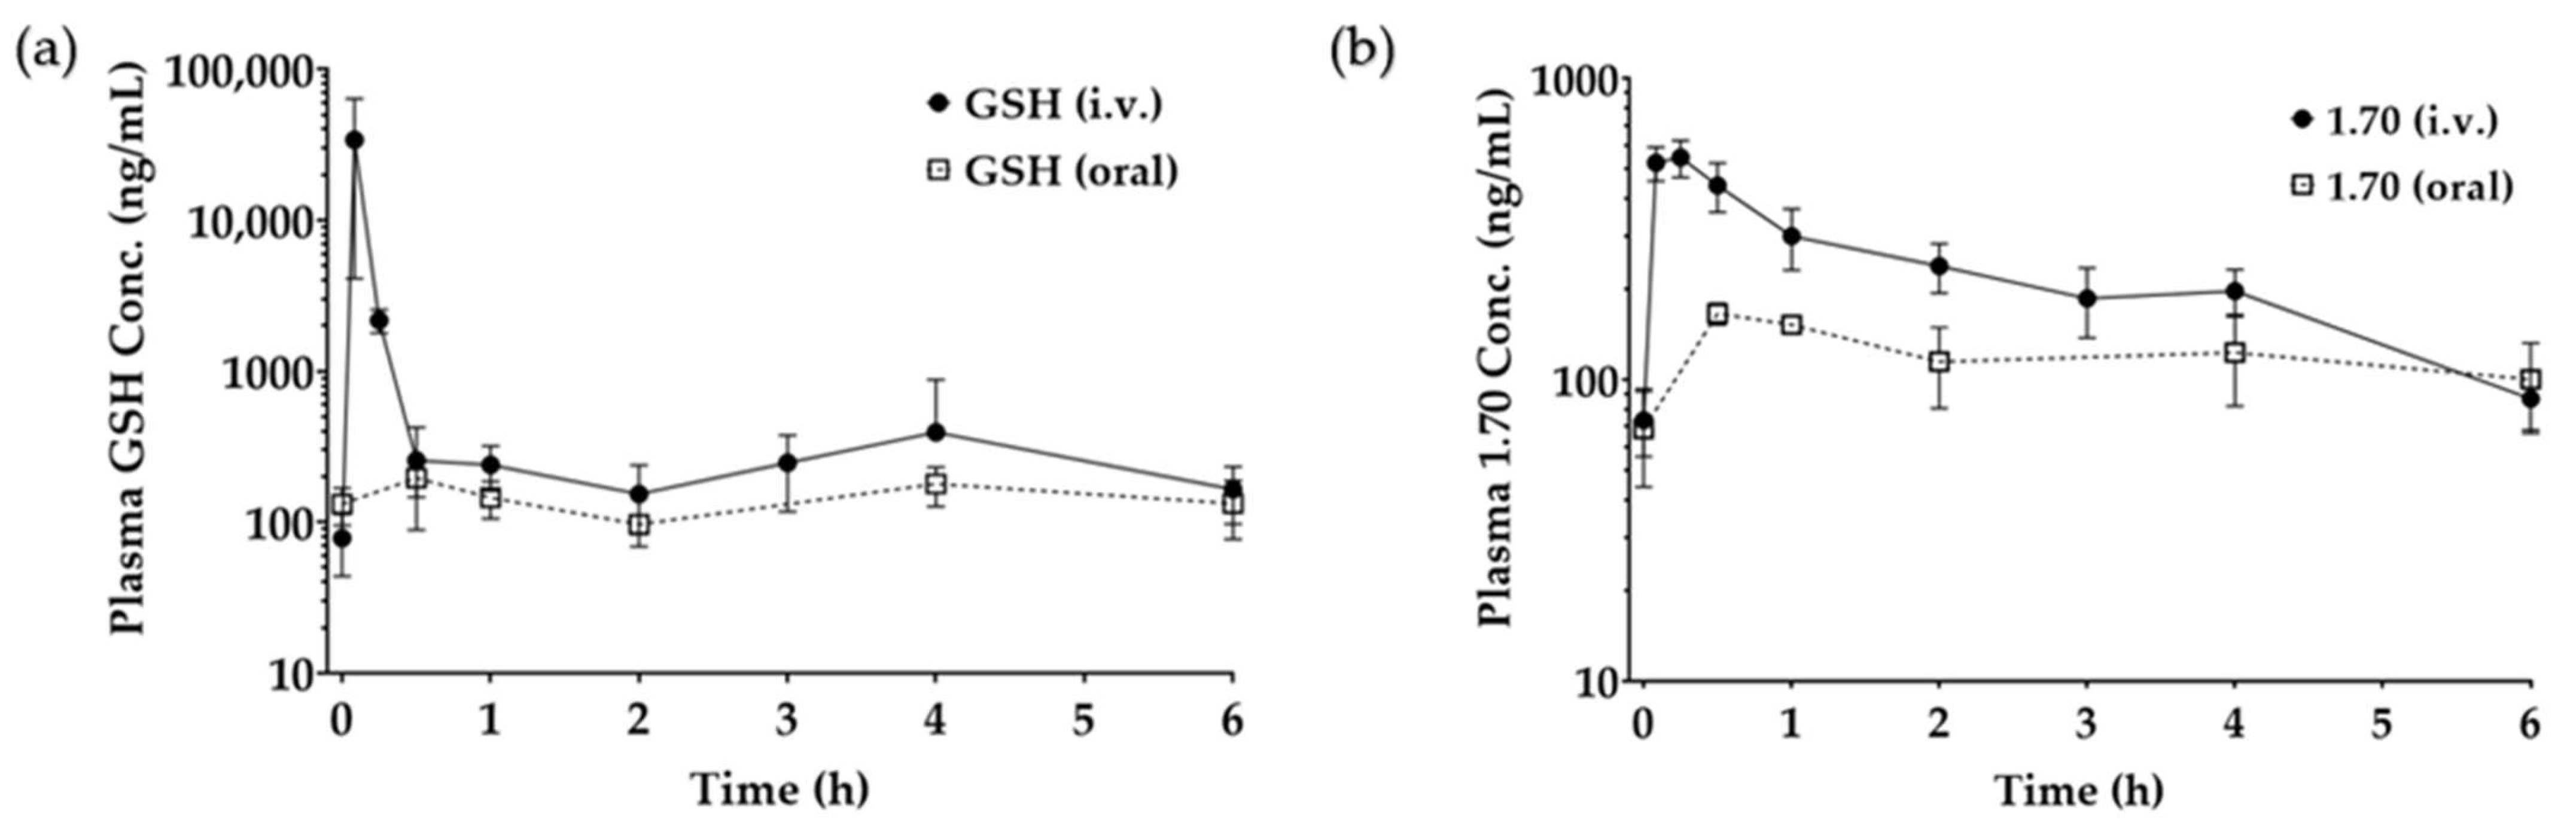
3.3.8. In Vivo Study
4. Conclusions
Supplementary Materials
Author Contributions
Funding
Institutional Review Board Statement
Informed Consent Statement
Data Availability Statement
Conflicts of Interest
References
- Goki, N.H.; Tehranizadeh, Z.A.; Saberi, M.R.; Khameneh, B.; Bazzaz, B.S.F. Structure, Function, and Physicochemical Properties of Pore-Forming Antimicrobial Peptides. Curr. Pharm. Biotechnol. 2024, 25, 1041–1057. [Google Scholar] [CrossRef]
- Muttenthaler, M.; King, G.F.; Adams, D.J.; Alewood, P.F. Trends in Peptide Drug Discovery. Nat. Rev. Drug Discov. 2021, 20, 309–325. [Google Scholar] [CrossRef]
- Mohammed, Y.; Holmes, A.; Kwok, P.C.L.; Kumeria, T.; Namjoshi, S.; Imran, M.; Matteucci, L.; Ali, M.; Tai, W.; Benson, H.A.E.; et al. Advances and Future Perspectives in Epithelial Drug Delivery. Adv. Drug Deliv. Rev. 2022, 186, 114293. [Google Scholar] [CrossRef]
- Marinheiro, D.; Martel, F.; Ferreira, B.J.M.L.; Daniel-da-Silva, A.L. Silica-Based Nanomaterials for Diabetes Mellitus Treatment. Bioengineering 2022, 10, 40. [Google Scholar] [CrossRef]
- Liu, M.; Sharma, M.; Lu, G.; Zhang, Z.; Song, W.; Wen, J. Innovative Solid Lipid Nanoparticle-Enriched Hydrogels for Enhanced Topical Delivery of L-Glutathione: A Novel Approach to Anti-Ageing. Pharmaceutics 2024, 17, 4. [Google Scholar] [CrossRef]
- Liu, M.; Sharma, M.; Lu, G.; Yin, N.; Gailani, M.A.; Sreebhavan, S.; Wen, J. Preformulation Studies of L-Glutathione: Physicochemical Properties, Degradation Kinetics, and In vitro Cytotoxicity Investigations. Drug Dev. Ind. Pharm. 2020, 46, 717–731. [Google Scholar] [CrossRef]
- Liu, S.; Wen, X.; Zhang, X.; Mao, S. Oral Delivery of Biomacromolecules by Overcoming Biological Barriers in the Gastrointestinal Tract: An Update. Expert Opin. Drug Deliv. 2023. ahead-of-print. [Google Scholar] [CrossRef]
- Guan, X. Glutathione and Glutathione Disulfide—Their Biomedical and Pharmaceutical Applications. Med. Chem. Res. 2023, 32, 1972–1994. [Google Scholar] [CrossRef]
- Wei, T.; Thakur, S.S.; Liu, M.; Wen, J. Oral Delivery of Glutathione: Antioxidant Function, Barriers and Strategies. Acta Mater. Medica 2022, 1, 177–192. [Google Scholar] [CrossRef]
- Zhang, C.; He, Y.; Sun, X.; Wei, W.; Liu, Y.; Rao, Y. PROTACs Targeting Epigenetic Proteins. Acta Mater. Medica 2023, 2, 409–429. [Google Scholar] [CrossRef]
- Bai, R.; Guo, J.; Ye, X.; Xie, Y.; Xie, T. Oxidative Stress: The Core Pathogenesis and Mechanism of Alzheimer’s Disease. Ageing Res. Rev. 2022, 77, 101619. [Google Scholar] [CrossRef] [PubMed]
- Dionísio, P.A.; Amaral, J.D.; Rodrigues, C.M.P. Oxidative Stress and Regulated Cell Death in Parkinson’s Disease. Ageing Res. Rev. 2021, 67, 101263. [Google Scholar] [CrossRef] [PubMed]
- An, X.; Yu, W.; Liu, J.; Tang, D.; Yang, L.; Chen, X. Oxidative Cell Death in Cancer: Mechanisms and Therapeutic Opportunities. Cell Death Dis. 2024, 15, 556. [Google Scholar] [CrossRef] [PubMed]
- Zamudio-Cuevas, Y.; Martínez-Flores, K.; Martínez-Nava, G.A.; Clavijo-Cornejo, D.; Fernández-Torres, J.; Sánchez-Sánchez, R. Rheumatoid Arthritis and Oxidative Stress. Cell. Mol. Biol. 2022, 68, 174–184. [Google Scholar] [CrossRef]
- Caturano, A.; D’Angelo, M.; Mormone, A.; Russo, V.; Mollica, M.P.; Salvatore, T.; Galiero, R.; Rinaldi, L.; Vetrano, E.; Marfella, R.; et al. Oxidative Stress in Type 2 Diabetes: Impacts from Pathogenesis to Lifestyle Modifications. Curr. Issues Mol. Biol. 2023, 45, 6651–6666. [Google Scholar] [CrossRef]
- Vašková, J.; Kočan, L.; Vaško, L.; Perjési, P. Glutathione-Related Enzymes and Proteins: A Review. Molecules 2023, 28, 1447. [Google Scholar] [CrossRef]
- Georgiou-Siafis, S.K.; Tsiftsoglou, A.S. The Key Role of GSH in Keeping the Redox Balance in Mammalian Cells: Mechanisms and Significance of GSH in Detoxification Via Formation of Conjugates. Antioxidants 2023, 12, 1953. [Google Scholar] [CrossRef]
- Vairetti, M.; Di Pasqua, L.G.; Cagna, M.; Richelmi, P.; Ferrigno, A.; Berardo, C. Changes in Glutathione Content in Liver Diseases: An Update. Antioxidants 2021, 10, 364. [Google Scholar] [CrossRef]
- Das, B.; Baidya, A.T.K.; Mathew, A.T.; Yadav, A.K.; Kumar, R. Structural Modification Aimed for Improving Solubility of Lead Compounds in Early Phase Drug Discovery. Bioorganic Med. Chem. 2022, 56, 116614. [Google Scholar] [CrossRef]
- Alizadeh, S.R.; Ebrahimzadeh, M.A. Quercetin Derivatives: Drug Design, Development, and Biological Activities, a Review. Eur. J. Med. Chem. 2022, 229, 114068. [Google Scholar] [CrossRef]
- Zhang, C.; Chen, S.; Fu, X.; Dedkova, L.M.; Hecht, S.M. Enhancement of N-Methyl Amino Acid Incorporation into Proteins and Peptides using Modified Bacterial Ribosomes and Elongation Factor P. ACS Chem. Biol. 2024, 19, 1330–1338. [Google Scholar] [CrossRef] [PubMed]
- Worsawat, P.; Noppawan, P.; Supanchaiyamat, N.; Wu, H.; McElroy, C.R.; Hunt, A.J. A Novel Approach to Amino Acid Synthesis: Acid-Assisted Reactions with Dimethyl Carbonate for Efficient O-Methylated, N, O-Methylated and N -Formylated Derivatives. Green Chem. Int. J. Green Chem. Resour. GC 2024, 26, 3747–3757. [Google Scholar] [CrossRef]
- Yin, N. Enhancing the Oral Bioavailability of Peptide Drugs by using Chemical Modification and Other Approaches. Med. Chem. 2014, 4, 763–769. [Google Scholar] [CrossRef]
- Han, Y.; Spicer, J.; Huang, Y.; Bunt, C.; Liu, M.; Wen, J. Advancements in Oral Insulin: A Century of Research and the Emergence of Targeted Nanoparticle Strategies. Eur. J. Lipid Sci. Technol. 2024, 126, 2300271. [Google Scholar] [CrossRef]
- Al Gailani, M.; Liu, M.; Wen, J. Ligands for Oral Delivery of Peptides Across the Blood-Brain-Barrier. Acta Mater. Medica 2022, 1, 106–123. [Google Scholar] [CrossRef]
- Sharma, A.; Kumar, A.; de la Torre, B.G.; Albericio, F. Liquid-Phase Peptide Synthesis (LPPS): A Third Wave for the Preparation of Peptides. Chem. Rev. 2022, 122, 13516–13546. [Google Scholar] [CrossRef]
- Ferrazzano, L.; Catani, M.; Cavazzini, A.; Martelli, G.; Corbisiero, D.; Cantelmi, P.; Fantoni, T.; Mattellone, A.; De Luca, C.; Felletti, S.; et al. Sustainability in Peptide Chemistry: Current Synthesis and Purification Technologies and Future Challenges. Green Chem. Int. J. Green Chem. Resour. GC 2022, 24, 975–1020. [Google Scholar] [CrossRef]
- Meng, Y.; Huang, R. Site-Specific Methylation on A-N-Terminus of Peptides through Chemical and Enzymatic Methods. Methods Enzymol. 2023, 684, 113–133. [Google Scholar]
- Acker, M.G.; Auld, D.S. Considerations for the Design and Reporting of Enzyme Assays in High-Throughput Screening Applications. Perspect. Sci. 2014, 1, 56–73. [Google Scholar] [CrossRef]
- Zerarka-Chabane, N.; Laraba-Djebari, F.; Hammoudi-Triki, D. Mast Cells Modulate the Immune Response and Redox Status of the Gastrointestinal Tract in Induced Venom Pathogenesis. Inflammation 2022, 45, 509–527. [Google Scholar] [CrossRef]
- Myers, A.L.; Kawedia, J.D.; Champlin, R.E.; Kramer, M.A.; Nieto, Y.; Ghose, R.; Andersson, B.S. Clarifying Busulfan Metabolism and Drug Interactions to Support New Therapeutic Drug Monitoring Strategies: A Comprehensive Review. Expert Opin. Drug Metab. Toxicol. 2017, 13, 901–923. [Google Scholar] [CrossRef] [PubMed]
- Ikeda, Y.; Fujii, J. The Emerging Roles of Γ-Glutamyl Peptides Produced by Γ-Glutamyltransferase and the Glutathione Synthesis System. Cells 2023, 12, 2831. [Google Scholar] [CrossRef] [PubMed]
- Liu, M.; Svirskis, D.; Proft, T.; Loh, J.; Chen, S.; Kang, D.; Wen, J. Exploring Ex Vivo Peptideolysis of Thymopentin and Lipid-Based Nanocarriers Towards Oral Formulations. Int. J. Pharm. 2022, 625, 122123. [Google Scholar] [CrossRef]
- Ma, Y.; Wang, Q.; Zhu, Q.; Liu, M.; Chen, D.; Han, Z.; Zhang, C.; Lv, L.; Gu, Y. Dual Fluorescence Nanoconjugates for Ratiometric Detection of Reactive Oxygen Species in Inflammatory Cells. J. Biophotonics 2018, 11, e201700015. [Google Scholar] [CrossRef]
- Liu, M.; Svirskis, D.; Proft, T.; Loh, J.M.S.; Wen, J. Preformulation Studies of Thymopentin: Analytical Method Development, Physicochemical Properties, Kinetic Degradation Investigations and Formulation Perspective. Drug Dev. Ind. Pharm. 2022, 47, 1680–1692. [Google Scholar] [CrossRef]
- Liu, M.; Svirskis, D.; Proft, T.; Loh, J.; Huang, Y.; Wen, J. Cellular Uptake and Transport Mechanism Investigations of PEGylated Niosomes for Improving the Oral Delivery of Thymopentin. Pharmaceutics 2024, 16, 397. [Google Scholar] [CrossRef]
- Nair, A.B.; Jacob, S. A Simple Practice Guide for Dose Conversion between Animals and Human. J. Basic Clin. Pharm. 2016, 7, 27–31. [Google Scholar] [CrossRef]
- International Council for Harmonisation (ICH). Validation of Analytical Procedures: Text and Methodology Q2(R1); ICH Secretariat: Geneva, Switzerland, 2005; pp. 1–15. Available online: https://somatek.com/wp-content/uploads/2014/06/sk140605h.pdf (accessed on 17 March 2025).
- Wołczański, G.; Lisowski, M. A General Method for Preparation of N-Boc-protected Or N-Fmoc-protected A,Β-didehydropeptide Building Blocks and their use in the Solid-phase Peptide Synthesis. J. Pept. Sci. 2018, 24, e3091. [Google Scholar] [CrossRef]
- Zhu, Y.; Lao, F.; Pan, X.; Wu, J. Food Protein-Derived Antioxidant Peptides: Molecular Mechanism, Stability and Bioavailability. Biomolecules 2022, 12, 1622. [Google Scholar] [CrossRef]
- Li, X.; Wang, N.; Liu, Y.; Li, W.; Bai, X.; Liu, P.; He, C. Backbone N-Methylation of Peptides: Advances in Synthesis and Applications in Pharmaceutical Drug Development. Bioorganic Chem. 2023, 141, 106892. [Google Scholar] [CrossRef]
- Shi, S.M.; Di, L. Strategies to Optimize Peptide Stability and Prolong Half-Life. In Peptide Therapeutics; Springer International Publishing AG: Cham, Switzerland, 2022; Volume 47, pp. 163–182. [Google Scholar]
- Raj Rai, S.; Bhattacharyya, C.; Sarkar, A.; Chakraborty, S.; Sircar, E.; Dutta, S.; Sengupta, R. Glutathione: Role in Oxidative/Nitrosative Stress, Antioxidant Defense, and Treatments. ChemistrySelect 2021, 6, 4566–4590. [Google Scholar] [CrossRef]
- Ahmad, A.M.; Mohammed, H.A.; Faris, T.M.; Hassan, A.S.; Mohamed, H.B.; El Dosoky, M.I.; Aboubakr, E.M. Nano-Structured Lipid Carrier-Based Oral Glutathione Formulation Mediates Renoprotection Against Cyclophosphamide-Induced Nephrotoxicity, and Improves Oral Bioavailability of Glutathione Confirmed through RP-HPLC Micellar Liquid Chromatography. Molecules 2021, 26, 7491. [Google Scholar] [CrossRef] [PubMed]
- Li, Y.; Li, W.; Xu, Z. Improvement on Permeability of Cyclic Peptide/Peptidomimetic: Backbone N-Methylation as A Useful Tool. Mar. Drugs 2021, 19, 311. [Google Scholar] [CrossRef] [PubMed]
- Pinto, S.F.T.; Santos, H.A.; Sarmento, B.F.C.C. New Insights into Nanomedicines for Oral Delivery of Glucagon-like Peptide-1 Analogs. Wiley interdisciplinary reviews. Nanomed. Nanobiotechnology 2024, 16, e1952. [Google Scholar] [CrossRef]
- Cheng, X.; Xu, H.; Ran, H.; Liang, G.; Wu, F. Glutathione-Depleting Nanomedicines for Synergistic Cancer Therapy. ACS Nano 2021, 15, 8039–8068. [Google Scholar] [CrossRef]
- Ma, W.; Wang, X.; Zhang, D.; Mu, X. Research Progress of Disulfide Bond Based Tumor Microenvironment Targeted Drug Delivery System. Int. J. Nanomed. 2024, 19, 7547–7566. [Google Scholar] [CrossRef]


| Name | Structure | Molecular Weight/gmol−1 |
|---|---|---|
| 1.61 |  | 307.32 |
| 1.62 |  | 307.32 |
| 1.63 |  | 307.32 |
| 1.64 | 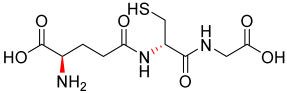 | 307.32 |
| 1.65 | 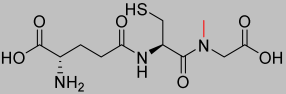 | 321.35 |
| 1.70 | 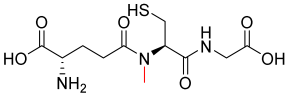 | 321.35 |
| 1.71 |  | 321.35 |
| Compound | Building Block A, 3eq | Mass of A/g | Building Block B, 5eq | Mass of B/g | Building Block C, 5eq | Mass of C/g |
|---|---|---|---|---|---|---|
| 1.61 | Fmoc-Gly-OH | 0.446 | Fmoc-Cys(Trt)-OH | 1.465 | Fmoc-Glu-OtBu | 1.064 |
| 1.62 | Fmoc-Gly-OH | 0.446 | Fmoc-D-Cys(Trt)-OH | 1.465 | Fmoc-Glu-OtBu | 1.064 |
| 1.63 | Fmoc-Gly-OH | 0.446 | Fmoc-Cys(Trt)-OH | 1.465 | Fmoc-D-Glu-OtBu | 1.064 |
| 1.64 | Fmoc-Gly-OH | 0.446 | Fmoc-D-Cys(Trt)-OH | 1.465 | Fmoc-D-Glu-OtBu | 1.064 |
| 1.65 | Fmoc-Sar-OH | 0.467 | Fmoc-Cys(Trt)-OH | 1.465 | Fmoc-Glu-OtBu | 1.064 |
| 1.70 | Fmoc-Gly-OH | 0.467 | Fmoc-Cys(Trt)-OH | 1.465 | Fmoc-Glu-OtBu | 1.064 |
| 1.71 | Fmoc-Gly-OH | 0.446 | Fmoc-Cys(Trt)-OH | 1.465 | Fmoc-Glu-OtBu | 1.064 |
| pH | GSH t½ (h) |
|---|---|
| 2.0 | 202.7 ± 10.1 |
| 7.4 | 46.3 ± 2.3 |
| 12.0 | 2.5 ± 0.1 |
| Enzyme | GSH t½ (h) | Concentration (UmL−1) |
|---|---|---|
| Trypsin | 5.8 ± 0.3 | 10 |
| Pepsin | 31.4 ± 1.6 | 10 |
| Chymotrypsin | 4.6 ± 0.2 | 10 |
| Aminopeptidase | 18.9 ± 0.9 | 10 |
| GGT | 0.7 ± 0.03 | 10 |
| Jejunum luminal contents | 30.5 ± 1.5 | N/A |
| Jejunum mucosal contents | 9.4 ± 2.0 | N/A |
| Name | Equation | R2 Value | % Degradation |
|---|---|---|---|
| 1.61 | −0.0125x + 4.1334 | 0.9187 | 100 |
| 1.62 | −0.0107x + 4.5977 | 0.9911 | 82.3 |
| 1.63 | −0.0041x + 1.9982 | 0.9814 | 72.7 |
| 1.64 | −0.0034x + 1.9619 | 0.9478 | 60.2 |
| 1.65 | −0.0054x + 1.9908 | 0.9956 | 122.2 |
| 1.70 | −0.0004x + 2.2060 | 0.8911 | 11.7 |
| 1.71 | −0.0004x + 2.0026 | 0.9121 | 11.7 |
| Name | GGT Degradation < 50% | GST Activity > 50% | GT/GPx Activity > 50% |
|---|---|---|---|
| GSH | X | ✔ | ✔ |
| 1.61 | X | ✔ | ✔ |
| 1.62 | X | X | X |
| 1.63 | X | X | ✔ |
| 1.64 | X | ✔ | X |
| 1.65 | X | X | ✔ |
| 1.70 | ✔ | ✔ | ✔ |
| 1.71 | ✔ | X | ✔ |
| Name | IC50 (mmolL−1) |
|---|---|
| GSH (commercial) | >3.25 |
| 1.61 (synthesised) | >3.25 |
| 1.62 | >3.25 |
| 1.63 | >3.25 |
| 1.64 | >3.25 |
| 1.65 | 0.984 |
| 1.70 | >3.25 |
| Name | IC50 (mmolL−1) |
| Name | % Cell Viability (no UV) | % Cell Viability (with UV) |
|---|---|---|
| GSH | 100.0 ± 8.1 | 87.7 ± 4.5 |
| 1.61 | 74.3 ± 2.0 | 69.0 ± 0.6 |
| 1.62 | 111.8 ± 5.5 | 70.8 ± 5.7 |
| 1.63 | 137.1 ± 16.1 | 101.1 ± 5.2 |
| 1.64 | 127.7 ± 7.9 | 98.5 ± 7.1 |
| 1.65 | 58.8 ± 0.0 | 69.3 ± 26.6 |
| 1.70 | 107.8 ± 9.4 | 112.4 ± 9.7 |
| 1.71 | 79.5 ± 10.2 | 97.0 ± 5.5 |
| Control (no drug) | 90.6 ± 9.5 | 40.1 ± 4.3 |
| GSH Solution (IV) | GSH Solution (oral) | Analogue 1.70 (IV) | Analogue 1.70 (oral) | |
|---|---|---|---|---|
| AUC (nghmL−1) | 5353 ± 2480 | 36 ± 8 | 727 ± 42 | 82 ± 8 |
| Bioavailability | 100% | 0.7 ± 0.1% | 100% | 11.3± 1.2% ** |
Disclaimer/Publisher’s Note: The statements, opinions and data contained in all publications are solely those of the individual author(s) and contributor(s) and not of MDPI and/or the editor(s). MDPI and/or the editor(s) disclaim responsibility for any injury to people or property resulting from any ideas, methods, instructions or products referred to in the content. |
© 2025 by the authors. Licensee MDPI, Basel, Switzerland. This article is an open access article distributed under the terms and conditions of the Creative Commons Attribution (CC BY) license (https://creativecommons.org/licenses/by/4.0/).
Share and Cite
Yin, N.; Harris, P.W.R.; Liu, M.; Sun, J.; Chen, G.; Wen, J.; Brimble, M.A. Enhancing the Oral Bioavailability of Glutathione Using Innovative Analogue Approaches. Pharmaceutics 2025, 17, 385. https://doi.org/10.3390/pharmaceutics17030385
Yin N, Harris PWR, Liu M, Sun J, Chen G, Wen J, Brimble MA. Enhancing the Oral Bioavailability of Glutathione Using Innovative Analogue Approaches. Pharmaceutics. 2025; 17(3):385. https://doi.org/10.3390/pharmaceutics17030385
Chicago/Turabian StyleYin, Naibo, Paul W. R. Harris, Mengyang Liu, Jianguo Sun, Guanyu Chen, Jingyuan Wen, and Margaret A. Brimble. 2025. "Enhancing the Oral Bioavailability of Glutathione Using Innovative Analogue Approaches" Pharmaceutics 17, no. 3: 385. https://doi.org/10.3390/pharmaceutics17030385
APA StyleYin, N., Harris, P. W. R., Liu, M., Sun, J., Chen, G., Wen, J., & Brimble, M. A. (2025). Enhancing the Oral Bioavailability of Glutathione Using Innovative Analogue Approaches. Pharmaceutics, 17(3), 385. https://doi.org/10.3390/pharmaceutics17030385