
An Intelligent System for Determining Driver Anxiety Level: A Comparison Study of Two Fuzzy-Based Models


Abstract
1. Introduction
2. VANETs
- Vehicles: The vehicles are equipped with Onboard Units (OBUs) that facilitate communication with other vehicles and roadside units.
- Roadside units (RSUs): The RSUs are fixed units along the road, which provide connectivity to vehicles, serving as gateways to the internet and other networks.
- OBUs: The OBUs are communication devices installed in vehicles, which enable the transmission and reception of data.
- Application Units (AUs): The AUs are part of vehicle’s onboard system, which utilize VANET data to operate various applications.
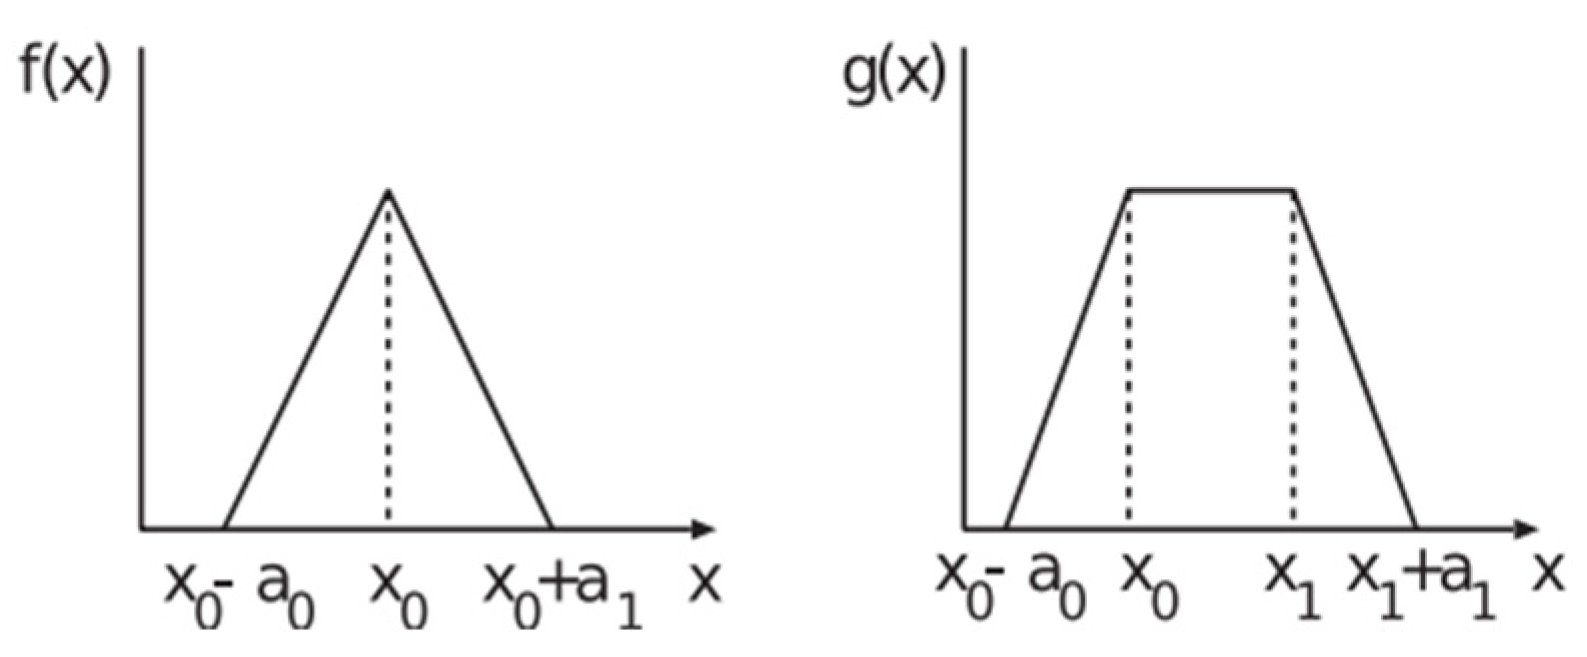
3. FC and FLC
4. Proposed Simulation System
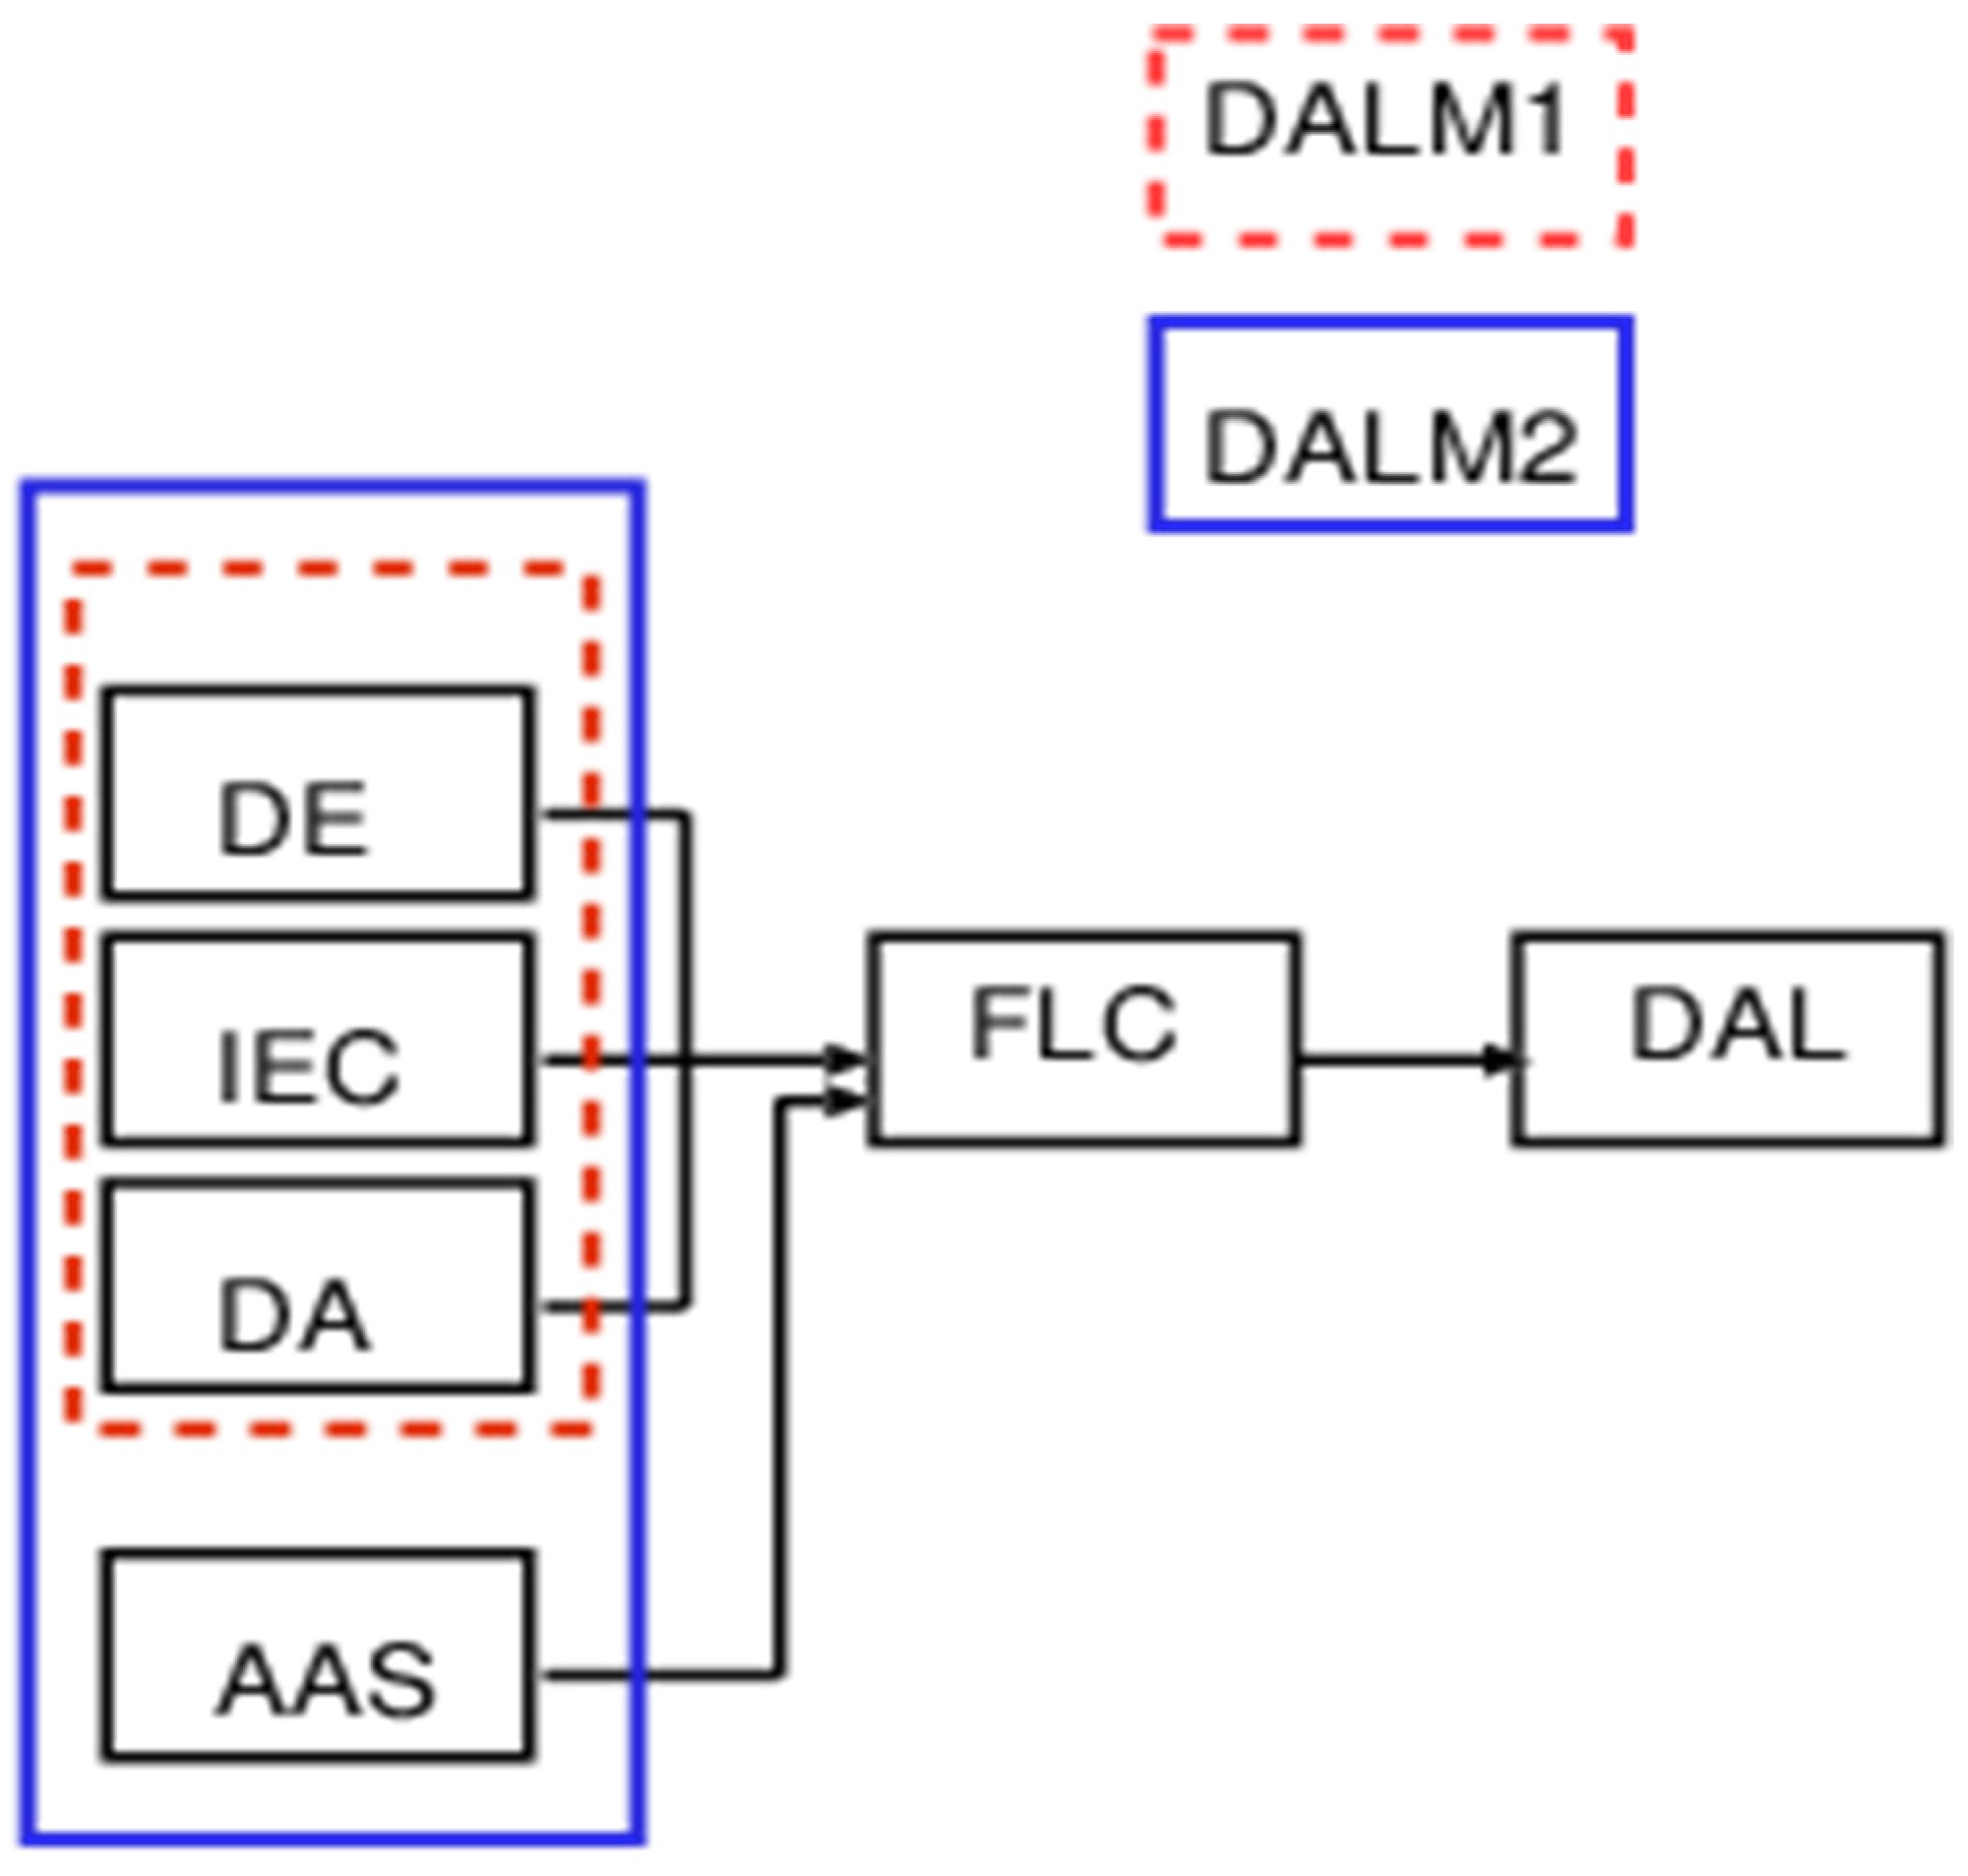
- Driving Experience (DE)
- In-car Environment Conditions (IECs)
- Driver Age (DA)
- Accident Anxiety State (AAS)
5. Simulation Results
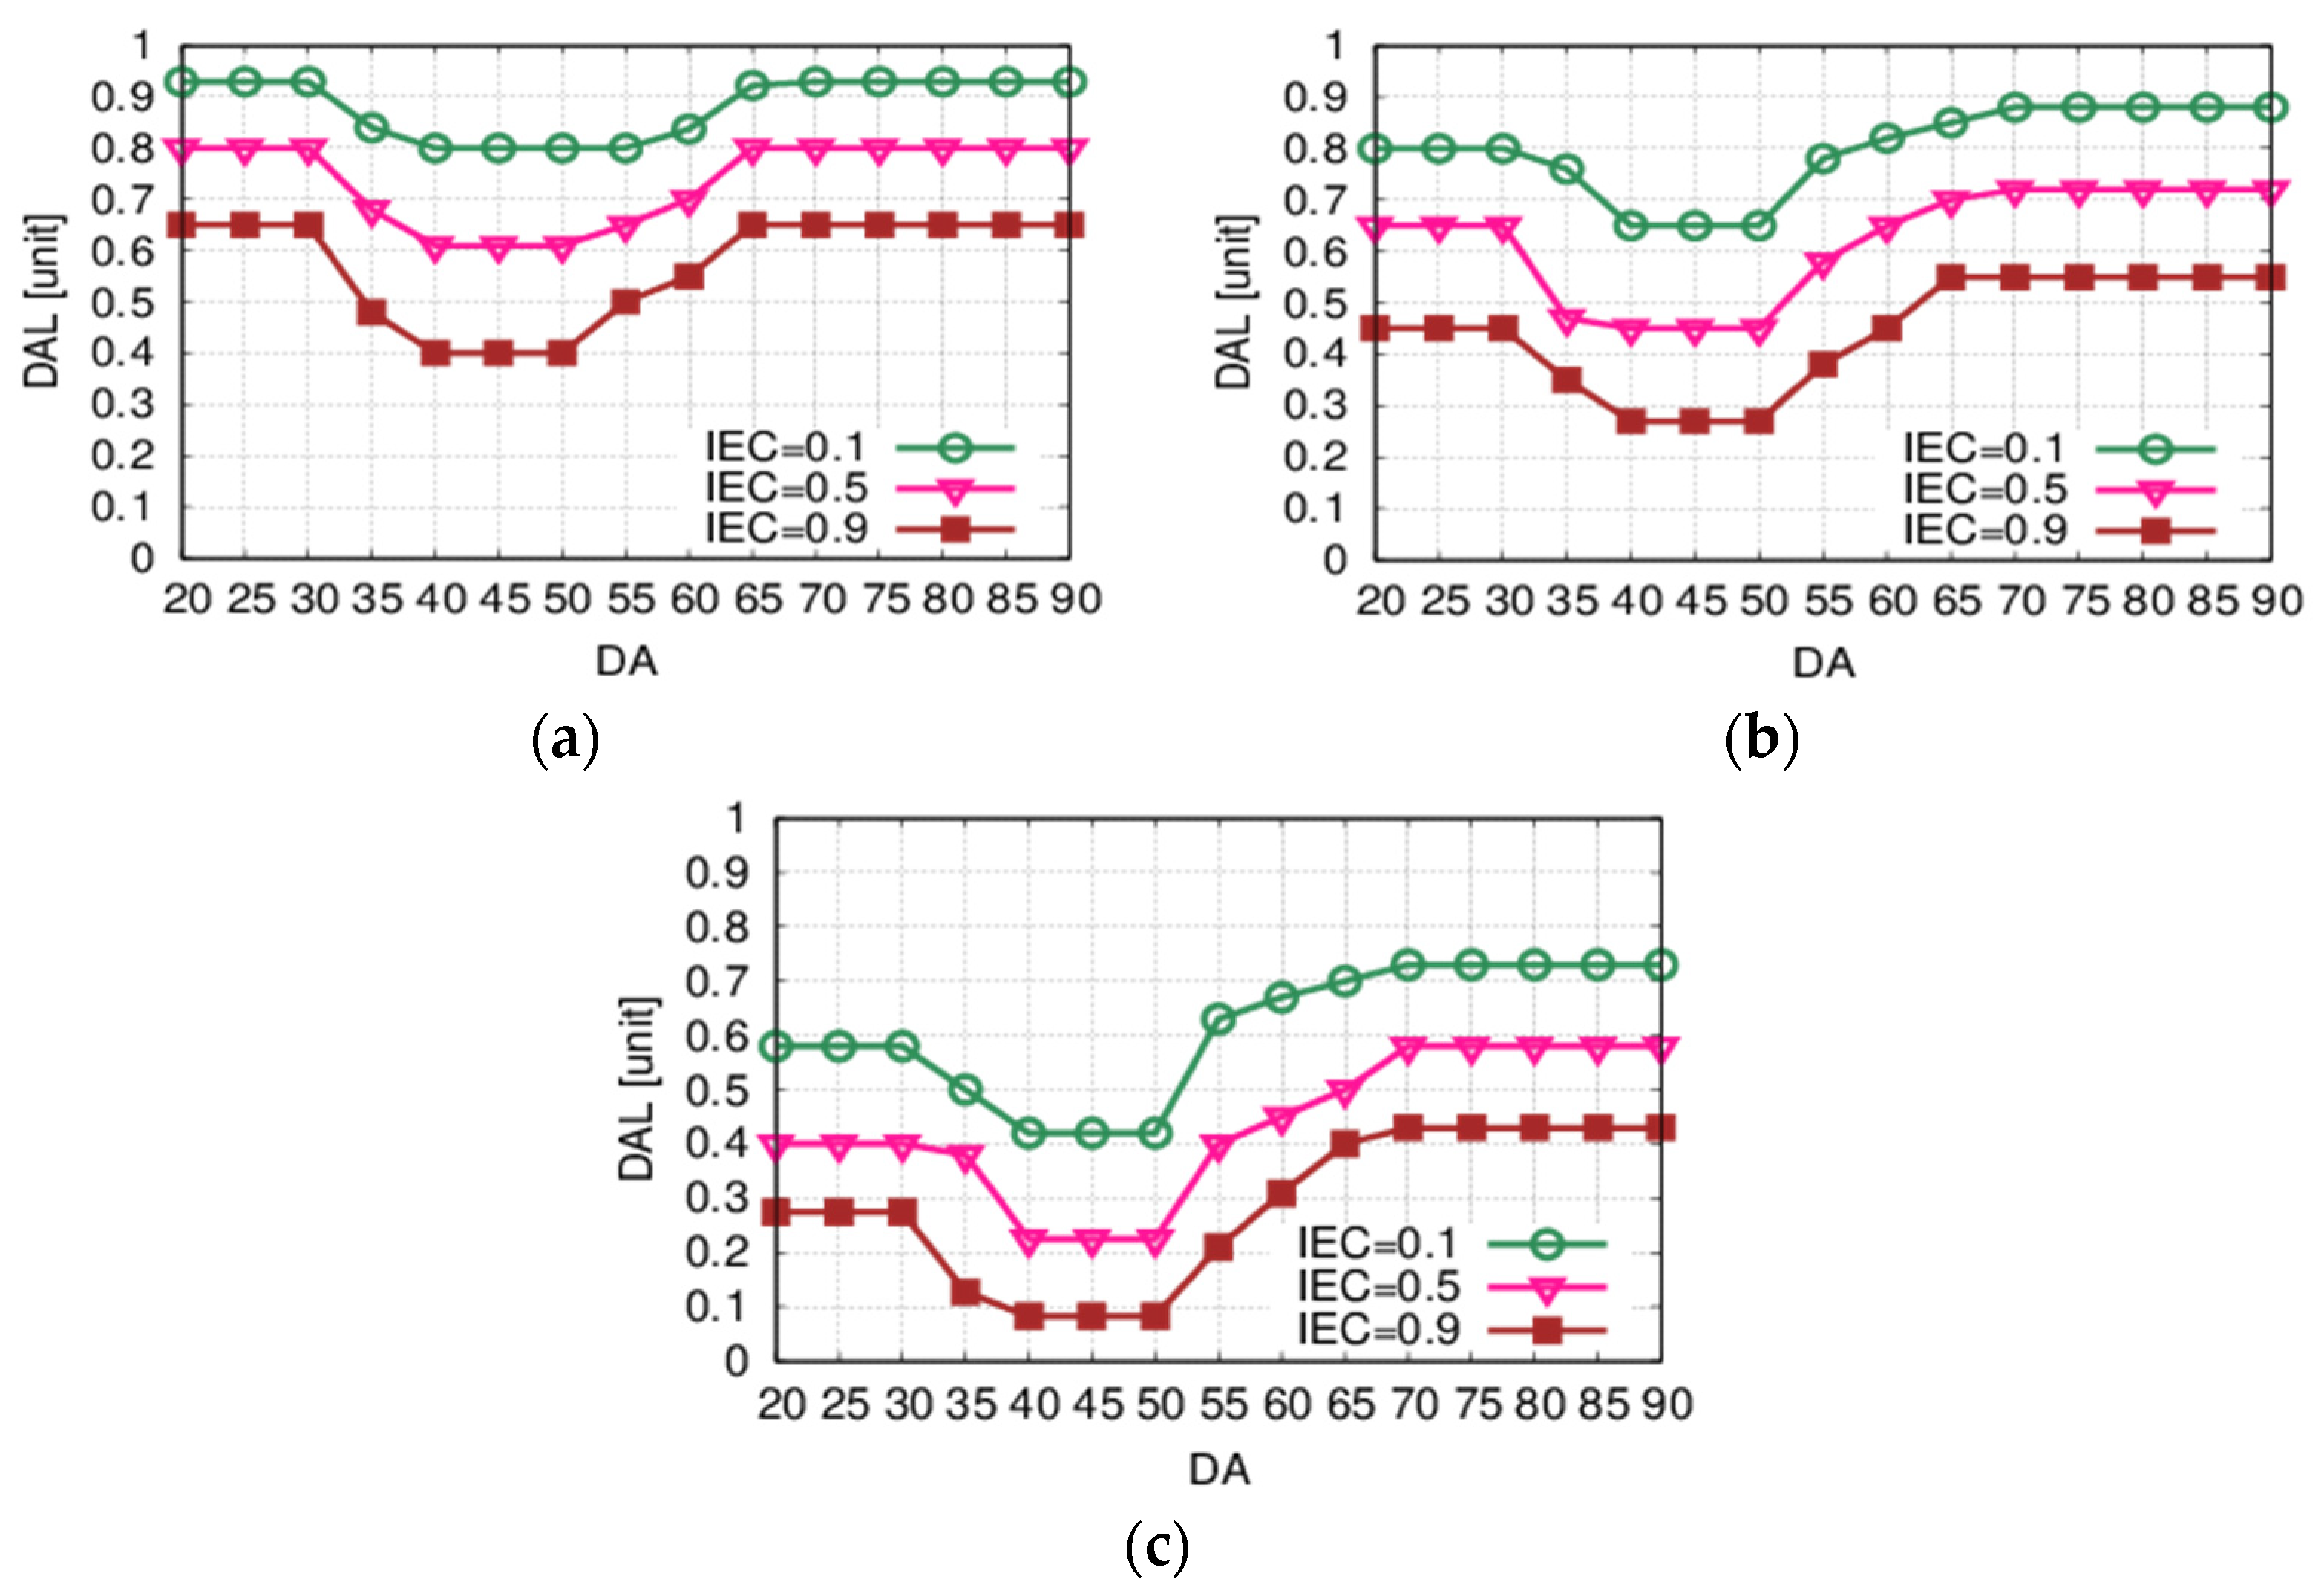
5.1. Simulation Results of DALM1
5.2. Simulation Results of DALM2
6. Discussion
7. Conclusions and Future Work
Author Contributions
Funding
Data Availability Statement
Conflicts of Interest
References
- Driver Emotional Characteristics and Their Impact on Driving Behavior: Aiming to Develop an Educational Program for Emotion Control, International Association of Traffic and Safety Sciences (IATSS), Research Study, in Japanese. 2008. Available online: https://www.iatss.or.jp/research/entry_img/h076.pdf (accessed on 10 June 2024).
- Bylykbashi, K.; Qafzezi, E.; Ampririt, P.; Ikeda, M.; Matsuo, K.; Barolli, L. Performance evaluation of an integrated fuzzy-based driving-support system for real-time risk management in VANETs. Sensors 2020, 20, 6537. [Google Scholar] [CrossRef]
- Stephens, A.; Collette, B.; Hidalgo-Munoz, A.; Fort, A.; Evennou, M.; Jallais, C. The impacts of anxiety over driving on self-reported driving avoidance, work performance and quality of life. J. Transp. Heal. 2020, 19, 100929. [Google Scholar] [CrossRef]
- Stephens, A.; Collette, B.; Hidalgo-Munoz, A.; Fort, A.; Evennou, M.; Jallais, C. Help-seeking for driving anxiety: Who seeks help and how beneficial is this perceived to be? Transp. Res. Part F Traffic Psychol. Behav. 2024, 105, 182–195. [Google Scholar] [CrossRef]
- Pawar, N.M.; Yadav, A.K.; Velaga, N.R. A comparative assessment of subjective experience in simulator and on-road driving under normal and time pressure driving conditions. Int. J. Inj. Control. Saf. Promot. 2022, 30, 116–131. [Google Scholar] [CrossRef]
- Brzezinska, D.; Bryant, P. Performance-based analysis in evaluation of safety in car parks under electric vehicle fire conditions. Energies 2022, 15, 649. [Google Scholar] [CrossRef]
- Ertan, D.; Hubert-Jacquot, C.; Maillard, L.; Sanchez, S.; Jansen, C.; Fracomme, L.; Schwan, R.; Hopes, L.; Javelot, H.; Tyvaert, L.; et al. Anticipatory anxiety of epileptic seizures: An overlooked dimension linked to trauma history. Seizure 2021, 85, 64–69. [Google Scholar] [CrossRef]
- Balzarotti, S.; Sullman, M.; Abati, D.; Biassoni, F. The expression of driving anger in a sample of Italian drivers. Transp. Res. Part F Traffic Psychol. Behav. 2023, 97, 383–395. [Google Scholar] [CrossRef]
- Zimmermann, H.J. Fuzzy Set Theory and Its Applications; Springer Science & Business Media: Berlin/Heidelberg, Germany, 1996. [Google Scholar] [CrossRef]
- Balaji, T.S.; Srinivasan, S.; Bharathi, S.P.; Ramesh, B. Fuzzy-Based Secure Clustering with Routing Technique for VANETs. Comput. Syst. Sci. Eng. 2022, 43, 291–304. [Google Scholar] [CrossRef]
- Tselentis, D.I.; Papadimitriou, E.; van Gelder, P. The usefulness of artificial intelligence for safety assessment of different transport modes. Accid. Anal. Prev. 2023, 186, 107034. [Google Scholar] [CrossRef]
- Chen, J.; Teo, T.H.; Kok, C.L.; Koh, Y.Y. A Novel Single-Word Speech Recognition on Embedded Systems Using a Convolution Neuron Network with Improved Out-of-Distribution Detection. Electronics 2024, 13, 530. [Google Scholar] [CrossRef]
- Qu, F.; Wu, Z.; Wang, F.-Y.; Cho, W. A security and privacy review of VANETs. IEEE Trans. Intell. Transp. Syst. 2015, 16, 2985–2996. [Google Scholar] [CrossRef]
- Zeadally, S.; Hunt, R.; Chen, Y.-S.; Irwin, A.; Hassan, A. Vehicular ad hoc networks (VANETS): Status, results, and challenges. Telecommun. Syst. 2012, 50, 217–241. [Google Scholar] [CrossRef]
- Manvi, S.S.; Tangade, S. A survey on authentication schemes in VANETs for secured communication. Veh. Commun. 2017, 9, 19–30. [Google Scholar] [CrossRef]
- Lee, B.-G.; Chung, W.-Y. Wearable glove-type driver stress detection using a motion sensor. IEEE Trans. Intell. Transp. Syst. 2016, 18, 1835–1844. [Google Scholar] [CrossRef]
- Aljabry, I.A.; Al-Suhail, G.A. A survey on network simulators for vehicular ad-hoc networks (VANETS). Int. J. Comput. Appl. 2021, 174, 1–9. [Google Scholar] [CrossRef]
- Babu, S.; Raj Kumar, P.A. A comprehensive survey on simulators, emulators, and testbeds for VANETs. Int. J. Commun. Syst. 2022, 35, e5123. [Google Scholar] [CrossRef]
- Malik, S.; Sahu, P.K. A comparative study on routing protocols for VANETs. Heliyon 2019, 5, e02340. [Google Scholar] [CrossRef]
- Swamynathan, C.; Ravi, V.; Ranganayakulu, D.; Kandasamy, R. Driver behaviour prediction and enhanced ad hoc on-demand distance vector routing protocol in VANET. Int. J. Commun. Syst. 2023, 37, e5650. [Google Scholar] [CrossRef]
- Mendel, J.M.; John, R.I.; Liu, F. Interval type-2 fuzzy logic systems made simple. IEEE Trans. Fuzzy Syst. 2006, 14, 808–821. [Google Scholar] [CrossRef]
- Ampririt, P.; Higashi, S.; Qafzezi, E.; Ikeda, M.; Matsuo, K.; Barolli, L. An intelligent fuzzy-based system for handover decision in 5G-IoT networks considering network slicing and SDN technologies. Internet Things 2023, 23, 100870. [Google Scholar] [CrossRef]
- Mittal, K.; Jain, A.; Vaisla, K.S.; Castillo, O.; Kacprzyk, J. A comprehensive review on type 2 fuzzy logic applications: Past, present and future. Eng. Appl. Artif. Intell. 2020, 95, 103916. [Google Scholar] [CrossRef]
- Ramesh, G.; Aravindarajan, V.; Logeshwaran, J.; Kiruthiga, T. Estimation analysis of paralysis effects for human nervous system by using Neuro fuzzy logic controller. NeuroQuantology 2022, 20, 3195–3206. [Google Scholar]
- Begum, S. Intelligent driver monitoring systems based on physiological sensor signals: A review. In Proceedings of the 2013 16th International IEEE Conference on Intelligent Transportation Systems—(ITSC 2013), Hague, The Netherlands, 6–9 October 2013; pp. 282–289. [Google Scholar] [CrossRef]
- Buera, L.; Lleida, E.; Miguel, A.; Ortega, A. Multi-environment models based linear normalization for speech recognition in car conditions. In Proceedings of the 2004 IEEE International Conference on Acoustics, Speech, and Signal Processing, Montreal, QC, Canada, 17–21 May 2004. [Google Scholar] [CrossRef]
- Shea, A.; Evans, L. Traffic Safety and the Driver. J. Oper. Res. Soc. 1992, 43, 728. [Google Scholar] [CrossRef]
- Măirean, C. Fear and avoidance of driving among drivers involved in a road traffic crash. The role of traumatic fear and driving cognitions. Transp. Res. Part F Traffic Psychol. Behav. 2020, 74, 322–329. [Google Scholar] [CrossRef]
- Bylykbashi, K.; Elmazi, D.; Matsuo, K.; Ikeda, M.; Barolli, L. Effect of security and trustworthiness for a fuzzy cluster management system in VANETs. Cogn. Syst. Res. 2019, 55, 153–163. [Google Scholar] [CrossRef]


| Parameters | Term Sets |
|---|---|
| Driving Experience (DE) | Not Good (NG), Good (G), Very Good (VG) |
| In-car Environment Conditions (IECs) | Bad (Ba), Normal (Nor), Good (Gd) |
| Driver Age (DA) | Young (Yo), Middle (Mi), Old (Ol) |
| Accident Anxiety State (AAS) | Low (Lo), Middle (Mid), High (Hi) |
| DALM1: Driver Anxiety Level (DAL) | Driver Anxiety Level1 (DAL1), DAL2, DAL3, DAL4, DAL5, DAL6 |
| DALM2: DAL | DAL1, DAL2, DAL3, DAL4, DAL5, DAL6, DAL7 |
| Rule | DE | IEC | DA | DAL | Rule | DE | IEC | DA | DAL | Rule | DE | IEC | DA | DAL |
|---|---|---|---|---|---|---|---|---|---|---|---|---|---|---|
| 1 | NG | Ba | Yo | DAL6 | 10 | G | Ba | Yo | DAL5 | 19 | VG | Ba | Yo | DAL4 |
| 2 | NG | Ba | Mi | DAL4 | 11 | G | Ba | Mi | DAL3 | 20 | VG | Ba | Mi | DAL2 |
| 3 | NG | Ba | Ol | DAL6 | 12 | G | Ba | Ol | DAL6 | 21 | VG | Ba | Ol | DAL5 |
| 4 | NG | Nor | Yo | DAL5 | 13 | G | Nor | Yo | DAL4 | 22 | VG | Nor | Yo | DAL3 |
| 5 | NG | Nor | Mi | DAL3 | 14 | G | Nor | Mi | DAL2 | 23 | VG | Nor | Mi | DAL1 |
| 6 | NG | Nor | Ol | DAL6 | 15 | G | Nor | Ol | DAL5 | 24 | VG | Nor | Ol | DAL4 |
| 7 | NG | Gd | Yo | DAL3 | 16 | G | Gd | Yo | DAL2 | 25 | VG | Gd | Yo | DAL2 |
| 8 | NG | Gd | Mi | DAL2 | 17 | G | Gd | Mi | DAL1 | 26 | VG | Gd | Mi | DAL1 |
| 9 | NG | Gd | Ol | DAL5 | 18 | G | Gd | Ol | DAL4 | 27 | VG | Gd | Ol | DAL3 |
| Rule | AAS | DE | IEC | DA | DAL | Rule | AAS | DE | IEC | DA | DAL | Rule | AAS | DE | IEC | DA | DAL |
|---|---|---|---|---|---|---|---|---|---|---|---|---|---|---|---|---|---|
| 1 | Lo | NG | Ba | Yo | DAL6 | 28 | Mid | NG | Ba | Yo | DAL7 | 55 | Hi | NG | Ba | Yo | DAL7 |
| 2 | Lo | NG | Ba | Mi | DAL4 | 29 | Mid | NG | Ba | Mi | DAL6 | 56 | Hi | NG | Ba | Mi | DAL7 |
| 3 | Lo | NG | Ba | Ol | DAL7 | 30 | Mid | NG | Ba | Ol | DAL7 | 57 | Hi | NG | Ba | Ol | DAL7 |
| 4 | Lo | NG | Nor | Yo | DAL5 | 31 | Mid | NG | Nor | Yo | DAL6 | 58 | Hi | NG | Nor | Yo | DAL7 |
| 5 | Lo | NG | Nor | Mi | DAL3 | 32 | Mid | NG | Nor | Mi | DAL5 | 59 | Hi | NG | Nor | Mi | DAL6 |
| 6 | Lo | NG | Nor | Ol | DAL6 | 33 | Mid | NG | Nor | Ol | DAL7 | 60 | Hi | NG | Nor | Ol | DAL7 |
| 7 | Lo | NG | Gd | Yo | DAL4 | 34 | Mid | NG | Gd | Yo | DAL6 | 61 | Hi | NG | Gd | Yo | DAL7 |
| 8 | Lo | NG | Gd | Mi | DAL2 | 35 | Mid | NG | Gd | Mi | DAL4 | 62 | Hi | NG | Gd | Mi | DAL5 |
| 9 | Lo | NG | Gd | Ol | DAL5 | 36 | Mid | NG | Gd | Ol | DAL6 | 63 | Hi | NG | Gd | Ol | DAL7 |
| 10 | Lo | G | Ba | Yo | DAL4 | 37 | Mid | G | Ba | Yo | DAL5 | 64 | Hi | G | Ba | Yo | DAL6 |
| 11 | Lo | G | Ba | Mi | DAL2 | 38 | Mid | G | Ba | Mi | DAL3 | 65 | Hi | G | Ba | Mi | DAL5 |
| 12 | Lo | G | Ba | Ol | DAL5 | 39 | Mid | G | Ba | Ol | DAL6 | 66 | Hi | G | Ba | Ol | DAL7 |
| 13 | Lo | G | Nor | Yo | DAL3 | 40 | Mid | G | Nor | Yo | DAL4 | 67 | Hi | G | Nor | Yo | DAL6 |
| 14 | Lo | G | Nor | Mi | DAL1 | 41 | Mid | G | Nor | Mi | DAL2 | 68 | Hi | G | Nor | Mi | DAL4 |
| 15 | Lo | G | Nor | Ol | DAL4 | 42 | Mid | G | Nor | Ol | DAL5 | 69 | Hi | G | Nor | Ol | DAL6 |
| 16 | Lo | G | Gd | Yo | DAL2 | 43 | Mid | G | Gd | Yo | DAL3 | 70 | Hi | G | Gd | Yo | DAL5 |
| 17 | Lo | G | Gd | Mi | DAL1 | 44 | Mid | G | Gd | Mi | DAL2 | 71 | Hi | G | Gd | Mi | DAL3 |
| 18 | Lo | G | Gd | Ol | DAL3 | 45 | Mid | G | Gd | Ol | DAL4 | 72 | Hi | G | Gd | Ol | DAL6 |
| 19 | Lo | VG | Ba | Yo | DAL2 | 46 | Mid | VG | Ba | Yo | DAL3 | 73 | Hi | VG | Ba | Yo | DAL5 |
| 20 | Lo | VG | Ba | Mi | DAL1 | 47 | Mid | VG | Ba | Mi | DAL2 | 74 | Hi | VG | Ba | Mi | DAL3 |
| 21 | Lo | VG | Ba | Ol | DAL3 | 48 | Mid | VG | Ba | Ol | DAL4 | 75 | Hi | VG | Ba | Ol | DAL6 |
| 22 | Lo | VG | Nor | Yo | DAL1 | 49 | Mid | VG | Nor | Yo | DAL2 | 76 | Hi | VG | Nor | Yo | DAL4 |
| 23 | Lo | VG | Nor | Mi | DAL1 | 50 | Mid | VG | Nor | Mi | DAL1 | 77 | Hi | VG | Nor | Mi | DAL2 |
| 24 | Lo | VG | Nor | Ol | DAL2 | 51 | Mid | VG | Nor | Ol | DAL3 | 78 | Hi | VG | Nor | Ol | DAL5 |
| 25 | Lo | VG | Gd | Yo | DAL1 | 52 | Mid | VG | Gd | Yo | DAL2 | 79 | Hi | VG | Gd | Yo | DAL3 |
| 26 | Lo | VG | Gd | Mi | DAL1 | 53 | Mid | VG | Gd | Mi | DAL1 | 80 | Hi | VG | Gd | Mi | DAL1 |
| 27 | Lo | VG | Gd | Ol | DAL1 | 54 | Mid | VG | Gd | Ol | DAL2 | 81 | Hi | VG | Gd | Ol | DAL4 |
Disclaimer/Publisher’s Note: The statements, opinions and data contained in all publications are solely those of the individual author(s) and contributor(s) and not of MDPI and/or the editor(s). MDPI and/or the editor(s) disclaim responsibility for any injury to people or property resulting from any ideas, methods, instructions or products referred to in the content. |
© 2024 by the authors. Licensee MDPI, Basel, Switzerland. This article is an open access article distributed under the terms and conditions of the Creative Commons Attribution (CC BY) license (https://creativecommons.org/licenses/by/4.0/).
Share and Cite
Liu, Y.; Barolli, L. An Intelligent System for Determining Driver Anxiety Level: A Comparison Study of Two Fuzzy-Based Models. Future Internet 2024, 16, 348. https://doi.org/10.3390/fi16100348
Liu Y, Barolli L. An Intelligent System for Determining Driver Anxiety Level: A Comparison Study of Two Fuzzy-Based Models. Future Internet. 2024; 16(10):348. https://doi.org/10.3390/fi16100348
Chicago/Turabian StyleLiu, Yi, and Leonard Barolli. 2024. "An Intelligent System for Determining Driver Anxiety Level: A Comparison Study of Two Fuzzy-Based Models" Future Internet 16, no. 10: 348. https://doi.org/10.3390/fi16100348
APA StyleLiu, Y., & Barolli, L. (2024). An Intelligent System for Determining Driver Anxiety Level: A Comparison Study of Two Fuzzy-Based Models. Future Internet, 16(10), 348. https://doi.org/10.3390/fi16100348