
Streaming and Elastic Traffic Service in 5G-Sliced Wireless Networks and Mutual Utilization of Guaranteed Resource Units


Abstract
:1. Introduction
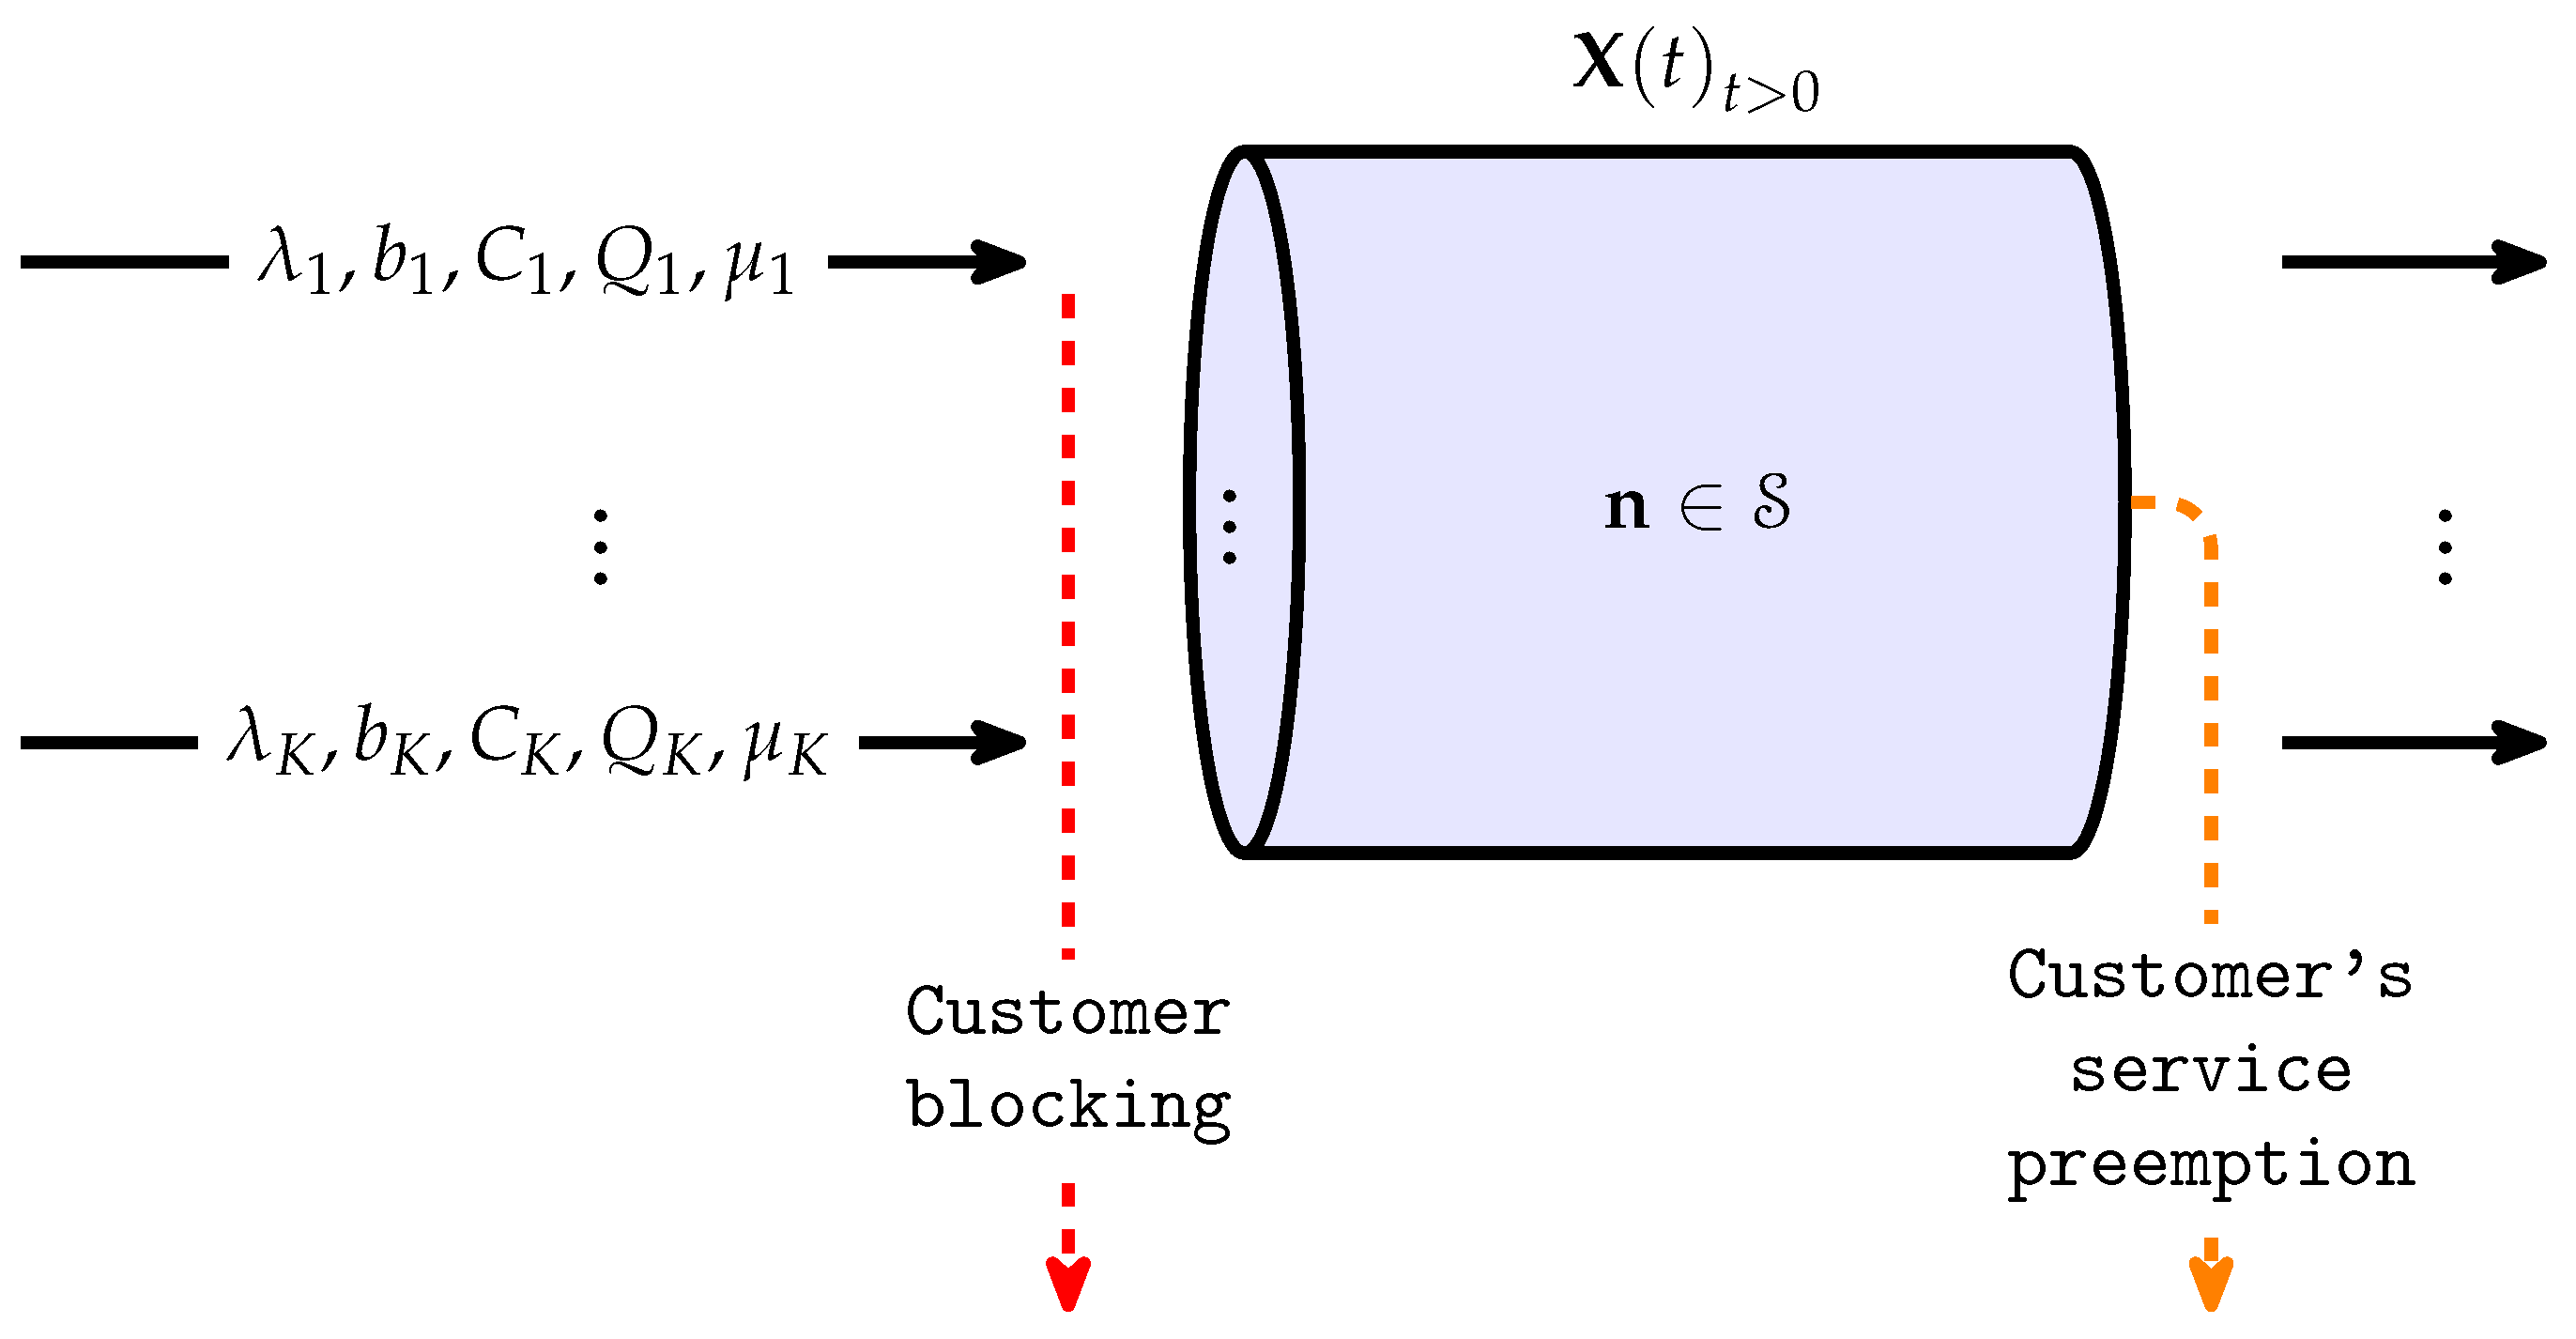
2. System Model
- —the total system capacity;
- —the finite set of slices in the system;
- —the subset of non-TCP streaming slices;
- —the subset of TCP elastic slices;
- —the overall capacity of slice k;
- —the guaranteed capacity of slice k.
- —the maximum number of customers in slice k, given that equality holds;
- —the maximum number of customers in slice k;
- —the guaranteed number of customers in slice k;
- —the number of customers in slice k;
- —the gNB state, with the state space
- —the capacity share of slice k;
- —the data rate allocated to each customer in slice k (with this, we assume the uniform allocation of the capacity share of slice k).
- The total system capacity is occupied, which ensures that an r.u. is not idle if it can be used to provide services with the highest quality;
- The optimization of r.u. utilization can be performed while ensuring slice isolation for guaranteed QoS.
- —the capacity share of slice k in arbitrary system state ;
- —the allocated capacity of the system;
- —the unallocated capacity of the system.
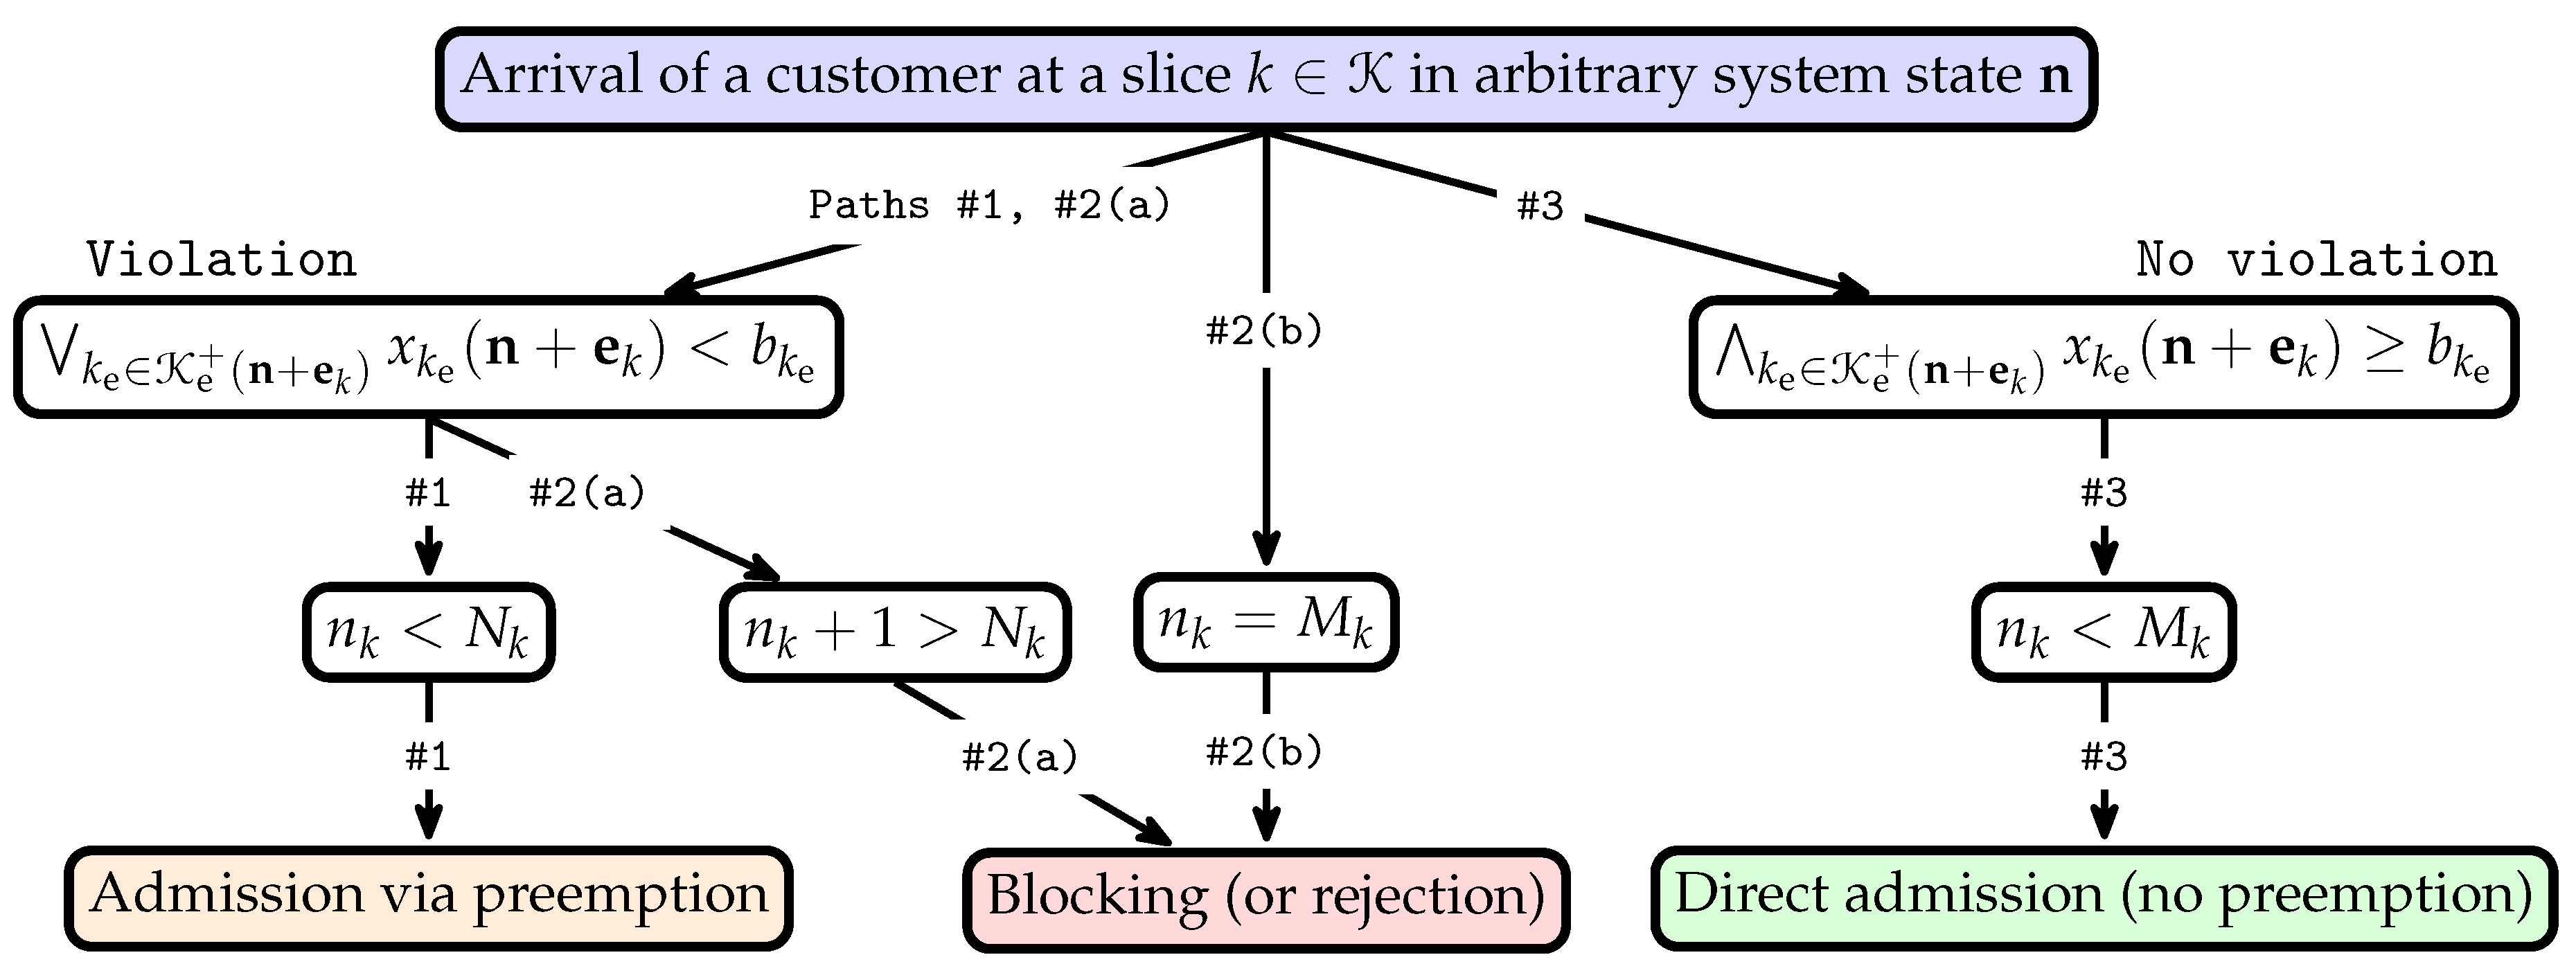
- Admission via preemption—when the data rate allocated to each customer in any of the TCP elastic slices will be less than the minimum, and the number of customers in the slice k is less than guaranteed.
- Blocking (or rejection) in two cases:
- (a)
- When the data rate allocated to each customer in any of the TCP elastic slices will be less than the minimum, and the number of customers in the slice k will be more than that guaranteed.
- (b)
- When the number of customers in the slice k is equal to the maximum.
- Direct admission (no preemption)—when the data rate allocated to each customer in each TCP elastic slice will be equal or more than the minimum, and the number of customers in the slice k is less than the maximum.
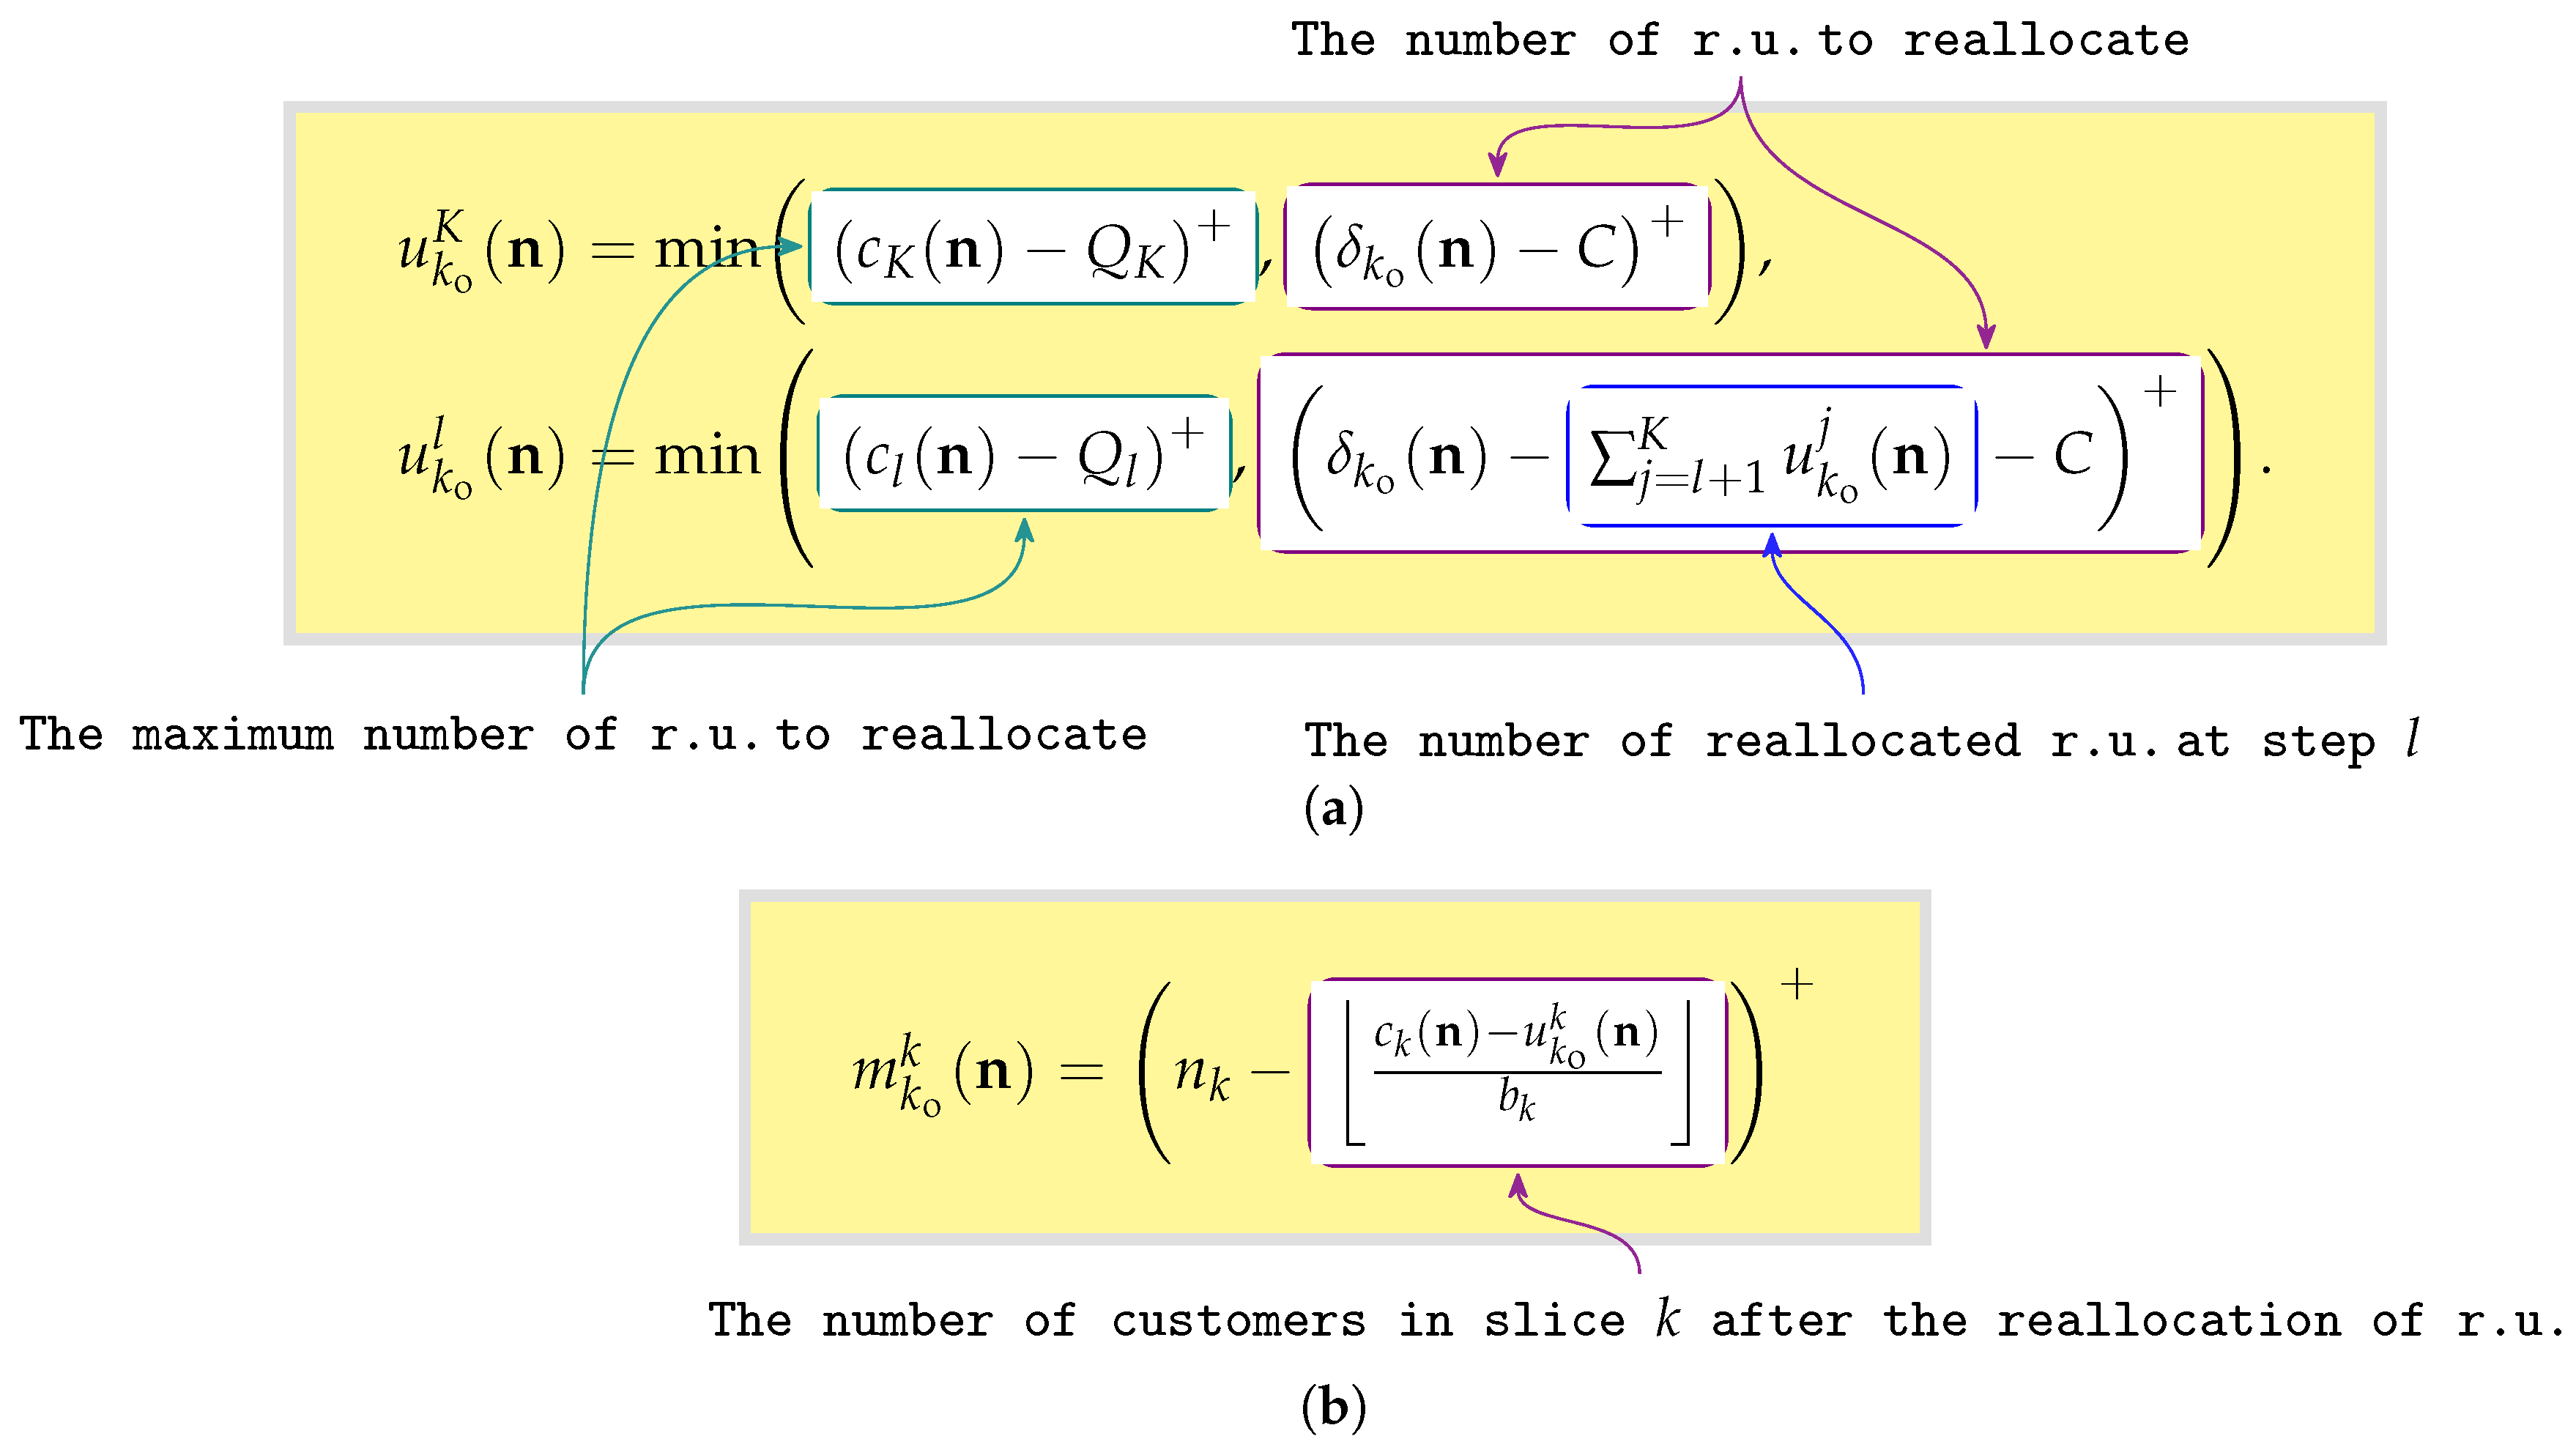
- —the capacity share of slice violator to reallocate for a customer admission to slice owner ;
- —the corresponding number of customers to preempt.
- —the capacity share of slice violator to reallocate cannot exceed , which means that the corresponding number of customers to preempt cannot exceed ;
- —the total capacity to reallocate cannot exceed the data rate .
3. Mathematical Model
- —the state subspace for a direct admission (no preemption) of a customer;
- —the state subspace for an admission via preemption;
- —the state subspace for blocking (or rejection):
- —the mean number of customers in slice k;
- —the mean number of customers in the system;
- —the admission probability at slice k (the probability of an event );
- —the admission probability at the system;
- —the guaranteed capacity utilization in slice k;
- —the minimum data rate utilization in TCP elastic slice ;
- —the total system capacity utilization:
4. Numerical Analysis
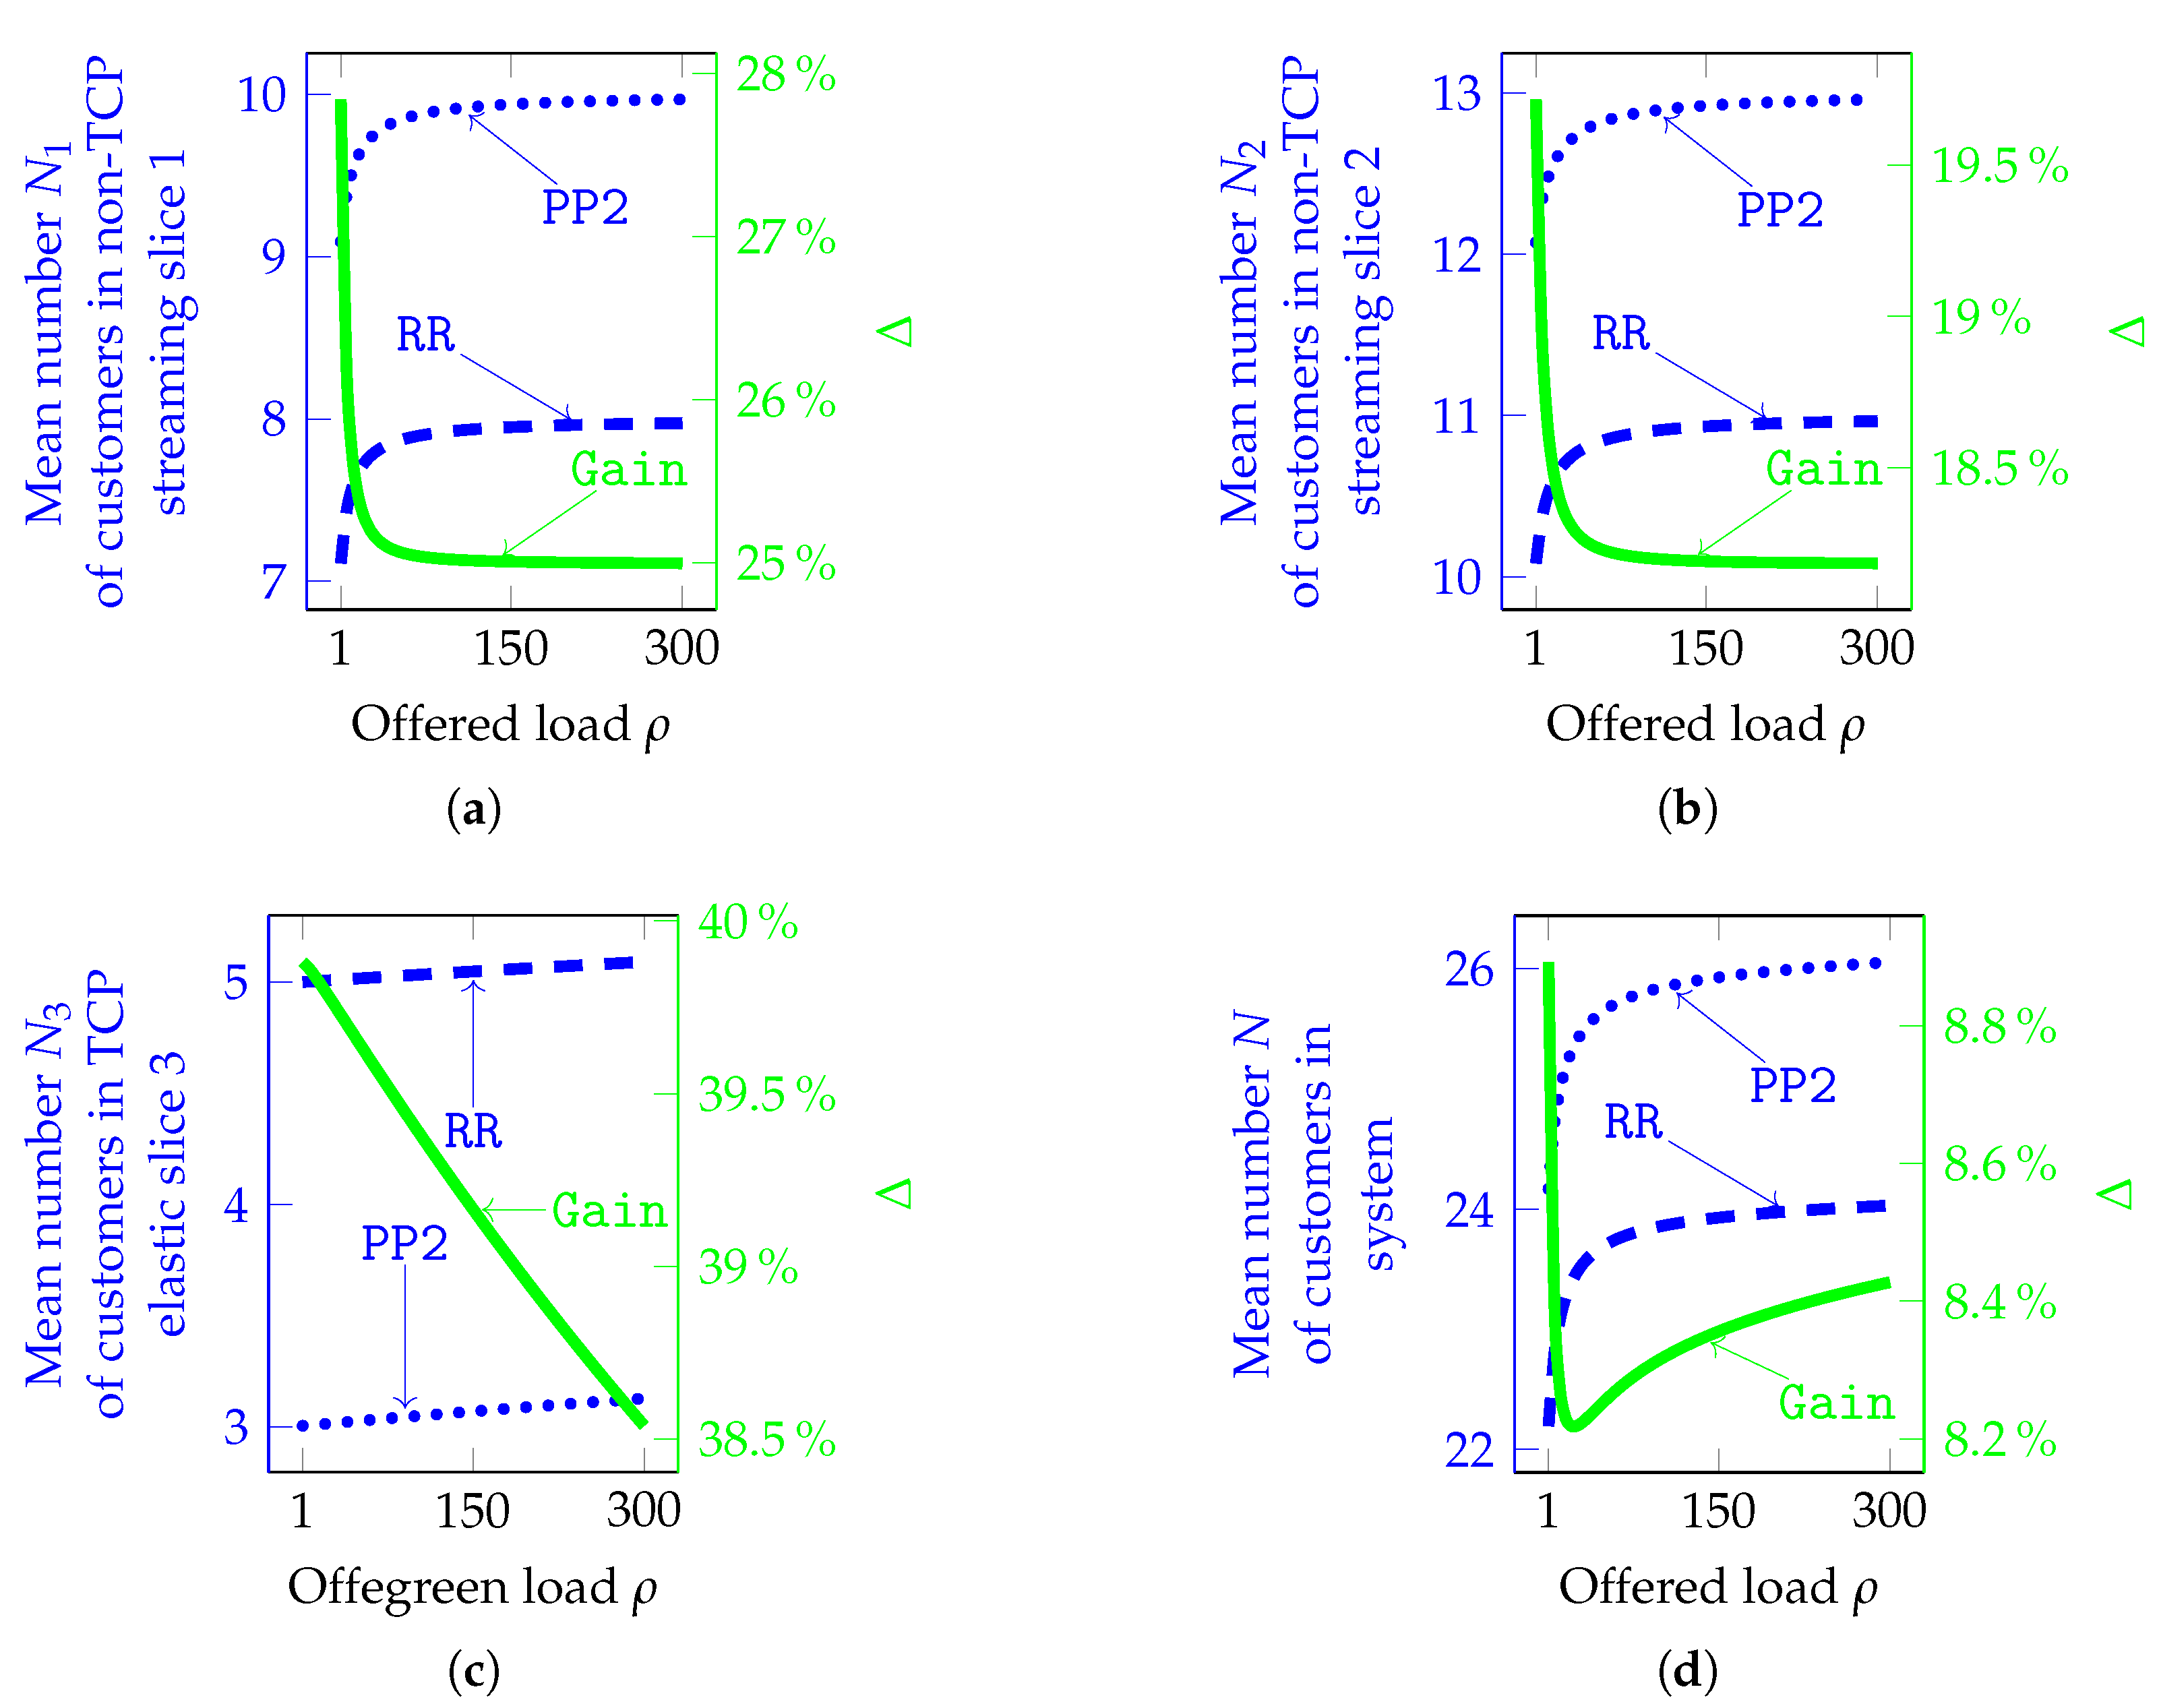
- ✓ The mean number of customers in non-TCP streaming slice 1 can increase up to 28% (Figure 6a);
- ✓ The mean number of customers in non-TCP streaming slice 2 can increase up to 19.75% (Figure 6b);
- ✓ The mean number of customers in TCP elastic slice 3 can decrease down to 40% (Figure 6c);
- ✓ The mean number of customers in system can increase up to 9% (Figure 6d);
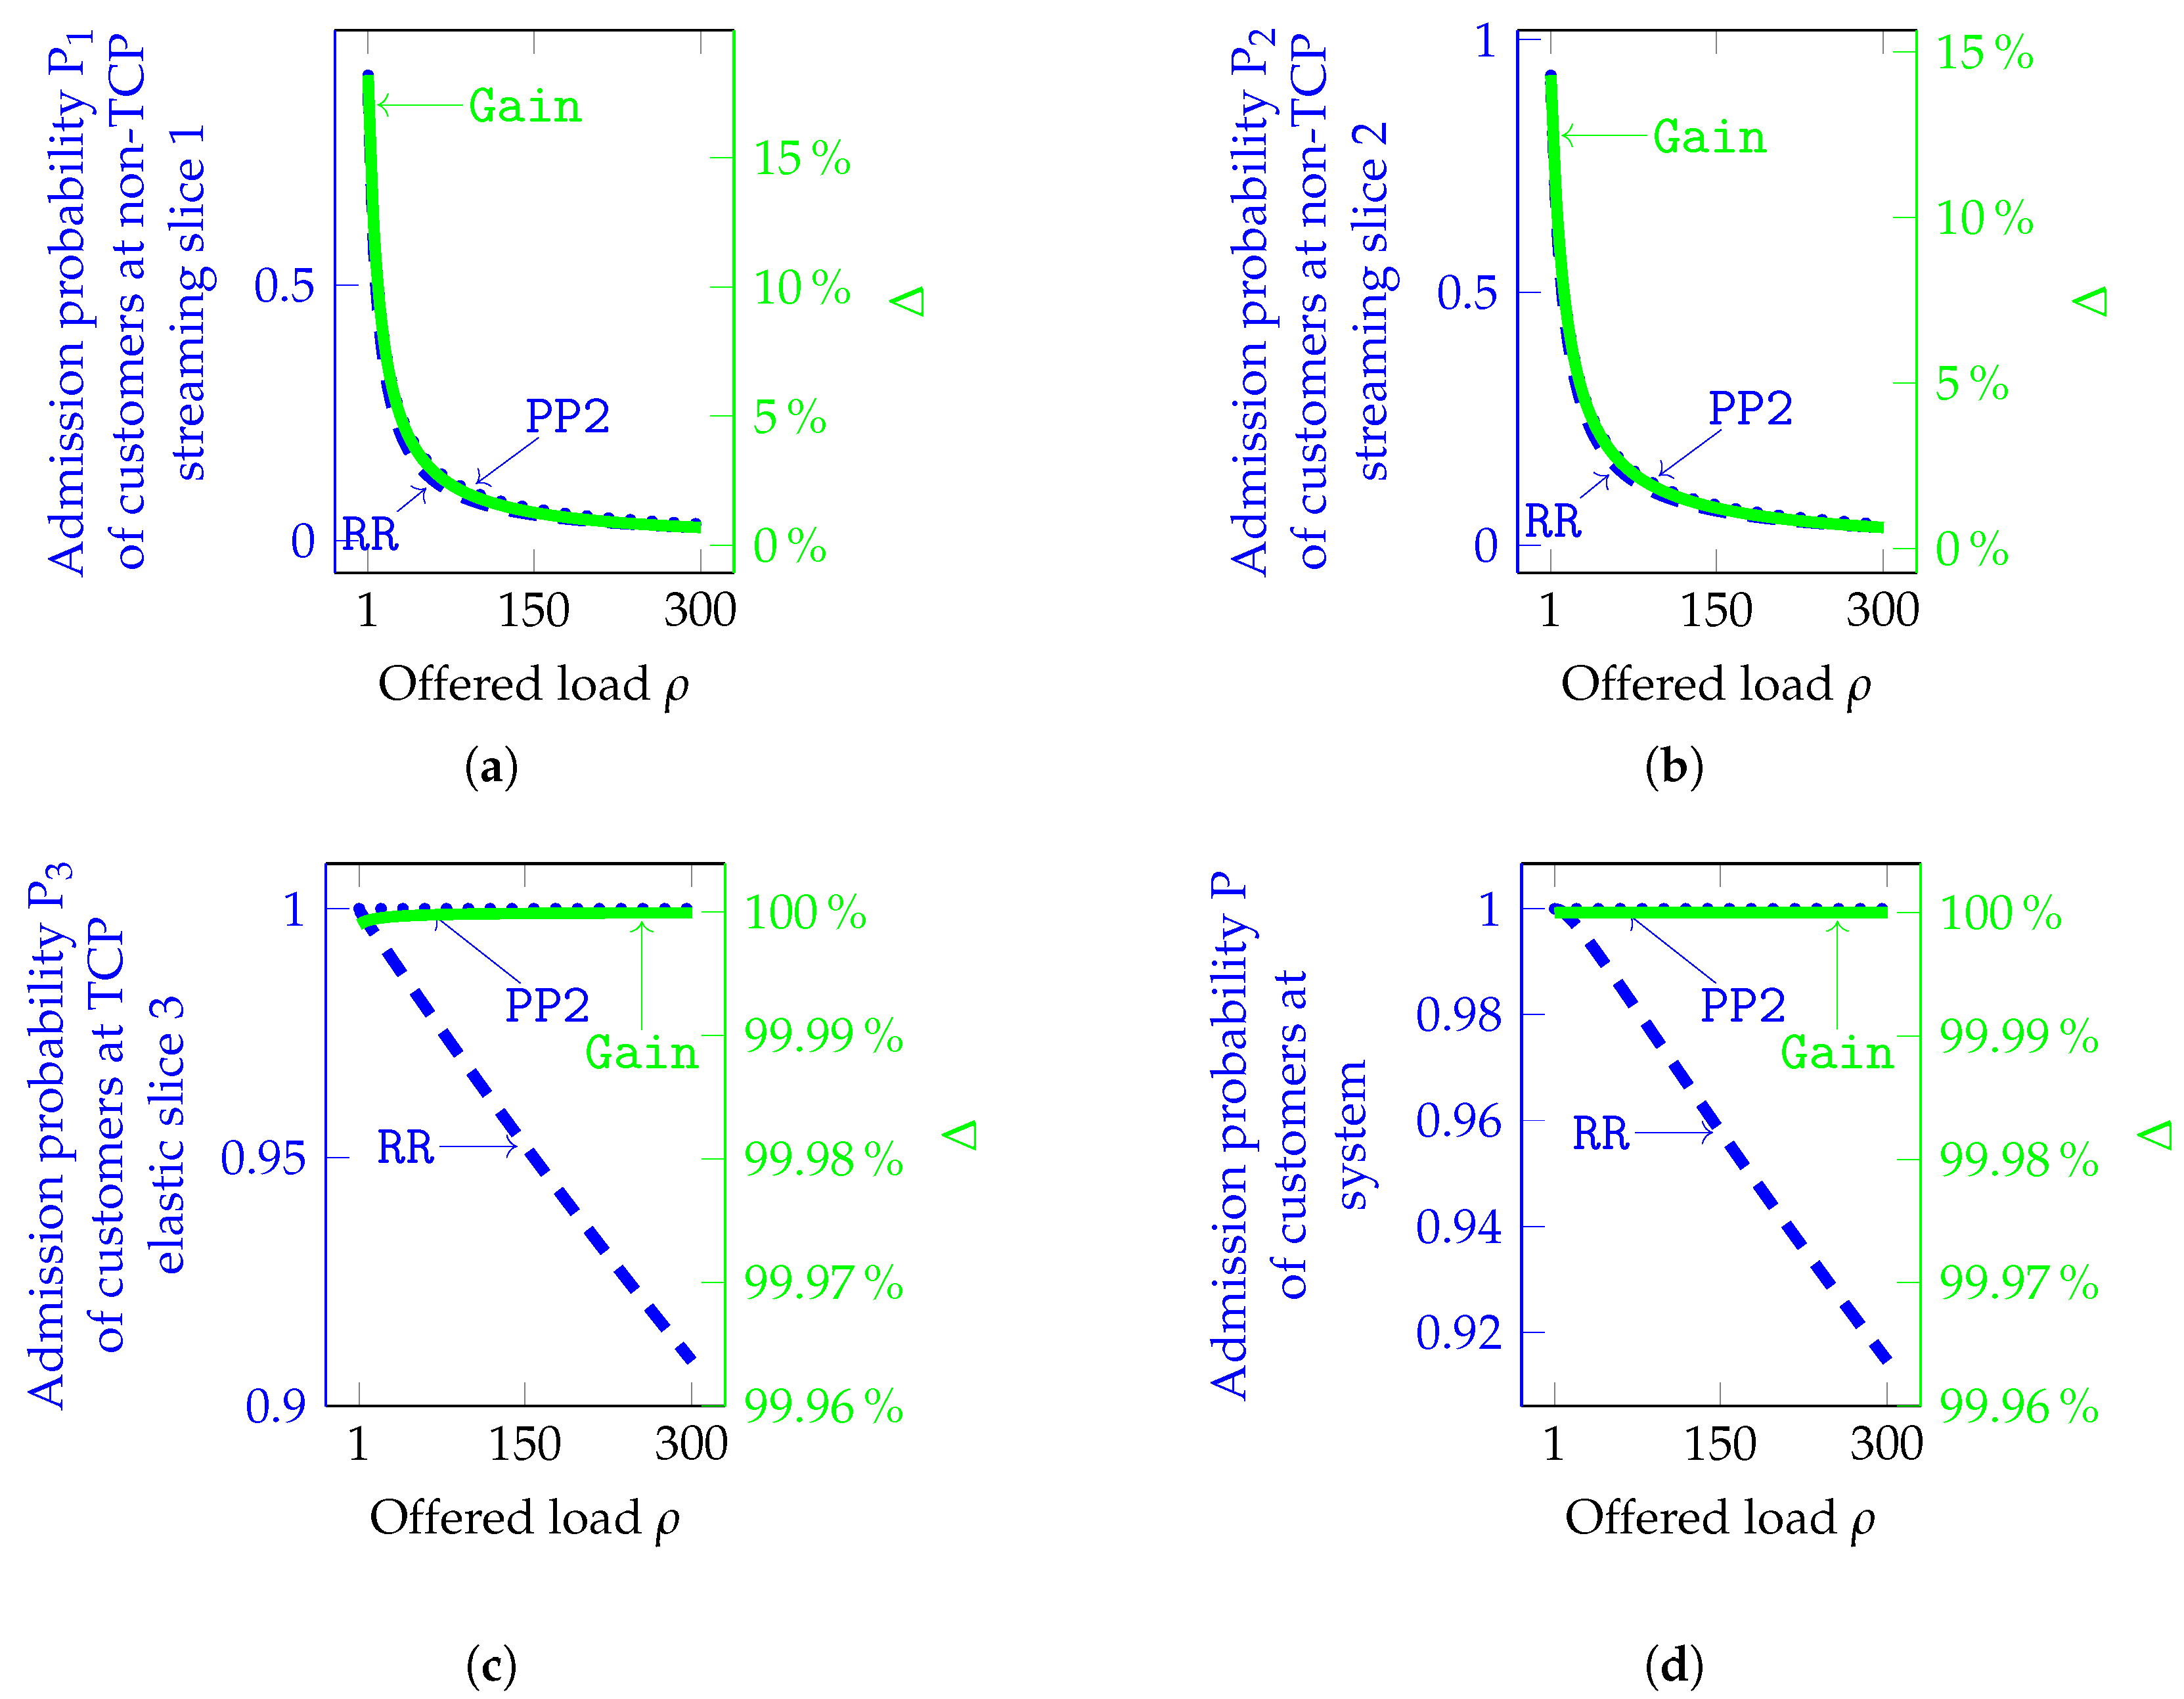
- ✓ The admission probability of customers at non-TCP streaming slice 1 can increase up to 17.5% (Figure 7a);
- ✓ The admission probability of customers at non-TCP streaming slice 2 can increase up to 15% (Figure 7b);
- ✓ The admission probability of customers at TCP elastic slice 3 can increase up to 99.999% (Figure 7c);
- ✓ The admission probability of customers at the system can increase up to 99.999% (Figure 7d);
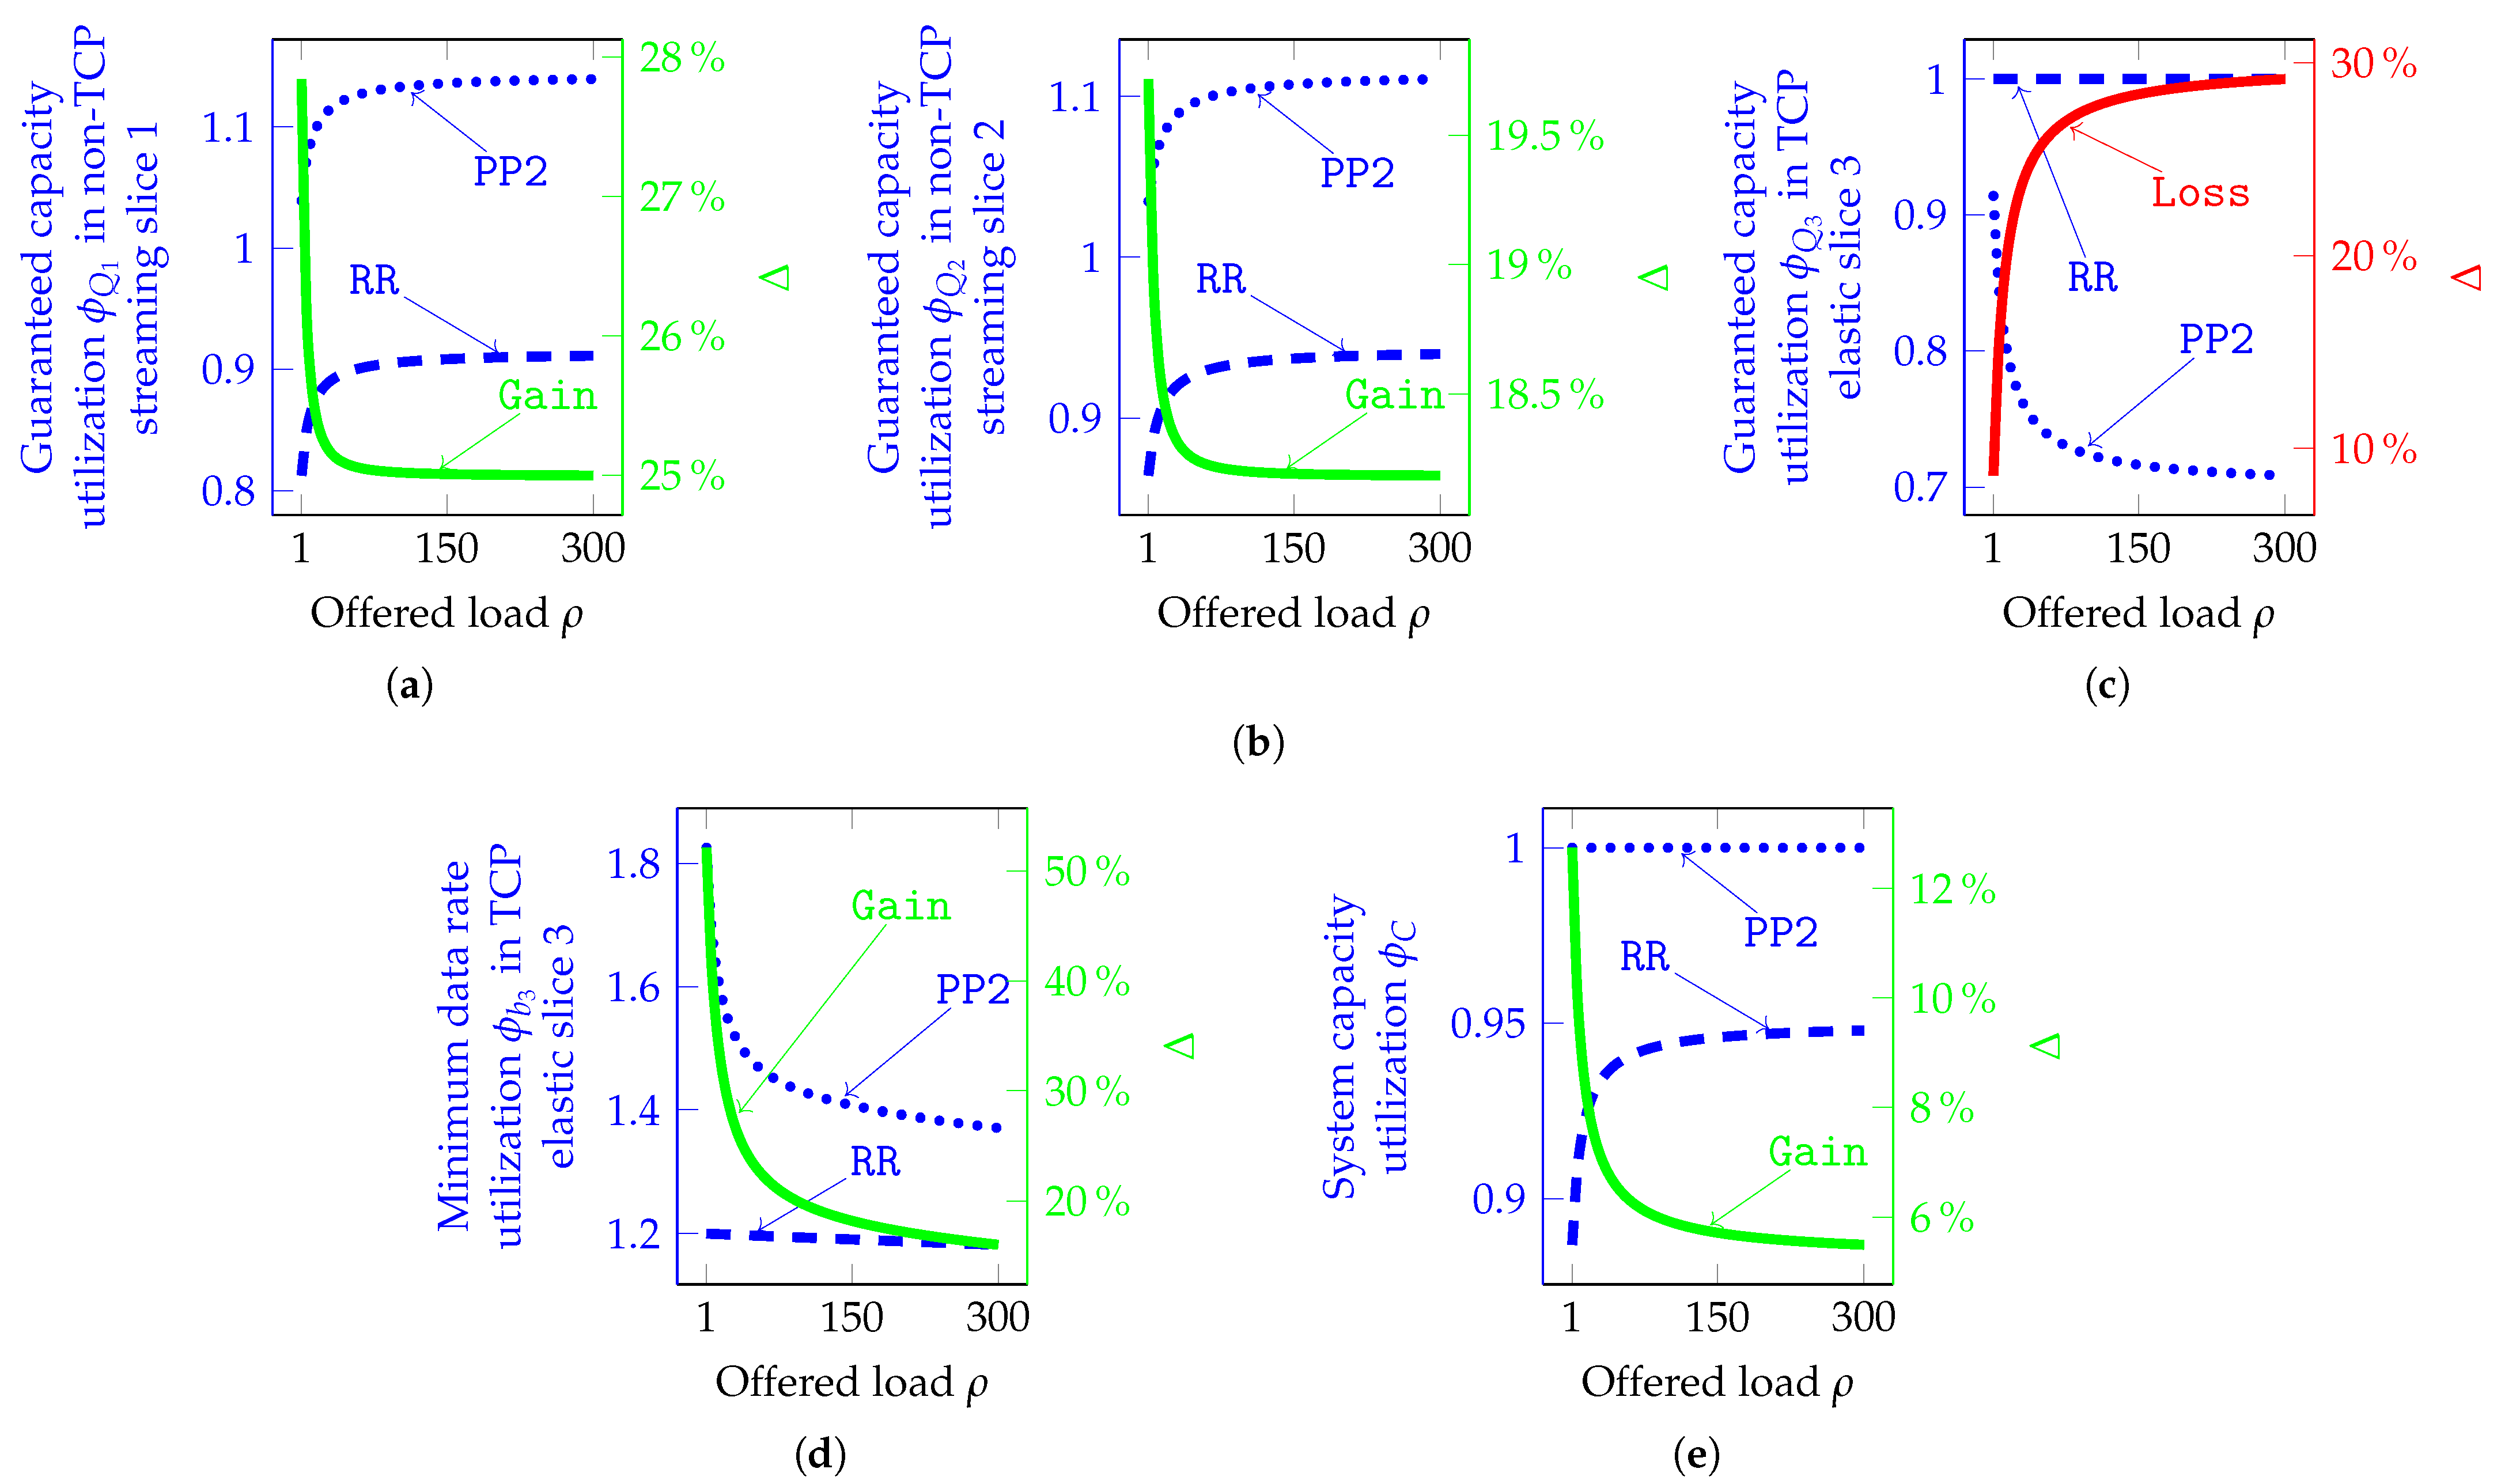
- ✓ The guaranteed capacity utilization in non-TCP streaming slice 1 can increase up to 28% (Figure 8a);
- ✓ The guaranteed capacity utilization in non-TCP streaming slice 2 can increase up to 19.75% (Figure 8b);
- ✗ The guaranteed capacity utilization in TCP elastic slice 3 can decrease down to 30% (Figure 8c);
- ✓ The minimum data rate utilization in TCP elastic slice 3 can increase up to 52% (Figure 8d);
- ✓ The total system capacity utilization can increase up to 13% (Figure 8e).
5. Conclusions
Author Contributions
Funding
Data Availability Statement
Conflicts of Interest
Abbreviations
| 3GPP | Third Generation Partnership Project |
| DRR | Dynamic Resource Reallocation |
| DRS | Dynamic Resource Sharing |
| gNB | Fifth Generation Base Station |
| KPI | Key Performance Indicator |
| NS | Network Slicing |
| PL | Priority Level |
| PP | Preemption-based service Prioritization |
| PP2 | second version of the PP |
| QoS | Quality of Service |
| r.u. | resource units |
| RAC | Radio Admission Control |
| RR | Resource Reservation |
| s.u. | size units |
| SP | Service Prioritization |
| t.u. | time units |
References
- Chandramouli, D.; Pope, M. 5G; System architecture for the 5G System (5GS) (3GPP TS 23.501 version 17.9.0 Release 17). Available online: https://www.etsi.org/deliver/etsi_ts/123500_123599/123501/17.09.00_60/ts_123501v170900p.pdf (accessed on 10 October 2024).
- Sultan, A.; Pope, M. Digital cellular telecommunications system (Phase 2+) (GSM); Universal Mobile Telecommunications System (UMTS); LTE; 5G; Release 16 Description; Summary of Rel-16 Work Items (3GPP TR 21.916 version 16.2.0 Release 16). Available online: https://www.etsi.org/deliver/etsi_tr/121900_121999/121916/16.00.01_60/tr_121916v160001p.pdf (accessed on 10 October 2024).
- Sun, X.; Soveri, M.C. 5G; Management and orchestration; 5G end to end Key Performance Indicators (KPI) (3GPP TS 28.554 version 17.10.0 Release 17). Available online: https://www.etsi.org/deliver/etsi_ts/128500_128599/128554/17.10.00_60/ts_128554v171000p.pdf (accessed on 10 October 2024).
- Li, A.; Sultan, A. 5G; Service requirements for the 5G system (3GPP TS 22.261 version 17.11.0 Release 17). Available online: https://www.etsi.org/deliver/etsi_ts/122200_122299/122261/17.11.00_60/ts_122261v171100p.pdf (accessed on 10 October 2024).
- Vila, I.; Sallent, O.; Umbert, A.; Perez-Romero, J. An Analytical Model for Multi-Tenant Radio Access Networks Supporting Guaranteed Bit Rate Services. IEEE Access 2019, 7, 57651–57662. [Google Scholar] [CrossRef]
- Banchs, A.; de Veciana, G.; Sciancalepore, V.; Costa-Perez, X. Resource Allocation for Network Slicing in Mobile Networks. IEEE Access 2020, 8, 214696–214706. [Google Scholar] [CrossRef]
- Narmanlioglu, O.; Zeydan, E.; Arslan, S.S. Service-Aware Multi-Resource Allocation in Software-Defined Next Generation Cellular Networks. IEEE Access 2018, 6, 20348–20363. [Google Scholar] [CrossRef]
- Fu, X.; Shen, Q.; Wang, W.; Hou, H.; Gao, X. Slice Merging/Spliting Operations and Tenant Profit Optimization Across 5G Base Stations. IEEE Access 2021, 9, 9706–9718. [Google Scholar] [CrossRef]
- Zhou, X.; Kim, D. 5G; 5G System; Session Management Policy Control Service; Stage 3 (3GPP TS 29.512 version 17.11.0 Release 17). Available online: https://cdn.standards.iteh.ai/samples/68674/5f5cb7045e6c4dbcac881e022b0a43d2/ETSI-TS-129-512-V17-11-0-2023-07-.pdf (accessed on 10 October 2024).
- Adou, Y.; Markova, E.; Gaidamaka, Y. Modeling and Analyzing Preemption-Based Service Prioritization in 5G Networks Slicing Framework. Future Internet 2022, 14, 299. [Google Scholar] [CrossRef]
- Yarkina, N.; Gaidamaka, Y.; Correia, L.M.; Samouylov, K. An analytical model for 5G network resource sharing with flexible SLA-oriented slice isolation. Mathematics 2020, 8, 1177. [Google Scholar] [CrossRef]
- Gonçalves, D.M.; Bittencourt, L.F.; Madeira, E.R. Overhead and Performance of Dynamic Network Slice Allocation for Mobile Users. Future Gener. Comput. Syst. 2024, 160, 739–751. [Google Scholar] [CrossRef]
- Camargo, J.S.; Coronado, E.; Ramirez, W.; Camps, D.; Deutsch, S.S.; Pérez-Romero, J.; Antonopoulos, A.; Trullols-Cruces, O.; Gonzalez-Diaz, S.; Otura, B.; et al. Dynamic slicing reconfiguration for virtualized 5G networks using ML forecasting of computing capacity. Comput. Netw. 2023, 236, 110001. [Google Scholar] [CrossRef]
- Khodapanah, B.; Awada, A.; Viering, I.; Francis, J.; Simsek, M.; Fettweis, G.P. Radio Resource Management in context of Network Slicing: What is Missing in Existing Mechanisms? In Proceedings of the 2019 IEEE Wireless Communications and Networking Conference (WCNC), Marrakesh, Morocco, 15–18 April 2019; pp. 1–7. [Google Scholar] [CrossRef]
- Yarkina, N.; Correia, L.M.; Moltchanov, D.; Gaidamaka, Y.; Samouylov, K. Multi-tenant resource sharing with equitable-priority-based performance isolation of slices for 5G cellular systems. Comput. Commun. 2022, 188, 39–51. [Google Scholar] [CrossRef]
- Key, P.; Massoulié, L.; Bain, A.; Kelly, F. A network flow model for mixtures of file transfers and streaming traffic. In Teletraffic Science and Engineering; Elsevier: Amsterdam, The Netherlands, 2003; pp. 1021–1030. [Google Scholar] [CrossRef]
- Kelly, F. Charging and rate control for elastic traffic. Eur. Trans. Telecommun. 1997, 8, 33–37. [Google Scholar] [CrossRef]
- Bertsekas, D.P.; Gallager, R.G. Data Networks, 2nd ed.; Pearson: Upper Saddle River, NJ, USA, 1992; p. 576. [Google Scholar]
- Devlin, K. The Joy of Sets; Springer: New York, NY, USA, 1993; p. 194. [Google Scholar] [CrossRef]
- Bagaria, J. Set Theory. Available online: https://plato.stanford.edu/archives/spr2023/entries/set-theory/ (accessed on 24 August 2024).
- Bocharov, P.P.; D’Apice, C.; Pechinkin, A.V. Queueing Theory; De Gruyter: Berlin, Germany, 2003; p. 446. [Google Scholar] [CrossRef]
- Stepanov, S.N. Teoriya Teletrafika: Kontseptsii, Modeli, Prilozheniya (Teletraffic Theory: Concepts, Models, Applications); Goryachaya Liniya—Telekom: Moscow, Russia, 2015; p. 868. [Google Scholar]
- Basharin, G.P.; Gaidamaka, Y.V.; Samouylov, K.E. Mathematical theory of teletraffic and its application to the analysis of multiservice communication of next generation networks. Autom. Control Comput. Sci. 2013, 47, 62–69. [Google Scholar] [CrossRef]
- Basharin, G.P.; Tolmachev, A.L. Theory of queuing networks and its applications to the analysis of information-computing systems. J. Math. Sci. 1985, 29, 951–1050. [Google Scholar] [CrossRef]
- Basharin, G.P.; Samouylov, K.E.; Yarkina, N.V.; Gudkova, I.A. A new stage in mathematical teletraffic theory. Autom. Remote Control 2009, 70, 1954–1964. [Google Scholar] [CrossRef]
- Standaert, G.; Uitto, T. Nokia and Proximus Deliver 5G Network Slicing Innovation to Support Demanding Network Conditions. Available online: https://www.nokia.com/about-us/news/releases/2022/06/28/nokia-and-proximus-deliver-5g-network-slicing-innovation-to-support-demanding-network-conditions/ (accessed on 24 August 2024).
- Kynäslahti, A. Nokia and Google Trial Innovative Slicing Solution for Android Devices and 4G/5G Networks. Available online: https://www.nokia.com/about-us/news/releases/2022/08/25/nokia-and-google-trial-innovative-slicing-solution-for-android-devices-and-4g5g-networks/ (accessed on 24 August 2024).


| Flow k | ||||
|---|---|---|---|---|
(Streaming service) | Intensity of the customers’ arrival | Mean service time of one customer | Constant data rate of one customer | Offered load |
(Elastic service) | Intensity of the data blocks’ arrival | Mean size of one data block | Minimum data rate of one customer | Offered load |
| Slice (Traffic) | Parameter | Value RR Scheme | Value PP2 Scheme | Unit |
|---|---|---|---|---|
| 1, 2 (Streaming) | % of C | |||
| customers/time units (t.u.) | ||||
| 3 (Elastic) | % of C | |||
| 10 | size units (s.u.) | |||
| customers/t.u. | ||||
Disclaimer/Publisher’s Note: The statements, opinions and data contained in all publications are solely those of the individual author(s) and contributor(s) and not of MDPI and/or the editor(s). MDPI and/or the editor(s) disclaim responsibility for any injury to people or property resulting from any ideas, methods, instructions or products referred to in the content. |
© 2024 by the authors. Licensee MDPI, Basel, Switzerland. This article is an open access article distributed under the terms and conditions of the Creative Commons Attribution (CC BY) license (https://creativecommons.org/licenses/by/4.0/).
Share and Cite
Adou, Y.; Markova, E.; Gaidamaka, Y. Streaming and Elastic Traffic Service in 5G-Sliced Wireless Networks and Mutual Utilization of Guaranteed Resource Units. Future Internet 2024, 16, 397. https://doi.org/10.3390/fi16110397
Adou Y, Markova E, Gaidamaka Y. Streaming and Elastic Traffic Service in 5G-Sliced Wireless Networks and Mutual Utilization of Guaranteed Resource Units. Future Internet. 2024; 16(11):397. https://doi.org/10.3390/fi16110397
Chicago/Turabian StyleAdou, Yves, Ekaterina Markova, and Yuliya Gaidamaka. 2024. "Streaming and Elastic Traffic Service in 5G-Sliced Wireless Networks and Mutual Utilization of Guaranteed Resource Units" Future Internet 16, no. 11: 397. https://doi.org/10.3390/fi16110397
APA StyleAdou, Y., Markova, E., & Gaidamaka, Y. (2024). Streaming and Elastic Traffic Service in 5G-Sliced Wireless Networks and Mutual Utilization of Guaranteed Resource Units. Future Internet, 16(11), 397. https://doi.org/10.3390/fi16110397