Abstract
Graph representation is recognized as an efficient method for modeling networks, precisely illustrating intricate, dynamic interactions within various entities of networks by representing entities as nodes and their relationships as edges. Leveraging the advantage of the network graph data along with deep learning technologies specialized for analyzing graph data, Graph Neural Networks (GNNs) have revolutionized the field of computer networking by effectively handling structured graph data and enabling precise predictions for various use cases such as performance modeling, routing optimization, and resource allocation. The RouteNet model, utilizing a GNN, has been effectively applied in determining Quality of Service (QoS) parameters for each source-to-destination pair in computer networks. However, a prevalent issue in the current GNN model is their struggle with generalization and capturing the complex relationships and patterns within network data. This research aims to enhance the predictive power of GNN-based models by enhancing the original RouteNet model by incorporating an attention layer into its architecture. A comparative analysis is conducted to evaluate the performance of the Modified RouteNet model against the Original RouteNet model. The effectiveness of the added attention layer has been examined to determine its impact on the overall model performance. The outcomes of this research contribute to advancing GNN-based network performance prediction, addressing the limitations of existing models, and providing reliable frameworks for predicting network delay.
1. Introduction
Graph Neural Networks (GNNs) have brought about a revolutionary change in fields that deal with structured data represented as graphs, particularly in computer networking, where its adoption has been rapid due to its effectiveness in various use cases such as performance modeling, routing optimization, and resource allocation [1]. GNNs have garnered significant attention in the machine learning field due to their ability to produce accurate predictions even for networks not present in the training data, making them a subject of active research and interest. Moreover, GNNs are being explored in different domains such as chemistry, physics, and social networks. Although Neural Networks (NNs) have proven to be excellent function approximators for structured data, they are not suitable for learning from data with complex relationships such as graph data [2,3]. In networking, nodes of the graph data depict networking entities with their features, and edges are the connections or relationships between the different entities. These connections can represent various types of interactions or data flows, encapsulating the intricate and non-euclidean structure inherent to network systems. Thus, a more sophisticated and specialized neural network architecture is required to handle the graph data effectively, leveraging the rich representational capacity of graphs to model the complex, non-linear interdependencies between entities in a network. Thus, GNNs are being employed in networking domains to accurately estimate performance by learning from graph features and structures.
Selecting the optimal route while simultaneously ensuring Quality of Service (QoS) for network flows is a complex task, particularly as network resources can dynamically change. Traditional networks, with limitations such as per-hop decision making and challenges in applying flow-based QoS due to a lack of a global network view, face ongoing issues in routing [4]. QoS-driven routing emerges as a solution, providing strategies that identify the best paths to meet the QoS requirements of a maximum number of flows. Specifically focusing on minimizing delays, QoS-driven routing becomes crucial for maintaining flows within guaranteed QoS routes and achieving optimized Quality of Service. For this purpose, accurate prediction of QoS, using models such as RouteNet is imperative. RouteNet is a novel GNN model that has shown its effectiveness in producing accurate estimations of per-source/destination pair mean delay and jitter in networks with comparable accuracy to resource-intensive packet-level simulators. Its specialized GNN architecture operates on data structured as graphs, enabling it to learn and model the intricate relationships among network topology, routing, and input traffic. This enables RouteNet to make performance predictions even in scenarios that were not observed during the training phase [5]. RouteNet has the potential to address the limitations of existing GNN models, particularly in generalizing to larger graphs, making it a promising solution for various network modeling and optimization tasks.
Existing GNNs in networking applications struggle to adapt effectively to more complex network structures limiting their practical use in diverse real-world scenarios. These limitations restrict the development and adoption of accurate and scalable network models in various networking applications, including performance modeling, routing optimization, and resource allocation in wireless networks [2]. The primary limitation of RouteNet lies in its diminished accuracy when faced with evaluation data distributions divergent from the training set, and it does not generalize well to networks considerably larger than those encountered during the training phase [6].
To address this issue, exploring alternative and innovative approaches for efficiently training GNN-based models to handle networks with varying complexities is essential. Thus, our solution involves modifying the architecture of the RouteNet model by incorporating an attention layer. This additional layer aims to refine the model’s predictive capabilities and accuracy in predicting network performance metrics. To evaluate the performance of the modified RouteNet model, a comparative analysis with the original RouteNet model is conducted. By comparing the results, we aim to measure the impact and effectiveness of incorporating the attention layer in enhancing the model’s overall performance and prediction accuracy. Hence, there is a need to explore new approaches for training GNN-based models in networking applications, by utilizing recent advancements in semi-supervised learning.
The major contributions of this research are as follows:
- Enhancement of the RouteNet model internal architecture by incorporating the attention mechanism, enhancing its delay prediction.
- Evaluation of the predictive capabilities of the original RouteNet with the attention-enhanced version.
2. Background and Related Work
2.1. RouteNet Model
RouteNet is a type of Recurrent Neural Network (RNN) that is designed to predict network Key Performance Indicators (KPIs) for specific source–destination pairs, based on a given network configuration [7]. RouteNet is trained on data collected from various network topologies, including their traffic and routing configurations, to learn the network model. This model can then be used to predict network performance for specific source–destination pairs. The model can then predict network performance by capturing the intricate relationships between link properties and source–destination paths in the network topologies.
The process of transforming the original network topology into the RouteNet input graph is illustrated in [8]. The input graph used by RouteNet is a modified version of the original graph that has been transformed by representing links as nodes and creating hyperedges for each sample. RouteNet exploits the link–path relationship to obtain states that encode useful information for predicting performance metrics, with paths depending on link states and links depending on path states.
We consider the internal architecture of RouteNet presented in [9]. During a single message-passing iteration in RouteNet, first, the information propagates from paths to links. For each link, the state vectors of all paths that use that link element-wise are summed and feed the resulting output as input to the RNN that updates the link state. The RNN combines the previous state with new information to produce a more informed, updated link state. Next, the information propagates from links to paths. For each path, the sequence of link states that the path traverses is used as input to a different RNN that updates the path state. The output of this RNN, with its initial hidden state set to the current path state values, gives the updated path state. This step is repeated for several iterations until the states converge [8].
The Gated Recurrent Unit (GRU) is a recurrent neural network (RNN) architecture introduced by Cho et al. in 2014 [10]. The GRU addresses the limitations of traditional RNNs by incorporating gating mechanisms that enable selective information updates and access over time. It consists of two main gates: the reset gate and the update gate. The reset gate determines the extent to which the previous hidden state is reset, while the update gate controls the integration of new information into the hidden state. These gates allow the GRU to selectively retain relevant information and capture long-term dependencies, making it effective in various tasks.
The mathematical representation of the GRU, as depicted in Figure 1, can be described by the following equations:
where
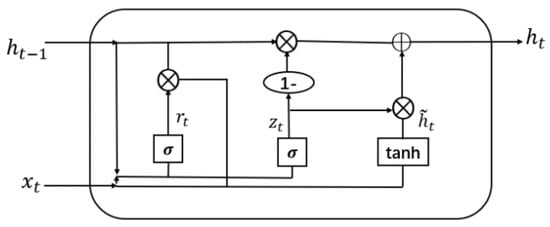
Figure 1.
Gated Recurrent Unit.
- where
- : Learnable weight matrices used to capture patterns in the input data.
- : Input at time step t in the sequence.
- : Previous hidden state at time step .
- : Sigmoid function used for activation and gate control.
- : Reset gate output at time step t, determines previous state reset.
- : Update gate output at time step t, controls new information incorporation.
- : Candidate hidden state at time step t, computed using the reset gate and input.
- : Current hidden state at time step t, computed by combining the previous hidden state and the candidate hidden state based on the update gate.
In the GRU, the reset and update gates, along with the candidate memory content, are computed based on the previous hidden state and current input. The hidden state is then updated by combining the previous hidden state with the candidate memory content weighted by the update gate. This update process allows the GRU to adaptively capture sequential patterns and mitigate the vanishing gradient problem commonly encountered in traditional RNNs.
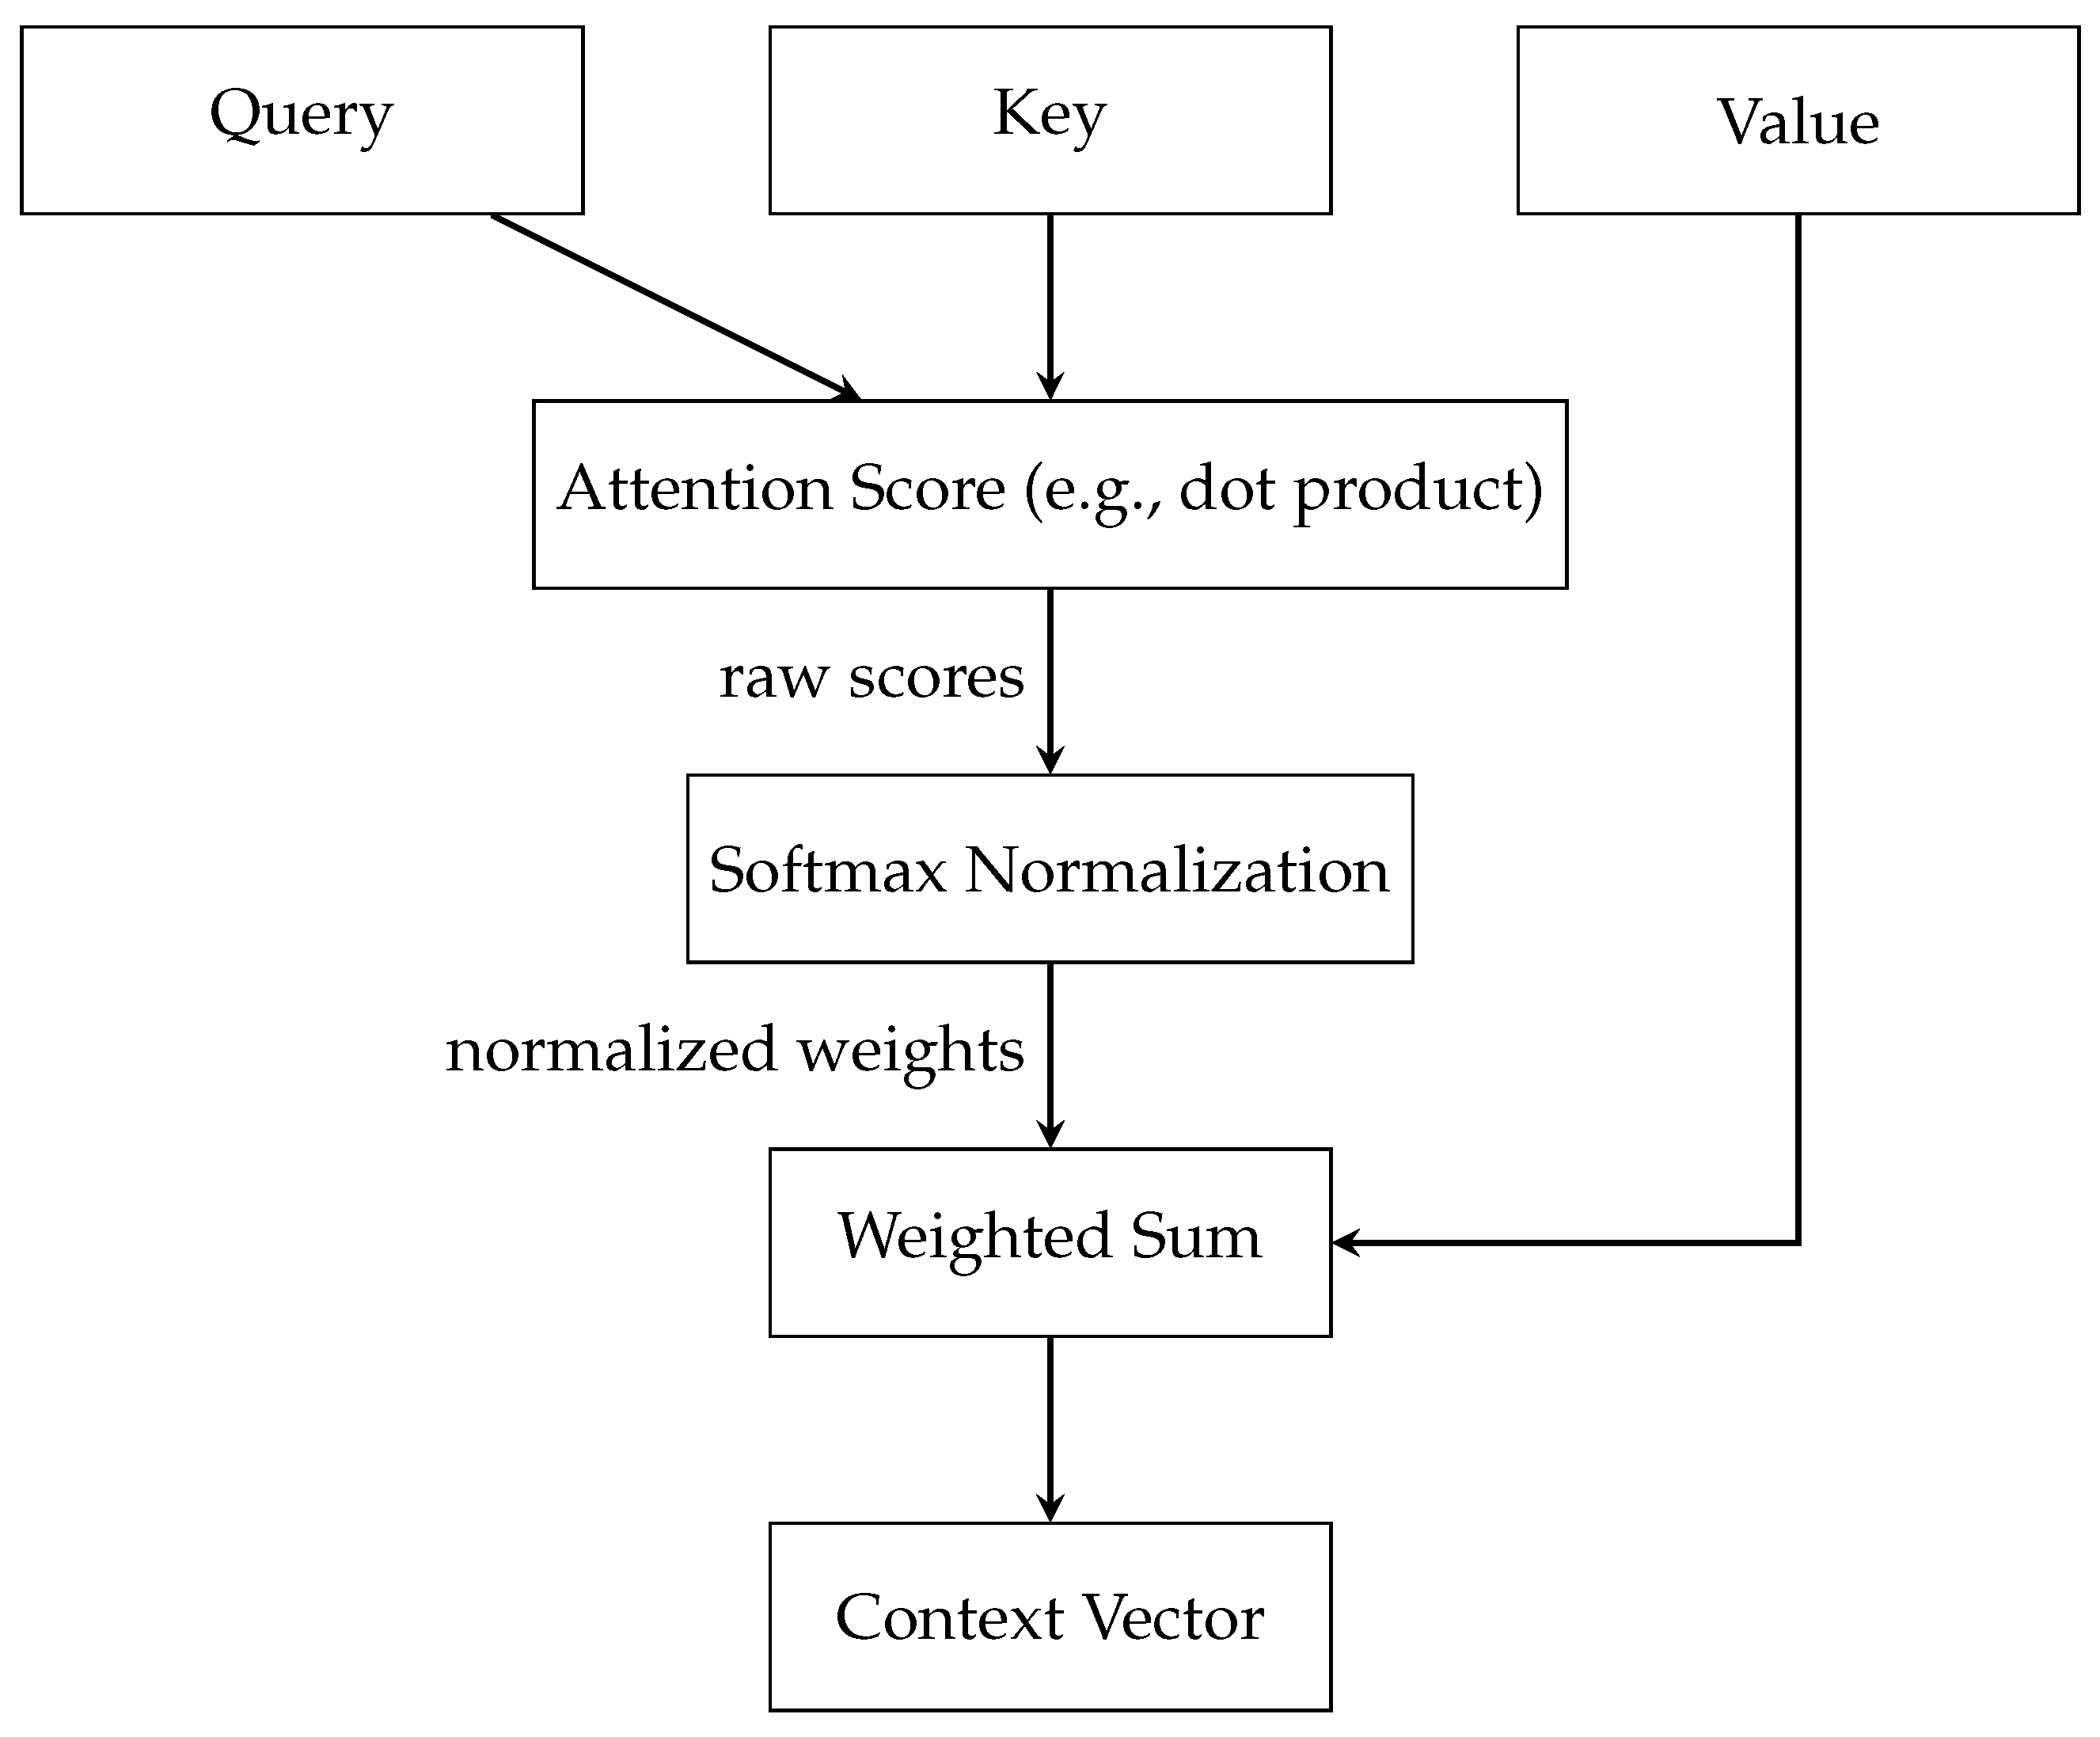
The key components of attention include three essential elements: (a) the Query, (b) the Key, and (c) the Value, illustrated in Figure 2. Each of these plays a distinct and significant role in the mechanism. The Query is a vector that represents the current element or area of focus for which the model is attempting to compute an output. This could be, for example, a word in a sentence that the model is currently processing. The Key vectors correspond to each element in the input sequence, with each key being compared against the Query to ascertain its relevance. The Value vectors are associated with the keys and are crucial in constructing the final output once the relevance of each input element to the Query is established. Once the Query and Key vectors are defined, the model calculates the attention scores. This is typically performed using a function like the dot product, where each Query vector is compared with each Key vector. The resultant attention scores are a set of raw numerical values indicating how relevant each key (and by extension, the associated value) is to the query. However, these raw scores are not directly used. Instead, they undergo Softmax Normalization, a crucial step that transforms the scores into a probability distribution. The softmax function ensures that the scores add up to one, turning them into weights that can be applied evenly across the data. This normalization process is key to the mechanism’s ability to focus on the most relevant parts of the input sequence. The next step involves the weighted sum, where the model applies the normalized attention weights to the Value vectors. This process effectively combines the values, with the degree of emphasis placed on each value being proportional to its calculated importance. Finally, the Context vector is the output of the Weighted Sum block and encapsulates the aggregated, attention-weighted information from the entire input sequence. The Context vector is a comprehensive representation of the input, filtered through the lens of the current focus or query. The mathematical framework, along with a deeper understanding of the aggregation, normalization, and attention score computation mechanisms within graph attention networks, is detailed in [11].

Figure 2.
Detailed Attention Mechanism.
2.2. Related Work
The paper by Miquel Ferriol-Galmés et al. [1] addresses the scalability problem of Graph Neural Networks (GNNs) for network control and management. The GNN has shown great potential in accurately predicting network properties, but existing solutions have a limitation in generalizing to larger networks. To overcome this limitation, the authors propose a GNN-based solution that can effectively scale to larger networks with higher link capacities and aggregated traffic on links. The approach has been evaluated and shown to significantly improve the accuracy of network predictions on larger graphs.
In 2019 [2], a network model called RouteNet was proposed that uses Graph Neural Networks (GNNs) to accurately predict end-to-end Key Performance Indicators (KPIs) such as delay and jitter in networks. They evaluated RouteNet and showed that it can make performance predictions with similar accuracy to packet-level simulators, even in network scenarios unseen during training.
K. Rusek et al. [5] developed a GNN model that accurately estimates delay and jitter in self-driving Software-Defined Networks by understanding the complex relationship between topology, routing, and input traffic. The model generalized arbitrary topologies and routing schemes and has been tested against unseen scenarios, achieving a worst-case R2 of 0.86. The paper also presents the model’s potential for network operation, including its effectiveness in delay/jitter routing optimization for specific source/destination pairs and its ability to reason in topologies and routing schemes not seen during training.
Miquel Farreras et al. [7] presented an approach to address the generalization problem of Graph Neural Networks (GNNs) by leveraging networking concepts and analysis to improve the baseline RouteNet model developed by Barcelona Neural Networking Center - Universitat Polit‘ecnica de Catalunya (BNN-UPC). The proposed method was able to significantly enhance the accuracy of the model in larger graphs, which is an important step toward using GNNs for modeling and optimizing modern networks. In addition, the paper proposes a closed-loop control context where the resulting GNN model could potentially be applied in different use cases.
Arnau Badia-Sampera [8] presented an extension to the RouteNet model, which uses Graph Neural Networks (GNNs) to estimate network performance metrics based on topology, routing configuration, and traffic demands. The model was evaluated on a dataset of network scenarios with varying queue sizes, demonstrating progress toward building more realistic network models for optimizing and managing real-world computer networks.
In 2018, Mestres et al. [12] explored the application of neural networks (NNs) for modeling the average end-to-end delay in computer networks based on input traffic matrices. While the study underscores the accuracy and efficiency of well-designed NNs, a notable disadvantage is their data-driven nature, demanding large training sets and significant computational resources during the learning phase. Despite these limitations, NNs prove effective in accurately modeling average end-to-end delay in communication networks, provided proper tuning of hyperparameters, with the primary drawback being their resource-intensive initial training process.
In a study conducted in [13], it was demonstrated that RouteNet-Fermi is an accurate and effective network model for predicting delay, jitter, and loss in complex networks. The model was found to have comparable accuracy to computationally expensive packet-level simulators and was able to scale accurately to large networks with a mean relative error of 6.24% on a test dataset.
Ferriol-Galmés et al. [14] introduced a new technique called RouteNet-Erlang, which utilizes Graph Neural Networks (GNNs) to model computer networks. This approach supports complex traffic models, multi-queue scheduling policies, and routing policies, and can provide accurate estimates in networks not seen during training. The authors compared RouteNet-Erlang to a state-of-the-art Queuing Theory (QT) model and showed that it outperformed QT in all network scenarios.
Rusek et al. [15] developed a network model called RouteNet that uses Graph Neural Networks (GNNs) to accurately predict Key Performance Indicators (KPIs) such as delay, jitter, and loss in Software-Defined Networks. The authors demonstrated that RouteNet can generalize over various network topologies, routing schemes, and traffic intensity, and can accurately predict KPIs even in unseen scenarios. The paper highlights the limitations of existing analytic models for network modeling and emphasizes the potential of GNNs for building accurate and flexible data-driven models for network optimization. Furthermore, the authors presented use cases where they used RouteNet for efficient routing optimization and network planning.
Badia-Sampera et al. [16] introduced an extension to the RouteNet model, allowing for the modeling of forwarding devices with different characteristics, specifically, variable queue sizes. The model was evaluated through experiments to assess its accuracy in predicting network performance metrics.
In 2022, Bruno et al. [17] addressed 5G network generalization challenges with QTRouteNet, utilizing robust features from Queuing Theory (QT). By fine-tuning baseline predictions with a modified RouteNet GNN model, they significantly improved generalization, reducing the mean absolute percent error from 10.42 to 1.45. QTRouteNet’s success indicates that enhancing network modeling accuracy can be achieved effectively through minor modifications to a robust approximate model without sacrificing generalization.
DeepQSC, proposed by Ren et al. [18], addresses the QoS-based service composition problem through an end-to-end supervised learning framework incorporating attention mechanisms. It effectively navigates challenges related to diverse service compositions, intricate topological relationships, and varying subfunction providers. Leveraging attention mechanisms, the model excels in capturing complex relationships among web services, leading to superior QoS-aware composite service formation.
Zheng et al. [19], introduced STGMAGNet, a pioneering approach for predicting long-term airport delays, incorporating attention mechanisms. Utilizing a Spatial–Temporal Gated Multi-Attention Graph Network, the model proficiently captures intricate correlations among airports and time steps. This attention-centric strategy enhanced precision, addressing challenges such as error propagation and dynamic correlations.
Tam et al. [20] conducted an extensive review of Graph Neural Network (GNN) applications in network management, encompassing task offloading, routing optimization, and resource allocation. The paper explored the GNN’s role in enhancing delay awareness for tasks like offloading and routing optimization in network management. The survey extensively covered SDN/NFV-enabled networks, emphasizing objectives such as energy efficiency, QoS improvement, resource utilization, cost optimization, and link loading.
Sun et al. [21] present a thorough survey on attention-enhanced Graph Neural Networks (GNNs), addressing a gap in systematic exploration. Introducing a novel two-level taxonomy, it categorizes attention-based GNNs into graph recurrent attention networks, graph attention networks, and graph transformers. This study explores the enhancement of GNN functionality through the integration of attention mechanisms.
3. Methodology
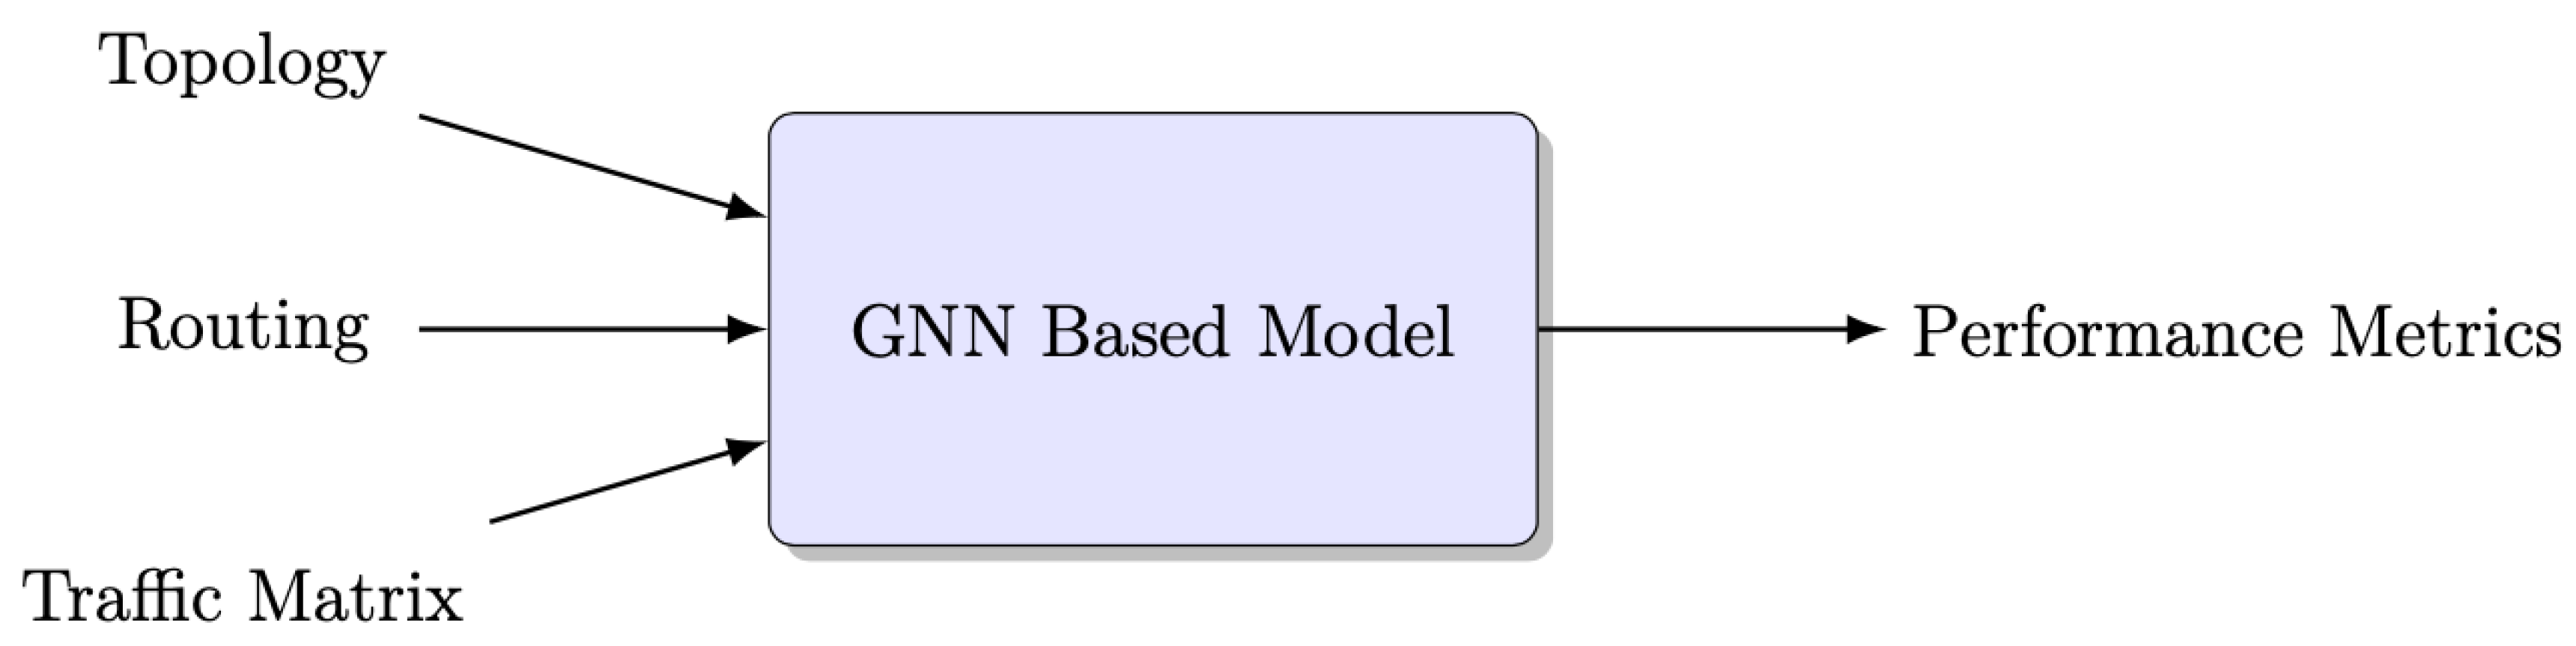
The block diagram illustrating RouteNet, which is a Graph Neural Network (GNN)-based model, is depicted in Figure 3. RouteNet is a network performance prediction system that takes a given network topology, source–destination routing scheme, and traffic matrix as input, and produces performance metrics for each end-to-end path in the routing scheme [2].
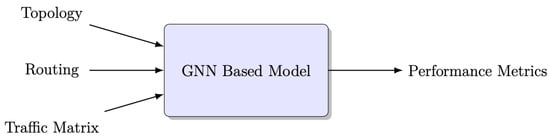
Figure 3.
Block diagram of GNN-based model.
The model processes various inputs for each sample in the dataset to perform its delay prediction [7]. These inputs include the following:
- Topology: The input topology represents the network structure using a directed graph, where nodes represent network devices (such as routers or switches) and edges represent physical or logical links connecting these devices. Moreover, topology includes properties such as nodes, links, queue sizes, and link capacity. It provides a detailed description of the physical objects in the network and their interconnections, enabling the model to understand the network’s layout and properties.
- Traffic Matrix: The traffic matrix is a matrix representation where the rows and columns correspond to network devices, and the elements indicate the bandwidth or volume of traffic between device pairs. This input provides information about the flow-level and aggregate characteristics of network traffic, including metrics such as average bandwidth, packet generation rates, and average packet size. Analyzing the traffic matrix allows the model to simulate and analyze the traffic patterns and demands within the network, facilitating resource allocation and capacity planning.
- Routing: The routing input consists of a scheme that specifies the paths connecting source–destination pairs in the network. It defines the routes that packets take when traveling from one node to another. By analyzing the routing scheme, the model can evaluate the efficiency and effectiveness of data routing, allowing for optimizations and informed decision making regarding network traffic distribution.
As the model relies on topology, routing, and traffic information as inputs, obtaining these data from the networking system is crucial. Identifying the topology of large-scale systems, especially those with dynamic topologies, necessitates employing a variety of sophisticated tools and technologies. Automated discovery tools such as SNMP (Simple Network Management Protocol) and LLDP (Link Layer Discovery Protocol) are pivotal in facilitating real-time and continuous topology discovery by dynamically detecting network devices and tracking topology changes. These technologies simplify the topology discovery process in dynamic environments by allowing for automated polling and retrieval of network information [22]. Integrating these discovery tools with Network Management Systems (NMS) further enhances the capability to efficiently manage large-scale and dynamic topologies by providing a centralized platform for network topology visualization, change tracking, and alert management [23].
In our research, publicly available datasets generated from a customized packet-level simulator based on OMNeT++ were utilized, which were collected from [24,25]. These datasets include samples with different input topologies, routing configurations, and traffic patterns. For this research, four specific topology datasets were used: NSFNet Topology, GEANT2 Topology, GBN Topology, and REDIRIS Topology. During the training phase, the NSFNet and GEANT2 topologies were used, the GBN topology was used for validation, and the REDIRIS topology was used for testing purposes.
3.1. RouteNet Model Implementation
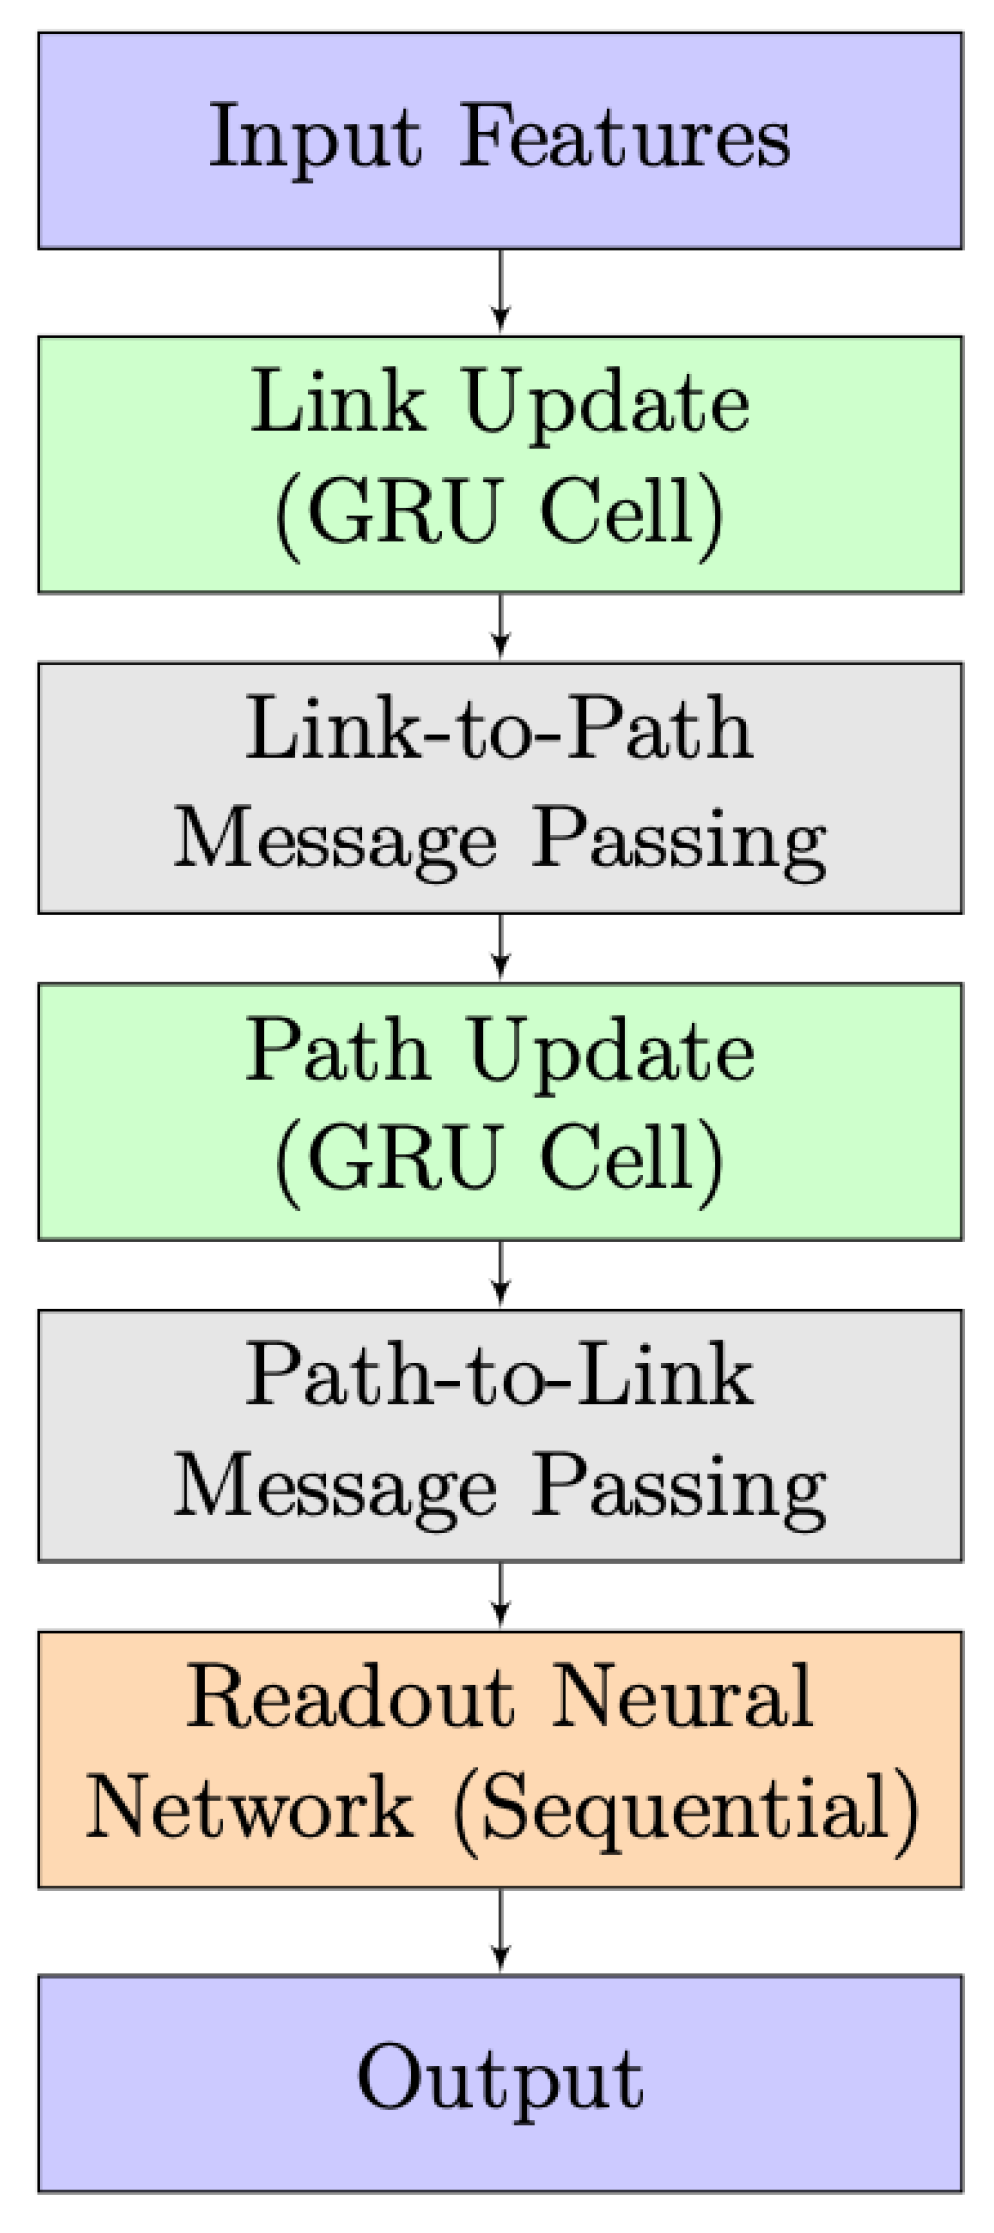
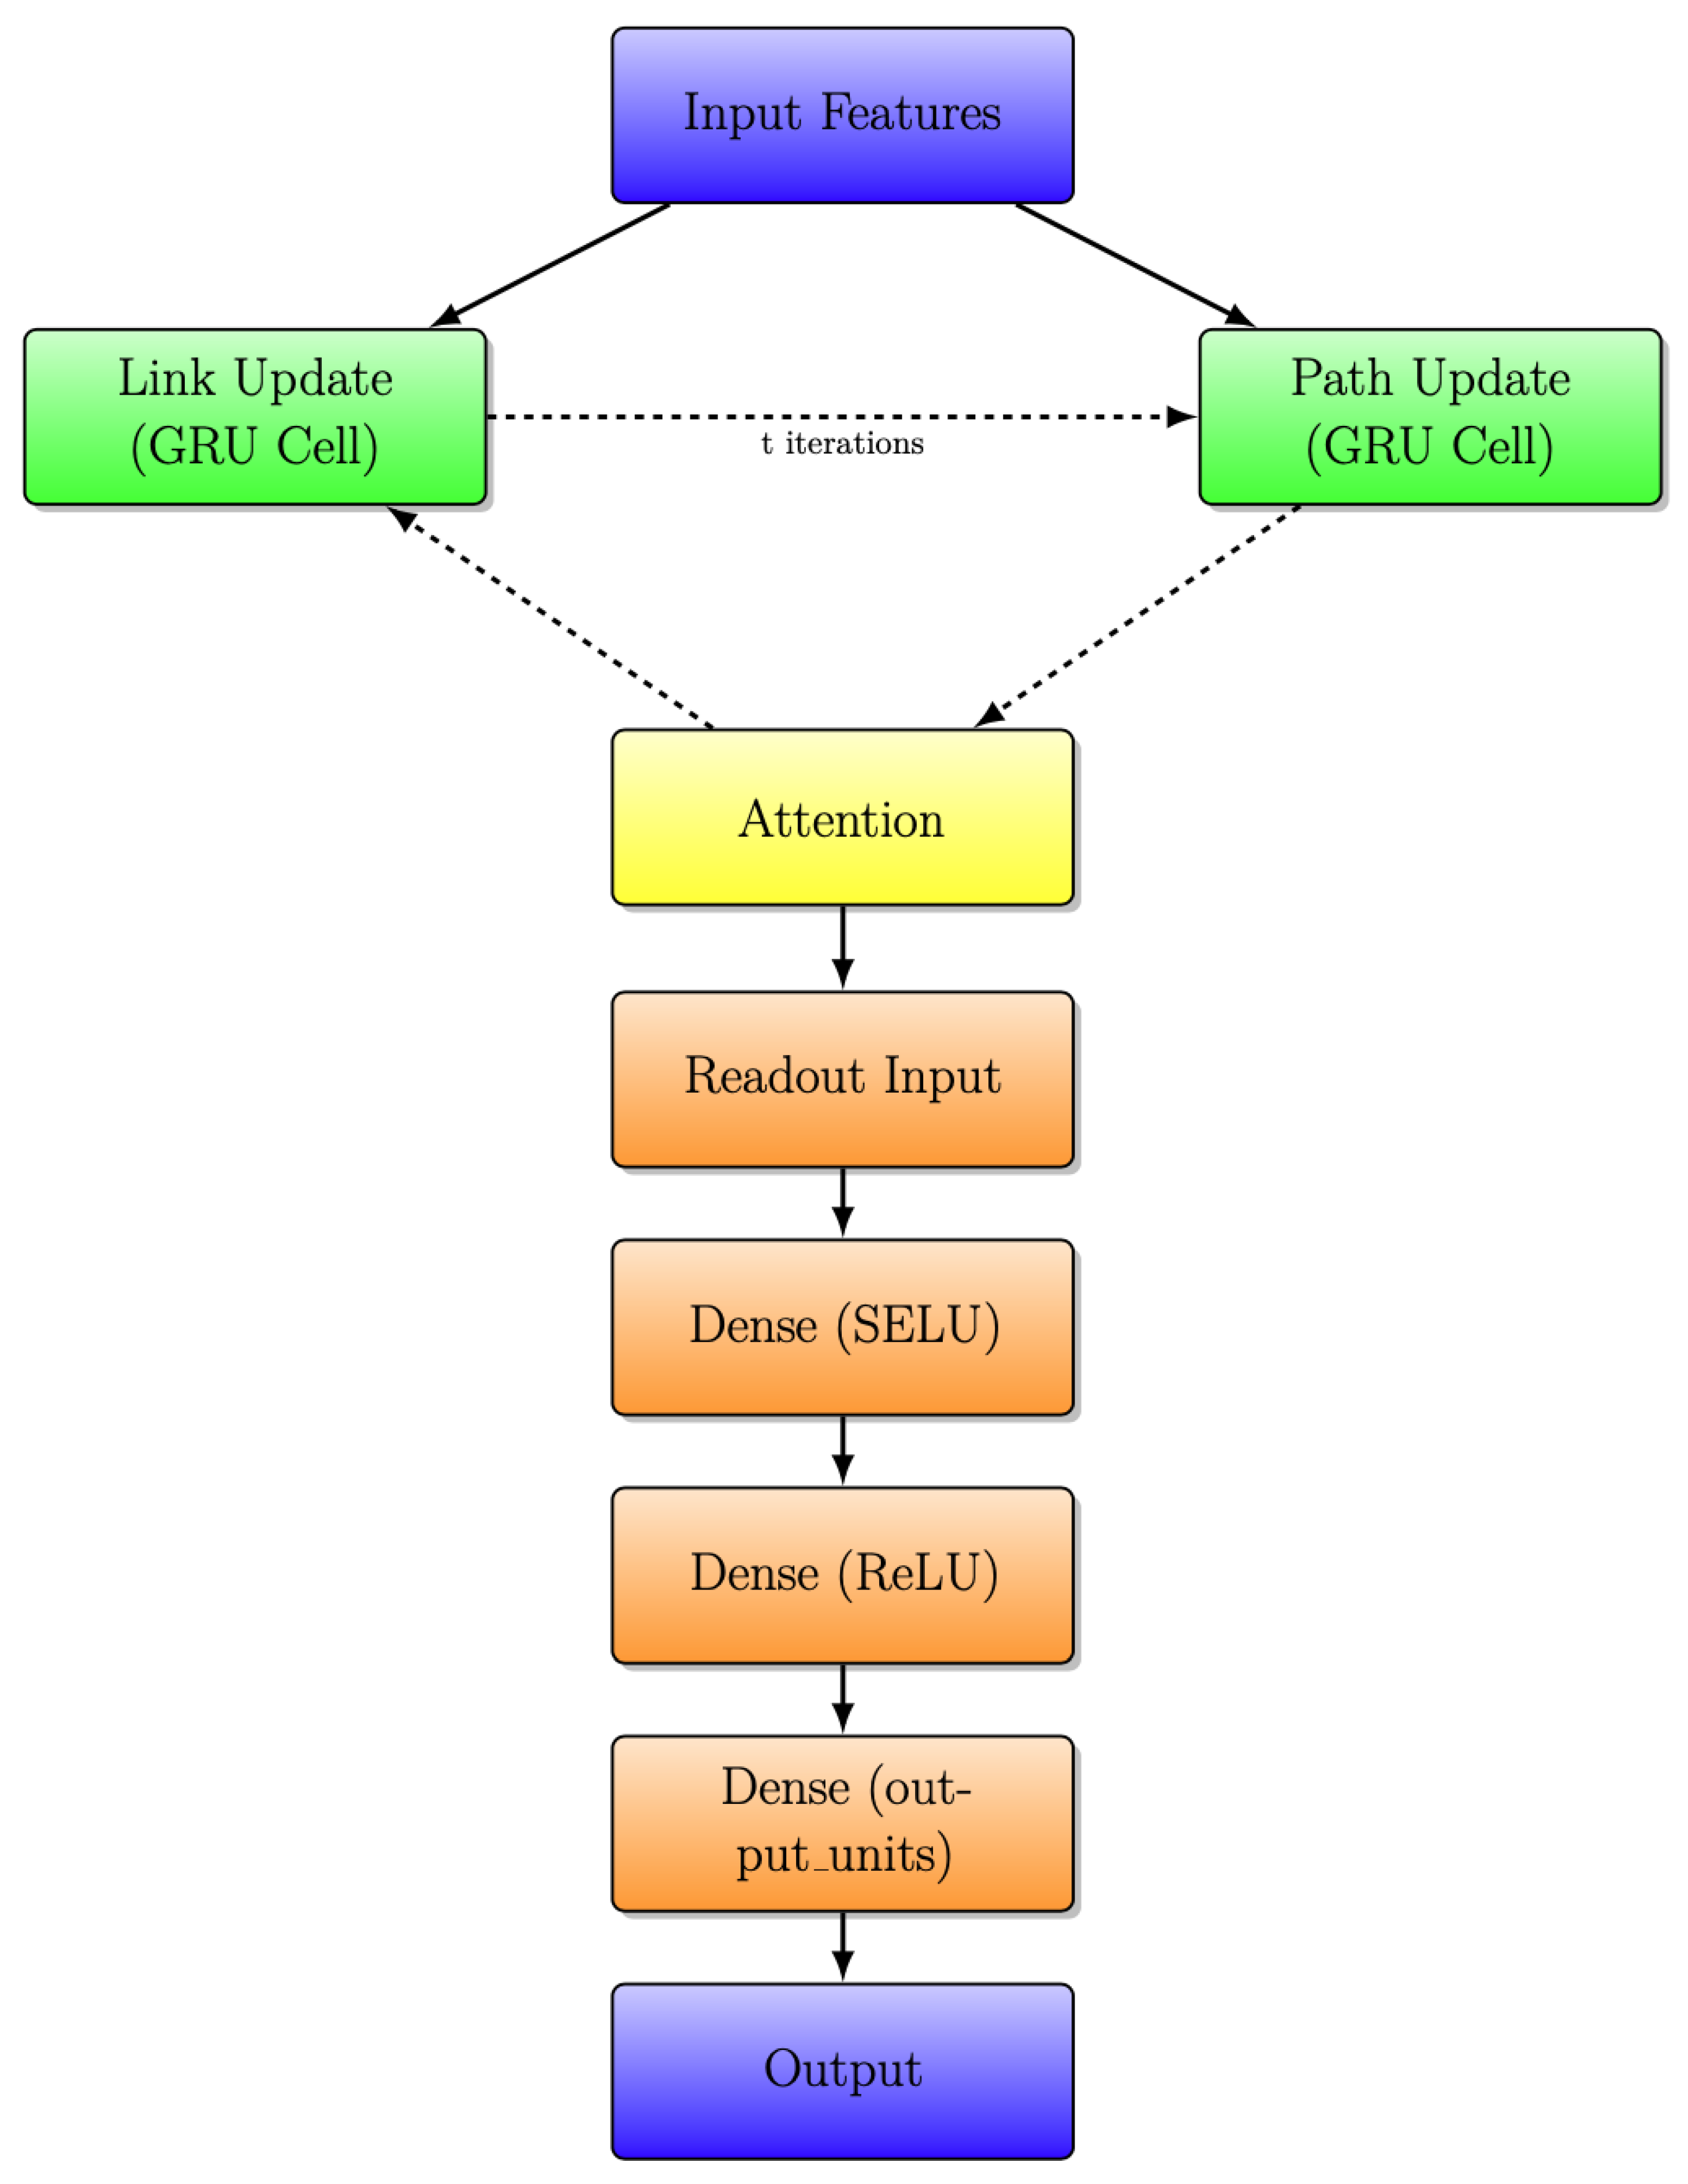
The simplified architecture of the RouteNet model is depicted in Figure 4. It takes input features, processes them through link and path updates using GRU cells, and incorporates information exchange between links and paths. A readout neural network then produces the final output. The design highlights the integration of link and path information for effective information processing.
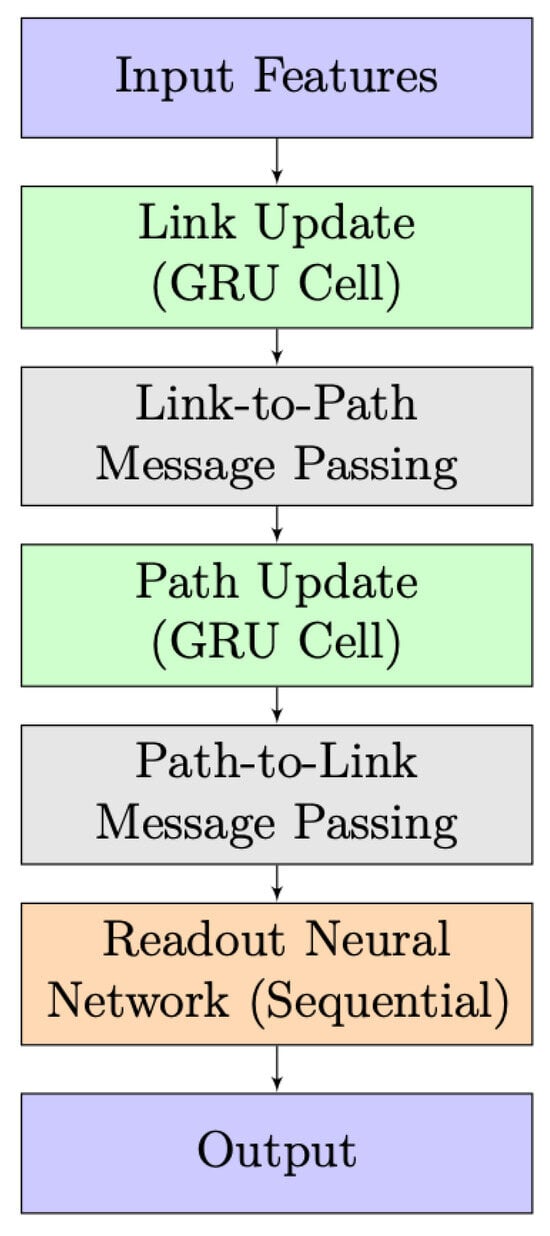
Figure 4.
RouteNet model architecture.
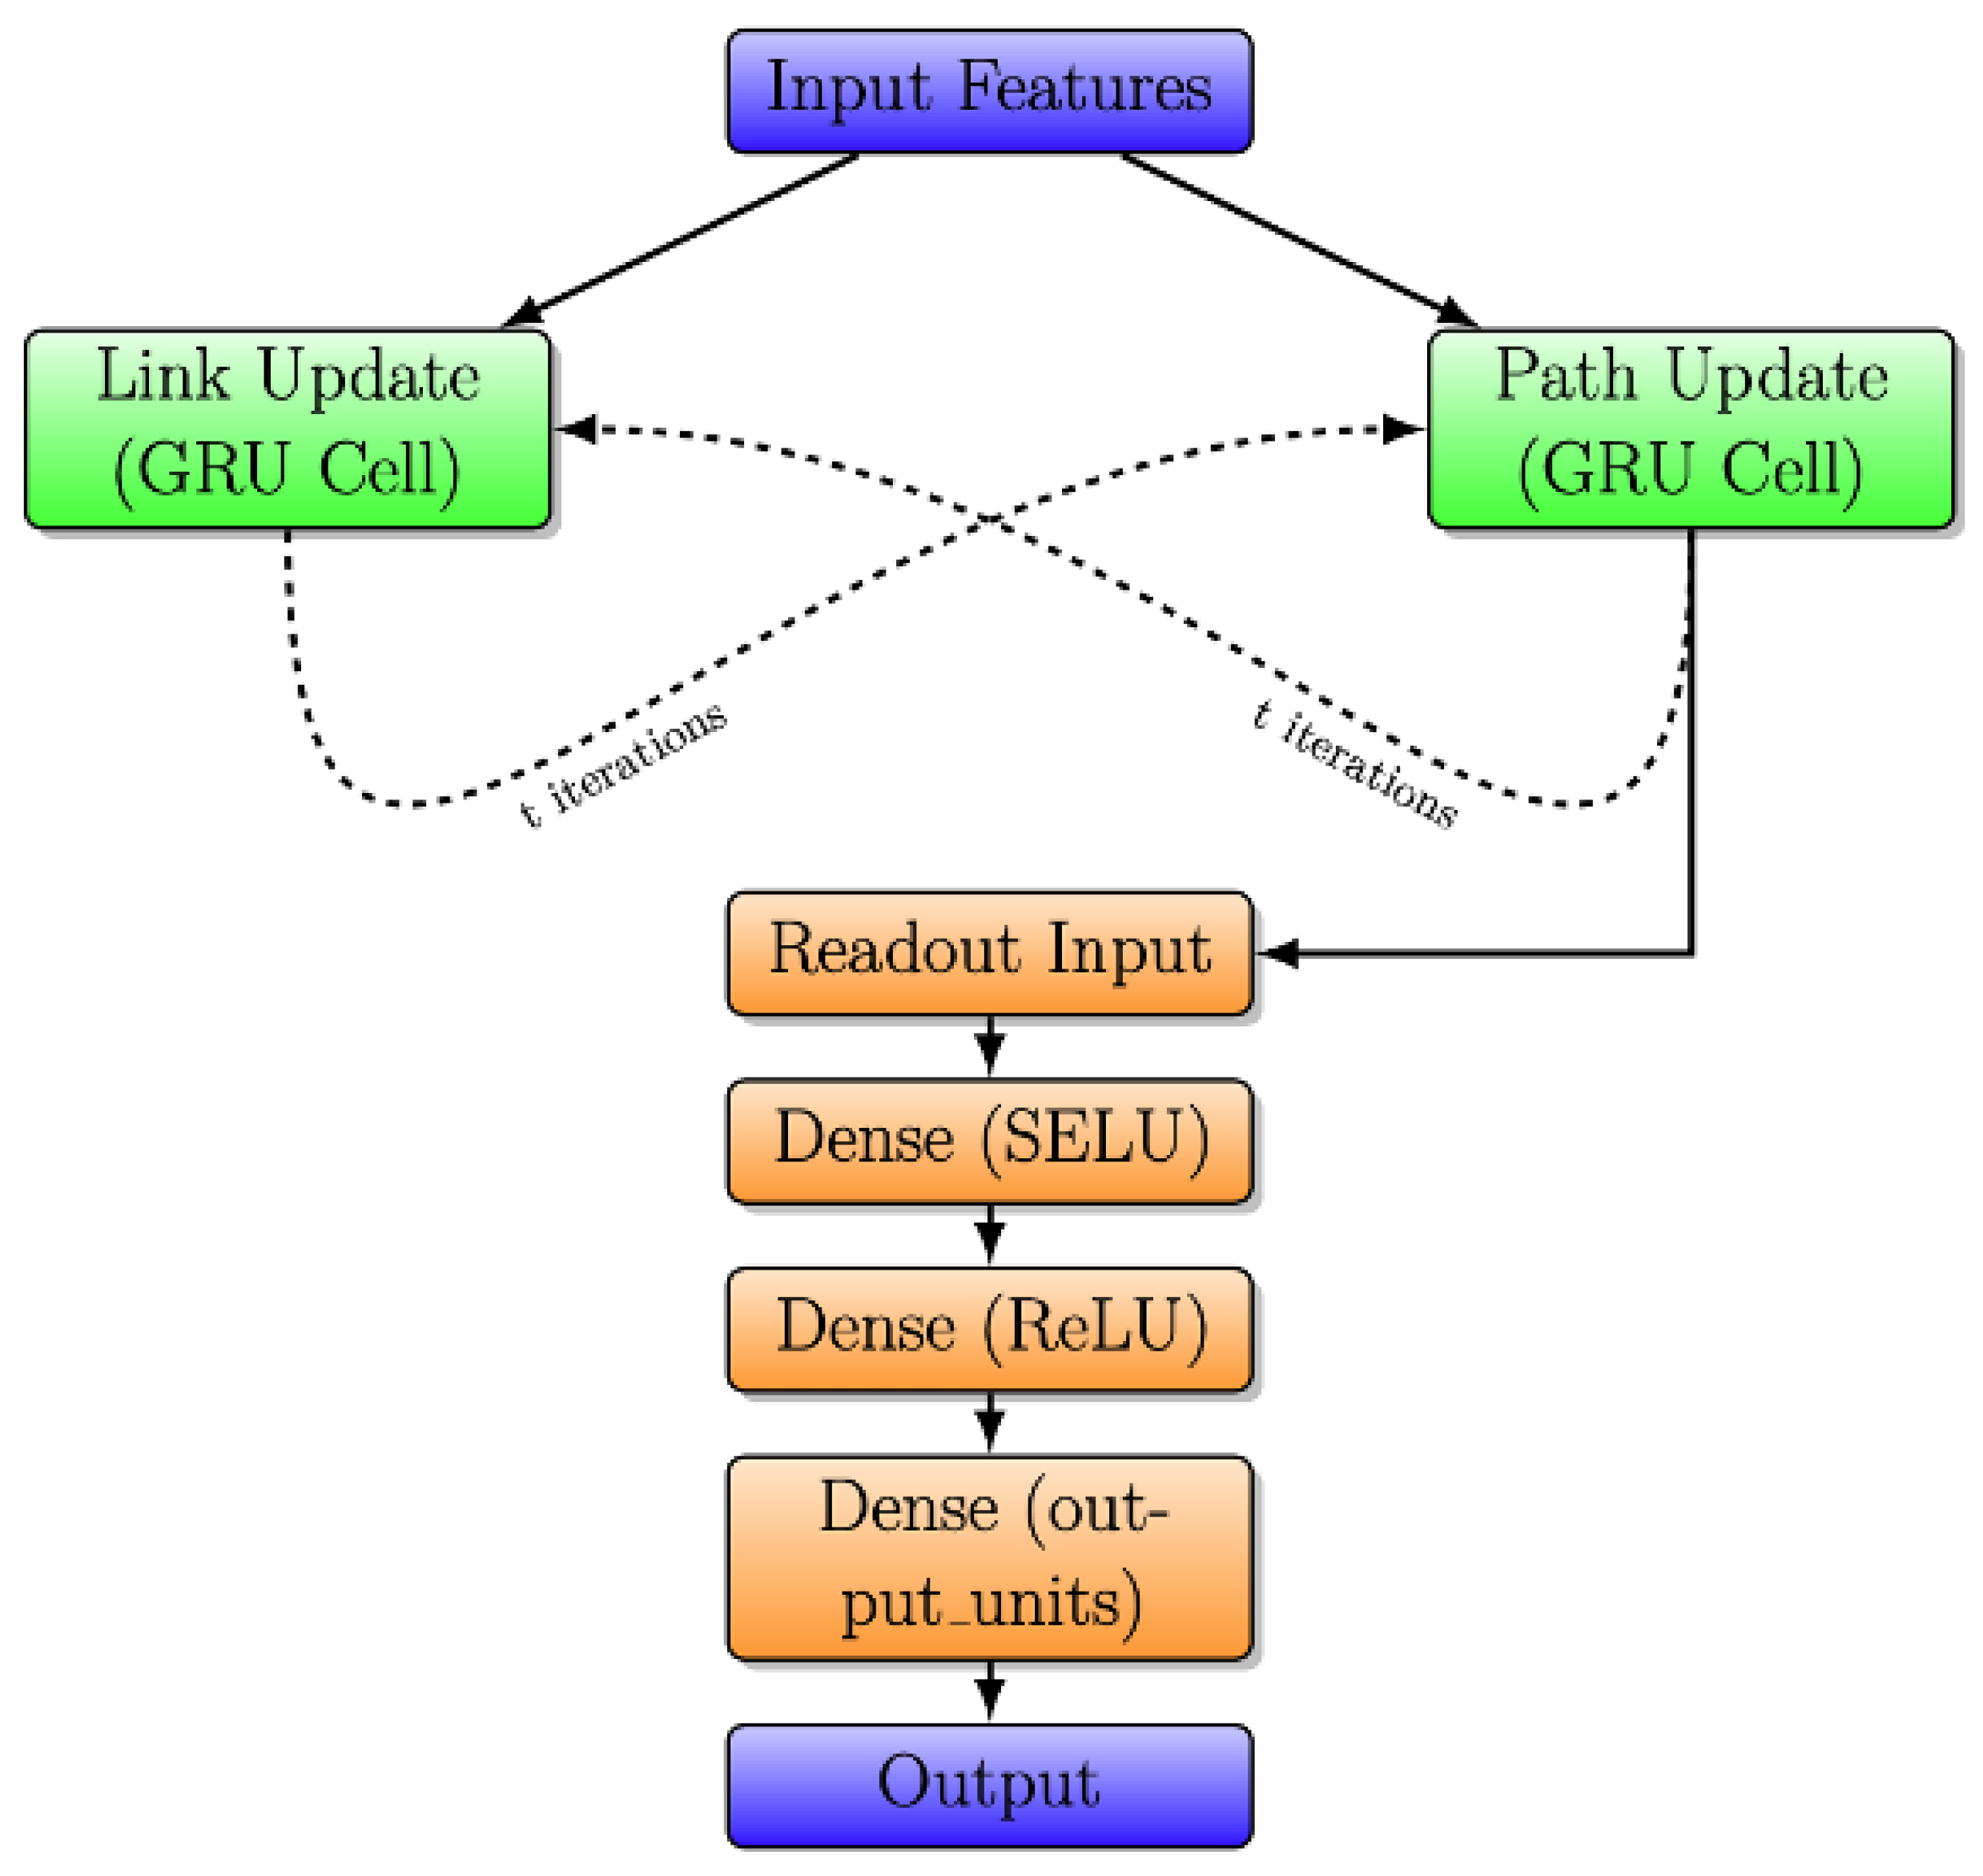
Figure 5 presents the detailed architecture of the RouteNet model, emphasizing the exchange of information through message passing between links and paths. Following ‘t = 8’ iterations, the model then progresses through the readout network.
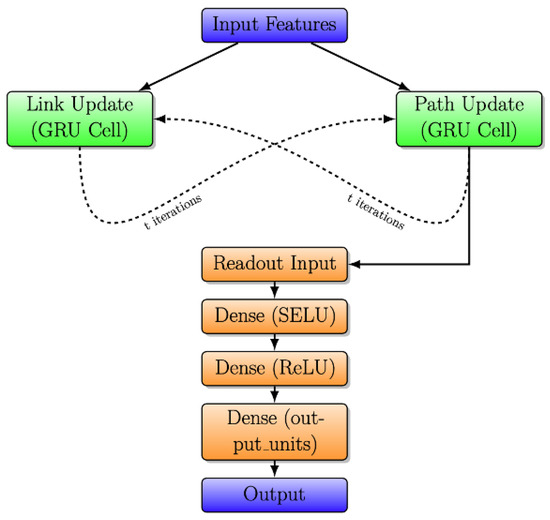
Figure 5.
Detailed RouteNet model architecture with iterative message passing.
In the initial phase, known as “Link and Path Update”, GRU cells are employed to iteratively update link and path states. In Link Update, the initial link state involves a vector where link capacity is concatenated with zeros, and a similar pattern is followed in Path Update with bandwidth concatenation. Each GRU cell, comprising 32 units, receives messages from respective paths or links, leading to state adjustments. The subsequent stage, “Message Passing”, unfolds in two steps. Firstly, from links to paths, link states are aggregated and summed for each path, and the path GRU cell updates the path state using this aggregated link state. In the second step, from paths to links, path states are gathered and summed for each link, and the link GRU cell updates the link state using the accumulated path state.
The final stage introduces the “Readout Neural Network”, responsible for processing path states post the message-passing process and predicting delays for each path. This network comprises three layers: an initial Dense layer with 8 units using the Scaled Exponential Linear Unit activation function, L2 regularization, and dropout, a subsequent Dense layer with 8 units using the Rectified Linear Unit activation function, L2 regularization, and dropout, and a final Dense layer with a single output unit and L2 regularization.
Finally, RouteNet underscores its effectiveness in predicting network delays through the interplay of message-passing mechanisms and subsequent neural network processing.
3.2. RouteNet Model with Attention
The RouteNet model with the integration of the Graph Attention Mechanism is depicted in the block diagram shown in Figure 6. This enhanced architecture combines the power of the original RouteNet model with the Graph Attention Mechanism to improve its predictive capabilities.
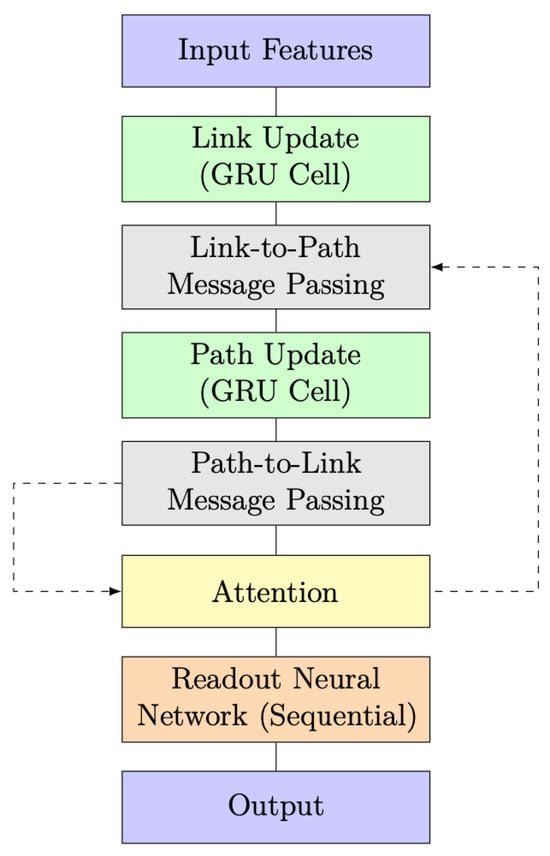
Figure 6.
RouteNet model architecture with attention and message passing.
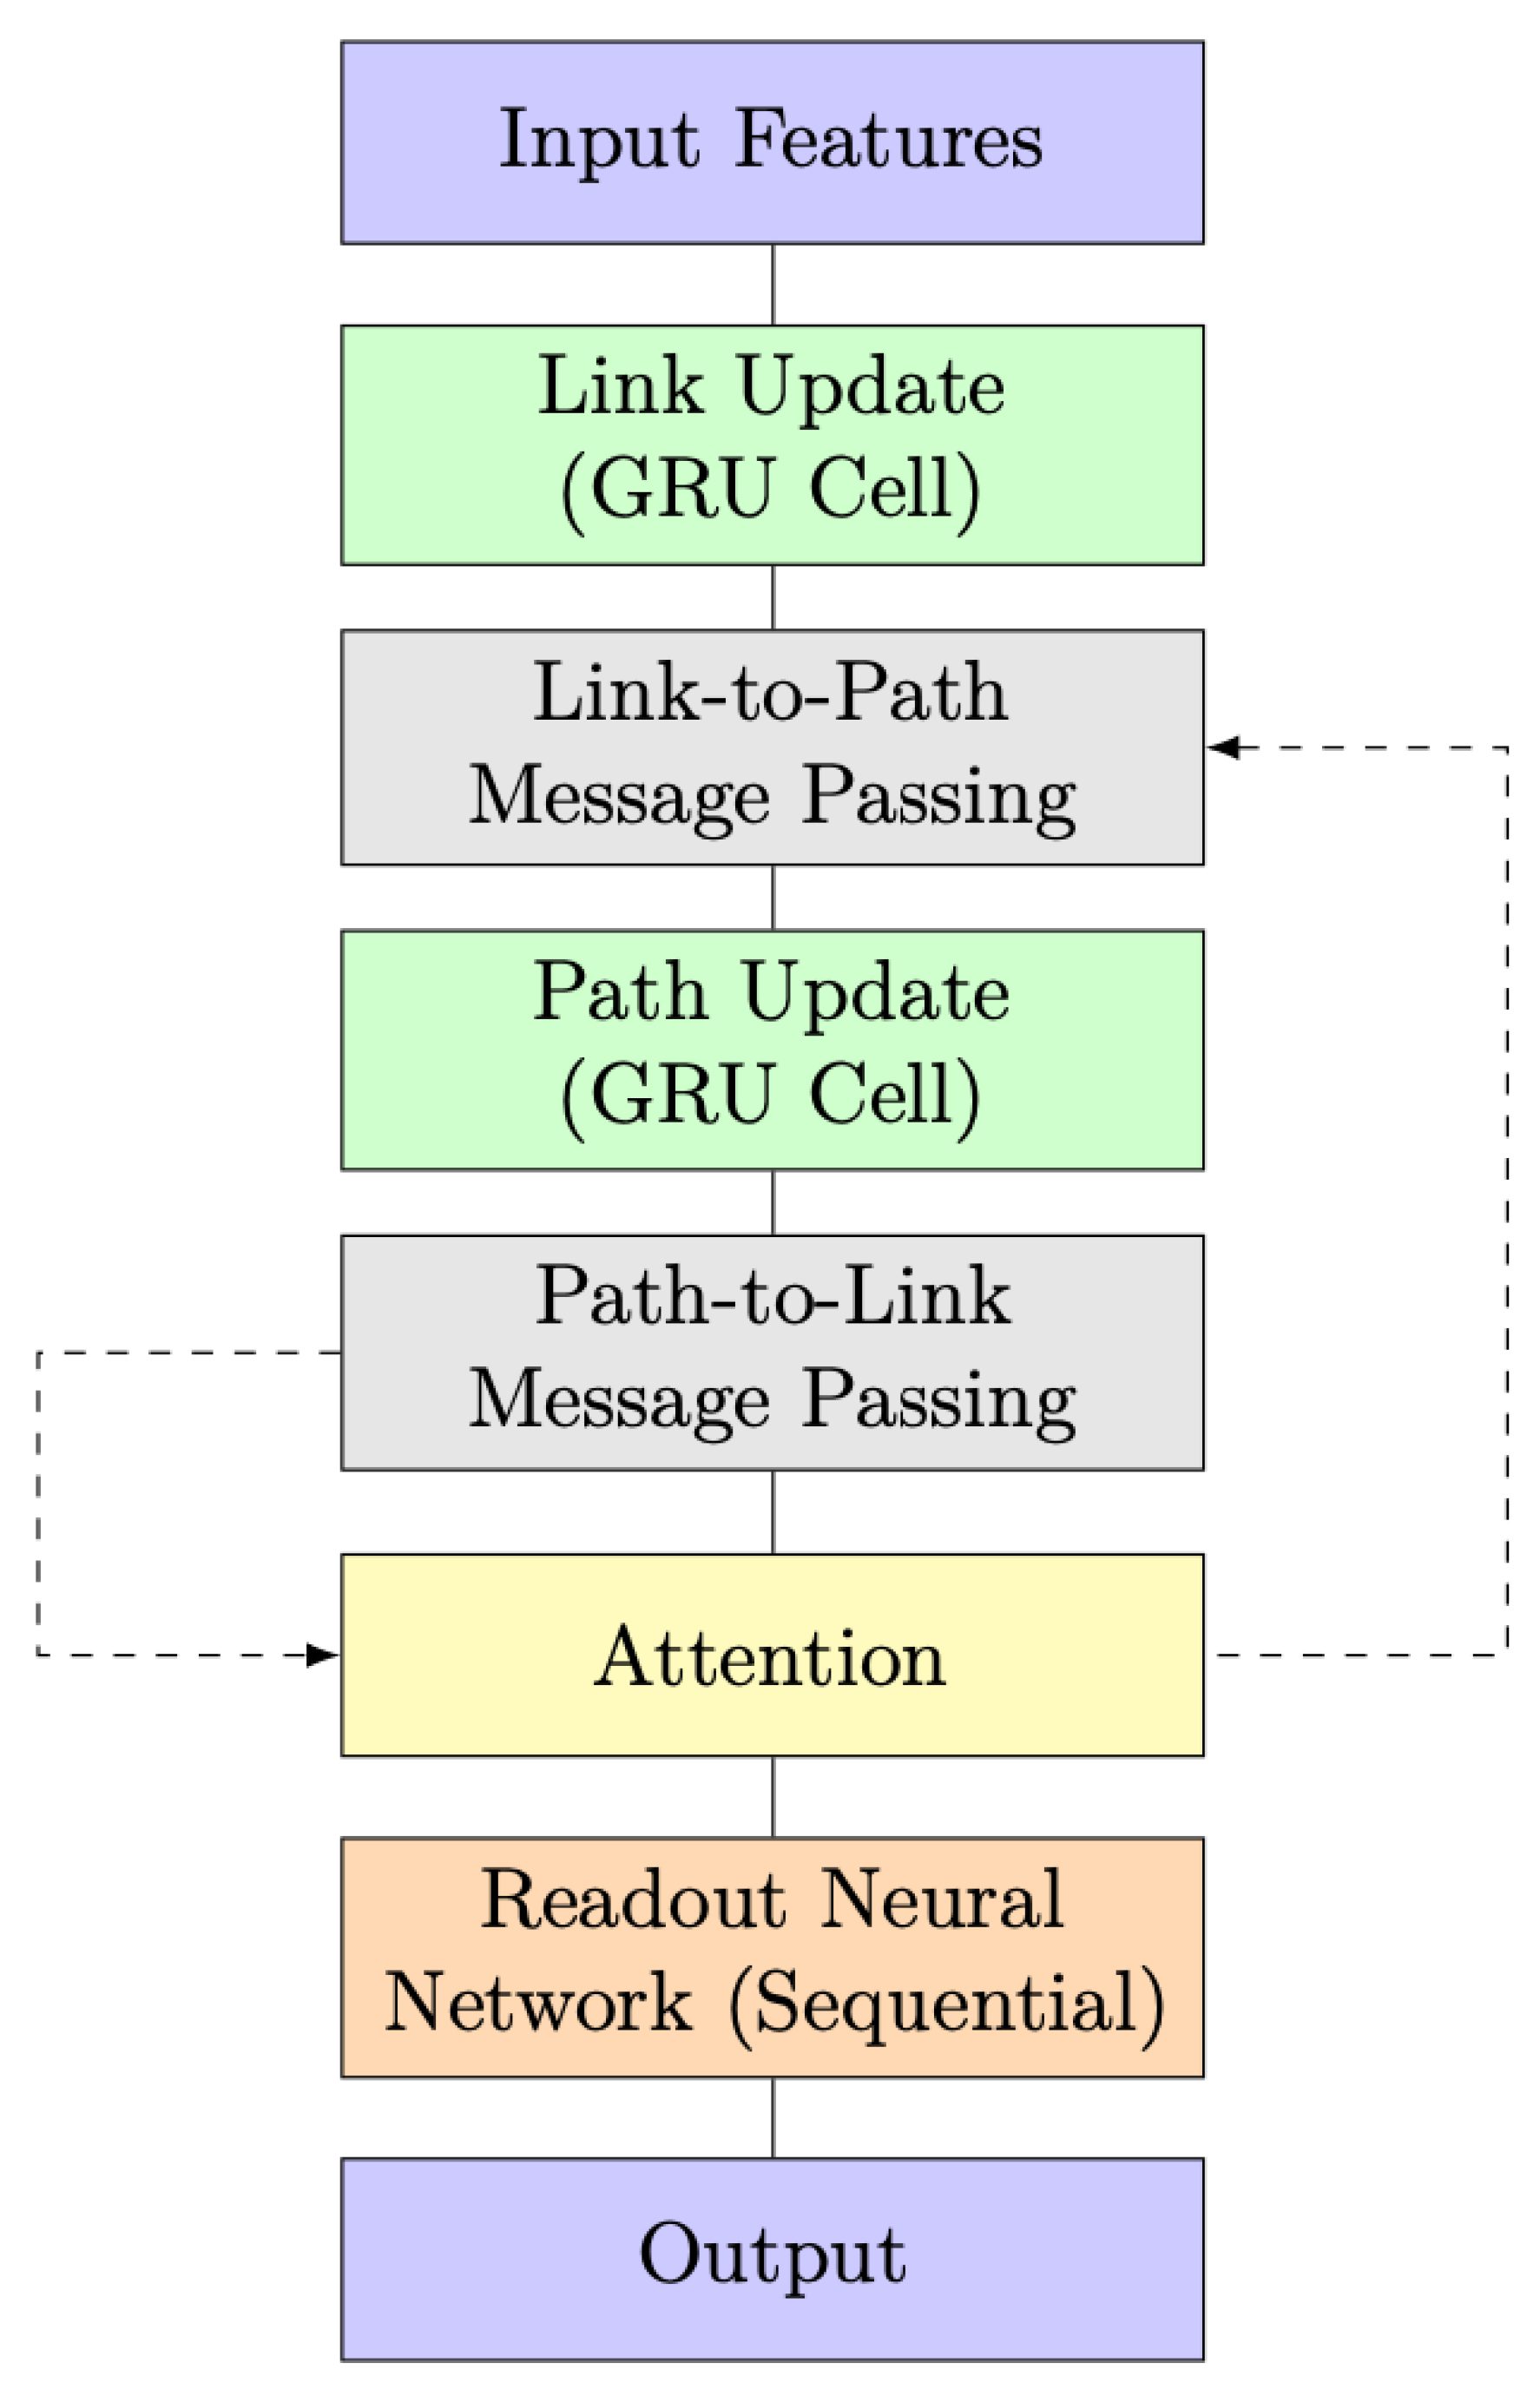
A significant improvement in this model architecture is the incorporation of an attention layer, represented by the yellow-highlighted block in Figure 6 and Figure 7. The attention layer introduces a dynamic and adaptive weighting system to the exchange of information between link and path updates. In simpler terms, it allows the model to assign varying degrees of importance to different aspects of the information being exchanged. This dynamic weighting mechanism represents a more sophisticated and flexible approach, enabling the model to better process and prioritize data based on their relevance, which, in turn, contributes to an overall improvement in the model’s capabilities.
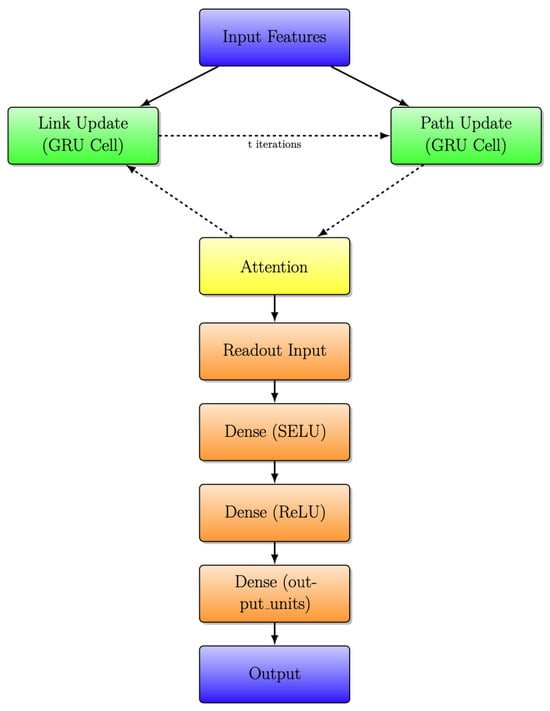
Figure 7.
RouteNet architecture with iterative message passing with attention layer.
3.3. Detailed Internal Architecture of RouteNet with Attention
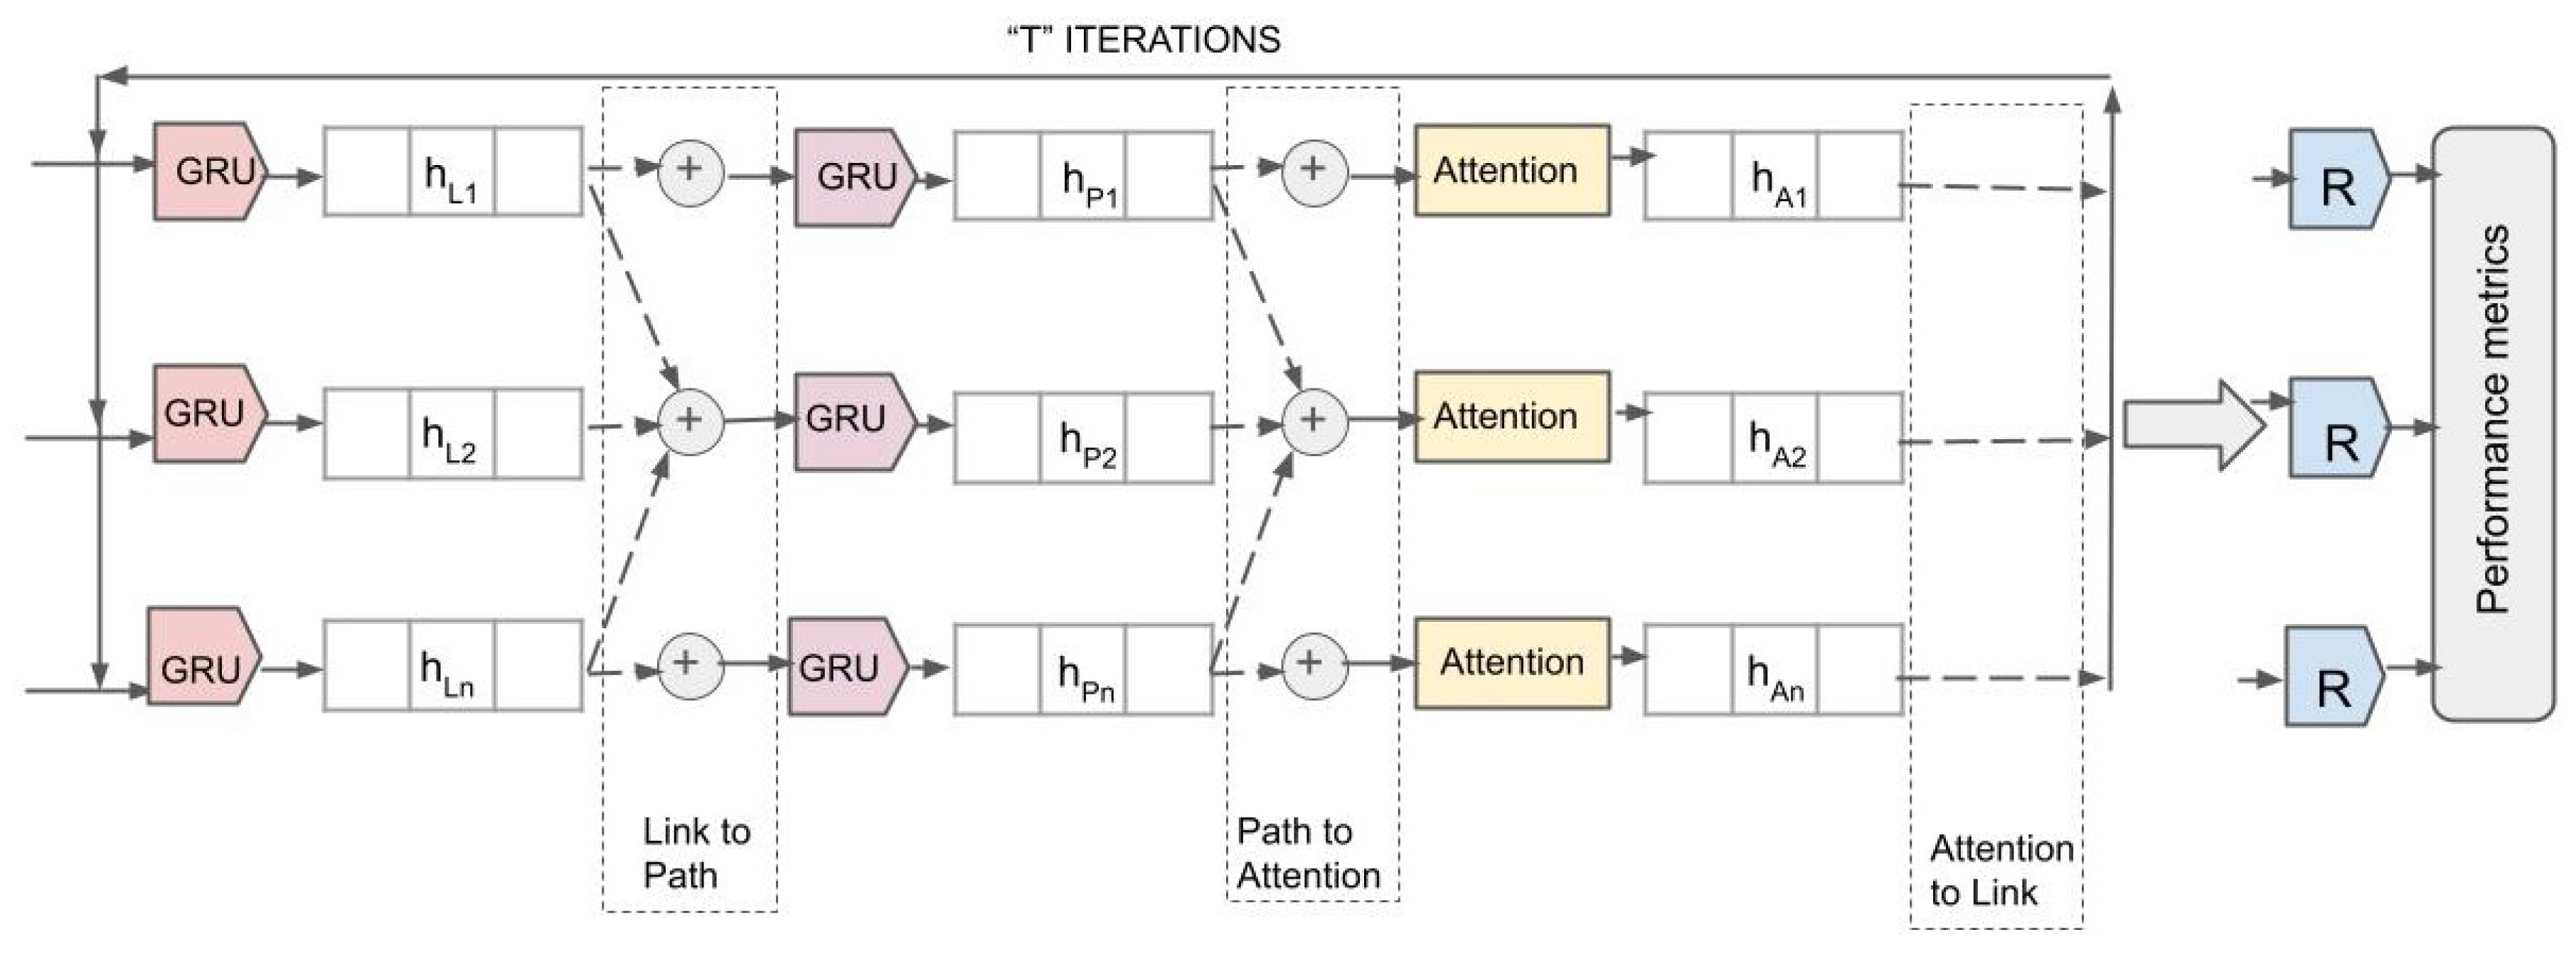
Figure 8 illustrates the detailed internal architecture of the RouteNet model with an attention mechanism integrated into it. The architecture processes network data through multiple iterations, each aimed at refining the state information of network elements for accurate performance metric prediction.
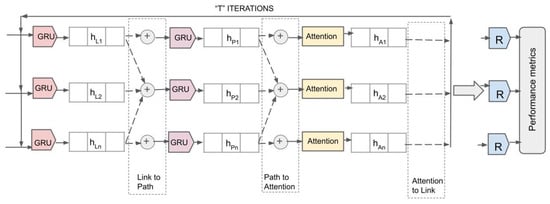
Figure 8.
Detailed internal architecture diagram of RouteNet with attention.
The flow steps are presented in the sections below:
i. GRU Layers for Link and Path Updates: The model initiates with GRU layers, which take initial link states () and path states () as inputs. These states are processed through GRU layers, aiming to capture temporal dependencies and refine their representations.
ii. Attention Mechanism: After the initial updates, the attention layers receive the path states () and dynamically calculate attention weights. This process allows the model to focus on the most informative features within the path states by assigning higher weights to more significant inputs. The output of the attention layers are attention-refined path states ().
iii. Iterative Processing and Message Passing: During “T" iterations, the model continually updates the link and path states. The attention mechanism plays a crucial role here by recalibrating the path states during each iteration based on the evolving context of the network’s state, ensuring that crucial information is emphasized for future updates.
iv. Performance Metrics Readout: Finally, the outputs from the last iteration of attention layers () are fed into the readout layers, marked as ‘R’ in Figure 8. The readout layers are designed as a series of densely connected neural networks configured to map the attention-enhanced states to specific performance metrics.
Algorithm 1 begins by initializing the attention weights for each path and link at time step 0. These attention weights, denoted as for paths and for links, are set to small positive values and will be updated during the message-passing process. Next, the algorithm initializes the hidden states of paths and links at time step 0. Each path’s initial hidden state, denoted as , is formed by concatenating the corresponding path feature with zeros for the remaining dimensions. Similarly, each link’s initial hidden state, denoted as , is formed by concatenating the corresponding link feature with zeros for the remaining dimensions.
The algorithm then enters a loop from time step 0 to T-1 to perform message passing between paths and links. Here, T denotes the iterations for message-passing steps, and within each iteration , hidden states and are updated. These iterations converge to a fixed point from initial states and . The value of T should be chosen in such a way that it balances capturing crucial information during the message-passing iteration with computational efficiency. The hidden state of the path is updated using the GRU function , which takes the current hidden state and the hidden state of the link and produces a new hidden state for the path. Additionally, the updated hidden state is stored as the message from path p to link l.
In addition to updating the hidden states, the algorithm computes the attention weights for each path-to-link message and link-to-path message. This is carried out by applying an attention mechanism to the concatenation of the hidden states and . The attention mechanism calculates an attention weight that represents the importance of the interaction between path p and link l at time step . The attention weights are then normalized across all paths or links using the softmax function, resulting in the final attention weights . These attention weights indicate the relative importance of neighboring paths or links in the aggregation process.
Next, the algorithm modifies the message-passing step to include the attention weights in the aggregation process. Each path-to-link message is multiplied by its corresponding attention weight to obtain a weighted message . This means that more important messages will contribute more to the aggregation step. Afterward, the hidden states of links are updated by aggregating the weighted messages from paths that include them. The weighted messages for each link l are summed together to obtain an updated hidden state at time step t+1. The loop continues with the updated hidden states of paths and links, and this process repeats until the final time step T-1 is reached.
| Algorithm 1: Internal Architecture of RouteNet Model with Attention |
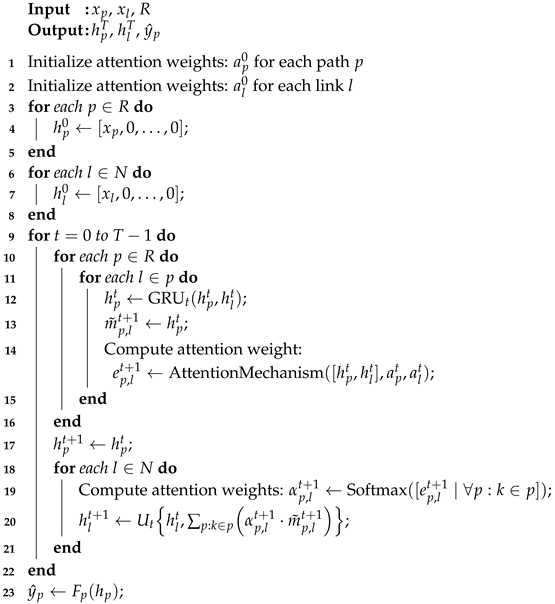 |
Finally, after completing the message-passing loop, the algorithm uses the readout function to predict path-level features based on the final hidden states of paths . The readout function is an ordinary fully connected neural network with appropriate activation functions.
3.4. Modified RouteNet with Stacked RNN and Sequential Link Update
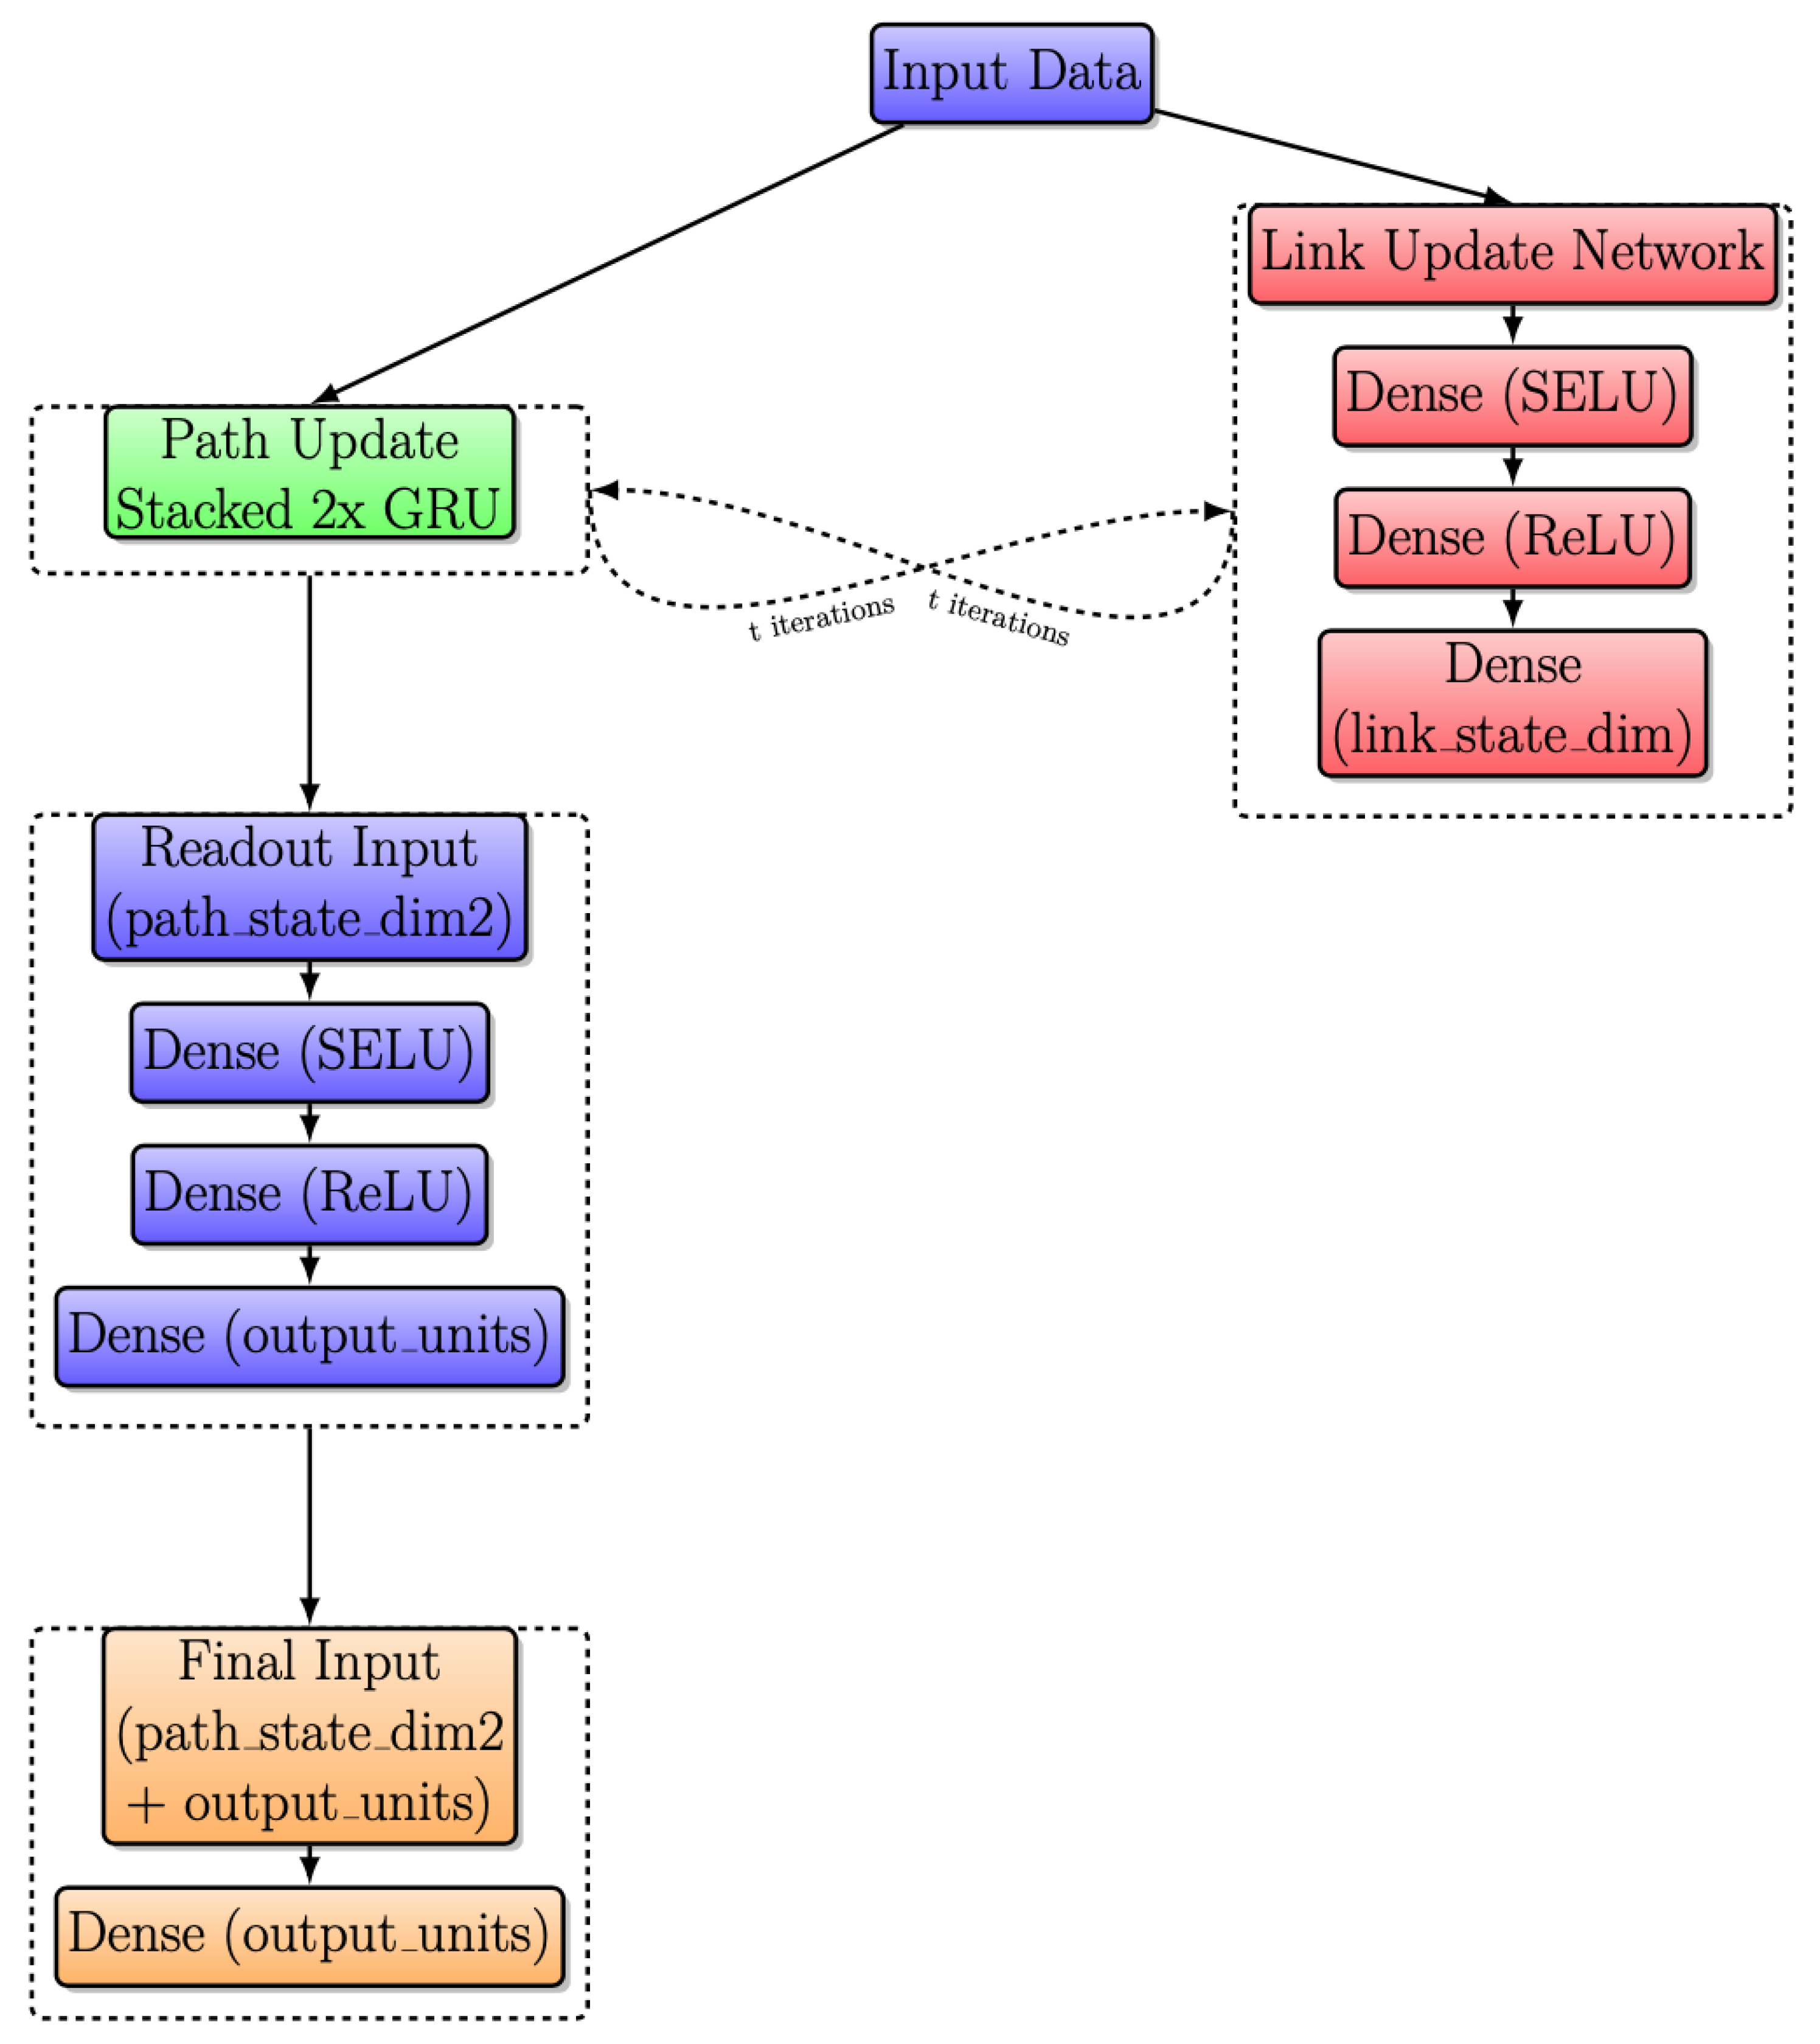
Figure 9 shows the improved RouteNet architecture, which has undergone key enhancements to boost its ability to predict network performance. This architecture, implemented by Salzburg Research, achieved second position in the Graph Neural Networking Challenge 2020, as discussed in [26]. The path update replaces the one GRU with a stacked GRU cell, providing a deeper understanding of paths. Additionally, the link update process has been enhanced with the inclusion of three dense layers and a GRU cell, enabling RouteNet to capture network dynamics more effectively for improved delay predictions.

Figure 9.
Modified RouteNet internal architecture with iterative message passing.
The message-passing process involves the gathering and summing of sequences of hidden states of the paths that contain a link, and updating the link state using the link update network. The path update process replaces a single GRU cell with a stack of two GRU cells, both with 64 units, and is used to update the path state during the message-passing process. These GRU cells receive a message from the links and update the path state accordingly. The link update process consists of three dense layers followed by a GRU cell. A dense layer with 128 units, using the SELU activation function, and L2 regularization with a weight of 0.1, dropout with a weight of 0.1, a second dense layer with 128 units, using the ReLU activation function, and L2 regularization with a weight of 0.1, dropout with a weight of 0.1, and a final dense layer with 64 units and L2 regularization with a weight of 0.1.
The readout network processes the path states after the message-passing process and predicts the delay for each path. It consists of three layers: A dense layer with 64 units, using the SELU activation function, and L2 regularization with a weight of 0.1, a dense layer with 64 units, using the ReLU activation function, and L2 regularization with a weight of 0.1, and a dense layer with a single output unit and L2 regularization with a weight of 0.1. The input to the readout network is the concatenation of two path states, and the output of the readout network is fed into a final dense layer with a single output unit.
3.5. Modified RouteNet Model with Attention
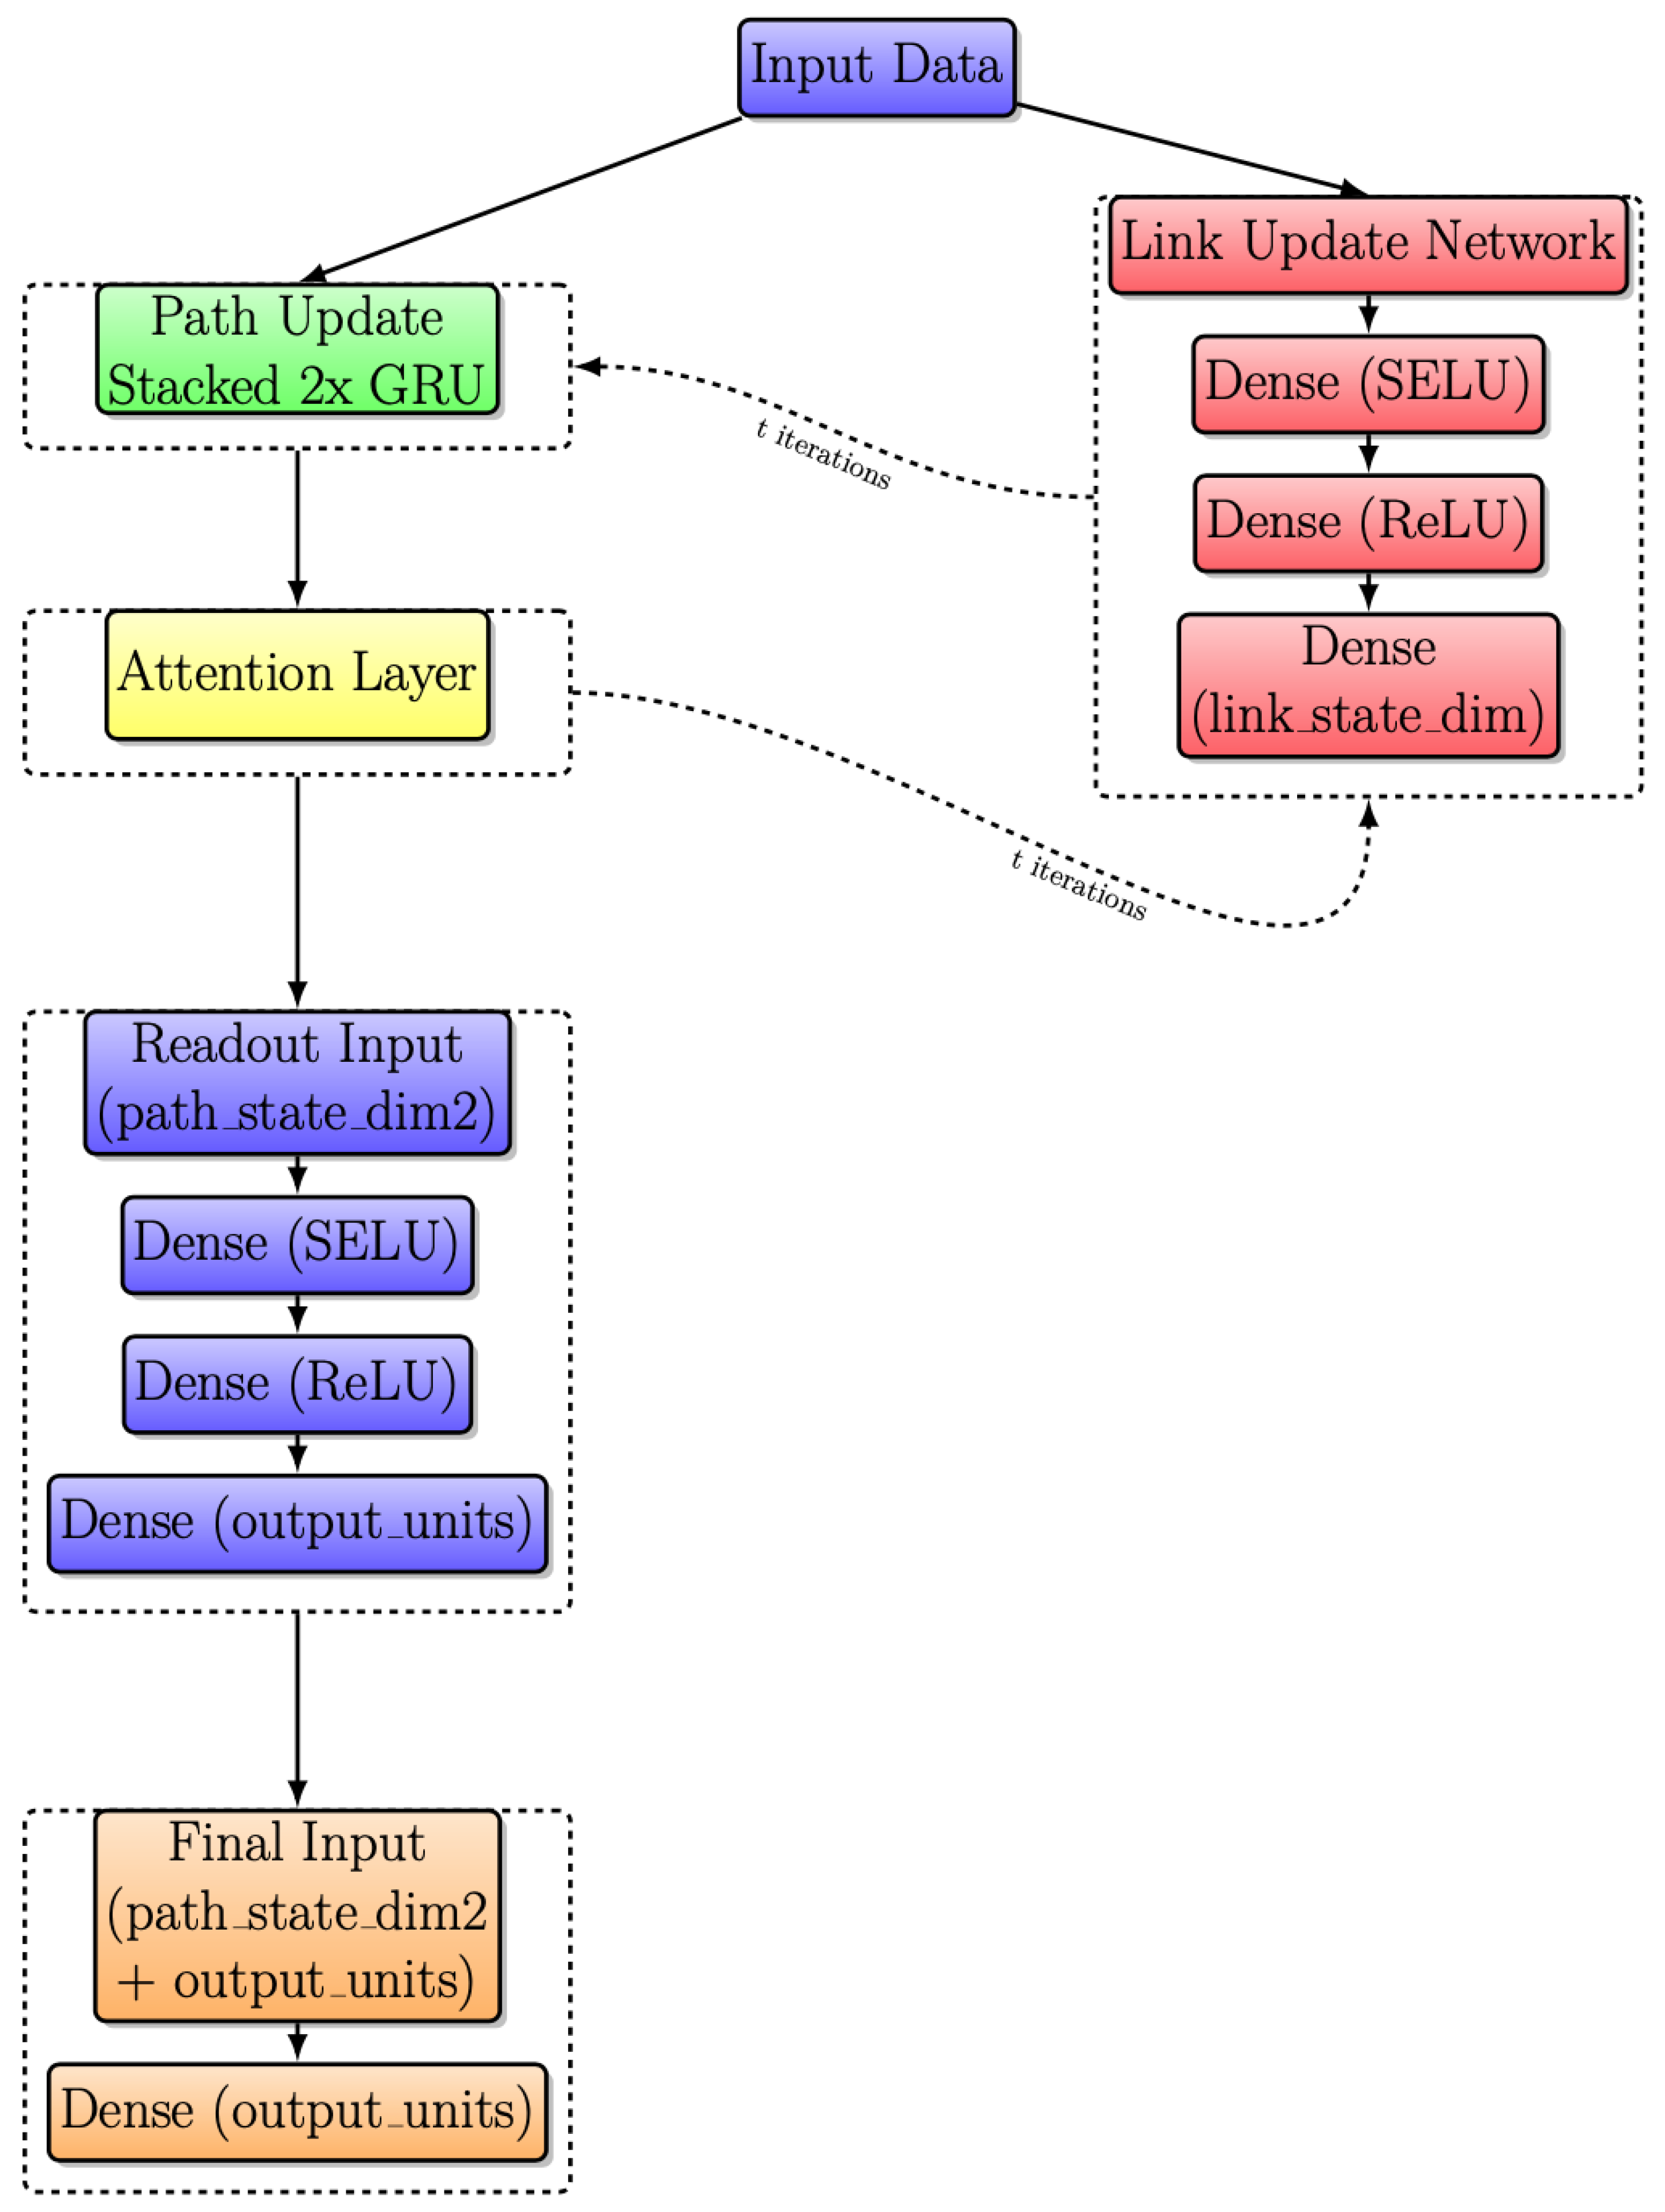
Another significant improvement is applied to Figure 9. Following the integration of an attention layer, as highlighted in the yellow box, the resulting model is depicted in Figure 10. This layer introduces a dynamic weighting system, facilitating adaptive information exchange between Link and Path updates.
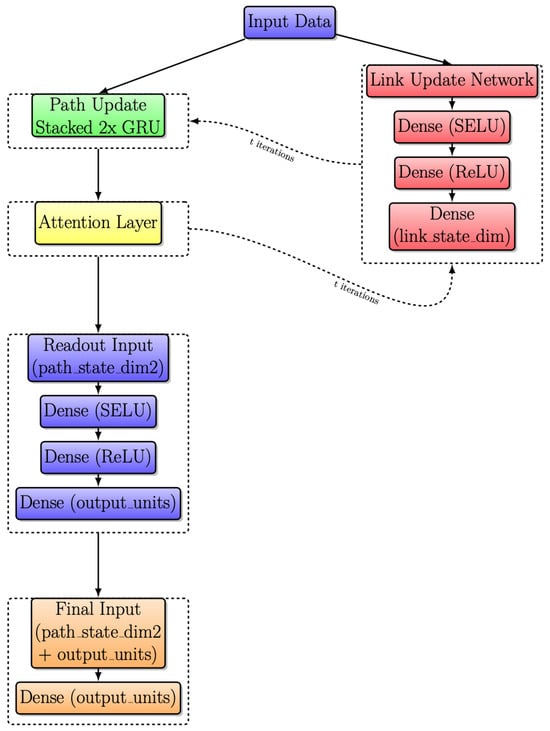
Figure 10.
Modified RouteNet internal architecture with iterative message passing with attention layer.
4. Results and Discussion
In this section, we thoroughly analyze the results achieved through the step-by-step implementation and improvement of the RouteNet model. We explored various architectural setups, starting from the basic model and testing modified versions. After conducting several training sessions, we determined that setting the training iteration value to 1,000,000 resulted in convergence with the baseline models. Therefore, taking this iteration step as a reference, other models were also trained using the same training duration. We used metrics such as R-squared values and Mean Absolute Percentage Error (MAPE) to measure how accurately the model predicts. The following section presents an analysis of the performance of various models before and after integrating attention mechanisms, along with a comparative analysis of their performance.
Results Analysis
The R² and MAPE values’ comparison of four different RouteNet model configurations are shown in Table 1. The Mean Absolute Percentage Error (MAPE) metric provides insight into the precision of a model’s predictions by quantifying the average percentage difference between the predicted values and the actual values. The R² value, which can vary from 0 to 1, measures how well the independent variables explain the variance in the dependent variable. A value close to 1 suggests the model predictions are very close to the actual data.

Table 1.
Comparison of R² and MAPE values for different models.
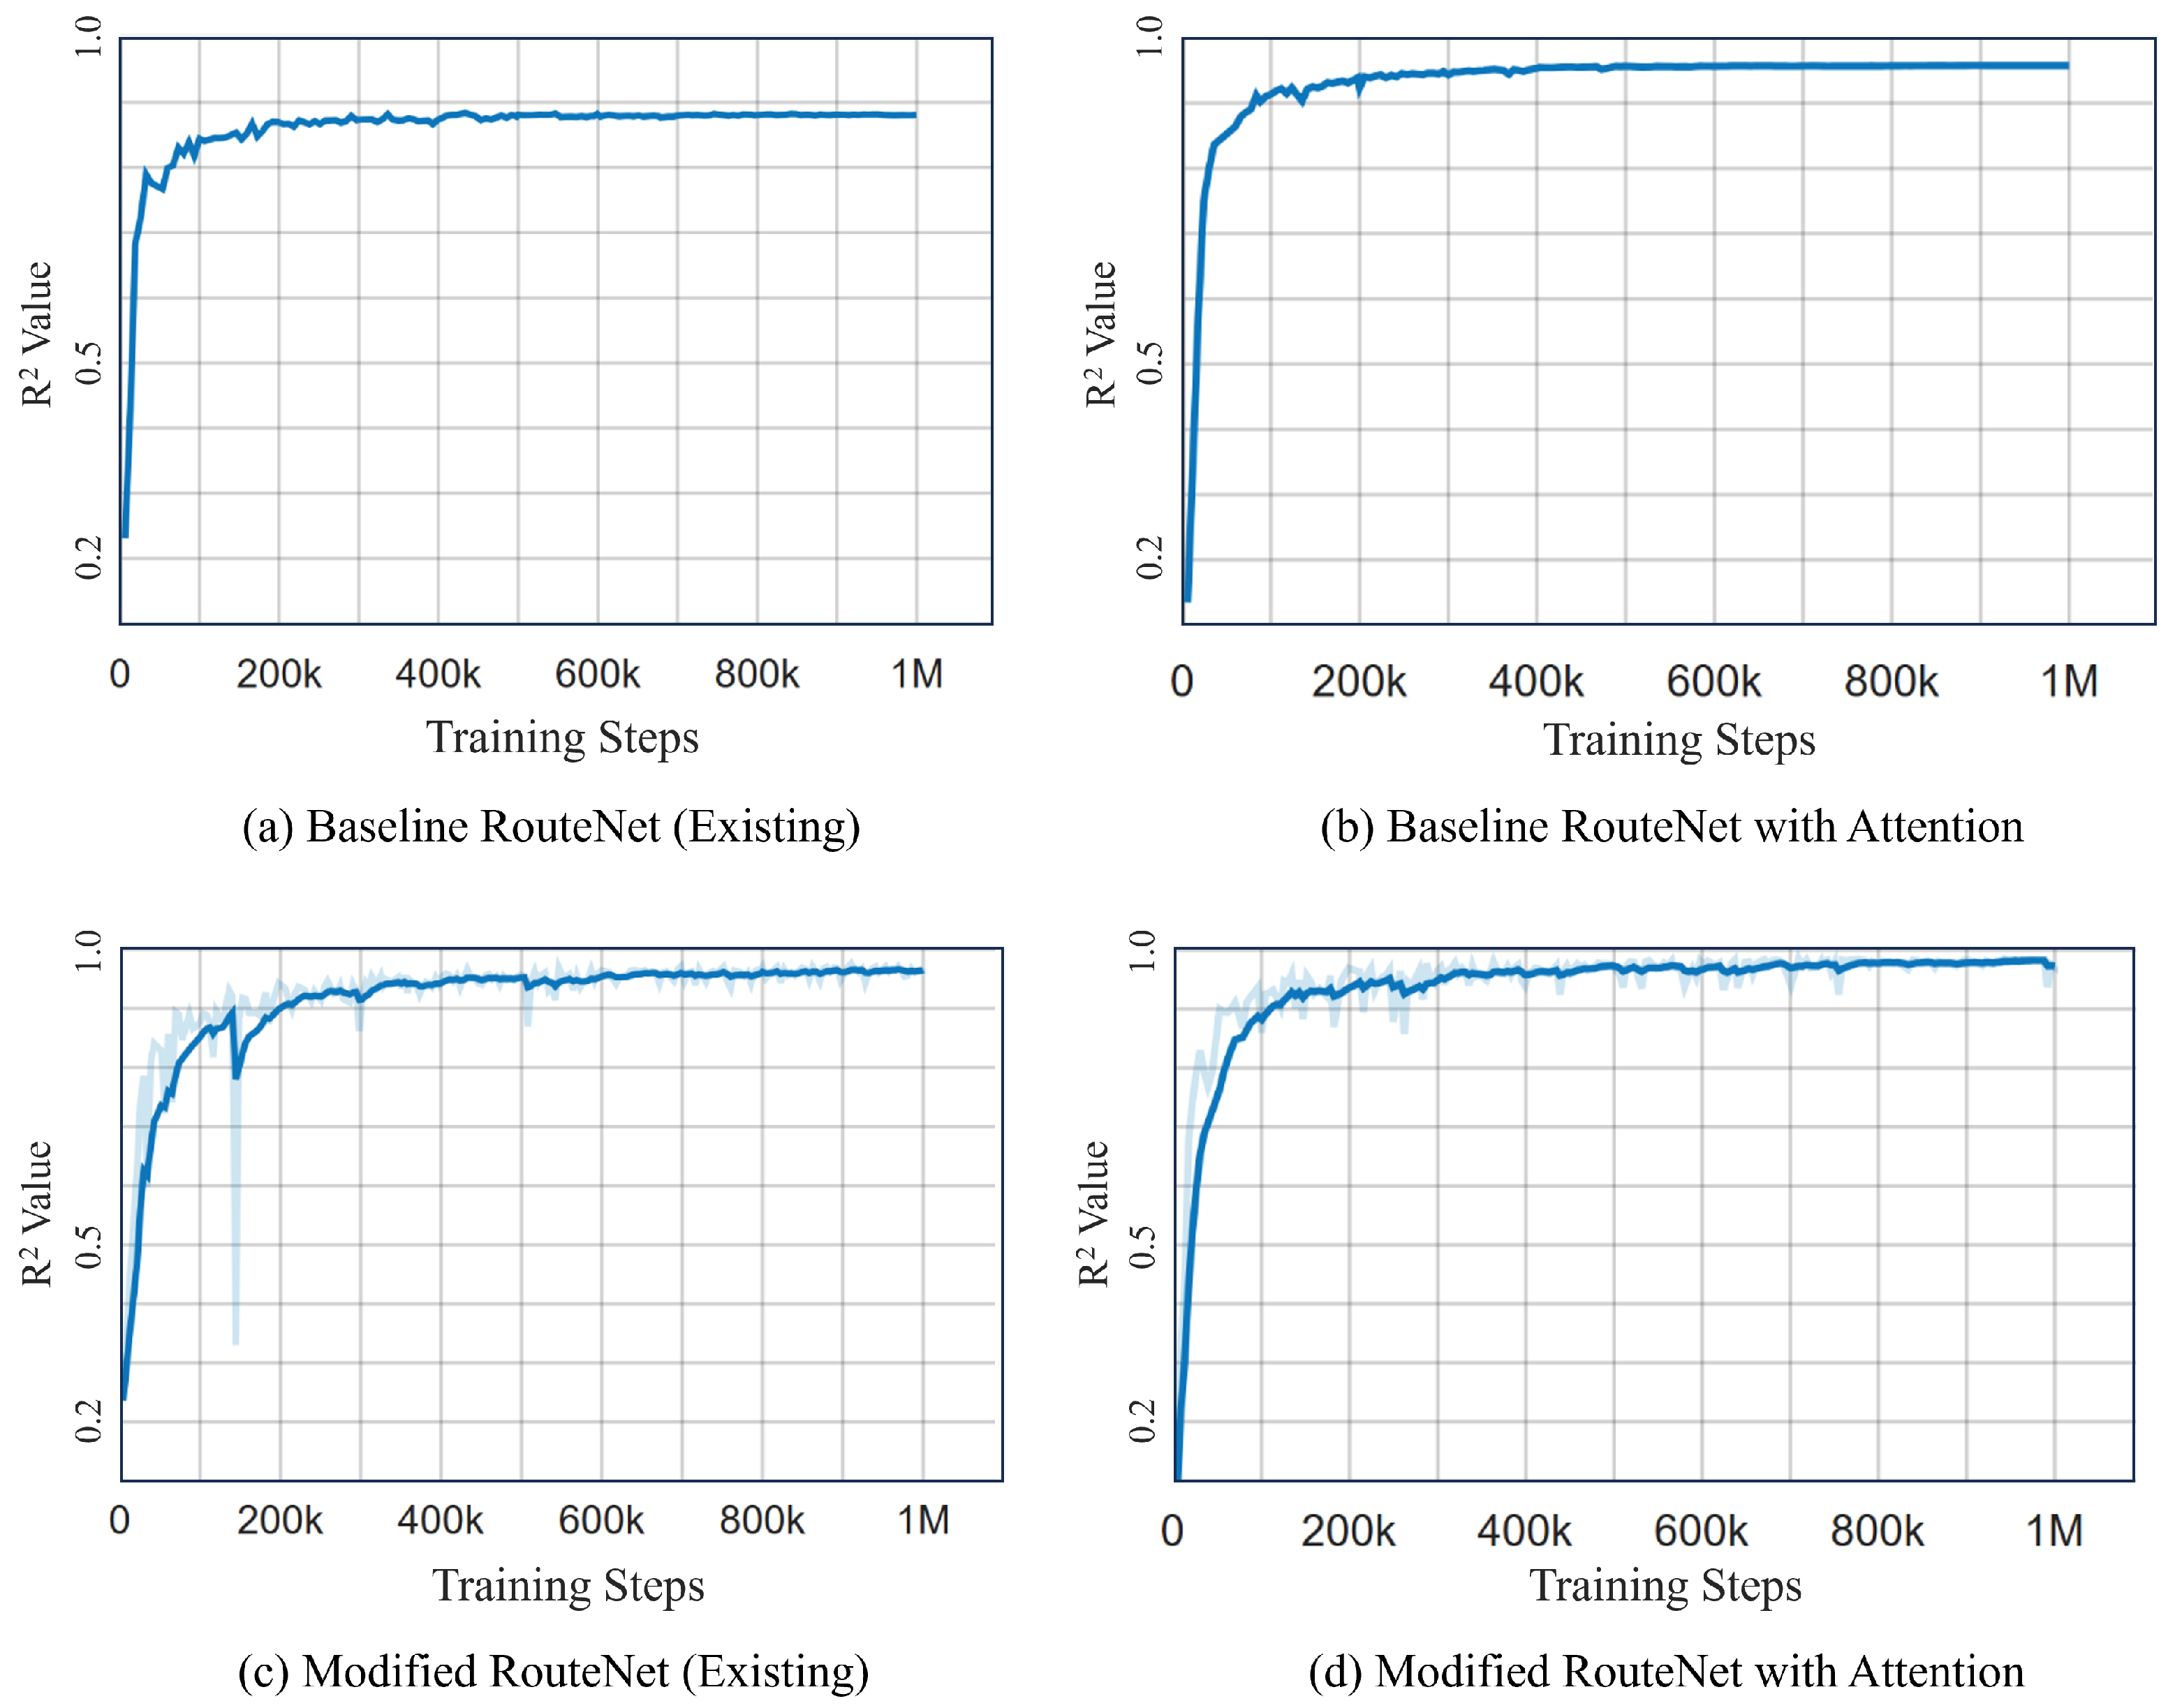
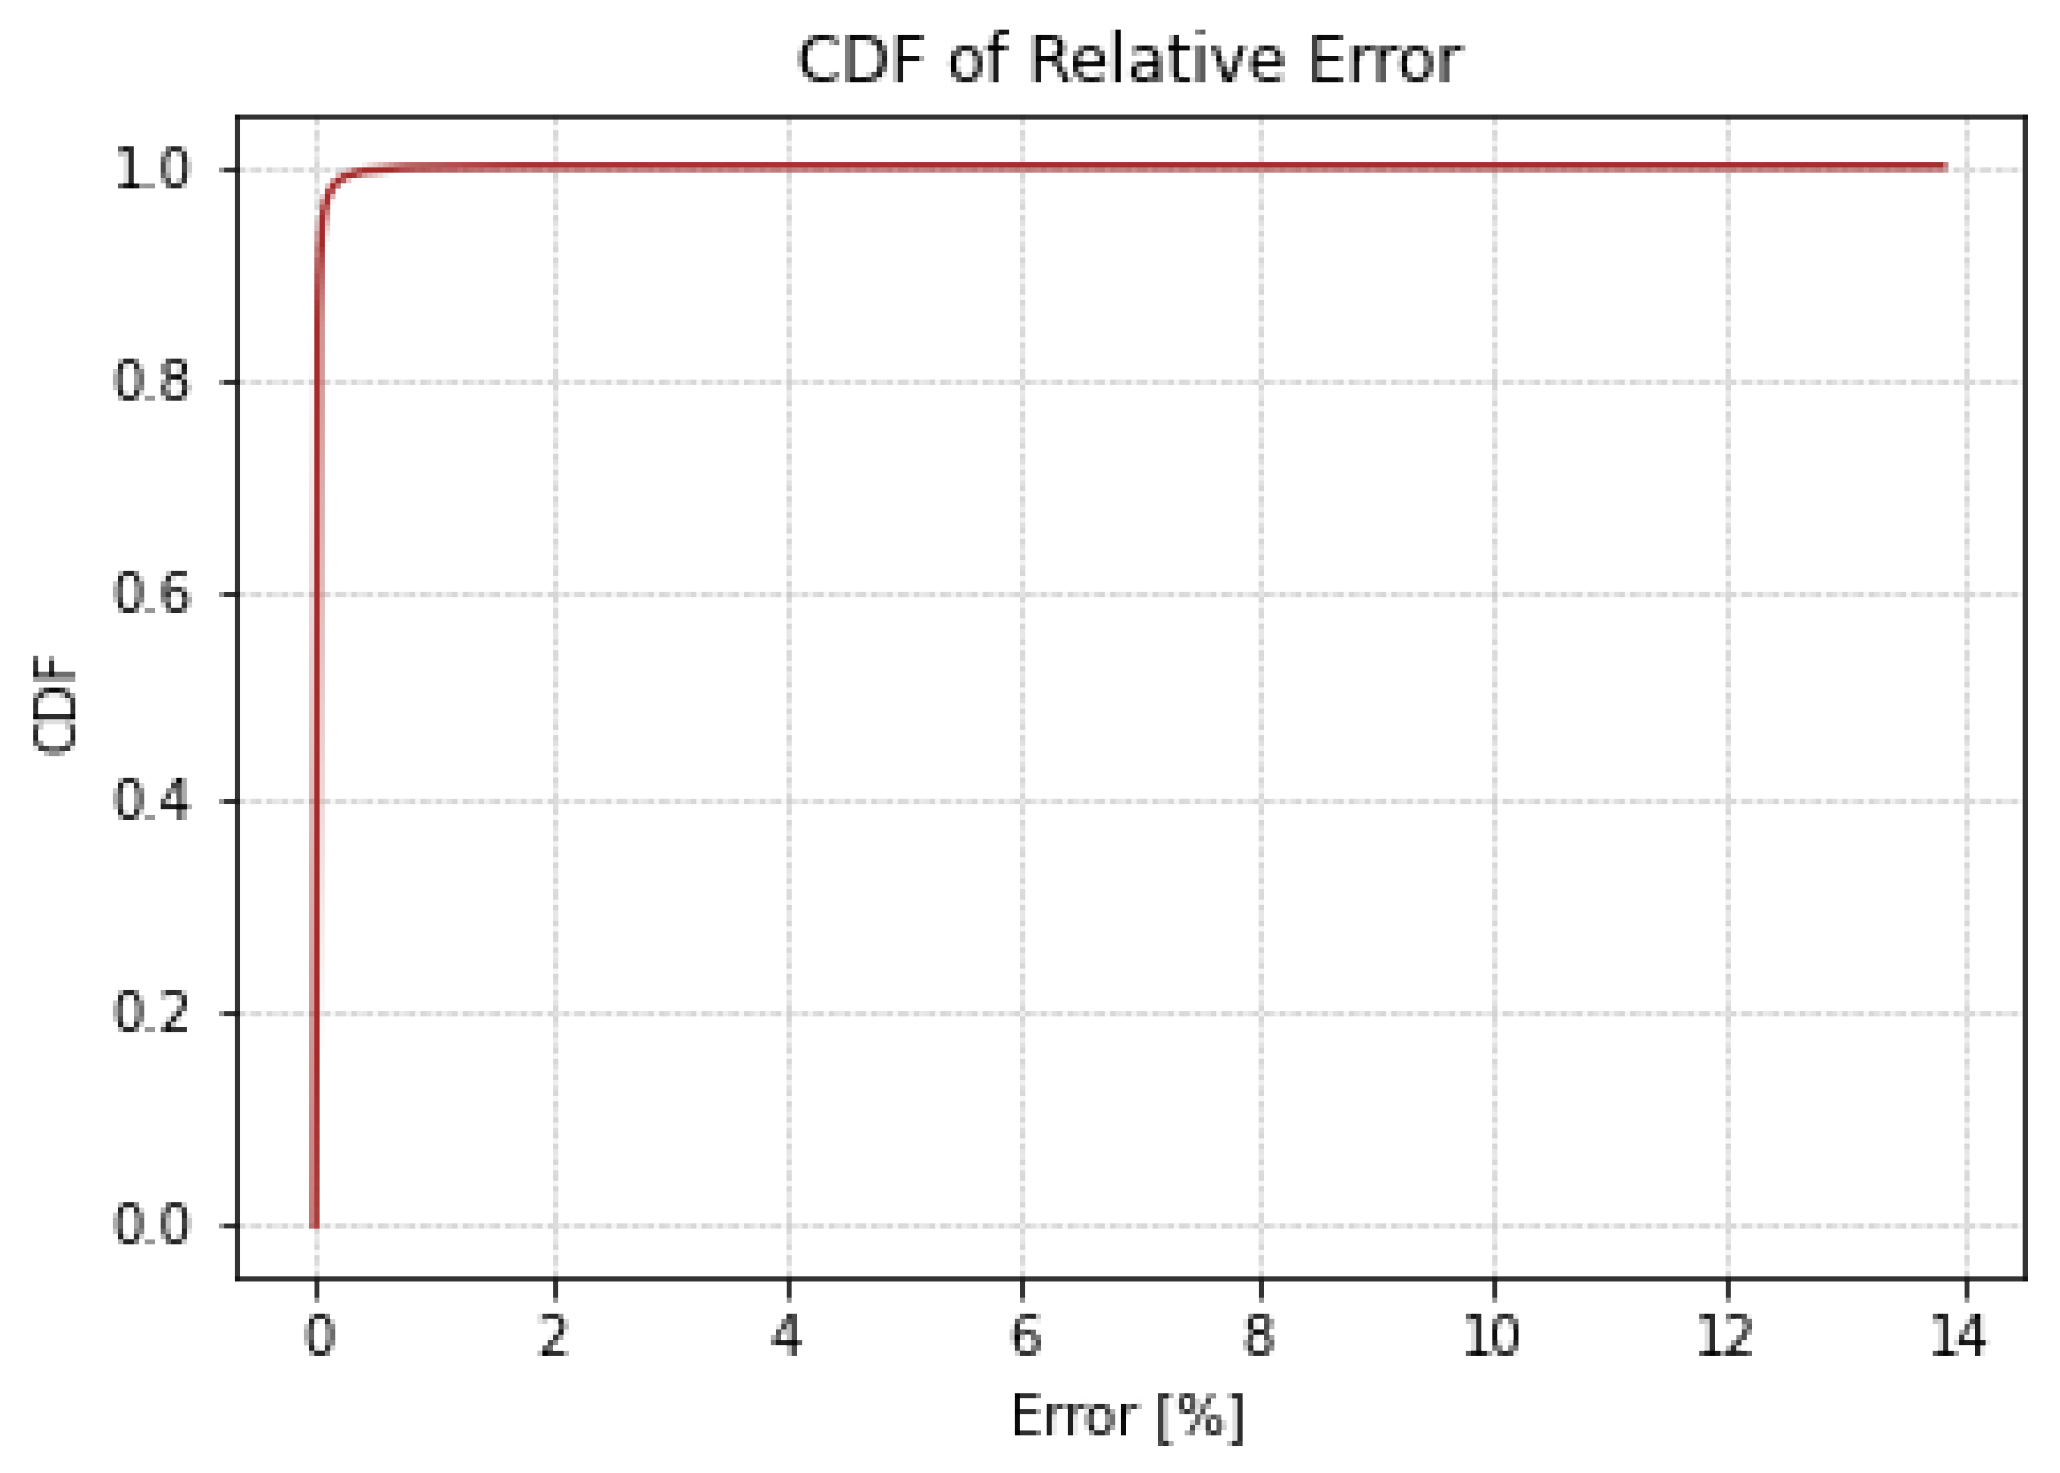
Figure 11 illustrates a side-by-side comparative analysis of the R² values for four different RouteNet model configurations. Figure 11a,c are the existing RouteNet models, while Figure 11b,d are the models where attention is added to the existing one. The existing baseline RouteNet model, shown in Figure 11a, yields an R² value of approximately 0.8807 and a MAPE of 13%, indicating a satisfactory predictive accuracy but also highlighting room for refinement due to the prediction deviation. Introducing an attention mechanism to this baseline model, as shown in Figure 11b, not only increased the R² value to 0.9574 but also markedly improved the MAPE to 2.4876%. Another existing model, the Modified RouteNet model presented in Figure 11c, incorporates advanced structural enhancements, leading to an R² value of 0.9695 and a MAPE of 4.9476%. This indicates that the model significantly outperforms the original baseline in capturing and predicting the network delays. The integration of the attention mechanism into the Modified RouteNet model, shown in Figure 11d, yields the highest R² value of 0.9834 and the lowest MAPE of 2.24887%, marking this configuration as the most effective and precise among the evaluated models. The Cumulative Distribution Function of the relative error of this model is shown in Figure 12, which represents the relative error between the actual and predicted values. Given the extensive size of the test dataset, which includes 17,100,000 samples, the majority of these samples exhibit errors close to zero, resulting in the CDF curve showing a steep ascent near this value. The curve’s steep rise at lower error values indicates that the majority of predictions are accurate, with the plateau near the value of 1.
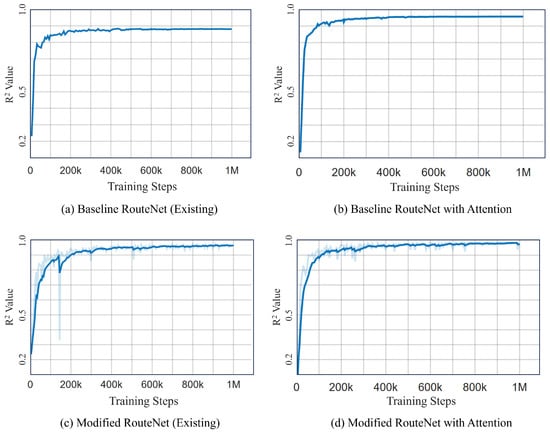
Figure 11.
Comparison of R² Plots of different models. (a) Baseline RouteNet (existing). (b) Baseline RouteNet with attention. (c) Modified RouteNet (existing). (d) Modified RouteNet with attention.
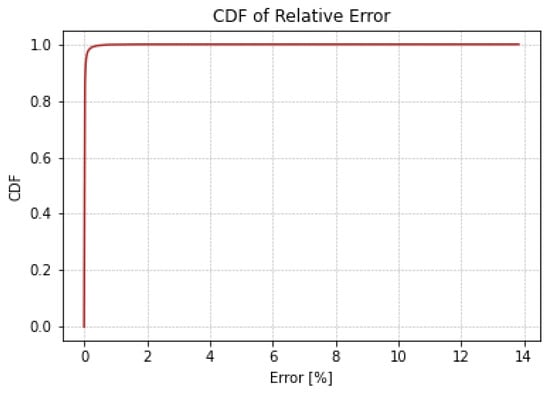
Figure 12.
Cumulative Distribution Function of relative error.
From the results, it is evident that the incorporation of attention mechanisms in RouteNet models leads to improvements in their ability to predict network delays, as demonstrated by their increased performance.
5. Conclusions and Future Work
Through this study, we effectively utilized a GNN for end-to-end network performance prediction, focusing specifically on delay. We evaluated four distinct models to identify the most efficient one. This included the original RouteNet model and its enhanced versions, notably models with an added attention layer. Our comparative study of the original RouteNet and its modified forms provided insightful findings regarding the impact of our enhancements. Among these, the Modified RouteNet model enhanced with an attention layer showed superior performance in terms of predictive accuracy, as indicated by higher R-squared values and lower loss metrics, indicating a stronger fit and better generalization abilities. These results highlight the potential of incorporating attention mechanisms in graph-based neural network models to improve their precision in predicting complex networked systems.
The Modified RouteNet model with attention has shown enhanced predictive accuracy, but its complex nature leads to increased convergence times. Future research should concentrate on refining the model’s architecture and training methods to lower computational demands while maintaining accuracy. Investigating more efficient training algorithms might help strike a balance between the model’s complexity and computational efficiency.
Author Contributions
Conceptualization, B.R.D., B.K.D. and P.M.; methodology, B.K.D. and B.K.A.; software, B.K.D.; validation, B.R.D., P.M. and B.K.A.; formal analysis, B.K.D.; investigation, B.R.D. and P.M.; resources, B.R.D. and P.M.; data curation, B.K.D.; writing—original draft preparation, B.K.D.; writing—review and editing, B.R.D., P.M. and B.K.A.; visualization, B.K.D.; supervision, B.R.D. and P.M.; project administration, B.R.D.; funding acquisition, B.R.D. All authors have read and agreed to the published version of the manuscript.
Funding
This research was supported by the University Grants Commission, Nepal, under research grant ID: CRG-078/79/Engg-01 (Context Issues and Solutions towards 5G Network Migration of Nepal - CISNetMiN) principally investigated by Dr. Babu R. Dawadi.
Data Availability Statement
No new data were created or analyzed in this study. Data sharing is not applicable to this article.
Acknowledgments
The language correction AI tools Grammarly and Quillbot were used for this manuscript to ensure that the sentences were grammatically correct and to improve English sentence structure for clarity. After using these tools, the authors reviewed and edited the content as needed and take full responsibility for the content of the publication. We are thankful to reviewers for their constructive comments.
Conflicts of Interest
The authors declare no conflicts of interest.
References
- Ferriol-Galmés, M.; Suárez-Varela, J.; Rusek, K.; Barlet-Ros, P.; Cabellos-Aparicio, A. Scaling graph-based deep learning models to larger networks. arXiv 2021, arXiv:2110.01261. [Google Scholar]
- Suárez-Varela, J.; Carol-Bosch, S.; Rusek, K.; Almasan, P.; Arias, M.; Barlet-Ros, P.; Cabellos-Aparicio, A. Challenging the generalization capabilities of graph neural networks for network modeling. In Proceedings of the ACM SIGCOMM 2019 Conference Posters and Demos, Beijing, China, 19–23 August 2019; pp. 114–115. [Google Scholar]
- Ge, Z.; Hou, J.; Nayak, A. GNN-based End-to-end Delay Prediction in Software Defined Networking. In Proceedings of the 2022 18th International Conference on Distributed Computing in Sensor Systems (DCOSS), Los Angeles, CA, USA, 30 May–1 June 2022; pp. 372–378. [Google Scholar]
- Karakus, M.; Durresi, A. Quality of Service (QoS) in Software Defined Networking (SDN): A survey. J. Netw. Comput. Appl. 2017, 80, 200–218. [Google Scholar] [CrossRef]
- Rusek, K.; Suárez-Varela, J.; Mestres, A.; Barlet-Ros, P.; Cabellos-Aparicio, A. Unveiling the potential of Graph Neural Networks for network modeling and optimization in SDN. In Proceedings of the 2019 ACM Symposium on SDN Research, San Jose, CA, USA, 3–4 April 2019; pp. 140–151. [Google Scholar]
- Happ, M.; Du, J.L.; Herlich, M.; Maier, C.; Dorfinger, P.; Suárez-Varela, J. Exploring the Limitations of Current Graph Neural Networks for Network Modeling. In Proceedings of the 2022 IEEE/IFIP Network Operations and Management Symposium (NOMS), Budapest, Hungary, 25–29 April 2022; pp. 1–8. [Google Scholar]
- Farreras, M.; Soto, P.; Camelo, M.; Fàbrega, L.; Vilà, P. Improving Network Delay Predictions Using GNNs. J. Netw. Syst. Manag. 2023, 31, 65. [Google Scholar] [CrossRef]
- Sampera, A.B. Extending RouteNet to Model More Complex Networking Scenarios. Master’s Thesis, Universitat Politècnica de Catalunya, Barcelona, Spain, 2020. [Google Scholar]
- Knowledge Defined Networking. Demo RouteNet GitHub Repository. Available online: https://github.com/knowledgedefinednetworking/demo-routenet (accessed on 3 November 2023).
- Cho, K.; Merriënboer, B.V.; Gulcehre, C.; Bahdanau, D.; Bougares, F.; Schwenk, H.; Bengio, Y. Learning phrase representations using RNN encoder-decoder for statistical machine translation. arXiv 2014, arXiv:1406.1078. [Google Scholar]
- Veličković, P.; Cucurull, G.; Casanova, A.; Romero, A.; Lio, P.; Bengio, Y. Graph attention networks. arXiv 2017, arXiv:1710.10903. [Google Scholar]
- Mestres, A.; Alarcón, E.; Ji, Y.; Cabellos-Aparicio, A. Understanding the modeling of computer network delays using neural networks. In Proceedings of the 2018 Workshop on Big Data Analytics and Machine Learning for Data Communication Networks, Budapest, Hungary, 20 August 2018; pp. 46–52. [Google Scholar]
- Ferriol-Galmés, M.; Paillisse, J.; Suárez-Varela, J.; Rusek, K.; Xiao, S.; Shi, X.; Cheng, X.; Barlet-Ros, P.; Cabellos-Aparicio, A. RouteNet-Fermi: Network Modeling with Graph Neural Networks. arXiv 2023, arXiv:2212.12070. [Google Scholar] [CrossRef]
- Ferriol-Galmés, M.; Rusek, K.; Suárez-Varela, J.; Xiao, S.; Shi, X.; Cheng, X.; Wu, B.; Barlet-Ros, P.; Cabellos-Aparicio, A. Routenet-erlang: A graph neural network for network performance evaluation. In Proceedings of the IEEE INFOCOM 2022-IEEE Conference on Computer Communications, London, UK, 2–5 May 2022; pp. 2018–2027. [Google Scholar]
- Rusek, K.; Suárez-Varela, J.; Almasan, P.; Barlet-Ros, P.; Cabellos-Aparicio, A. RouteNet: Leveraging graph neural networks for network modeling and optimization in SDN. IEEE J. Sel. Areas Commun. 2020, 38, 2260–2270. [Google Scholar] [CrossRef]
- Badia-Sampera, A.; Suárez-Varela, J.; Almasan, P.; Rusek, K.; Barlet-Ros, P.; Cabellos-Aparicio, A. Towards more realistic network models based on graph neural networks. In Proceedings of the 15th International Conference on Emerging Networking Experiments and Technologies, Orlando, FL, USA, 9–12 December 2019; pp. 14–16. [Google Scholar]
- Afonso, B.K.D.; Berton, L. QTRouteNet: Improved GNN Generalization to Larger 5G Networks by Fine-Tuning Predictions from Queuing Theory. arXiv 2022, arXiv:2207.06336. [Google Scholar]
- Ren, X.; Zhang, W.; Bao, L.; Song, J.; Wang, S.; Cao, R.; Wang, X. DeepQSC: A GNN and attention mechanism-based framework for QoS-aware service composition. In Proceedings of the 2021 International Conference on Service Science (ICSS), Xi’an, China, 14–16 May 2021; pp. 76–83. [Google Scholar]
- Zheng, H.; Wang, Z.; Zheng, C.; Wang, Y.; Fan, X.; Cong, W.; Hu, M. A graph multi-attention network for predicting airport delays. In Transportation Research Part E: Logistics and Transportation Review; Elsevier: Amsterdam, The Netherlands, 2024; Volume 181, p. 103375. [Google Scholar]
- Tam, P.; Song, I.; Kang, S.; Ros, S.; Kim, S. Graph Neural Networks for Intelligent Modelling in Network Management and Orchestration: A Survey on Communications. Electronics 2022, 11, 3371. [Google Scholar] [CrossRef]
- Sun, C.; Li, C.; Lin, X.; Zheng, T.; Meng, F.; Rui, X.; Wang, Z. Attention-based graph neural networks: A survey. Artif. Intell. Rev. 2023, 56 (Suppl. S2), 2263–2310. [Google Scholar] [CrossRef]
- Liu, R.J.; Lu, R. Monitoring Network through SNMP-based System. Int. J. Intell. Eng. Syst. 2012, 5, 1–10. [Google Scholar] [CrossRef]
- Safrianti, E.; Sari, L.O.; Sari, N.A. Real-time network device monitoring system with simple network management protocol (SNMP) model. In Proceedings of the 2021 3rd International Conference on Research and Academic Community Services (ICRACOS), Surabaya, Indonesia, 9–10 October 2021; pp. 122–127. [Google Scholar]
- Knowledge Defined Networking. Available online: https://knowledgedefinednetworking.org/ (accessed on 10 November 2023).
- Graph Neural Networking Challenge. Available online: https://bnn.upc.edu/challenge/gnnet2020/ch20-dataset/ (accessed on 12 November 2023).
- Suárez-Varela, J.; Ferriol-Galmés, M.; López, A.; Almasan, P.; Bernárdez, G.; Pujol-Perich, D.; Rusek, K.; Bonniot, L.; Neumann, C.; Schnitzler, F.; et al. The graph neural networking challenge: A worldwide competition for education in AI/ML for networks. ACM Sigcomm Comput. Commun. Rev. 2021, 51, 9–16. [Google Scholar] [CrossRef]

Disclaimer/Publisher’s Note: The statements, opinions and data contained in all publications are solely those of the individual author(s) and contributor(s) and not of MDPI and/or the editor(s). MDPI and/or the editor(s) disclaim responsibility for any injury to people or property resulting from any ideas, methods, instructions or products referred to in the content. |
© 2024 by the authors. Licensee MDPI, Basel, Switzerland. This article is an open access article distributed under the terms and conditions of the Creative Commons Attribution (CC BY) license (https://creativecommons.org/licenses/by/4.0/).