Abstract
Currently, there are a wide range of approaches to deploying digital ads, with advanced technologies now being harnessed to craft advertising that is engaging and even tailored to personal interests and preferences, yet potentially distracting and irritating. This research seeks to evaluate contemporary digital advertising methods by assessing how annoying they are to users, particularly when they distract users from intended tasks or cause delays in regular online activities. To pursue this, an eye-tracking study was conducted, with 51 participants navigating a specially designed website featuring seven distinct types of advertisements without a specific content to avoid the effect of ad content on the collected data. Participants were asked to execute specific information-seeking tasks during the experiment and afterwards to report if they recalled seeing each ad and the degree of annoyance by each ad type. Ad effectiveness is assessed by eye-tracking metrics (time to first fixation, average fixation duration, dwell time, fixation count, and revisit count) depicting how appealing an ad is as a marketing stimulus. Findings indicated that pop-ups, ads with content reorganization, and non-skippable videos ranked as the most annoying forms of advertising. Conversely, in-content ads without content reorganization, banners, and right rail ads were indicated as less intrusive options, seeming to strike a balance between effectiveness and user acceptance.
1. Introduction
Digital marketing is the practice of promoting products, services, or brands through digital channels, such as search engines, websites, social media, email, and mobile apps. It leverages online communication technologies to reach and engage with consumers in a targeted and interactive manner. It spans from building awareness to encouraging the purchase of a product or service, leveraging diverse platforms and digital channels [1,2,3].
Online advertisements have brought major changes in the way information about a company’s products are promoted. Consumers have a more enhanced perception of a company’s products and services or better yet, they can discover, through digital ads, a company that was previously unknown to them. Moreover, such ads provide a more interactive environment, as the communication between customer and company becomes more direct, and as a result, bonds are developed between them. Nowadays, consumers themselves contribute through their actions to the formation of promotional and advertising campaigns. Through these actions, valuable data are collected, measured and interpreted, contributing positively to the development of new communication models and channels.
Digital ads appear in various forms and are delivered with different techniques on each online platform. A summative table follows (Table 1) with the most widely utilized techniques of online ads, the types of ads each technique supports and a short description [3,4,5,6,7,8].

Table 1.
Techniques and types of online ads.
1.1. Eye Tracking and Digital Marketing
Eye tracking (also known as oculography) is a technology that uses infrared sensors or cameras to track where a user is looking in real time. This technology translates eye movements into a data stream that provides information about pupil location and gaze vector for each eye whilst providing an in-depth understanding about visual attention and behavior. Through this technology, eye movements can be decoded, and subsequently, different insights can be determined for use across a wide range of applications [9,10,11].
An eye-tracking system typically consists of one or more cameras, some light sources, and computing capabilities. It is either built into or placed in front of an interface device. As mentioned above, eye tracking captures the movements and characteristics of a person’s eyes, calculating a number of useful data points, such as the presence, attention, and point of gaze of the user, also known as fixations, as well as the position and size of the eye’s pupil. The raw material captured by the camera is translated into data points using algorithms, with the help of machine learning and advanced image processing.
More specifically, near-infrared light is directed at the eye’s pupil, causing detectable reflections on both the pupil and the cornea of the eye. These reflections are tracked by an infrared camera. This is the visual tracking of corneal reflections, otherwise known as Pupil Centre Corneal Reflection (PCCR). An infrared light source is necessary, as the accuracy of gaze estimation relies on a clear delineation and detection of the pupil as well as the detection of the corneal reflection. Regular light sources, such as those used in regular cameras, are not able to provide enough contrast, meaning that it is much harder to achieve a useful amount of accuracy without infrared light. Light from the visible spectrum is likely to create uncontrolled specular reflection, while infrared light allows for precise differentiation between the pupil and the iris. Furthermore, because infrared light is invisible to humans, it does not cause distraction as the eyes are being tracked.
This technology can be used in multiple fields of application, as it is a versatile tool. Through data analysis, researchers and developers can gain insights into user behavior, usability, and cognitive processes for a range of applications [12,13,14,15,16]. It can be used in domains ranging from scientific research to consumer marketing, workplace training, or even integration into products. Eye-tracking data can also provide valuable insights into how users react to visual stimuli and potential patterns in the visual behavior of website visitors, such as how long it takes to find a particular product or piece of information, what visual information is being ignored, where they focus their gaze, for how long, how many times they re-fixate and revisit, and in what order fixations occur.
1.2. Online Ads and User Annoyance
Examining the evolution of online advertisement techniques and user interfaces over the past few decades reveals a sophisticated interplay between technological advancements and user perception. Studies by researchers such as Rejer and Jankowski [17] have significantly contributed to this field, particularly with their work involving a small group of participants to observe the effects of intrusive advertising on brain activity. They noted a marked decline in beta activity, pointing to a significant drop in concentration levels when users were subjected to random ad displays, suggesting that user engagement with content is markedly affected by such interruptions.
Eye-tracking technology, as utilized in studies by Lee and Ahn [18], provides deeper insights into how consumers interact with online advertisements. Their research, involving a sample of 118 participants, shed light on how different variables, such as ad animation and speed, impact visual attention and subsequent brand recall. Interestingly, their findings suggest that while animated ads are designed to capture more attention, they do not necessarily lead to better memory recall, challenging the effectiveness of such ads in increasing consumer engagement.
Further explorations into animated ads by Hong et al. [19] identified specific features that either capture or fail to retain online consumer attention. Their study distinguishes between effects of motion, lagging, and looming, noting that the latter two have a more pronounced impact on user attention, especially in simpler web environments or when users are browsing without a specific target.
The intrusiveness of ads and their potential to disrupt not only user experience but also perceptions of credibility were highlighted in a study by Zha and Wu [20]. Through an experimental setup involving different versions of a news website with varying levels of ad relevance, they examined how different types of ads affected user perceptions of site credibility. Their findings indicate a nuanced viewer response, where ad relevance did not directly correlate with perceived credibility, except when ads closely matched the content, potentially raising suspicions about content bias.
The research from Thota et al. [21] delves into the psychological impact of animated banners, suggesting a complex relationship between ad perception and user attitudes towards both the host website and the advertised brand. Their comprehensive study, first leveraging qualitative methods to identify key themes and then quantitatively analyzing these through user surveys, found a pronounced skepticism towards websites featuring animated ads, affecting both brand perception and the likelihood of revisiting the site.
McCoy et al. [22] explored the influence of website familiarity and ad presence on perceived site quality, revealing that ads could positively impact user perceptions of familiar sites. This counterintuitive finding challenges the conventional wisdom that ads generally degrade user experience, suggesting that in contexts where users have preexisting positive associations, ads might reinforce or even enhance quality perceptions.
The mechanics of ad presentation and user control—or lack thereof—over their viewing experience significantly influence perceptions of intrusiveness and annoyance. Fessenden’s survey work [23], building on foundational research by Nielsen [24], underscores the enduring frustration users feel towards modal ads, autoplay videos, and other intrusive ad formats that disrupt content consumption.
The study of Rigou et al. [25] explores the features of online ads that contribute to user annoyance, focusing on eight specific characteristics, among them the ease of ad closure, ad coverage of content, and auto-play functions including video and sound. Surveying 132 computer science students who documented 462 ads they found annoying, the study revealed that ads which automatically activate and cover significant portions of the browser window are deemed most irritating. Additionally, non-personalized ads with automatic sound or video, regardless of the viewer’s ability to close them, significantly disrupted user attention and increased perceived intrusiveness.
Addressing the strategic dimensions of digital marketing, Smith’s [26] research highlights the delicate balance between attracting consumer attention and avoiding tactics that lead to ad avoidance and negative brand perceptions. This includes recognizing the importance of web design, ad personalization, and the subtle use of incentives to foster a more engaging and less intrusive online ad environment.
The role of ad content in shaping user reactions was thoroughly investigated by Zeng et al. [27], who, through an extensive survey, mapped out the spectrum of user attitudes towards online advertising, pointing to a critical need for content strategies that avoid negative consumer reactions while effectively communicating brand messages.
Personalized advertising, as explored by O’Donnell and Cramer [28], emerges as a nuanced field where user device preferences, ad relevance, and personal interests converge to shape ad effectiveness. Their study emphasizes the importance of understanding consumer behavior across different platforms to optimize ad personalization strategies effectively.
Finally, the discussions around ad avoidance strategies, especially in the context of e-lifestyles and social media usage, reveal a complex landscape where user behavior and attitudes towards ads vary widely. From Kim and Seo’s [29] examination of YouTube ad avoidance to in-depth analyses of ad avoidance on Facebook, it is clear that understanding the specific contexts and motivations of online engagement is crucial for developing effective advertising strategies that respect user preferences and enhance the overall online experience.
In this increasingly complex digital advertising ecosystem, it is evident that a balance must be struck between innovation in ad technology and formats, and a respect for user experience and engagement. As these studies show, successful online advertising strategies are those that not only capture attention but do so in a way that is perceived as non-intrusive and relevant, thereby fostering a positive relationship between the advertiser and the consumer.
2. Materials and Methods
The present study aims to contribute to the research and delve deeper into the field of digital marketing, and more specifically into the various digital advertising techniques and types, their effectiveness as visual stimuli and the impact on user experience (in terms of user-perceived annoyance). With the assistance of the laboratory equipment provided by the Department of Management Science and Technology of the University of Patras and specifically the eye tracker Tobii Pro Nano, an experiment was conducted to evaluate the user experience regarding advertisements encountered while navigating a website. A website containing advertisements was created for these research purposes. During the users’ browsing throughout the website, the eye-tracking equipment recorded their eye movements. The collected data extracted from the experimental procedure were analyzed and used to draw conclusions about the participants’ visual attention and behavior.
2.1. Experimental Procedure
The experiment was conducted during the period 23 May 2023–2 June 2023. The number of participants in the experimental procedure totaled 51 people.
Upon entering the laboratory, participants were given a prior introduction to the experimental procedure and the set objectives, including a brief explanation of the study’s topic. They were further informed that they were free to stop and withdraw at any given time, for any reason, during the experimental procedure. They were also informed about the nature of the data that would be collected and analyzed, as well as the eye-tracking technology and its safe use, ensuring that there was no risk of damage to vision. They were asked to take the necessary time to read the Participant Consent Form before signing it, to begin the process. To guarantee the health and safety of the participants, all standard regulations regarding COVID-19 were followed throughout the experimental procedure. Thus, participants were given a document to fill in with their full name, date, and signature, giving their consent to the provision of personal data for the purpose of the research. Once the consent form was completed, participants were asked to complete the first of the two questionnaires used in our research process.
The purpose of the first questionnaire was to collect demographic data with questions related to gender, age, etc., as well as their level of computer literacy and whether they use any ad blocking software on their personal computers. Completing this questionnaire allowed us to correlate the questions with the sample’s behavior and response to advertisements and with the second questionnaire, which followed. It should be noted that the questionnaire was created in such a way as not to arouse suspicion about what was to follow, as we did not want to influence the results of the experimental procedure.
Then, the Tobii Pro Nano was used to carry out the experiment. After the necessary procedures were completed, such as making the user comfortable and preparing the eye tracker, data recording began. Upon completion of the recording, participants were given the post-test questionnaire. Its purpose was to examine, firstly, users’ attitudes towards advertisements and the degree of annoyance. Secondly, the degree of annoyance with other types of advertisements that did not appear on the website was examined.
2.2. Website and User Scenarios
The website used during the experiment was implemented with the free tool “Figma”. With the help of various plug-ins, the different advertising techniques that were the focus of this study were added. Then, the website was presented locally on the computer on which the eye-tracking equipment was operated using a website link.
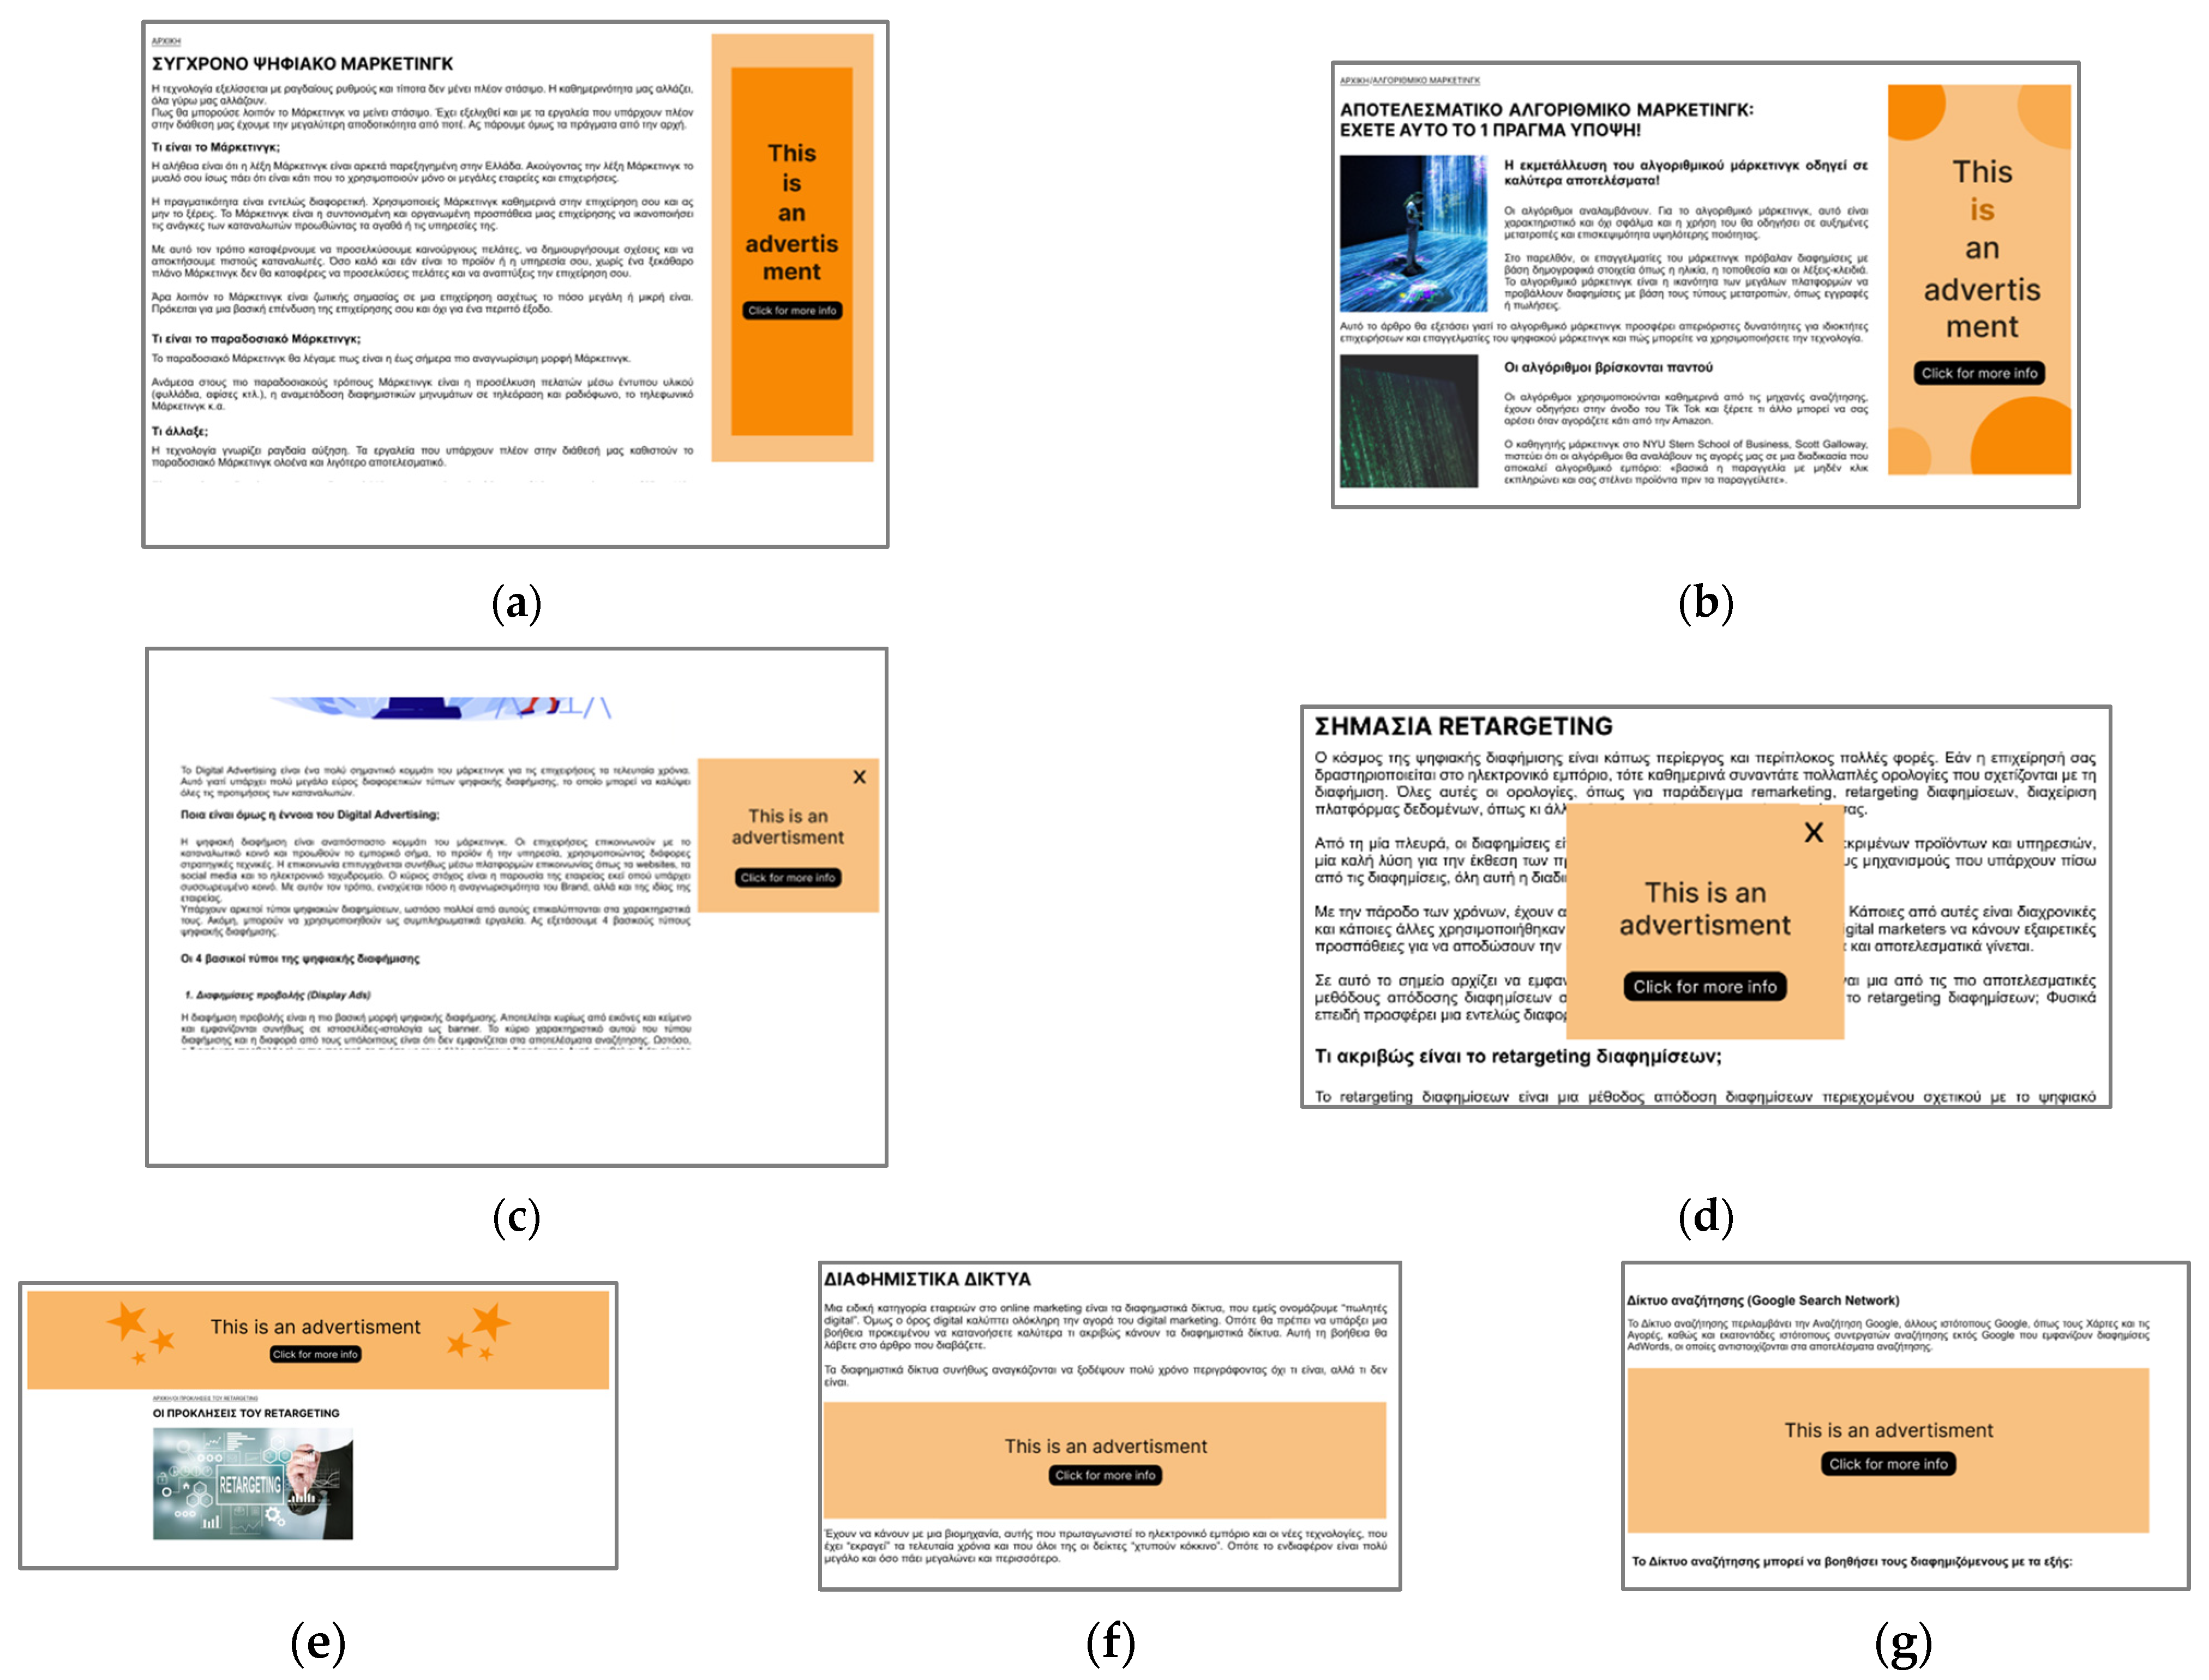
The website consisted of seven articles, which the user was asked to open in order. In each of these articles, there was one advertisement placed—right rail, right rail animated, modal, non-modal, banner, intracontent with content reorganization, intracontent without content reorganization—of a different type and size and neutral content that served our research purposes. Figure 1 depicts the seven ads placed on the pages of the pilot website that was designed for the experiment. The content of the pages was in the Greek language, so that no participant would have difficulty reading and searching through the text.
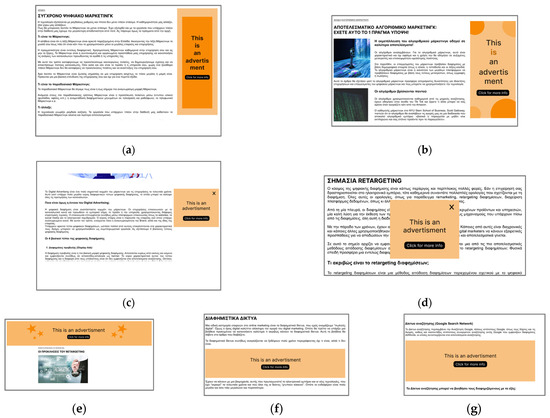
Figure 1.
Webpages featuring different types of display ads on the pilot website constructed for the experiment. (a) Right rail ad, (b) right rail animated, (c) nonmodal ad, (d) modal ad, (e) banner ad, (f) intracontent with content reorganization, and (g) intracontent without content reorganization.
Starting from the “Homepage”, users were exposed to a right rail ad on the right-hand side of the page. In the second article, there was a non-modal ad on the right-hand side of the page, which could be closed if the user wished. The first pop-up ad of the modal type was placed in the third article, where it appeared above its main content and could be closed if the user wished. In the next article, there was the banner at the top of the page. The next pop-up ad was in the fifth article. It was of the intracontent with content reorganization type and appeared suddenly in the main content of the page, readjusting/moving it. In the sixth article, there was an intracontent without content reorganization ad, which was in the main content of the page without causing any problems and could not be closed. In the last article that opened on the website, there was a right rail animated ad, which was on the right-hand side of the page and animated, gif-type.
At the beginning of the user testing session, users were given verbal instructions to ensure that they all would enter all of the pages that made up the website. Users were introduced to the procedure by the following: “In this experiment you will see a tech blog that consists of seven articles. You will observe these articles and during the experiment you will be asked to identify a specific piece of information that will be available in each of these articles”. As the eye-tracking experiment started, participants were initially exposed to the home page. They were asked to “take a look” at the specific article, and after a short period of time, they were tasked to locate the definition of digital marketing. Once the users had identified the requested information, they were asked to open the first article from the links at the bottom of the page. This guidance was intended to ensure that none of the articles on the website (nor any of the studied ads) would be skipped. When users opened the first link, they were again given time to observe the page before being asked the next question about the content of the new page. The questions were intended to ensure that the experiment would be completed in a reasonable amount of time and that users would not become fatigued from reading articles without a specific purpose. In addition, the questions resembled the information needs that typically drive users to navigate tech blogs and also kept users’ attention focused on responding without being absorbed by ads more than they typically would.
2.3. User Sample
The pre-test questionnaire aimed to create a profile for our sample consisting of 51 participants. At the first stage, we attempted to understand how the sample was classified in terms of demographics such as age, educational level, and gender. At the second stage, we included questions about the use of ad blocking software on their personal computers, the time they spent browsing the internet each day, and their level of computer literacy. The aim was to understand the sample’s degree of familiarity with online advertising, without giving users any idea of the experimental procedure that would follow. The profile of the sample is depicted in Table 2.
Table 2.
User Sample.
3. Results
3.1. Post-Test Questionnaire Results
Immediately after the completion of the experiment, the post-test questionnaire was filled in so that the participants could recall all related information. In the first phase, we had recognition questions, in which all of the advertisements on the site were displayed to see which ones were noticed and to what extent participants were influenced by them. In the second phase, we examined the degree of annoyance with other forms of advertisements that did not exist on the experiment’s website. This information would further help us in the broader research. Table 3 depicts the data collected when users were asked to rank the online ad techniques based on the degree of annoyance (1: Not annoying at all, 5: Extremely annoying). It is evident that the most annoying advertisement was the modal popup advertisement, with 72.5% of the users (37 users) placing it in this position. Following immediately were the intracontent with content reorganization ads, deemed annoying by 13.7% (7 users). The right rail and nonmodal techniques were considered less annoying, by 49% (25 users) and 23.5%of users (12 users), respectively.
Table 3.
Responses to post-test questionnaire (1—Not annoying at all, to 5— Extremely annoying).
Initially, we had the right rail advertising technique, which was located on the right side of the page and could not be closed. Among the participants, 80.4% (41 people) noticed the advertisement during their navigation on the website; 34.1%, with 14 valid responses answered “1-Not annoying at all” for this specific type of advertisement; 31.7% with 13 valid responses answered “2-Slightly annoying”; 19.5% with 8 valid responses answered “3-Annoying”, meaning it annoyed them to a more neutral degree; 12.2% with 5 valid responses answered “4-Very annoying”; and just 2.4% with 1 valid response found this advertisement “5-Extremely annoying”. The overall conclusion from the above results for the right rail advertisement was positive, as the majority of the participants did not find this form annoying or were only mildly annoyed.
For the nonmodal technique, 72.5% of the users (37 people) noticed this particular advertisement, which also appeared on the right side of the page, had a smaller size than the previous one, and could be closed if the user wished. Of the sample, 23.7% with 9 valid responses answered “1-Not annoying at all” to the question “How annoying did you find this advertisement?”; 39.5% with 15 valid responses answered “2-Slightly annoying”, 28.9% with 10 valid responses said “3-Annoying”, and 7.9% with 3 valid responses said “4-Very annoying”. None of the participants found this advertisement extremely annoying. The overall conclusion from the above results for the nonmodal advertisement was positive, as the majority of the participants were only mildly annoyed or did not find this form annoying.
The modal technique was noticed by all participants, with 51 valid responses. It appeared over the main content of the website in the form of a pop-up window, as shown in the picture. This type of advertisement does not go unnoticed. Among the participating users, 2% with 1 valid response found this advertisement “1-Not annoying at all”, 5.9% with 3 valid responses answered “2-Slightly annoying”, 5.9% with 3 valid responses answered “3-Annoying”, 23.5% with 12 valid responses answered “4-Very annoying”, and 62.7% with 32 valid responses answered “5-Extremely annoying”. The overall conclusion from the above results for the modal advertisement was negative, as the majority of the participants found this form extremely annoying.
For the banner ad format, 82.4% of the participants (42 people) noticed this particular advertisement on the website. This advertisement appeared at the top of the page and remained fixed in its position, changing its display at regular intervals. As seen, it was noticed by the majority of users, of whom 19% with 8 valid responses found this form of advertisement “1-Not annoying at all”, 38.1% with 16 valid responses found “2-Slightly annoying”, 21.4% with 9 valid responses found “3-Annoying”, 16.7% with 7 valid responses found “4-Very annoying” and just 4.8% with 2 valid responses found “5-Extremely annoying”. The overall conclusion from the above results for the banner advertisement was positive, as the majority of the participants were only slightly annoyed.
For the intracontent with content reorganization technique, 90.2% of users (46 people) noticed this advertisement. It is an advertisement that dynamically appears on the page in the form of a pop-up window and redefines the main content until it finally stabilizes in a fixed position. Of the users who noticed it, 10.9% with 5 valid responses found this form “1-Not annoying at all”, 34.8% with 16 valid responses found it “2-Slightly annoying”, 30.4% with 14 valid responses found it “3-Annoying”, 19.6% with 9 valid responses found it “4-Very annoying”, and 4.3% with 2 valid responses found it “5-Extremely annoying”. The overall conclusion from the above results for the intracontent with content reorganization advertisement was positive, as most of the participants found this form slightly annoying.
For the intracontent without content reorganization technique, 86.3% of the participants (44 people) noticed the particular advertisement. It was fixed in the main content of the website without the possibility of closing it. Among the users who noticed it, 7% with 3 valid responses answered “1-Not annoying at all”, 41.9% with 18 valid responses answered “2-Slightly annoying”, 27.9% with 12 valid responses answered “3-Annoying”, 18.6% with 8 valid responses answered “4-Very annoying”, and 4.7% with 2 valid responses answered “5-Extremely annoying”. The overall conclusion from the above results for this specific advertisement was positive, as the majority of the participants found the advertisement slightly annoying.
For the right rail animated technique, 86.3% of users (44 people) noticed this advertisement, which was located on the right side of the page, could not be closed by the user and was animated. Of those who noticed it, 25% with 11 valid responses found it “1-Not annoying at all” this specific form of advertisement, 38.6% with 17 valid responses answered “2-Slightly annoying”, 18.2% with 8 valid responses answered “3-Annoying”, 13.6% with 6 valid responses answered “4-Very annoying”, and 4.5% with 2 valid responses answered “5-Extremely annoying”. The conclusion from the above results for the right rail animated advertisement was positive, as a larger percentage of users found the advertisement slightly annoying.
The subsequent questions aimed to examine the degree of annoyance with other forms of advertising, which did not appear on the experiment’s website.
- Advertisement based on data the user has seen in the past: To the question “How annoying would you find this advertisement?”, 9.8% of the users with 5 valid responses replied “1-Not annoying at all” 37.3% with 19 valid responses replied “2-Slightly annoying”, 35.3% with 18 valid responses replied “3-Annoying”, 9.8% with 5 valid responses replied “4-Very annoying”, and just 7.8% with 4 valid responses stated they found such an advertisement “5-Extremely annoying”. Therefore, the conclusion that emerged from the above results was partially positive, as a larger percentage of the participants found such an advertisement slightly annoying or just annoying.
- Sponsored advertisements (this is an advertisement that usually appears in the feed of social networking media and explicitly states that it is sponsored): 7.8% of the users with 4 valid responses answered they would find this form of advertisement “1-Not annoying at all”, 17.6% with 9 valid responses answered “2-Slightly annoying”, 25.5% with 13 valid responses answered “3-Annoying”, 37.3% with 19 valid responses answered “4-Very annoying”, and 11.8% with 6 valid responses answered “5-Extremely annoying”. From these data, we conclude that this type of advertisement is very annoying.
- Video advertisements, without the option to skip to see the content of a page or the video of interest (the video advertisement must be completed): 3.9% of the users with 2 valid responses stated they found it “1-Not annoying at all”, 2% with 1 valid response stated “3-Annoying”, 13.7% with 7 valid responses stated “4-Very annoying”, and 80.4% with 41 valid responses stated they found it “5-Extremely annoying”. Therefore, we conclude that this form of advertising is extremely annoying.
- Video advertisements that start playing with sound when a user enters a page: 3.9% of the users with 2 valid responses answered they found it “1-Not annoying at all”, 2% with 1 valid response answered “2-Slightly annoying”, 2% with 1 valid response answered “3-Annoying”, 21.6% with 11 valid responses answered “4-Very annoying”, and 70.6% with 36 valid responses stated they found it “5-Extremely annoying”. The majority of the sample found this specific form of advertising extremely annoying.
- Video advertisements with the option to skip after 5 s to see the content of a page or the video of interest: 5.9% of the users with 3 valid responses rated this “1-Not annoying at all” for the degree of annoyance, 9.8% with 5 valid responses answered “2-Slightly annoying”, 27.5% with 14 valid responses answered “3-Annoying”, 43.1% with 22 valid responses answered “4-Very annoying”, and 13.7% with 7 valid responses stated they found it “5-Extremely annoying”. The conclusion that emerged from the above statistical data for this type of advertisement was negative, as the majority declared they found it very annoying.
- Advertisements that we cannot close or skip at any time: 2% of users with 1 valid response responded “1-Not annoying at all”, 15.7% with 8 valid responses answered “4-Very annoying” and the largest percentage, at 82.4% with 42 valid responses, answered “5-Extremely annoying”. The final conclusion was negative, as this form of advertising seems to be at the maximum level of annoyance according to the participants.
- Advertisements with the option to close or skip them at any time: 11.8% of the users with 6 valid responses answered that they found this type of advertisement “1-Not annoying at all”, 52.9% with 27 valid responses answered “2-Slightly annoying”, 27.5% with 14 valid responses answered “3-Annoying”, and 7.8% with 4 valid responses answered “4-Very annoying”. No participant found this specific advertisement extremely annoying. The result that emerged from the above statistical data was positive, as the majority found such an advertisement slightly annoying. In the last question of the questionnaire, users were asked to rank the advertisements they saw on the website from the least annoying to the most annoying. The analysis of the ranking for each advertisement is presented in the following table. Each row represents a type of advertisement, and each column represents a ranking. The values show how often each advertisement was placed in each ranking by the respondents.
Table 4 depicts the data collected when users were asked to rank the online ad techniques based on the degree of annoyance (1: Not annoying at all, 5: Extremely annoying). It is evident that the most annoying advertisement was the modal popup advertisement, with 72.5% of the users (37 users) placing it in this position. Following immediately were the intracontent with content reorganization ads, so ranked by 13.7% (7 users). The right rail and nonmodal techniques were considered less annoying, by 49% (25 users) and 23.5% of users (12 users), respectively.
Table 4.
Ranking of online ad techniques based on the degree of annoyance (1: Not annoying at all, 5: Extremely annoying). The numbers indicate the number of users that ranked each ad in the respective place.
3.2. Eye-Tracking Results
The experiment was conducted using the Tobii Pro Nano device and the iMotions Lab software (version 9.4) [11]. iMotions provides the option to define areas of interest (AOIs) based on the object we want to study. In our case, the defined areas of interest included the advertisements. Thus, we could extract information concerning these specific areas. The AOIs in our research were renamed based on the type of advertisement for better representation in the statistical analysis of the data. The following metrics were used for analyzing the effectiveness of each online ad technique as an attractive visual stimulus (measured values per metric are depicted in Table 5):
Table 5.
Eye-tracking metrics for the tested Online Ad Techniques. TTFF, Revisit and Fixation count are average values, and the standard deviation is in parentheses.
- Time To First Fixation: Average time that passed until the first fixation was detected inside an active AOI (relative to AOI onset). It indicates the amount of time that it takes a respondent (or all respondents on average) to look at a specific AOI from stimulus onset.
- Fixation Duration: Average duration of all fixations/visits detected inside an active AOI. A visit is defined as the time interval between the first fixation on the active AOI and the end of the last fixation within the same active AOI where there have been no fixations outside the AOI.
- Revisit Count: Average of how often the respondents looked back at the AOI after the first dwell.
- Dwell Time: Average of how long the respondents fixated on the AOI in relation to the time during which the AOI was active.
- Fixation count: Average amount of fixations/visits detected inside an active area Of interest (AOI).
Each of the advertisements displayed on our experiment’s website was fully functional, meaning the user, by clicking on each link, navigated to a separate functional page. Thus, we extracted the data in such a way to examine where and for how long users looked when they entered the pages containing the advertisements. The first advertisement was placed on the homepage and was of the right rail type. The data from the eye-tracking device showed that 48 out of 51 individuals saw the advertisement. Next, the nonmodal advertisement was seen by 33 out of the 51 individuals. Regarding the modal advertisement, 48 out of 51 individuals focused their attention on it. Additionally, 47 out of the 51 individuals looked at the intracontent without content reorganization advertisement, and 46 out of the 51 looked at the banner. For the intracontent with content reorganization advertisement, the results showed that 46 individuals looked at the advertisement, and finally, although there was movement in the animated right rail, only 20 individuals focused their attention on it. The above results emerged from the respondent count metric, which presented the number of participants who looked at a specific area of interest, which in our case was the advertisement on each page. The following table presents the results that emerged from the tracker software after analyzing the experimental process for each type of advertisement we placed on the website.
The first metric presented in the table is Time to First Fixation. Thus, we see that for the first advertisement, which was the right rail advertisement, the average time to first fixation was 3172.73 ms. Converting this time to seconds, we observe that it took participants just 3.172 s to focus their gaze on this particular type of advertisement. The results for the metric in seconds are presented below for better understanding. The next advertisement was the nonmodal, for which it took participants an average of 2.097 s to look at. This was followed by the modal advertisement with a time of 0.41 s. For the intracontent without content reorganization, the TTFF was 1.124 s; for the banner advertisement, the TTFF was 1.427 s; for the intracontent with content reorganization, it was 0.566 s; and finally, for the animated right rail, this time was 3.247 s. According to this metric, the advertisements that initially attracted users’ attention were the modal and intracontent with content reorganization forms.
Next, we extracted results for the average fixation duration, i.e., how much time on average that participants focused on each of the advertisements. For the right rail, users stabilized their gaze for an average of 1.888 s; for the nonmodal, 0.967 s; for the modal, 2.681 s; for the intracontent without content reorganization, 1.715 s; for the banner, 1.144 s; for the intracontent with content reorganization, 0.808 s; and for the animated right rail, 0.456 s. It is evident that the modal, right rail, and intracontent without content reorganization advertisements are those in which users focus their attention for a longer time.
Then, the revisit counts metric allowed us to draw conclusions about how many times users returned their gaze to each advertisement. For the right rail, we see that on average, they looked back at the advertisement 3.44 times. For the nonmodal, the metric showed 1.15 times; for the modal, 1.1 times; for the intracontent without content reorganization, 4.11 times; for the banner form, 1.65 times; for the intracontent with content reorganization, 1.28 times; and for the animated right rail, 0.25 times. Finally, users revisited the right rail and intracontent without content reorganization forms more often. The reasons why a user might return to look at something on a website vary. It could be because of something that piqued their interest either positively or negatively, something that bothered them a lot and they looked again to see if they could hide it from the page, or even because their gaze fell randomly in case of movement.
The next metric was dwell time, which shows the percentage of time dedicated to each advertisement compared to the time the advertisement was active, i.e., visible on the page. As long as participants navigated the website, they could scroll up or down, and the advertisement may have disappeared from their field of view. For the right rail advertisement, then, the dwell time percentage reached 6.72%; for the nonmodal, 8.83%; the modal advertisement, 53.18%; intracontent without content reorganization, 5.28%; the banner, 20.16%; the intracontent with content reorganization, 13.82%; and the animated right rail, 8.51%. We see that the modal form and, subsequently, the banner and intracontent with content reorganization forms, hade the highest percentages. We can, therefore, conclude that for these specific forms of advertisement, participants’ interest was more focused. The way these particular advertisements were designed played a very important role in the results we received for this metric.
The last metric was fixation count, which presents the average number of fixations detected on each advertisement and is an indication of how well the user examined the content of each advertisement. The average number of times users’ gaze was stabilized regarding the right rail advertisement was 8.44. For the nonmodal, it was 3.88; for the modal, 8.31; for the intracontent without content reorganization, 8.28; for the banner form, 5.7; for the intracontent with content reorganization, 3.96; and for the animated right rail, 2.4.
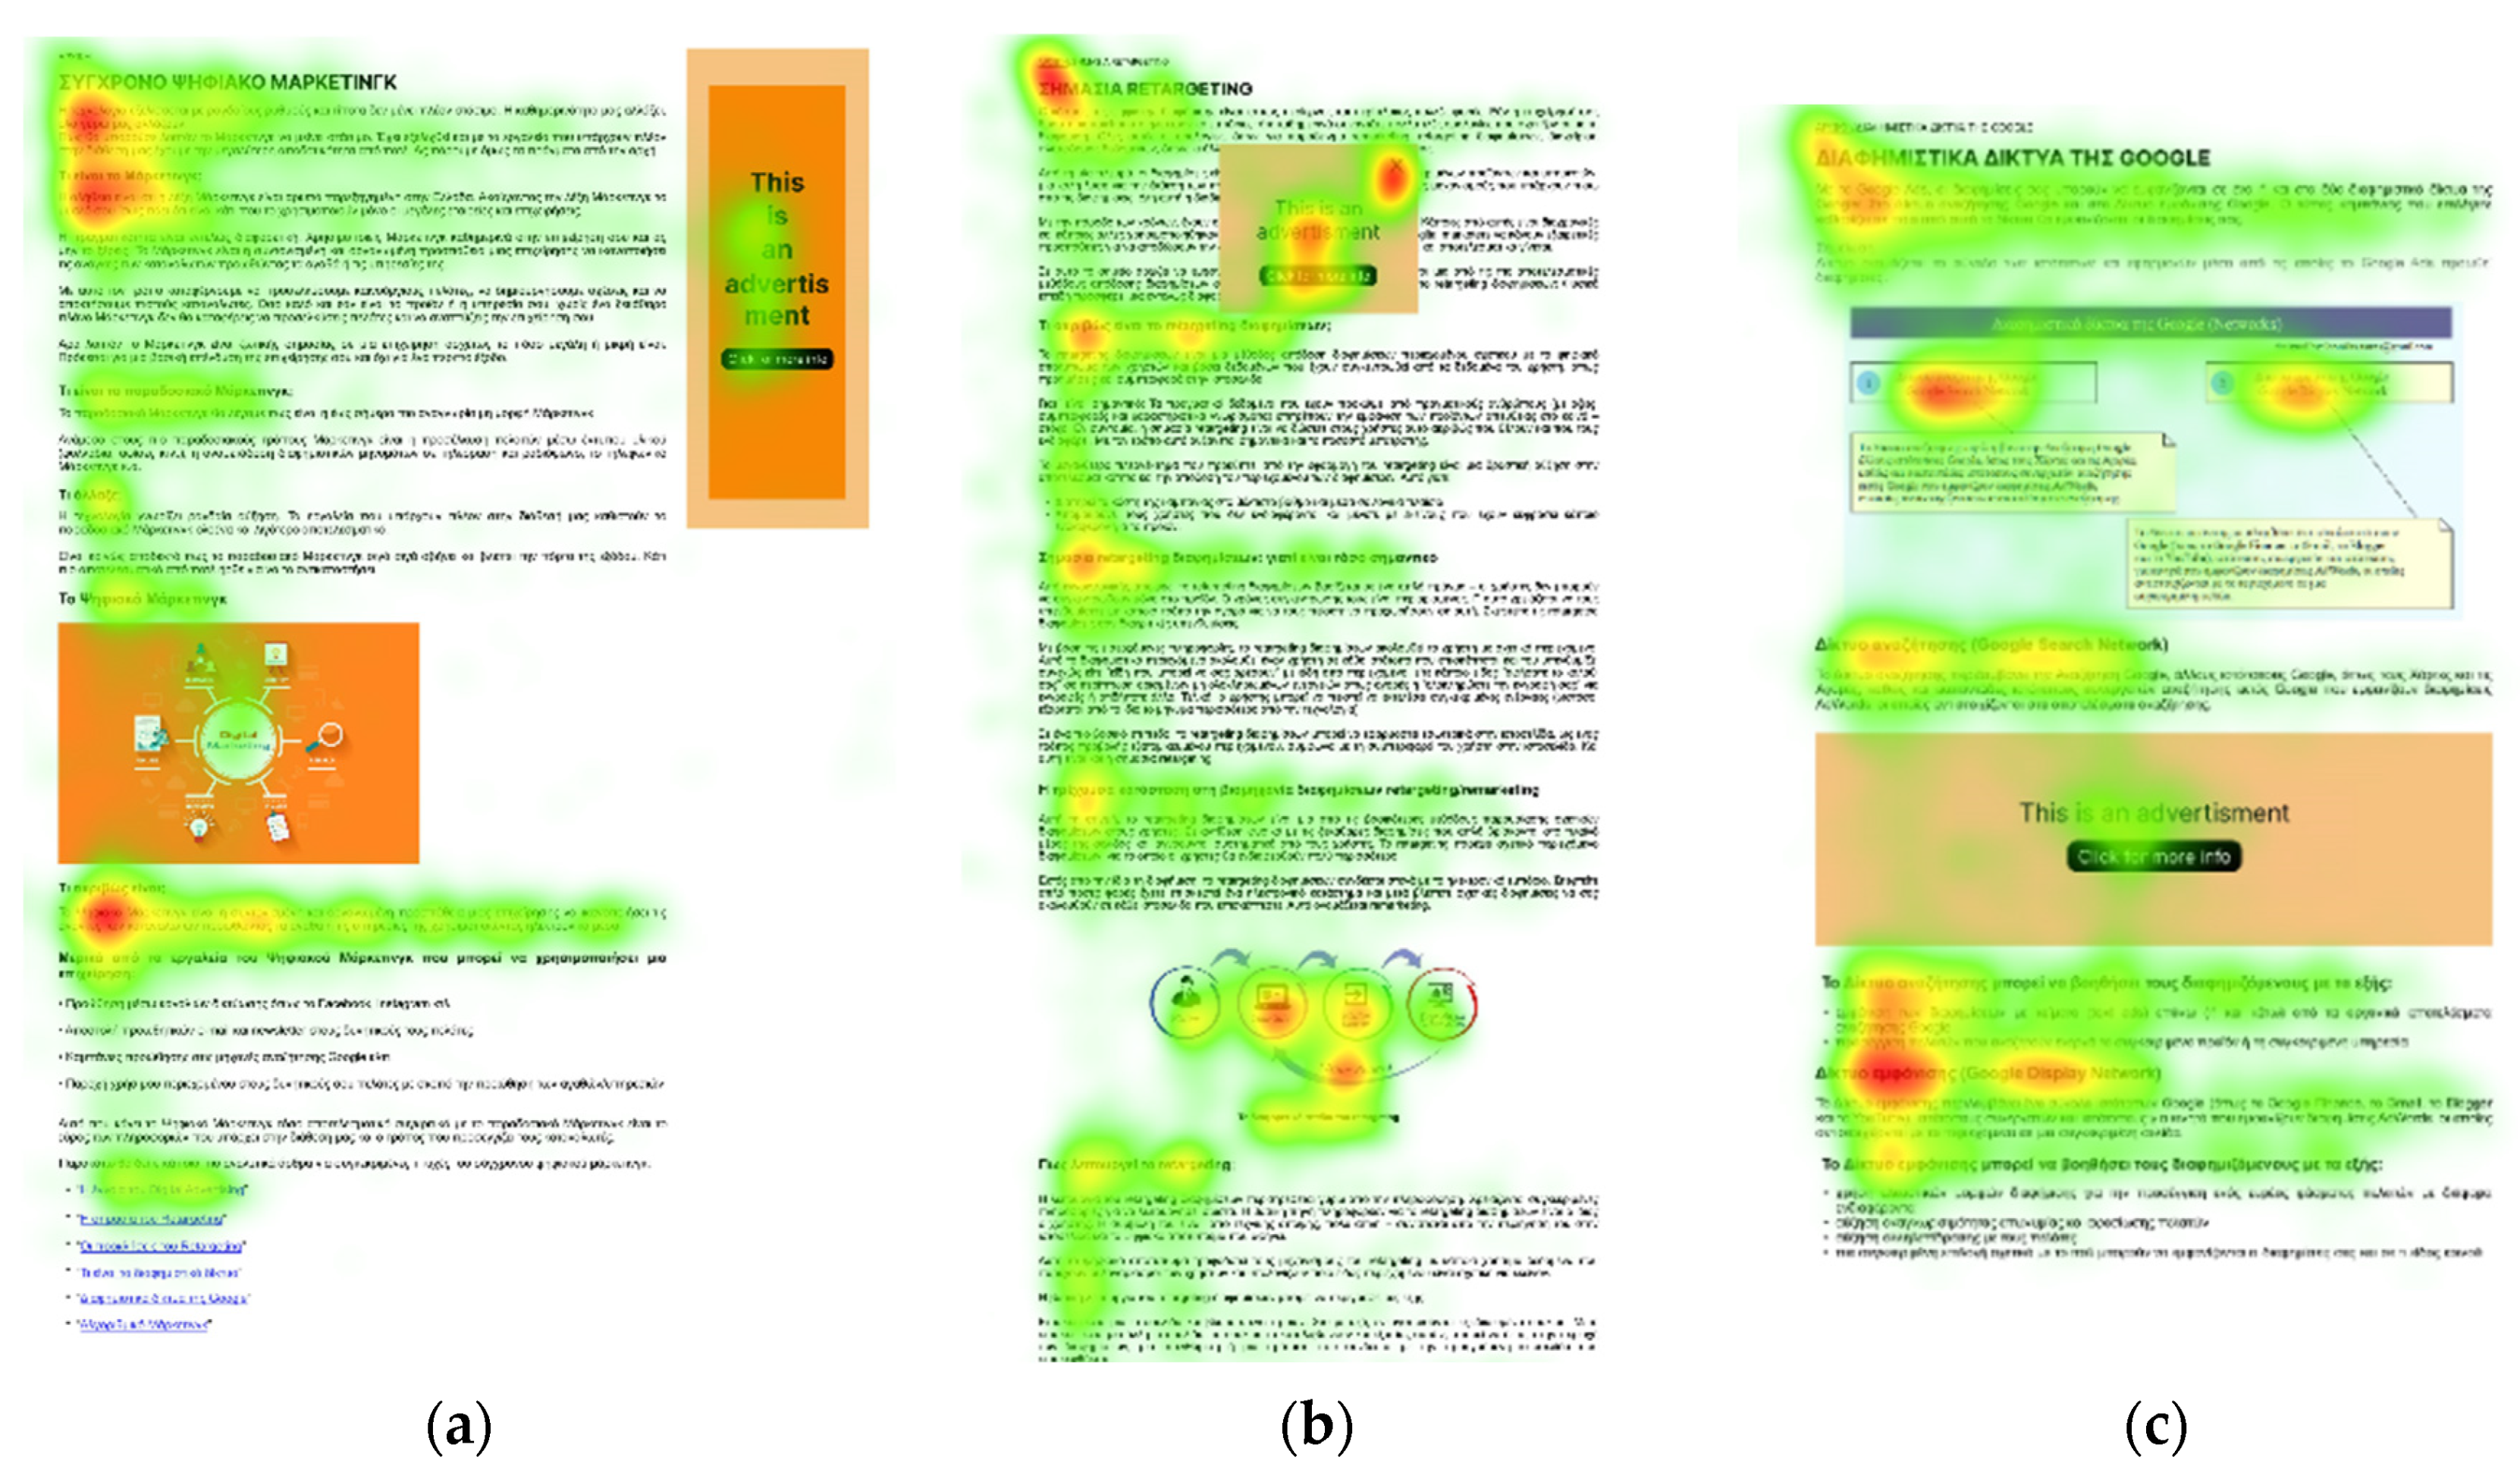
Figure 2 depicts heatmaps, for all participants, for the home page and two additional pages of the website that were tested.

Figure 2.
Heatmaps for the homepage and two more website pages displaying (a) a right rail ad, (b) a modal ad and (c) an intracontent without content reorganization ad, respectively.
The use of heatmaps provided a consolidated representation of gaze points and important information about user behavior on the website. On all pages, it appears that users focused their attention on certain parts of the article, which may have been due to searching for specific information they were asked to find. On the first and second page, they observed the advertisement to a lesser extent. On the next page, it appears that the advertisement was one of the parts of the article that significantly attracted the participants’ attention. The specific position of the modal advertisement on the page significantly contributed to the results. As depicted, users focused their gaze on the center of the advertisement as well as on the “X” that terminated the advertisement. Moving on to the next two pages, participants did not particularly notice the banner advertisement as well as the intracontent with content reorganization advertisement. On the page with the intracontent without content reorganization advertisement, in contrast to the two previous advertisements, the gaze points slightly increased, perhaps due to its specific placement within the article. Users searching for the requested information passed their gaze over this particular advertisement. Finally, for the animated right rail, the depiction shows that they did not even notice it despite it being animated. In this case, it seems that the “Banner Blindness” phenomenon was at play. This phenomenon occurs in cases where the user is excessively exposed to advertisements and ultimately ignores them subconsciously while continuing their navigation on the page. Having reached the last article and noticing with their peripheral vision the movement and the different appearance in relation to the rest of the page’s content, the user knows that there is an advertisement in that specific position and thus ignores it.
4. Discussion
Grouping the results of the experimental process with those of the questionnaires, we arrived at the following conclusions. The modal advertisement was by far the most annoying advertisement type, compared to the other types of advertisements we analyzed during the experimental process. According to the results of the second questionnaire, 67.2% of the participants considered it extremely annoying, and 23.5% deemed it very annoying. Subsequently, the results for the metrics emerging from eye tracking corroborated this theory. This specific advertisement form had the shortest TTFF, 0.41 s, meaning the shortest average time to first fixation, which is quite logical, as when an object is very annoying, you usually notice it very quickly. It had the longest average fixation duration, 2.681 s, meaning the average time participants focused on this advertisement. This metric, combined with the fixation count, which was 8.31, the second highest number, created a contrast with the previous metric. Observing the heatmap for the page with the popup form, it was noted that users were seeking a way to close the advertisement; hence, they focused their attention on it. Thus, the dwell time metric, which presents the percentage of time the participants dedicated to each advertisement for as long as it was active, amounted to 53.18%, which was the largest percentage, since this specific advertisement did not remain active for a long time, and users were looking for a way to close it throughout this duration.
The immediately following advertisement form that was considered somewhat annoying was the intracontent with content reorganization. According to the results of the questionnaire, 34.8% and 30.4% of participants, respectively, found this specific advertisement “Slightly annoying” and “Annoying”— the moderate level of annoyance. Based on the eye-tracking metrics, it was the immediately following advertisement form with the shortest TTFF, of 0.566 s. We conclude, therefore, that participants quickly noticed this form within the page. It had the second shortest average fixation duration, of 0.808 s, which allows us to conclude that they did not focus on this advertisement for a long time, while the revisit count metric of 1.28 times informs us that users did not look back at this form many times. The dwell time users dedicated to this advertisement for as long as it was active amounted to 13.82%, a larger percentage compared to the other types of advertisements. This specific advertisement type does not annoy users in terms of accessing the content of the page. Due to the visual effect—it opens dynamically on the page and redefines its content—the user notices it; however, once it stabilizes, it does not significantly annoy them. It is perceived as an advertisement; therefore, the user will not look back at it again.
Regarding other forms of advertisement that were not examined with eye tracking but only through the second questionnaire, some video advertisement forms stood out for the degree of annoyance they created in users. The video advertisement with the option to skip after 5 s was considered very annoying by 43.1% of the respondents. This was followed by the video advertisement that starts playing with sound, with 70.6% of the participants considering it extremely annoying. Finally, the most annoying form of video advertisement was deemed to be the one that cannot be skipped until completed, with 80.4% of participants finding it extremely annoying. Also, the advertisement that does not have the option to be closed at any time was considered extremely annoying by a very high percentage, 82.4%, of the participants. Concluding, the sponsored advertisement had the smallest percentage of annoyance, with 37.3% considering it “Very annoying”.
The other forms of advertisements examined in terms of the degree of annoyance did not have particularly high percentages. As for their effectiveness, considering them as visual stimuli, the intracontent without content reorganization and the banner were the ones that had the immediately smaller TTFF after the more annoying ones, meaning they attracted the user’s attention more quickly. Also, users focused on these forms for a longer duration, as well as on the right rail form, and revisited their gaze on these more frequently. We conclude, therefore, that these specific advertisement forms better serve the marketing goal, as they are visually detected in a very short time without significantly annoying the user.
The findings from our research agree with previous studies on similar subjects [6,7] that supported the conclusion that the most annoying types of advertisements are modal, intracontent with content reorganization, and non-skippable videos. From the early 2000s to the present day, the modal popup advertisements that cover the content of the page the user is trying to view, the advertisements that reorganize the content of a page, advertisements that occupy most of the screen, and those that automatically play sound have been considered the most annoying forms of advertisement. If marketing departments of companies want to avoid annoying users, they should avoid these features in advertisements.
5. Conclusions
The present study addressed the impact of online advertisements on user experiences during internet browsing, targeting the mechanisms of advertisements. A significant parameter of the current study was the choice of the user sample, consisting of young digital natives (i.e., highly skilled and internet-savvy people that attend higher education institutions). This decision was made based on the numerous advantages it offers. Firstly, this demographic’s inherent familiarity and continuous engagement with digital platforms grant them a unique perspective on the digital advertising landscape, making their insights particularly valuable. As a key target audience for many advertisers, due to their significant purchasing power and potential for long-term brand loyalty, understanding their attitudes towards online ads can yield constructive feedback for creating less intrusive advertising strategies. Furthermore, young digital natives are highly skilled at navigating the rapidly evolving digital world, keeping abreast of the latest trends in online advertising, which ensures that the study’s findings will remain relevant and current. Their diverse and frequent consumption of digital content across various platforms offers a comprehensive view of the digital advertising ecosystem, enhancing the study’s breadth. Moreover, their digital skills allow for a critical and nuanced analysis of online advertisements, enriching the research with detailed insights into the subtleties that contribute to ad annoyance. Lastly, focusing on this demographic offers foresight into future advertising trends and preferences, as their evolving tastes will inevitably influence the direction of online advertising, underscoring the long-term value of their feedback for shaping future ad strategies that aim to minimize user annoyance.
An equally interesting approach would be a study of the content of digital advertisements and its effect on user behavior. Significant aspects could be highlighted regarding users’ perceptions and reactions in cases where they are faced with more targeted content. User perception of ads may be substantially impacted by the ad content apart from the used technique and type, which was the focus of this study. Furthermore, in our research, we focused on how users are affected when there is an advertisement on a website. Therefore, we could deepen this research and study how internet advertisements bother users when there are many advertisements on the same webpage. The question that arises is, how does the excessive presence of advertisements on a website affect users? By examining these parameters, a more comprehensive understanding of how advertisements are designed and presented on the internet, as well as the importance of improving the user experience, can be achieved.
Beyond designing future research in these directions, it would be interesting to code advertisements considered highly annoying to users as UI patterns [30,31] or dark patterns [32,33]. The purpose of this encoding is for a designer to know what to avoid. As for less annoying advertisements, they can be documented as design patterns. Design patterns are standardized reference points used by experienced user interface designers. They provide a specific pattern that can be reused by all designers. In simpler terms, they are a common language among designers. A given design pattern provides information on where and when it can be better used to achieve the best possible results. UI patterns are reusable elements used by designers to solve common problems in user interface design. These patterns can be applied to a wide range of cases, but each must be adapted to the specific usage context. They are powerful design aids, as they give websites and applications a conventional look and feel. They are a quick way to create an interface that can solve a problem faced with a specific user environment.
Author Contributions
Conceptualization, M.R.; methodology, G.K. and M.R.; software, G.K. and S.B.; formal analysis, G.K.; data curation, G.K. and S.B.; writing—original draft preparation, G.K.; writing—review and editing, S.B. and M.R.; visualization, G.K.; supervision, M.R.; funding acquisition, S.B. All authors have read and agreed to the published version of the manuscript.
Funding
The present work was partially financially supported by the «Andreas Mentzelopoulos Foundation».
Data Availability Statement
The raw data collected by the survey are available upon request to the corresponding author.
Conflicts of Interest
The authors declare no conflicts of interest.
References
- Ryan, D. Understanding Digital Marketing: A Complete Guide to Engaging Customers and Implementing Successful Digital Campaigns; Kogan Page Publishers: London, UK, 2020. [Google Scholar]
- Kotler, P.; Keller, K.L. Marketing Management, 16th ed.; Pearson: London, UK, 2021; Available online: https://www.pearson.com/content/one-dot-com/one-dot-com/se/en/Nordics-Higher-Education/subject-catalogue/marketing/Kotler-Keller-Marketing-Management-Global-Edition-16e.html (accessed on 10 March 2024).
- Chaffey, D.; Ellis-Chadwick, F. Digital Marketing; Pearson: London, UK, 2019. [Google Scholar]
- What Is Digital Advertising? 7 Types of Digital Advertising. 2024. Available online: https://www.masterclass.com/articles/digital-advertising (accessed on 10 March 2024).
- Idgadvertising. Types of Digital Advertising. IDG Advertising. Available online: https://idgadvertising.com/types-of-digital-advertising/ (accessed on 10 March 2024).
- The 8 Main Types of Online Advertising. Available online: https://bow-now.com/media/column/types-of-ads (accessed on 10 March 2024).
- Pope, K. Interactive Video Ads: +66% More Engagement. KORTX. Available online: https://kortx.io/news/interactive-video-ads-technology/ (accessed on 10 March 2024).
- Billboard Advertising Terms and Definitions Glossary—Fliphound. Digital Billboards and Outdoor Advertising Have Never Been This Easy. Available online: https://fliphound.com/outdoor-billboard-advertising-ooh-industry-terms-and-definitions-glossary (accessed on 10 March 2024).
- Eye Tracking—Screen Based—iMotions. Available online: https://imotions.com/products/imotions-lab/modules/eye-tracking-screen-based/ (accessed on 10 March 2024).
- What Is Eye Tracking and How Does it Work?—iMotions. Available online: https://imotions.com/blog/learning/best-practice/eye-tracking-work/ (accessed on 10 March 2024).
- iMotions Lab—Human Behavior Research Platform. Available online: https://imotions.com/products/imotions-lab/ (accessed on 10 March 2024).
- Lai, M.-L.; Tsai, M.-J.; Yang, F.-Y.; Hsu, C.-Y.; Liu, T.-C.; Lee, S.W.-Y.; Lee, M.-H.; Chiou, G.-L.; Liang, J.-C.; Tsai, C.-C. A review of using eye-tracking technology in exploring learning from 2000 to 2012. Educ. Res. Rev. 2013, 10, 90–115. [Google Scholar] [CrossRef]
- Gidlöf, K.; Wallin, A.; Dewhurst, R.; Holmqvist, K. Using Eye Tracking to Trace a Cognitive Process: Gaze Behaviour During Decision Making in a Natural Environment. J. Eye Mov. Res. 2013, 6, 1. [Google Scholar] [CrossRef]
- Raptis, G.E.; Katsini, C.; Belk, M.; Fidas, C.; Samaras, G.; Avouris, N. Using Eye Gaze Data and Visual Activities to Infer Human Cognitive Styles: Method and Feasibility Studies. In UMAP ’17, Proceedings of the 25th Conference on User Modeling, Adaptation and Personalization, Bratislava, Slovakia, 9–12 July 2017; Association for Computing Machinery: New York, NY, USA, 2017; pp. 164–173. [Google Scholar] [CrossRef]
- Xenos, M.; Rigou, M. Teaching HCI Design in a Flipped Learning M.Sc. Course Using Eye-Tracking Peer Evaluation Data. arXiv 2019. [Google Scholar] [CrossRef]
- Ashraf, H.; Sodergren, M.H.; Merali, N.; Mylonas, G.; Singh, H.; Darzi, A. Eye-tracking technology in medical education: A systematic review. Med. Teach. 2018, 40, 62–69. [Google Scholar] [CrossRef]
- Rejer, I.; Jankowski, J. Brain activity patterns induced by interrupting the cognitive processes with online advertising. Cogn. Process. 2017, 18, 419–430. [Google Scholar] [CrossRef] [PubMed]
- Lee, J.; Ahn, J.-H. Attention to banner ads and their effectiveness: An eye-tracking approach. Int. J. Electron. Commer. 2012, 17, 119–137. [Google Scholar] [CrossRef]
- Hong, W.; Cheung, M.Y.; Thong, J.Y. The Impact of Animated Banner Ads on Online Consumers: A Feature-Level Analysis Using Eye Tracking. J. Assoc. Inf. Syst. 2021, 22, 204–245. [Google Scholar] [CrossRef]
- Zha, W.; Wu, H.D. The Impact of Online Disruptive Ads on Users’ Comprehension, Evaluation of Site Credibility, and Sentiment of Intrusiveness. Am. Commun. J. 2014, 16, 15–28. [Google Scholar]
- Thota, S.; Song, J.H.; Larsen, V. Do Animated Banner Ads Hurt Websites? The Moderating Roles of Website Loyalty and Need for Cognition. 2010. Available online: https://repository.usfca.edu/ml/9/ (accessed on 10 March 2024).
- McCoy, S.; Everard, A.; Loiacono, E.T. Online ads in familiar and unfamiliar sites: Effects on perceived website quality and intention to reuse. Inf. Syst. J. 2009, 19, 437–458. [Google Scholar] [CrossRef]
- Fessenden, T. The Most Hated Online Advertising Techniques. Available online: https://www.nngroup.com/articles/most-hated-advertising-techniques/ (accessed on 24 May 2022).
- Nielsen, J. The Most Hated Advertising Techniques (Original Research). Available online: https://www.nngroup.com/articles/most-hated-advertising-techniques-2004/ (accessed on 24 May 2022).
- Rigou, M.; Sirmakessis, S.; Panagiotarou, A.; Balaskas, S.; Rigou, M.; Sirmakessis, S.; Panagiotarou, A.; Balaskas, S. Online Ads Annoyance Factors: A Survey of Computer Science Students; IntechOpen: Rijeka, Croatia, 2023. [Google Scholar] [CrossRef]
- Smith, K.T. Digital marketing strategies that Millennials find appealing, motivating, or just annoying. J. Strateg. Mark. 2011, 19, 489–499. [Google Scholar] [CrossRef]
- Zeng, E.; Kohno, T.; Roesner, F. What Makes a “Bad” Ad? User Perceptions of Problematic Online Advertising. In Proceedings of the 2021 CHI Conference on Human Factors in Computing Systems, Yokohama, Japan, 8–13 May 2021; pp. 1–24. [Google Scholar]
- O’Donnell, K.; Cramer, H. People’s perceptions of personalized ads. In Proceedings of the 24th International Conference on World Wide Web, Florence, Italy, 18–22 May 2015; pp. 1293–1298. [Google Scholar]
- Kim, J.K.; Seo, S.H. An exploration of advertising avoidance by audiences across media. Int. J. Contents 2017, 13, 76–85. [Google Scholar]
- Tidwell, J. Designing Interfaces: Patterns for Effective Interaction Design; O’Reilly Media, Inc.: Sebastopol, CA, USA, 2010. [Google Scholar]
- Borchers, J.O. A pattern approach to interaction design. In DIS ’00, Proceedings of the 3rd Conference on Designing Interactive Systems: Processes, Practices, Methods, and Techniques, New York, NY, USA, 17–19 August 2000; Association for Computing Machinery: New York, NY, USA, 2000; pp. 369–378. [Google Scholar] [CrossRef]
- Mathur, A.; Kshirsagar, M.; Mayer, J. What Makes a Dark Pattern…Dark? Design Attributes, Normative Considerations, and Measurement Methods. In CHI ’21, Proceedings of the 2021 CHI Conference on Human Factors in Computing Systems, Yokohama, Japan, 8–13 May 2021; Association for Computing Machinery: New York, NY, USA, 2021; pp. 1–18. [Google Scholar] [CrossRef]
- Gray, C.M.; Kou, Y.; Battles, B.; Hoggatt, J.; Toombs, A.L. The Dark (Patterns) Side of UX Design. In CHI ’18, Proceedings of the 2018 CHI Conference on Human Factors in Computing Systems, Montreal, QC, Canada, 21–26 April 2018; Association for Computing Machinery: New York, NY, USA, 2018; pp. 1–14. [Google Scholar] [CrossRef]
Disclaimer/Publisher’s Note: The statements, opinions and data contained in all publications are solely those of the individual author(s) and contributor(s) and not of MDPI and/or the editor(s). MDPI and/or the editor(s) disclaim responsibility for any injury to people or property resulting from any ideas, methods, instructions or products referred to in the content. |
© 2024 by the authors. Licensee MDPI, Basel, Switzerland. This article is an open access article distributed under the terms and conditions of the Creative Commons Attribution (CC BY) license (https://creativecommons.org/licenses/by/4.0/).