Article

Tracing Student Activity Patterns in E-Learning Environments: Insights into Academic Performance

by
Evgenia Paxinou
1,*,
Georgios Feretzakis
1,
Rozita Tsoni
1,
Dimitrios Karapiperis
2,
Dimitrios Kalles
1 and
Vassilios S. Verykios
1,*
1
School of Science and Technology, Hellenic Open University, 26335 Patras, Greece
2
School of Science and Technology, International Hellenic University, 57001 Thermi, Greece
*
Authors to whom correspondence should be addressed.
Future Internet 2024, 16(6), 190; https://doi.org/10.3390/fi16060190
Submission received: 30 April 2024 / Revised: 22 May 2024 / Accepted: 28 May 2024 / Published: 29 May 2024

Abstract

:
In distance learning educational environments like Moodle, students interact with their tutors, their peers, and the provided educational material through various means. Due to advancements in learning analytics, students’ transitions within Moodle generate digital trace data that outline learners’ self-directed learning paths and reveal information about their academic behavior within a course. These learning paths can be depicted as sequences of transitions between various states, such as completing quizzes, submitting assignments, downloading files, and participating in forum discussions, among others. Considering that a specific learning path summarizes the students’ trajectory in a course during an academic year, we analyzed data on students’ actions extracted from Moodle logs to investigate how the distribution of user actions within different Moodle resources can impact academic achievements. Our analysis was conducted using a Markov Chain Model, whereby transition matrices were constructed to identify steady states, and eigenvectors were calculated. Correlations were explored between specific states in users’ eigenvectors and their final grades, which were used as a proxy of academic performance. Our findings offer valuable insights into the relationship between student actions, link weight vectors, and academic performance, in an attempt to optimize students’ learning paths, tutors’ guidance, and course structures in the Moodle environment.

1. Introduction

Over the past few decades, the field of higher education has undergone two noteworthy transformations: a change in the interaction between tutors and students and a shift in the media employed for disseminating new information [1]. Regarding the first transformation, learners are no longer passive recipients merely listening to teachers’ lectures. Presently, teachers assume an orchestrating role, while learners actively construct their knowledge through a self-directed learning path. Nowadays, students enrolled in a distance education program follow an autonomous learning path that depends on their institutional LMS [2,3,4,5,6]. In the dynamic landscape of education, a Learning Management System (LMS) exceeds traditional forums, embracing various interactive elements such as quizzes, assignments, class discussions, announcements, and reading materials. Together, these components serve as a rich source of educational interaction, each contributing uniquely to the learning process [7,8,9]. Monitoring these interactions and understanding LMS users’ preferences is crucial for decision-making in resource allocation, platform improvements, and engagement strategies within courses. Identifying users’ transition preferences within an LMS involves distinguishing between explicit and implicit preferences [10]. Due to the absence of explicit ratings, we monitored implicit ratings through users’ interactions with Moodle. Analyzing user browsing patterns throughout a course provides insights into online learning environment dynamics [11,12]. Datasets derived from student participation in educational environments are powerful tools for researchers, facilitating the discovery of hidden patterns through analytics techniques [13,14]. In our study, we aim to present students’ action sequences within their institutional LMS, Moodle. The study involved 153 participants who attended an English-speaking postgraduate program in Data Science at the Hellenic Open University. The participants were all enrolled in the same module, focused on Data Science.
To analyze these action sequences in Moodle, we utilized a Markov Chain Model, a valuable model for analyzing data where sequences matter [15,16,17]. While Hidden Markov Chain Models have been used to model students’ actions regarding engagement in the learning process, we opted for a Markov Chain Model to focus on observable events occurring in Moodle, rather than unobservable influences. Events (states) in Moodle include viewing or downloading a folder, visiting the academic schedule, submitting an assignment, completing a quiz, etc. Transition matrices were constructed based on users’ transitions in Moodle from one event to another to identify steady states and the principal eigenvector, indicating long-term state probabilities. By tracing students’ self-directed learning paths, our primary aim was to identify states and transitions that significantly impact users’ final grades, which were used as a proxy of their academic performance. By calculating each student’s eigenvector, an innovative approach that encapsulates the probabilities of being in specific states, we aimed to explore potential correlations between these states and their final grades. Although we used many different metrics, we did not find statistically significant correlations. Nonetheless, the aim of our study was to propose a new research strategy that can be easily used, even in very large courses, to investigate these patterns and better understand students’ engagement and its potential impact on their final grades. This research contributes to the broader understanding of student interactions with online learning platforms and informs future studies and interventions aimed at enhancing educational outcomes.

2. Theoretical Background

While autonomous and self-directed learning (SDL) seems to have early roots [18,19], it was Allen Tough who brought it to the forefront of educational research in 1971 [20]. Following Tough, researchers such as Knowles [21], Moore [22], and Brookfield [23] defined autonomous and SDL as the process where the learners determine the pace and the path of their learning procedure and are responsible for their progress in a course. In the 1990s, efforts to define autonomy in learning revealed two distinct dimensions: the first dimension involves the process in which the learners are the leaders in executing and evaluating their educational path, with the educational institution possibly playing a facilitating role; the second dimension, refers to the autonomous learners’ profile and focuses on their desire to take responsibility for their learning [18,24]. A literature review has suggested that the degree of autonomy and the effectiveness of the students’ SDL path is directly influenced by the characteristics of the educational framework to which they belong. In the year 2000, Pintrich introduced the social cognitive model, which is the most widely embraced theoretical framework for assessing self-regulated learning [25,26]. This model suggests that learners’ motivation, cognitive functions, and strategies for self-regulated learning may vary based on the contextual features of the learning environment and the characteristics of the learning tasks. Consequently, external factors, such as course designs and Learning Management System (LMS) layout, have the potential to either facilitate or impede self-directed learning processes [27], subsequently influencing academic performance [26]. Researchers in learning analytics frequently gather and analyze trace data to comprehend students’ learning behaviors by observing their navigation through courses, accessing resources, attempting quizzes, and completing assignments in their LMS [28]. The trace data collected from the learners’ navigations are often associated with the learners’ performance [29]. Studies indicate that learners who consistently engage with the learning environment often demonstrate higher academic achievement and stronger self-regulation [30]. Based on established research in online learning, there are advantages to integrating trace data from LMS logs for learner profiling [31,32].
In the field of learning analytics, many studies have employed prediction techniques to establish learner profiles, correlate them with academic performance, and subsequently apply modern pedagogical strategies to support or address learner requirements. Markov model-based techniques prove to be valuable for analyzing data where sequence plays a crucial role. Extensive research has explored Markov Chain Models in various contexts, including predicting enrollments in education systems, forecasting students’ performance in laboratory courses, modeling teachers’ decision-making processes, and analyzing genetic algorithms [16,17]. Marques and Belo [33] investigated the application of Markov chains in creating user profiles on eLearning-oriented web platforms in Portugal. They identified common patterns students follow when navigating through virtual learning environments containing educational resources. Their findings suggested that by analyzing user navigation patterns, coordinators and tutors can tailor platforms to better meet students’ preferences and behaviors, thereby enhancing navigation and responsiveness to their needs. Similarly, [34] examined e-book reading patterns among students using Markov Chains, indicating potential for intervention systems for at-risk students through transition data and visualizations to evaluate content utilization.
Moreover, Boumi and Vela compared the standard six-year graduation rate method with a Markov Chain Model for estimating graduation rates in American universities [35]. They proposed a regularly updating multi-level absorbing Markov chain (RUML-AMC) approach to mitigate bias and reduce estimation variation. Tedeschi et al. underscored the effectiveness of a Markov model in estimating graduation rates for underrepresented minority and first-generation students, addressing challenges related to small sample sizes and data requirements [36]. Furthermore, Yuan employed a Markov Chain Model to enhance classroom teaching quality evaluation in universities, proposing an improved hybrid evaluation method and conducting comparative experiments to promote continuous improvement in teaching standards and overall educational quality [37]. Zammarchi, Frigau and Mola evaluated the web usability of a University in Italy website using eye tracking data, utilizing Markov chain analysis to study transitions between different areas of interest and suggesting areas for improvement in web usability based on fixation counts and the Markov chain analysis [38]. Paxinou et al. investigated how virtual simulations enhance learning outcomes in science labs in a Greek University using a Markov Chain Model to predict students’ performance, proposing that learners trained with virtual reality exhibit higher proficiency in conducting experiments compared to traditional methods [39]. Fraoua and David optimized the learning path in an online course using a Markov Chain Model, observing that learners were bored and as a result they dropped out of their courses [40].
Although the studies above exemplify the use of a Markov Chain Model in an educational or other setting, to our knowledge no other studies were based on a Markov Chain Model to identify which resources enhance the academic achievements within distance learning.

3. Methodology and Results

3.1. The Participants and Their Log Files

We conducted an analysis, using a Markov Chain Model to explore the connections among students’ transitions in Moodle and their final grades, aiming to offer recommendations for enhancing students’ academic performance. This research comprised 153 first-year postgraduate students participating in a yearly module within an English-speaking Postgraduate Program focused on Data Science at the Hellenic Open University during the academic year 2021–2022. The module specifically addresses topics such as Linear Algebra, Calculus, and Statistics and Probabilities.
The module, with the 153 enrolled students, featured a central module forum alongside individual forums for each class, with eight classes making up the entire module. All students were required to submit five written assignments and five quizzes. Quizzes were designed to assess students’ understanding of the material and provide practice opportunities, whereas assignments evaluated students’ comprehension and application of the module content through practical tasks and projects. All students were provided with the same main and supplementary educational material, ensuring consistency in learning. Adhering to a unified academic schedule, all students also participate in a final exam and, if necessary, a re-sit exam on the same designated dates, promoting a synchronized academic experience across the module. The students’ interaction with the LMS depended significantly on the structure and variety of course components. Given the diversity and quantity of components, the probability of students visiting each space is unequal. This structure encourages a more comprehensive engagement with various course elements, potentially leading to diverse learning paths and interactions.
The Hellenic Open University utilizes the Moodle platform for its online portal, which facilitates the dissemination of course materials, assignments, and quizzes and fosters discussions through forums. All 153 students enrolled in the module were registered users on Moodle. Log files were extracted in .CSV format, documenting students’ actions within the learning environment. Actions attributed to tutors and administrators were intentionally omitted from the analysis to ensure that the focus remained solely on student interactions. Specifically, we excluded any log entries that involved content creation, course management, grading, and any other administrative or instructional activities. Additionally, any automated system actions, such as system maintenance logs or auto-generated notifications, were also excluded. This approach ensures that the data analyzed reflects only the direct interactions of students with the Learning Management System. Each row in the .CSV file represented a specific student action, providing detailed information such as time, event content, event name, and origin (see Table 1). Entries corresponding to students who minimally engaged in the module’s learning activities (e.g., no submission of assignments or quizzes) were excluded from the .CSV file.
In the extracted data, the column affected user is almost empty, suggesting that most logged events are direct actions performed by users themselves, rather than actions that affect other users. The column event context provides specific information about the context within which an event occurred in the Moodle environment. It typically includes details such as the location or activity within Moodle where the event took place. For instance, it might specify the course, module, forum, quiz, or any other relevant component where the action occurred. The event context helps us to understand the setting of the event within the Moodle platform. The column component seems to categorize the part of the system where the event occurred, like forum, whereas the column event name describes the type of the event, such as discussion viewed. The column description provides context-specific details about the event itself, helping to interpret its significance. For example, in the column description we can see the retrieved phrase “The user with ID ‘Χ’ has viewed the discussion with ID ‘276876’ in the forum with course module ID ‘Z’”. The column origin indicates how the event was initiated with entries like web, suggesting these actions were performed through a web interface. The IP address column shows the IP address of the user who performed the action, which can be used for tracking or security purposes. Overall, the .CSV file is a detailed log of user activities, in an educational context, tracking interactions with different components of an online course system.
The provided data were processed and a new .CSV file was produced. The new .CSV file was more personalized as each row presented a sequence of events in ascending order of time, performed by each student during the academic year, separated by semicolons. At this point, it is notable that the various and numerous events that occurred in Moodle were previously grouped into seven states: Assignment, Course, Folder, Forum, Glossary, Other, and Quiz.
The Assignment state involves tasks related to assignments, including viewing, downloading, uploading responses, and checking grades for assignments. The Course state refers to activities associated with navigating the main page of the course. In the Folder state students can access folders containing various materials such as slides, exam subjects from previous years, or past homework assignments. In the Forum state students can engage in forum discussions, initiate or participate in conversations, and read announcements and news posted by instructors. The Glossary state allows students to access the academic schedule and educational materials. In the Other state students may encounter activities related to assigning certificates or engaging in testbed-focused tasks. Finally, in the Quiz state students can interact with quizzes by viewing them, submitting attempts, and reviewing their performance in past quiz attempts. As a result, the sequences presented in the new .CSV file were a combination of the seven states, as above.
It is important to highlight that if a student had not been engaged in a particular state, like never downloading a file, the sequence of events omitted the Folder state. This pattern of behavior, reflected in the sequence of states, is represented through a Markov Chain Model and is thoroughly explained in the subsequent section.

3.2. The Markov Chain Model, the Graphs, and the Eigenvectors

3.2.1. The Markov Chain Model
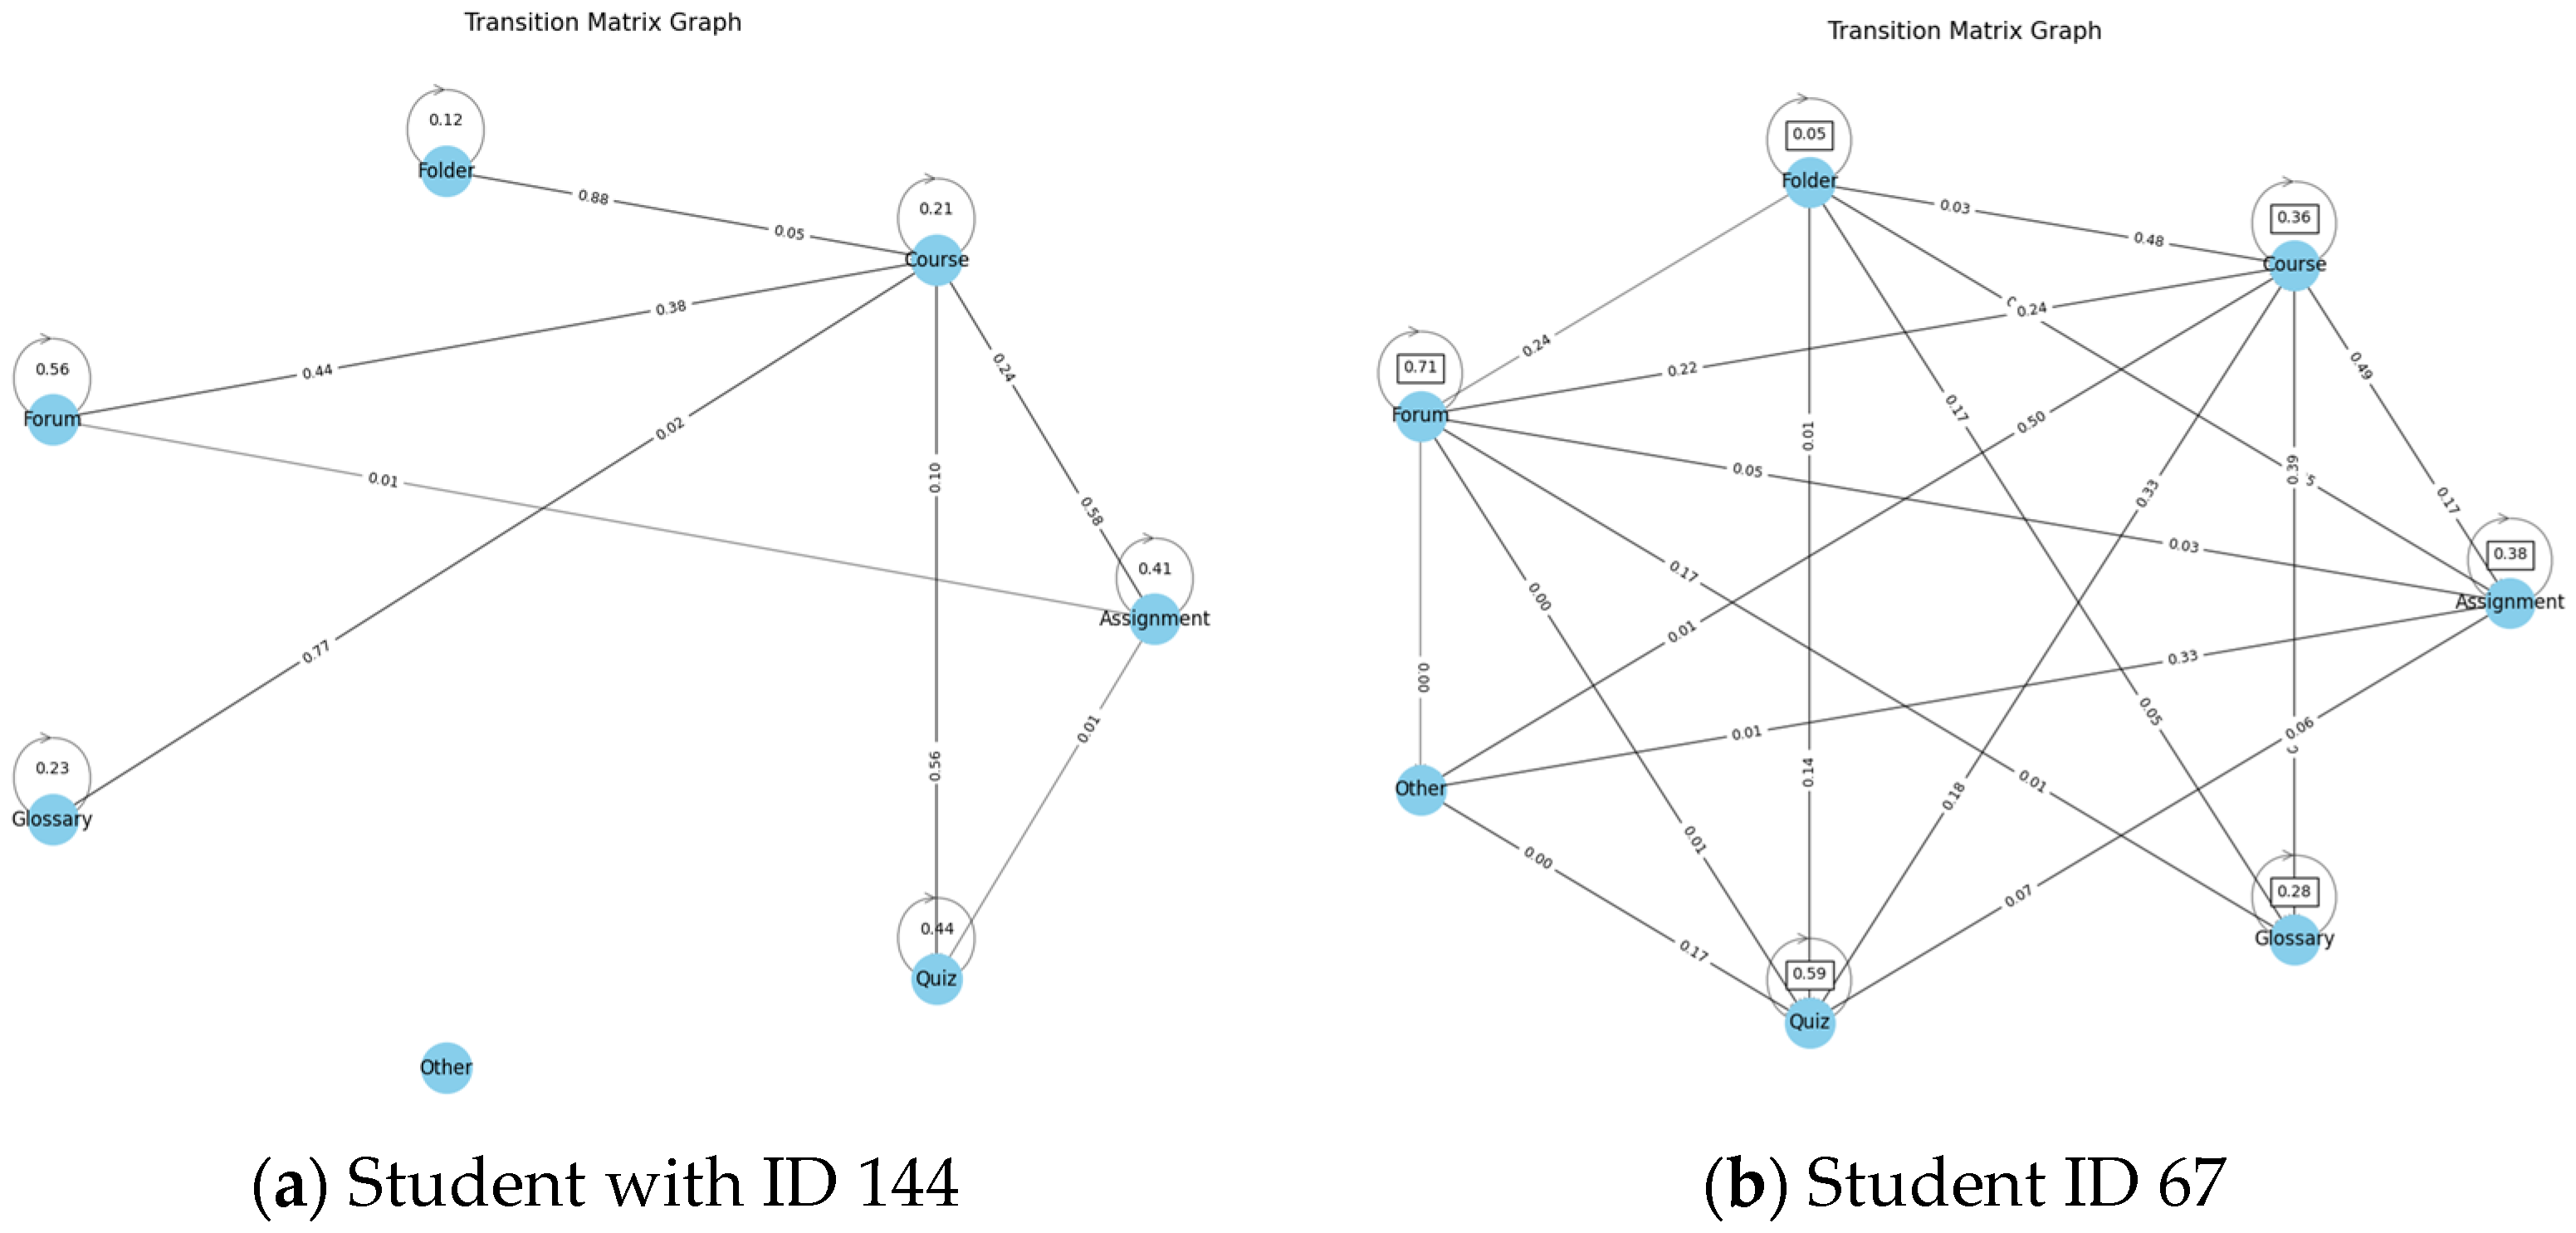
As mentioned in the previous section, sequences were generated as each user progressed through various states, forming their sequence of events. Changes observed in the states across the sequence are termed transitions, with associated probabilities known as transition probabilities. The code employed iterates through each sequence in the dataset, capturing the transition from one state to another along with its probability. This process effectively constructs and utilizes a Markov Chain Model to represent state transitions based on data-derived probabilities. These transition probabilities were then used to populate a transition matrix. Multiple transition matrices were generated, representing the behavior of each individual participant (e.g., student with ID 144—Table 2).
In that matrix, each row signifies the starting state, while each column represents the ending state. The values within the cells indicate the probability of transitioning from the starting state to the ending state. Table 2 presents a row stochastic matrix, where the entries in each row signify probabilities, and the sum of probabilities in each row equals 1. These probabilities indicate the likelihood of transitioning from one state to another for a particular user. For instance, for a student with ID 144, the probability of transitioning from Course to Assignment is 0.23956 and from Glossary to Course is 0.76923. Many transition probabilities for this specific user are zero as there is no observed movement between those specific states for that students. Similar probability matrices are constructed for every student, thus facilitating our analysis thereafter.

3.2.2. The Graphs

A graphical representation of the state transitions within the Markov chain of this study is depicted in Figure 1. In a Markov chain, each state signifies a specific event or condition (such as Forum, Assignment, Folder, etc.) that a user can be in. Students move from one event (state) to another based on certain probabilities. These transitions adhere to the rules of the Markov process, wherein the probability of transitioning to the next event depends solely on the current event and not on the sequence of events preceding it. The visual depiction of state transitions aids in comprehending the dynamics and probabilities of transitions between different states (events) within the learning environment. Indicatively, Figure 1a provides a graph with an overview of the probabilities of the student with ID 144 transitioning between different parts of Moodle, showcasing the student’s engagement in Moodle during an academic year.
Figure 1a depicts a simple graph, clearly showing that the student with ID 144 was connected to Moodle for the strictly necessary procedures in their learning process in the specific course. They seem to be quite an inactive student based on his transition behavior. More specifically, in this graph, there is a high probability of transitioning from Assignment to Course (0.58), suggesting that after completing an assignment, users are likely to move to a Course state. Similarly, from Folder there is a high probability of transitioning to Course (0.88). Some sections have probabilities of transitioning to themselves, such as Quiz (0.44), indicating the student might frequently revisit or remain within the Quiz environment. Some transitions have zero probabilities, indicating that certain states do not lead to others. For example, there are no transitions from Assignment to any other section except Course and Quiz. Certain states have relatively high probabilities of transitioning to multiple other states. For instance, Forum has a relatively high probability of transitioning to both Course and itself. Some sections, like Other, have no defined transitions, suggesting they might serve as endpoints or isolated sections within Moodle. Figure 1b corresponds to an active student who moved frequently between all the states in Moodle during the academic year. All the aforementioned knowledge on students’ behavior concerning Moodle may be correlated to their successful learning progress or lack thereof, a task we aim to undertake in the following subsections through the calculation of the eigenvectors of the students’ transition probability matrices and of specific metrics.

3.2.3. The Eigenvectors

To identify the eigenvector associated with the primary eigenvalue of the transition probability matrices, linear algebra was employed. In Markov chains, the principal eigenvalue of a transition matrix generally equals 1, and its corresponding eigenvector reveals the steady-state probabilities of the chain. Consequently, over time, the likelihood in each state converges towards the values specified by this eigenvector, irrespective of the starting state. For instance, the eigenvector of the transition probability matrix for the student with ID 67 (the related graph is presented in Figure 1b), is [0.13056, 0.33838, 0.01848, 0.30592, 0.01582, 0.00526, 0.18558] mapped to list [Assignment, Course, Folder, Forum, Glossary, Other, Quiz]. The output lists the states sorted by their steady-state probabilities. For example, if we take into consideration this student, Course has the highest steady-state probability of approximately 0.34. Forum follows with a probability of about 0.31, and so on. The significance of these probabilities is that, given a large number of transitions (or as time approaches infinity, in a theoretical sense), the student will spend approximately these percentages of time in each respective state.
For example, the state labeled “Other”, with an almost negligible probability, represents the scenario where the student is least likely to be found in the long term, typically involving engagement with testbed-focused activities. This analysis provides valuable insights into which events are likely to be the predominant or most common states over time for all students, as per the model. Such insights can serve as valuable tools for enhancing user engagement within Moodle and for refining instructional design strategies. In the case of the student with ID 67, as mentioned above, potential actions could include placing the icon for testbed activities in a more prominent location within Moodle or increasing reminders about their existence through frequent email notifications.

3.3. Students’ Targeted Navigation in Moodle and Final Grades

In this study, the main aim was to correlate the learning path that students can follow by navigating the Learning Management System, provided by the institute, and their academic performance. We explored how eigenvectors might encode forum engagement, including the distribution of a student’s participation over time—whether it is consistently maintained or concentrated within certain periods. These elements could influence a student’s interaction with course content and, consequently, their overall academic performance. By examining these vectors alongside module grades, we aimed to reveal insights into the role of online forum participation in academic success. Figure 2 demonstrates the distribution of the students’ final grades in the specific module for the academic year 2021–2022. According to this graph, the students’ performance is at a very satisfactory level, since there is a high concentration of grades around 8 to 10, with fewer grades below that range (mean average 7.91 ± 1.34).
To further illustrate our methodology, we chose an indicative sample, comprising five students with the highest final grades and five students with the lowest final grades in the module. Table 3 displays their final grades, their eigenvectors, as well as the maximum and minimum probabilities observed within these eigenvectors.
All ten students exhibited the highest likelihood of being in the Course state, followed by the Forum state, which had the second highest probability. Upon closer examination of the eigenvectors of all students, these findings were further supported.
Figure 3 illustrates scatter plots, demonstrating the trend and the relationship between the Course and the Glossary state and the students’ final grade. We chose these two states as they appear to exhibit the highest and lowest probabilities of student engagement in Moodle.
It is noteworthy that, although being in the Glossary state involves accessing the educational material, the possibility of visiting this resource seems to be extremely low (with the highest probability value being around 0.059). This very low probability of visiting these resources could imply that students are not engaging with or utilizing the Glossary feature, effectively. This could suggest a lack of interest in or understanding of the educational materials available in the glossary, or perhaps they are obtaining the necessary information from other sources. Additionally, it could indicate a need for further clarification or promotion of the Glossary as a valuable resource for learning within the Moodle platform. Regardless of their academic performance level, students seem to be indifferent to engaging with the study material. This data should be taken into consideration by both program designers and Moodle developers, given that the educational material and its interaction form the cornerstone of distance learning.

3.4. Final Grades and Other Metrics

Looking at both the data presented in Table 3 and Figure 3, it appears that the differences in probabilities within each state, between students with high and low performance in the Module, are relatively small. Although there were minor variations observed, these distinctions were not significant enough to clearly differentiate between high and low academic performance, based solely on the eigenvectors provided. To further examine correlations between state transitions and final grades, we also calculated measures such as the Frobenius Norm, the Entropy, the Euclidean Distance, and the Cosine Similarity.

3.4.1. Entropy

Entropy quantifies the degree of disorder or unpredictability in the sequence of transitions that students undergo from one state to another. When a student’s entropy is low, it implies that their navigation in Moodle follows a highly predictable pattern, devoid of randomness or uncertainty. Low entropy can be advantageous, suggesting that a student consistently performs well or adheres to a stable behavioral pattern. Such students possess clear objectives when navigating Moodle and do not wander aimlessly. However, low entropy may also signify a lack of diversity, which could be perceived as restrictive and undesirable, particularly in educational contexts that prioritize a variety of experiences and learning approaches.

3.4.2. Frobenius Norm

The Frobenius Norm serves as a measure of the overall change within a matrix, representing the transition probabilities between various states in a system, such as Moodle. A low Frobenius Norm value may suggest that the transition probabilities between different states (e.g., Assignment, Glossary, and Forum) are relatively similar, indicating minimal variation in the likelihood of a student transitioning from one state to another. This could imply that a student’s interaction pattern within Moodle is evenly distributed across different activities or resources, without a strong preference for any specific state. Alternatively, it could indicate that the student’s behavior within Moodle lacks discernible tendencies, resulting in a more uniform distribution of transition probabilities.

3.4.3. Euclidean Distance

The Euclidean Distance aids in quantifying the dissimilarity or similarity between students’ profiles based on their transitions and interactions within Moodle. A low Euclidean Distance suggests a higher degree of similarity between two student profiles, whereas a larger distance indicates greater dissimilarity. In our study, we assessed the level of similarity between each student’s profile and the mean student profile.

3.4.4. Cosine Similarity

In the context of students transitioning between states in Moodle, Cosine Similarity is employed to unveil the similarity between two student profiles, based on their transitions within the platform. In our study, we intend to compute the cosine of the angle between two vectors representing each student’s profile and the mean student profile in a 7-dimensional space. Each dimension of the vector corresponds to a specific state within Moodle (such as Folder, Forum, Quiz, Assignment, etc.). The cosine similarity gauges the cosine of the angle between these vectors, which ranges from −1 to 1.

3.5. Correlation between Final Grades and Other Metrics

Table 4 presents the values of the metrics presented above for the five indicatively selected students. More analytically, Table 4 presents each student’s final grade, Entropy, and Frobenius Norm. It also includes the Euclidean Distance between each student and the mean student profile, as well as the Cosine Similarity of pairs of vectors (student’s profile vector and mean student profile vector).
Table 5 presents the mean averages of students’ final grades, as well as the mean averages of the metrics presented above.
From the data provided in Table 4 and Table 5, we can draw some indicative conclusions:
(a)
Students achieving higher grades (e.g., ID 23 or ID 39) exhibit elevated Entropy, potentially indicating a natural inclination towards curiosity and exploration. This tendency may lead them to explore a broader array of learning materials and engage in diverse discussions or activities within Moodle. These actively involved students, who participate in discussions, complete quizzes, and access supplementary materials, may contribute to increased Entropy values. However, their active engagement in the learning process could also enhance comprehension and retention of the material. On the other hand, the student with ID 142, despite having low performance (final grade 5.8 out of 10), exhibits a similar entropy value to that of high-performing students with ID 23 or 39. This observation could be attributed to the fact that students with low performance may navigate Moodle with a sense of exploration but without a clear direction or purpose. They may explore various resources, engage in discussions, or attempt quizzes without a focused approach, leading to higher entropy.
(b)
Student ID 153 exhibits the highest Frobenius Norm value. This suggests that the student has been significantly active within Moodle, involving numerous transitions between different states or engaging extensively with various resources and activities. Despite the high level of activity, the low grade may appear contradictory, but it could imply that the student is investing considerable effort or time without attaining satisfactory academic success. This randomness in behavior might potentially contribute to the lower grade if it results in a lack of focus or ineffective study habits.
(c)
Although some students achieve high final grades (e.g., students with ID 23 or 39), they do not exhibit similar Euclidean Distance values. This discrepancy could stem from students attaining comparable grades through diverse learning strategies or approaches to utilizing Moodle. Certain students may heavily rely on specific features or resources within Moodle that closely align with average student behavior, resulting in low Euclidean Distances. Conversely, other students may adopt unconventional or personalized learning strategies, leading to profiles significantly divergent from the mean and with consequently high Euclidean Distances, despite achieving similarly high grades.
(d)
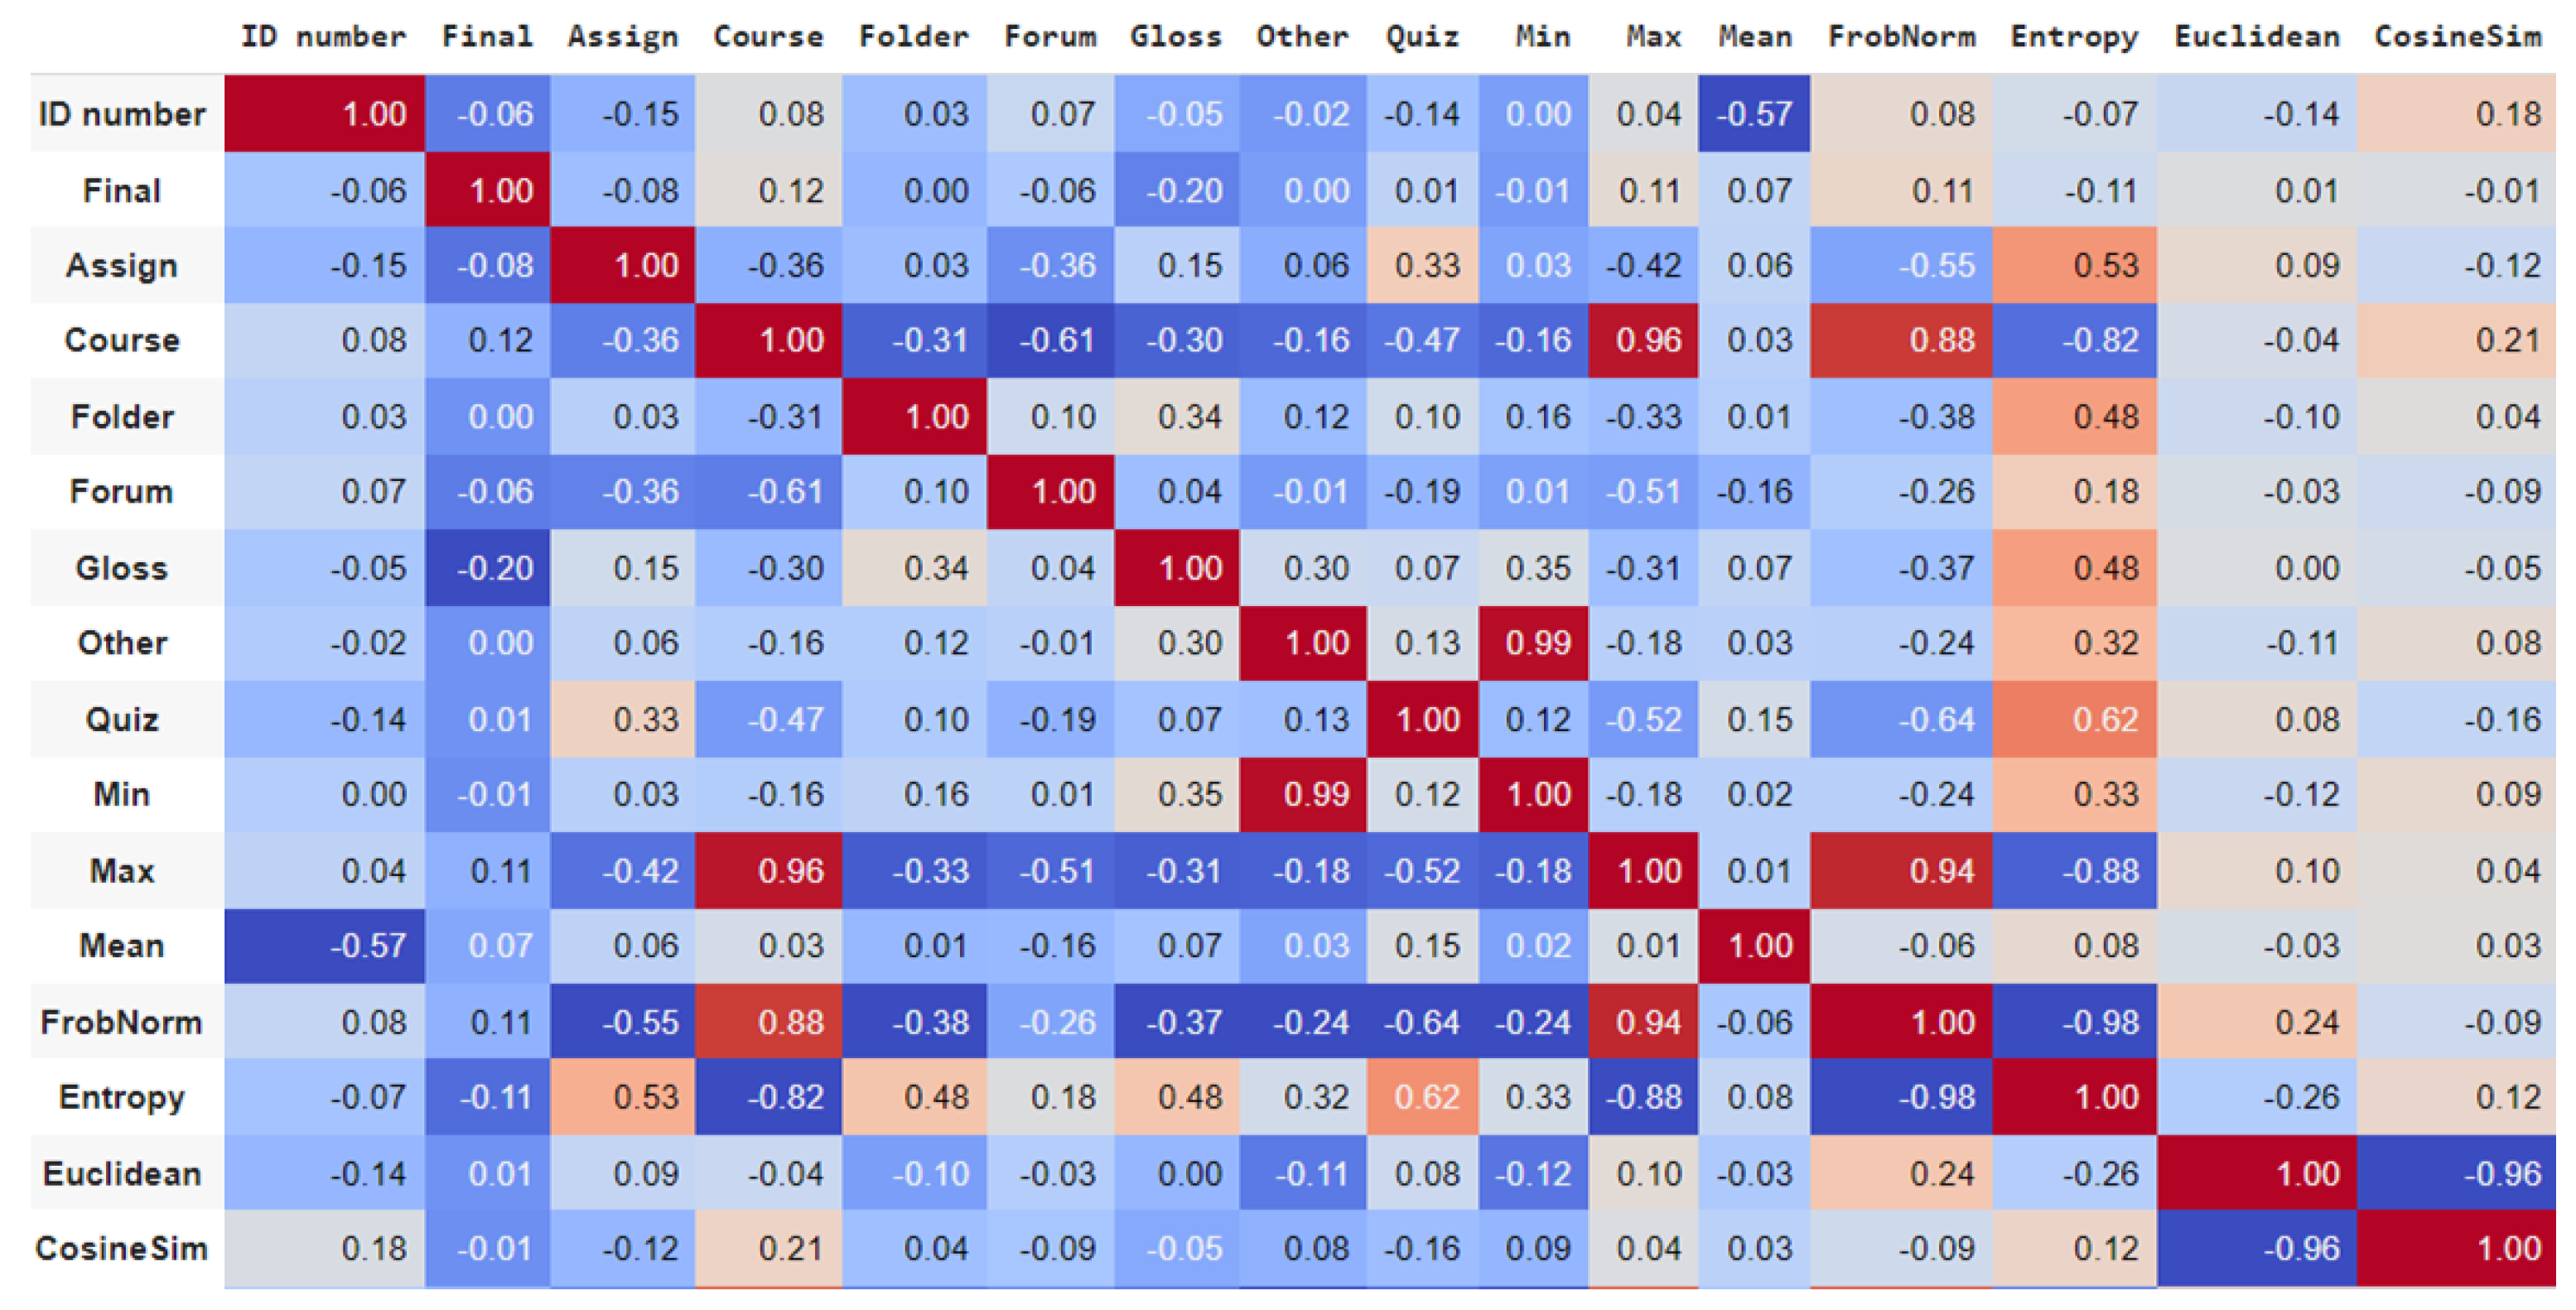
Upon reviewing the provided data, it becomes apparent that all students display relatively high Cosine Similarity values, ranging from approximately 0.96576 to 0.99713. While there are slight variations among the Cosine Similarity values of different students, they all remain close to 1, indicating a strong resemblance between each student’s profile vector and the mean student profile vector in the 7-dimensional space. Similar values were calculated for all students. Contradictory and unexpected data reflect the complex and diverse ways in which students engage with Moodle and achieve academic success. As a result, further correlation analysis of individual student profiles and behavior patterns was scheduled to better understand the underlying factors and determine the correlations between students’ final grades and all the measures associated with transitions within Moodle.
Figure 4 is a heatmap that demonstrates the correlation between final grades and all the measures provided in this study (warmer colors, like red, indicate positive correlations, while cooler colors, like blue, indicate negative correlations). It is evident that there is no strong correlation between the students’ final grade and a specific state in Moodle or the students’ final grade and a specific measure. For example, there is a moderately positive correlation between the state Quiz and Entropy (0.62), indicating that there is a tendency for students who engage in quiz activities within Moodle to exhibit a certain level of predictability or regularity in their navigation patterns within the platform. On the other hand, this result suggests a very weak or almost negligible relationship between these two variables. In other words, there is little to no association between a student’s performance and the probability of spending their learning time in the Quiz state.
Based on the above indications, it is important to note that correlation does not imply causation, so further analysis is needed to understand the underlying factors that support the context “final grade-navigation in Moodle”. In an attempt to provide some generalizations and to add more value to this research, the following insights could be drawn:
(i)
There appears to be a correlation between students’ engagement patterns within Moodle and their final grades. For example, students who exhibit higher levels of activity within the platform, as indicated by their transition probabilities and Frobenius Norm values, may not necessarily achieve higher grades. This suggests that, while it is important, engagement is not the sole determinant of academic success.
(ii)
Students achieving similar final grades may employ diverse learning strategies within Moodle. For instance, some students may explore a broader array of resources and activities (higher entropy), while others may have more focused navigation patterns. This diversity in strategies highlights the importance of catering to different learning preferences and providing varied learning materials within the platform.
(iii)
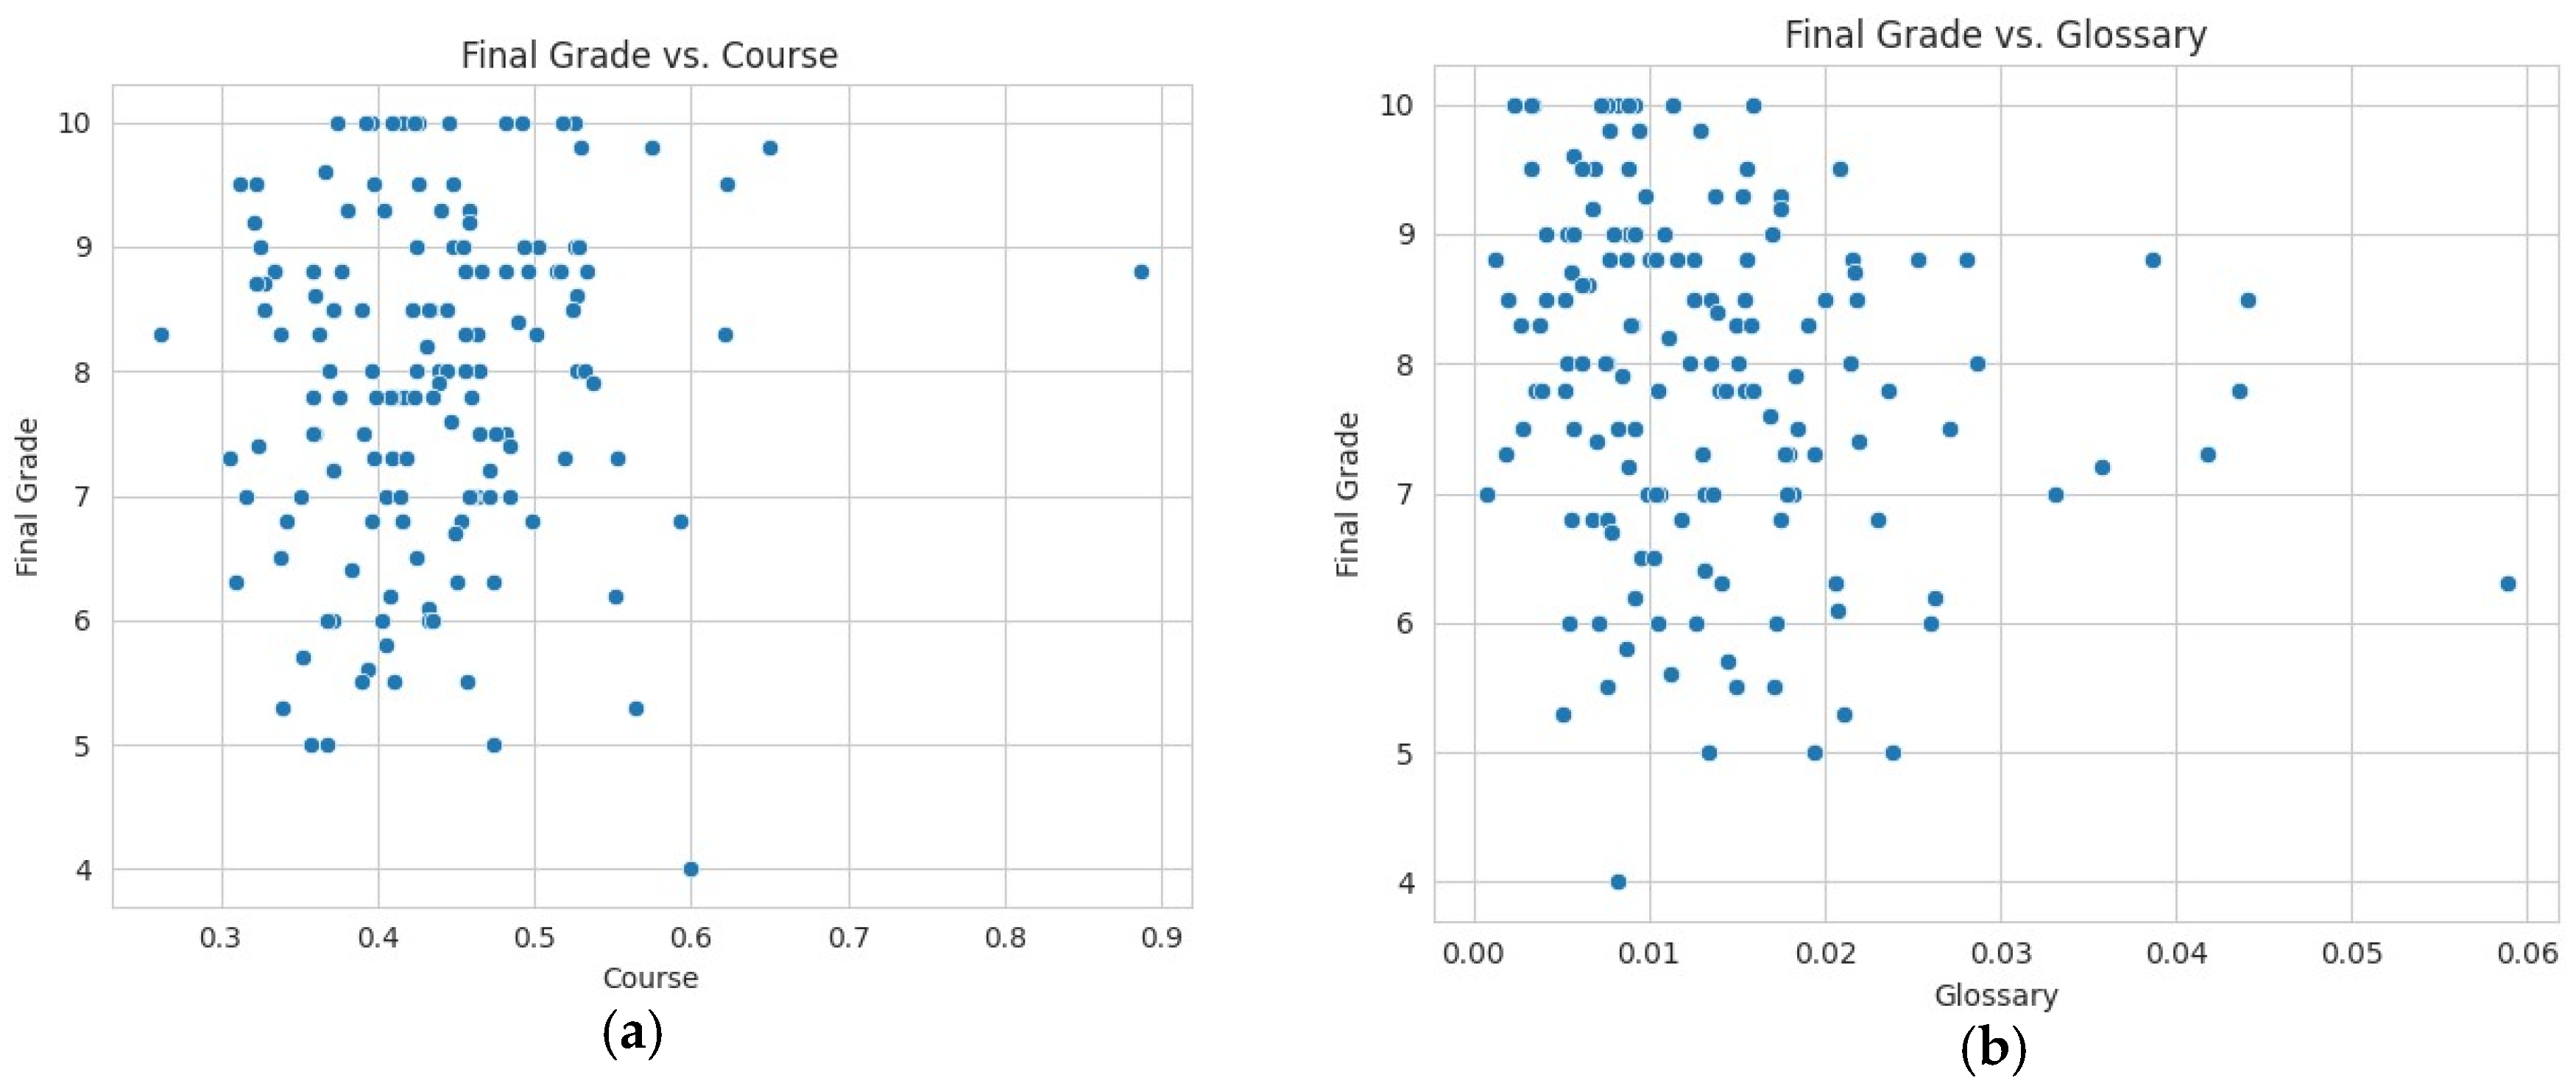
The low probability of visiting certain resources, such as the Glossary, indicates potential inefficiencies in how students utilize educational materials within Moodle. This could be due to a lack of awareness, interest, or clarity regarding the usefulness of these resources. Addressing these inefficiencies could improve overall students’ final grades.
(iv)
The analysis based on the above research strategy reveals the complexity and diversity of student behavior within Moodle. This complexity underscores the need for further research and analysis to better understand the underlying factors influencing student success in online learning environments.

4. Conclusions and Future Work

Moodle and similar platforms play a crucial role in facilitating educational interactions, offering various interactive elements such as quizzes, assignments, forums, and course material. These components serve as valuable resources for enhancing the learning process and improving student engagement. In this research, we concentrated on 153 postgraduate students enrolled in a specific module during the academic year 2021–2022, utilizing Moodle for their learning environment. Our analysis used the students’ log files to investigate their self-directed learning trajectories, aiming to establish correlations between the various states of these trajectories and their final grades in the module. Monitoring and understanding students’ interactions within Moodle are vital for informing decision-making processes related to resource allocation, platform improvements, and engagement strategies within courses.
This study employed Markov Chain Models to analyze students’ transition patterns within Moodle, focusing on observable events to identify significant states and transitions influencing the students’ final grade in the specific module. Correlation analysis was also performed to find insights into the relationship between students’ actions within Moodle and their final grades. The values of metrics such as Entropy, Frobenius Norm, Euclidean Distance, and Cosine Similarity were assessed to find students’ interaction patterns and their impact on academic success. Students achieving higher grades tended to exhibit elevated entropy, indicating a propensity towards curiosity and exploration within Moodle. However, this exploration may not always translate to academic success, as seen in cases where high activity levels are not accompanied by satisfactory grades. The correlation analysis revealed limited associations between specific states within Moodle and final grades. While certain correlations, such as between quiz activities and Entropy, demonstrate tendencies in student behavior, overall, the relationship between individual states and academic performance is weak. Based on the above summarized results, it seems essential to conduct further analysis to fully understand the underlying factors driving student performance within Moodle. Correlation does not imply causation, necessitating additional research to elucidate the complex relationship between student interactions and academic outcomes.
Regarding SDL, a concept often linked with adult education, our research provides some indications that individuals, by identifying their own needs and goals, shape their interaction with Moodle resources, accordingly [41]. Although many empirical results from recent studies demonstrate that SDL is positively associated with better academic performance, higher engagement, improved skill acquisition, and greater job performance [42], our study showed contradictory indications that do not always align with previous empirical results. For instance, Broadbent and Poon [26] found that self-regulated learning strategies, including regular quiz completion and forum participation, are associated with higher academic performance in online higher education environments. Similarly, Ainley and Patrick [7] emphasized the importance of regular assessment through quizzes in promoting engagement and reinforcing learning. Finally, Hrastinski [11] highlighted the significance of online participation and peer interaction in forums for enhancing learning outcomes and Li and Tsai [30] demonstrated that diverse interaction with learning materials, including accessing data files and completing assignments, contributes to better learning outcomes. In our study two notable observations emerged: students achieving higher grades tend to be active in navigating within Moodle. However, this exploration does not always translate to high final grades, as seen in cases where high activity levels are not accompanied by satisfactory learning outcomes.
Although further research plans should be designed, we believe that this study make a major contribution by composing a sophisticated analytical methodology and exploring diverse metrics to understand the multifaceted relationship between students’ interactions within online learning environments and their final grades. To advance our investigation into how different states in Moodle are connected with high and low final grades, in the future, we intend to examine data on specific written assignments and quizzes. This involves delving into correlations between the students’ assignment scores (with each student submitting five written assignments per academic year), the feedback provided by their individual tutors (and whether students incorporate the provided feedback to improve themselves), and their final grades. We also plan to search for patterns of time spent on different activities and compare engaged students’ performance with that of their peers who have similar levels of engagement. Additionally, we will examine when students access resources at different stages of the academic year, as we believe that this temporal analysis will provide deeper insights into students’ learning behaviors in the LMS.
Given Moodle’s complexity as a Learning Management System, discerning students’ behavior patterns can pose challenges. The diverse range of features, activities, and interactions within Moodle often leads to intricate data patterns that may lack straightforward interpretations. Moreover, external factors such as individual learning styles and preferences add further complexity to the analysis. Finally, we envision complementing our quantitative research with qualitative elements. This entails gathering feedback through questionnaires to gain insights into students’ perceptions of Moodle usage and its impact on their learning experiences, thereby offering valuable support to our analysis.

Author Contributions

Conceptualization, V.S.V.; Methodology, E.P., R.T., D.K. (Dimitrios Karapiperis) and V.S.V.; Software, G.F. and D.K. (Dimitrios Karapiperis); Formal analysis, E.P.; Investigation, G.F.; Writing—original draft, E.P. and R.T.; Writing—review and editing, D.K. (Dimitrios Kalles) and V.S.V.; Visualization, D.K. (Dimitrios Karapiperis); Supervision, V.S.V.; Project administration, V.S.V. All authors have read and agreed to the published version of the manuscript.

Funding

This research received no external funding.

Data Availability Statement

The data presented in this study are contained in the article itself.

Conflicts of Interest

The authors declare no conflicts of interest.

References

  1. Rabbany, R.; Elatia, S.; Takaffoli, M.; Zaïane, O.R. Collaborative Learning of Students in Online Discussion Forums: A Social Network Analysis Perspective. In Educational Data Mining-Applications and Trends, Studies in Computational Intelligence; Pena-Ayala, A., Ed.; Springer: Cham, Switzerland, 2014. [Google Scholar]
  2. Dillenbourg, P. Design for classroom orchestration. Comput. Educ. 2013, 69, 485–492. [Google Scholar] [CrossRef]
  3. Emin-Martínez, V.; Hansen, C.; Rodríguez-Triana, M.J.; Wasson, B.; Mor, Y.; Dascalu, M.; Ferguson, R.; Pernin, J.P. Towards teacher-led design inquiry of learning. eLearn. Pap. 2014, 36, 3–14. [Google Scholar]
  4. Morrison, J.; Frost, J.; Gotch, C.; McDuffie, A.R.; Austin, B.; French, B. Teachers Role in Students Learning at a Project-Based STEM High School: Implications for Teacher Education. Int. J. Sci. Math. Educ. 2021, 19, 1103–1123. [Google Scholar] [CrossRef]
  5. Wong, J.; Baars, M.; Davis, D.; Van Der Zee, T.; Houben, G.-J.; Paas, F. Supporting self-regulated learning in online learning environments and MOOCs: A systematic review. Int. J. Hum. Comput. Interact. 2019, 35, 356–373. [Google Scholar] [CrossRef]
  6. Vanslambrouck, S.; Zhu, C.; Pynoo, B.; Lombaerts, K.; Tondeur, J.; Scherer, R. A latent profile analysis of adult students’ online self-regulation in blended learning environments. Comput. Hum. Behav. 2019, 99, 126–136. [Google Scholar] [CrossRef]
  7. Ainley, M.; Patrick, L. Measuring self-regulated learning processes through tracking patterns of student interaction with achievement activities. Educ. Psychol. Rev. 2006, 18, 267–286. [Google Scholar] [CrossRef]
  8. Kagklis, V.; Karatrantou, A.; Tantoula, M.; Panagiotakopoulos, C.T.; Verykios, V.S. A learning analytics methodology for detecting sentiment in student fora: A case study in distance education. Eur. J. Open Distance e-Learn. 2015, 18, 74–94. [Google Scholar] [CrossRef]
  9. Paxinou, E.; Manousou, E.; Feretzakis, G.; Verykios, V.S. Community Detection and Social Presence in Students’ Discussion for Fora. Intell. Decis. Technol. 2023, 17, 879–891. [Google Scholar] [CrossRef]
  10. Zacharski, R. A Programmer’s Guide to Data Mining: The Ancient Art of the Numerati. Chapter 3, 2015. Available online: http://guidetodatamining.com/assets/guideChapters/DataMining-ch3.pdf (accessed on 29 April 2024).
  11. Hrastinski, S. A theory of online learning as online participation. Comput. Educ. 2009, 52, 78–82. [Google Scholar] [CrossRef]
  12. Tsoni, R.; Paxinou, E.; Gkoulalas-Divanis, A.; Karapiperis, D.; Kalles, D.; Verykios, V.S. Exploiting Properties of Student Networks to Enhance Learning in Distance Education. Information 2024, 15, 234. [Google Scholar] [CrossRef]
  13. Pathan, R.; Rajendran, R.; Murthy, S. Mechanism to capture learner’s interaction in VR-based learning environment: Design and application. Smart Learn. Environ. 2020, 7, 35, Correction in Smart Learn. Environ. 2020, 7, 36. [Google Scholar] [CrossRef]
  14. Wachtler, J.; Hubmann, M.; Zöhrer, H.; Ebner, M. An analysis of the use and efect of questions in interactive learning-videos. Smart Learn. Environ. 2016, 3, 13. [Google Scholar] [CrossRef]
  15. Perdikaris, S.C. A Markov chain model in teachers’ decision making. Int. J. Math. Educ. Sci. Technol. 2006, 23, 473–477. [Google Scholar] [CrossRef]
  16. Johnstone, J.N.; Philp, H. The application of a Markov Chain in educational planning. Socioecon. Plann. Sci. 1973, 7, 283–294. [Google Scholar] [CrossRef]
  17. Suzuki, J. A Markov chain analysis on simple genetic algorithms. IEEE Trans. Syst. Man Cybern. 1995, 25, 655–659. [Google Scholar] [CrossRef]
  18. Brockett, R.G.; Hiemstra, R. Self-Direction in Adult Learning: Perspectives on Theory, Reasearch, and Practice; Routledge: London, UK; New York, NY, USA, 1991. [Google Scholar]
  19. Peters, O. Learning and Teaching in Distance Education. Pedagogical Analyses and Interpretations in an International Perspective; Kogan Page: London, UK, 1998. [Google Scholar]
  20. Tough, A. The Adult’s Learning Projects; Ontario Institute for Studies in Education: Toronto, ON, Canada, 1971. [Google Scholar]
  21. Knowles, M.S. Self-Directed Learning: A Guide for Learners and Teachers; Association Press: New York, NY, USA, 1975. [Google Scholar]
  22. Moore, M.G. Independent study. In Redefining the Discipline of Adult Education; Boyd, R.D., Apps, J.W., Eds.; Jossey-Bass: San Francisco, CA, USA, 1980; pp. 16–31. [Google Scholar]
  23. Brookfield, S. Understanding and Facilitating Adult Learning; Open University Press: Milton Keynes, UK, 1986. [Google Scholar]
  24. Moore, E.A.; Winterrowd, E.; Petrouske, A.; Priniski, S.J.; Achter, J. Non-traditional and struggling: Academic and Financial distress among older student clients. J. Coll. Couns. 2020, 23, 221–233. [Google Scholar] [CrossRef]
  25. Pintrich, P.R. Role of goal orientation in self-regulated learning. In Handbook of Self-Regulation; Boekarts, M., Pintrich, P., Zeidner, M., Eds.; Academic Press: Cambridge, MA, USA, 2000; pp. 452–494. [Google Scholar]
  26. Broadbent, J.; Poon, W.L. Self-regulated learning strategies and academic performance in online higher education learning environments: A systematic review. Internet High. Educ. 2015, 27, 1–13. [Google Scholar] [CrossRef]
  27. Zimmerman, B.J.; Schunk, D.H. (Eds.) Self-Regulated Learning and Academic Performance: Theoretical Perspectives; Lawrence Erlbaum Associates-Taylor & Francis Group: New York, NY, USA; London, UK, 2001. [Google Scholar]
  28. Zamecnik, A.; Kovanovic, V.; Joksimovic, S.; Liu, L. Exploring non-traditional learner motivations and characteristics in online learning: A learner profile study. Comput. Educ. Artif. Intell. 2022, 3, 100051. [Google Scholar] [CrossRef]
  29. Mubarak, A.A.; Cao, H.; Zhang, W. Prediction of students’ early drop-out based on their interaction logs in online learning environment. Interact. Learn. Environ. 2020, 30, 1414–1433. [Google Scholar] [CrossRef]
  30. Li, L.-Y.; Tsai, C.-C. Accessing online learning material: Quantitative behavior patterns and their effects on motivation and learning performance. Comput. Educ. 2017, 114, 286–297. [Google Scholar] [CrossRef]
  31. Barthakur, A.; Kovanovic, V.; Joksimovic, S.; Siemens, G.; Richey, M.; Dawson, S. Assessing program-level learning strategies in MOOCs. Comput. Hum. Behav. 2021, 117, 106674. [Google Scholar] [CrossRef]
  32. Peach, R.L.; Yaliraki, S.N.; Lefevre, D.; Barahona, M. Data-driven unsupervised clustering of online learner behaviour. NPJ Sci. Learn. 2019, 4, 14. [Google Scholar] [CrossRef] [PubMed]
  33. Marques, A.; Belo, O. Discovering student web usage proles using Markov chains. Electron. J. e-Learn. 2011, 9, 63–74. [Google Scholar]
  34. Akçapınar, G.; Majumdar, R.; Flanagan, B.; Ogata, H. Investigating Students’ e-Book Reading Patterns with Markov Chains. In Proceedings of the 26th International Conference on Computers in Education, Manila, Philippines, 26–30 November 2018; Ding, J., Song, Y., Coronel, A.D., Amalathas, S., Yang, J.C., Chang, M., Wong, L.-H., Rodrigo, M.M.T., Eds.; Asia-Pacific Society for Computers in Education: Taoyuan, Taiwan, 2018. [Google Scholar]
  35. Boumi, S.; Vela, A.E. Improving Graduation Rate Estimates Using Regularly Updating Multi-Level Absorbing Markov Chains. Educ. Sci. 2020, 10, 377. [Google Scholar] [CrossRef]
  36. Tedeschi, M.N.; Hose, T.M.; Mehlman, E.K.; Franklin, S.; Wong, T.E. Improving models for student retention and graduation using Markov chains. PLoS ONE 2023, 18, e0287775. [Google Scholar] [CrossRef] [PubMed]
  37. Yuan, T. Algorithm of Classroom Teaching Quality Evaluation Based on Markov Chain. Hindawi 2021, 2021, 9943865. [Google Scholar] [CrossRef]
  38. Zammarchi, G.; Frigau, L.; Mola, F. Markov chain to analyze web usability of a university website using eye tracking data. Stat. Anal. Data Min. 2022, 14, 331–341. [Google Scholar] [CrossRef]
  39. Paxinou, E.; Kalles, D.; Panagiotakopoulos, C.T.; Verykios, V.S. Analyzing Sequence Data with Markov Chain Models in Scientific Experiments. SN Comput. Sci. 2021, 5, 385. [Google Scholar] [CrossRef]
  40. Fraoua, K.E.; David, A. The Autonomous Platform Using the Markov Chain. In HCI International 2023—Late Breaking Papers. HCII 2023; Lecture Notes in Computer Science, 14060; Zaphiris, P., Ioannou, A., Sottilare, R.A., Schwarz, J., Nah, F.F.H., Siau, K., Wei, J., Salvendy, G., Eds.; Springer: Cham, Switzerland, 2023. [Google Scholar] [CrossRef]
  41. Tekkol, I.A.; Demirel, M. An Investigation of Self-Directed Learning Skills of Undergraduate Students. Front. Psychol. 2018, 9, 2324. [Google Scholar] [CrossRef] [PubMed]
  42. Morris, T.H.; Rohs, M. The potential for digital technology to support self-directed learning in formal education of children: A scoping review. Interact. Learn. Environ. 2023, 31, 1974–1987. [Google Scholar] [CrossRef]
Figure 1. Visualization of the transition probabilities between different parts of Moodle: (a) an inactive; (b) an active student.
Futureinternet 16 00190 g001
Figure 2. Distribution of the students’ final grades for the academic year 2021–2022.
Futureinternet 16 00190 g002
Figure 3. (a) Final grade vs. Course state probability. (b) Final grade vs. Glossary state probability.
Futureinternet 16 00190 g003
Figure 4. Correlations between final grades and all the measures provided in this study.
Futureinternet 16 00190 g004
Table 1. The standard retrieved fields in the log files.
Retrieved FieldDescription
TimeThe date and time when the event occurred, formatted as dd/mm/yy
User full nameThe name of the user who performed the action
Affected userThe actions affected other users
Event contextThe context in which the event occurred
ComponentThe part of the system where the event occurred
Event nameThe type of the event
DescriptionA more detailed explanation of the event
OriginInformation on how the event was initiated
IP addressThe user’s IP address
Table 2. The transition probability matrix for student with ID 144.
STATEAssignmentCourseFolderForumGlossaryOtherQuiz
Assignment0.414510.575130.000000.000000.000000.000000.01036
Course0.239560.210990.048350.380220.02198000000.09890
Folder0.000000.880000.120000.000000.000000.000000.00000
Forum0.007710.437020.000000.555270.000000.000000.00000
Glossary0.000000.769230.000000.000000.230770.000000.00000
Other0.000000.000000.000000.000000.000000.000000.00000
Quiz0.000000.559520.000000.000000.000000.000000.44048
Table 3. Indicative sample of ten students (final grade out of 10, eigenvector, and max. and min. observed state probability).
IDFinal GradeStudent’s Eigenvector
[Assignment, Course, Folder, Forum, Glossary, Other, Quiz]
Min. Probability/StateMax. Probability/State
110[0.12320, 0.41597, 0.01805, 0.32963, 0.00235, 0.00235, 0.10843]0.00235/Other0.41597/Course
210[0.17904, 0.52621, 0.01548, 0.14792, 0.00913, 0.00025, 0.12201]0.00025/Other0.52616/Course
310[0.09111, 0.42673, 0.01501, 0.34371, 0.00818, 0.00272, 0.11252]0.00272/Other0.42673/Course
410[0.07973, 0.51847, 0.02491, 0.26626, 0.00337, 0.00231, 0.10511]0.00231/Other0.51848/Course
510[0.11261, 0.42358, 0.02491, 0.34597, 0.01591, 0.00403, 0.07302]0.00403/Other0.42358/Course
1495.3[0.09899, 0.56479, 0.01072, 0.24490, 0.00510, 0.00000, 0.07551]0.00000/Other0.56479/Course
1505[0.21795, 0.35750, 0.03661, 0.19167, 0.01938, 0.00215, 0.17473]0.00215/Other0.35750/Course
1515[0.14139, 0.36837, 0.01840, 0.34237, 0.01332, 0.00635, 0.10980]0.00635/Other0.36837/Course
1525[0.12575, 0.47387, 0.02581, 0.30047, 0.02383, 0.00265, 0.04763]0.00265/Other0.47387/Course
1534[0.07935, 0.59972, 0.00708, 0.25859, 0.00815, 0.00035, 0.04676]0.00035/Other0.59972/Course
Table 4. Indicative sample—information on five students (final grade, Entropy, Frobenius Norm, Euclidean Distance and Cosine Similarity).
IDFinal GradeEntropyFrobenius NormEuclidean DistanceCosine Similarity
239.51.324560.561630.043020.99713
398.81.518690.500200.154180.96576
957.51.292230.579180.060500.99467
1266.71.233520.534810.107010.98274
1425.81.389350.532200.091610.98801
1534.01.077720.659640.149030.98193
Table 5. Mean averages for final grade, Entropy, Frobenius Norm, Euclidean Distance, and Cosine Similarity.
Final GradeEntropyFrobenius NormEuclidean DistanceCosine Similarity
7.91 ± 1.341.35 ± 0.120.56 ± 0.050.11 ± 0.060.98 ± 0.02
Disclaimer/Publisher’s Note: The statements, opinions and data contained in all publications are solely those of the individual author(s) and contributor(s) and not of MDPI and/or the editor(s). MDPI and/or the editor(s) disclaim responsibility for any injury to people or property resulting from any ideas, methods, instructions or products referred to in the content.

