

Improved Particle Filter in Machine Learning-Based BLE Fingerprinting Method to Reduce Indoor Location Estimation Errors


Abstract
:1. Introduction
2. Related Research
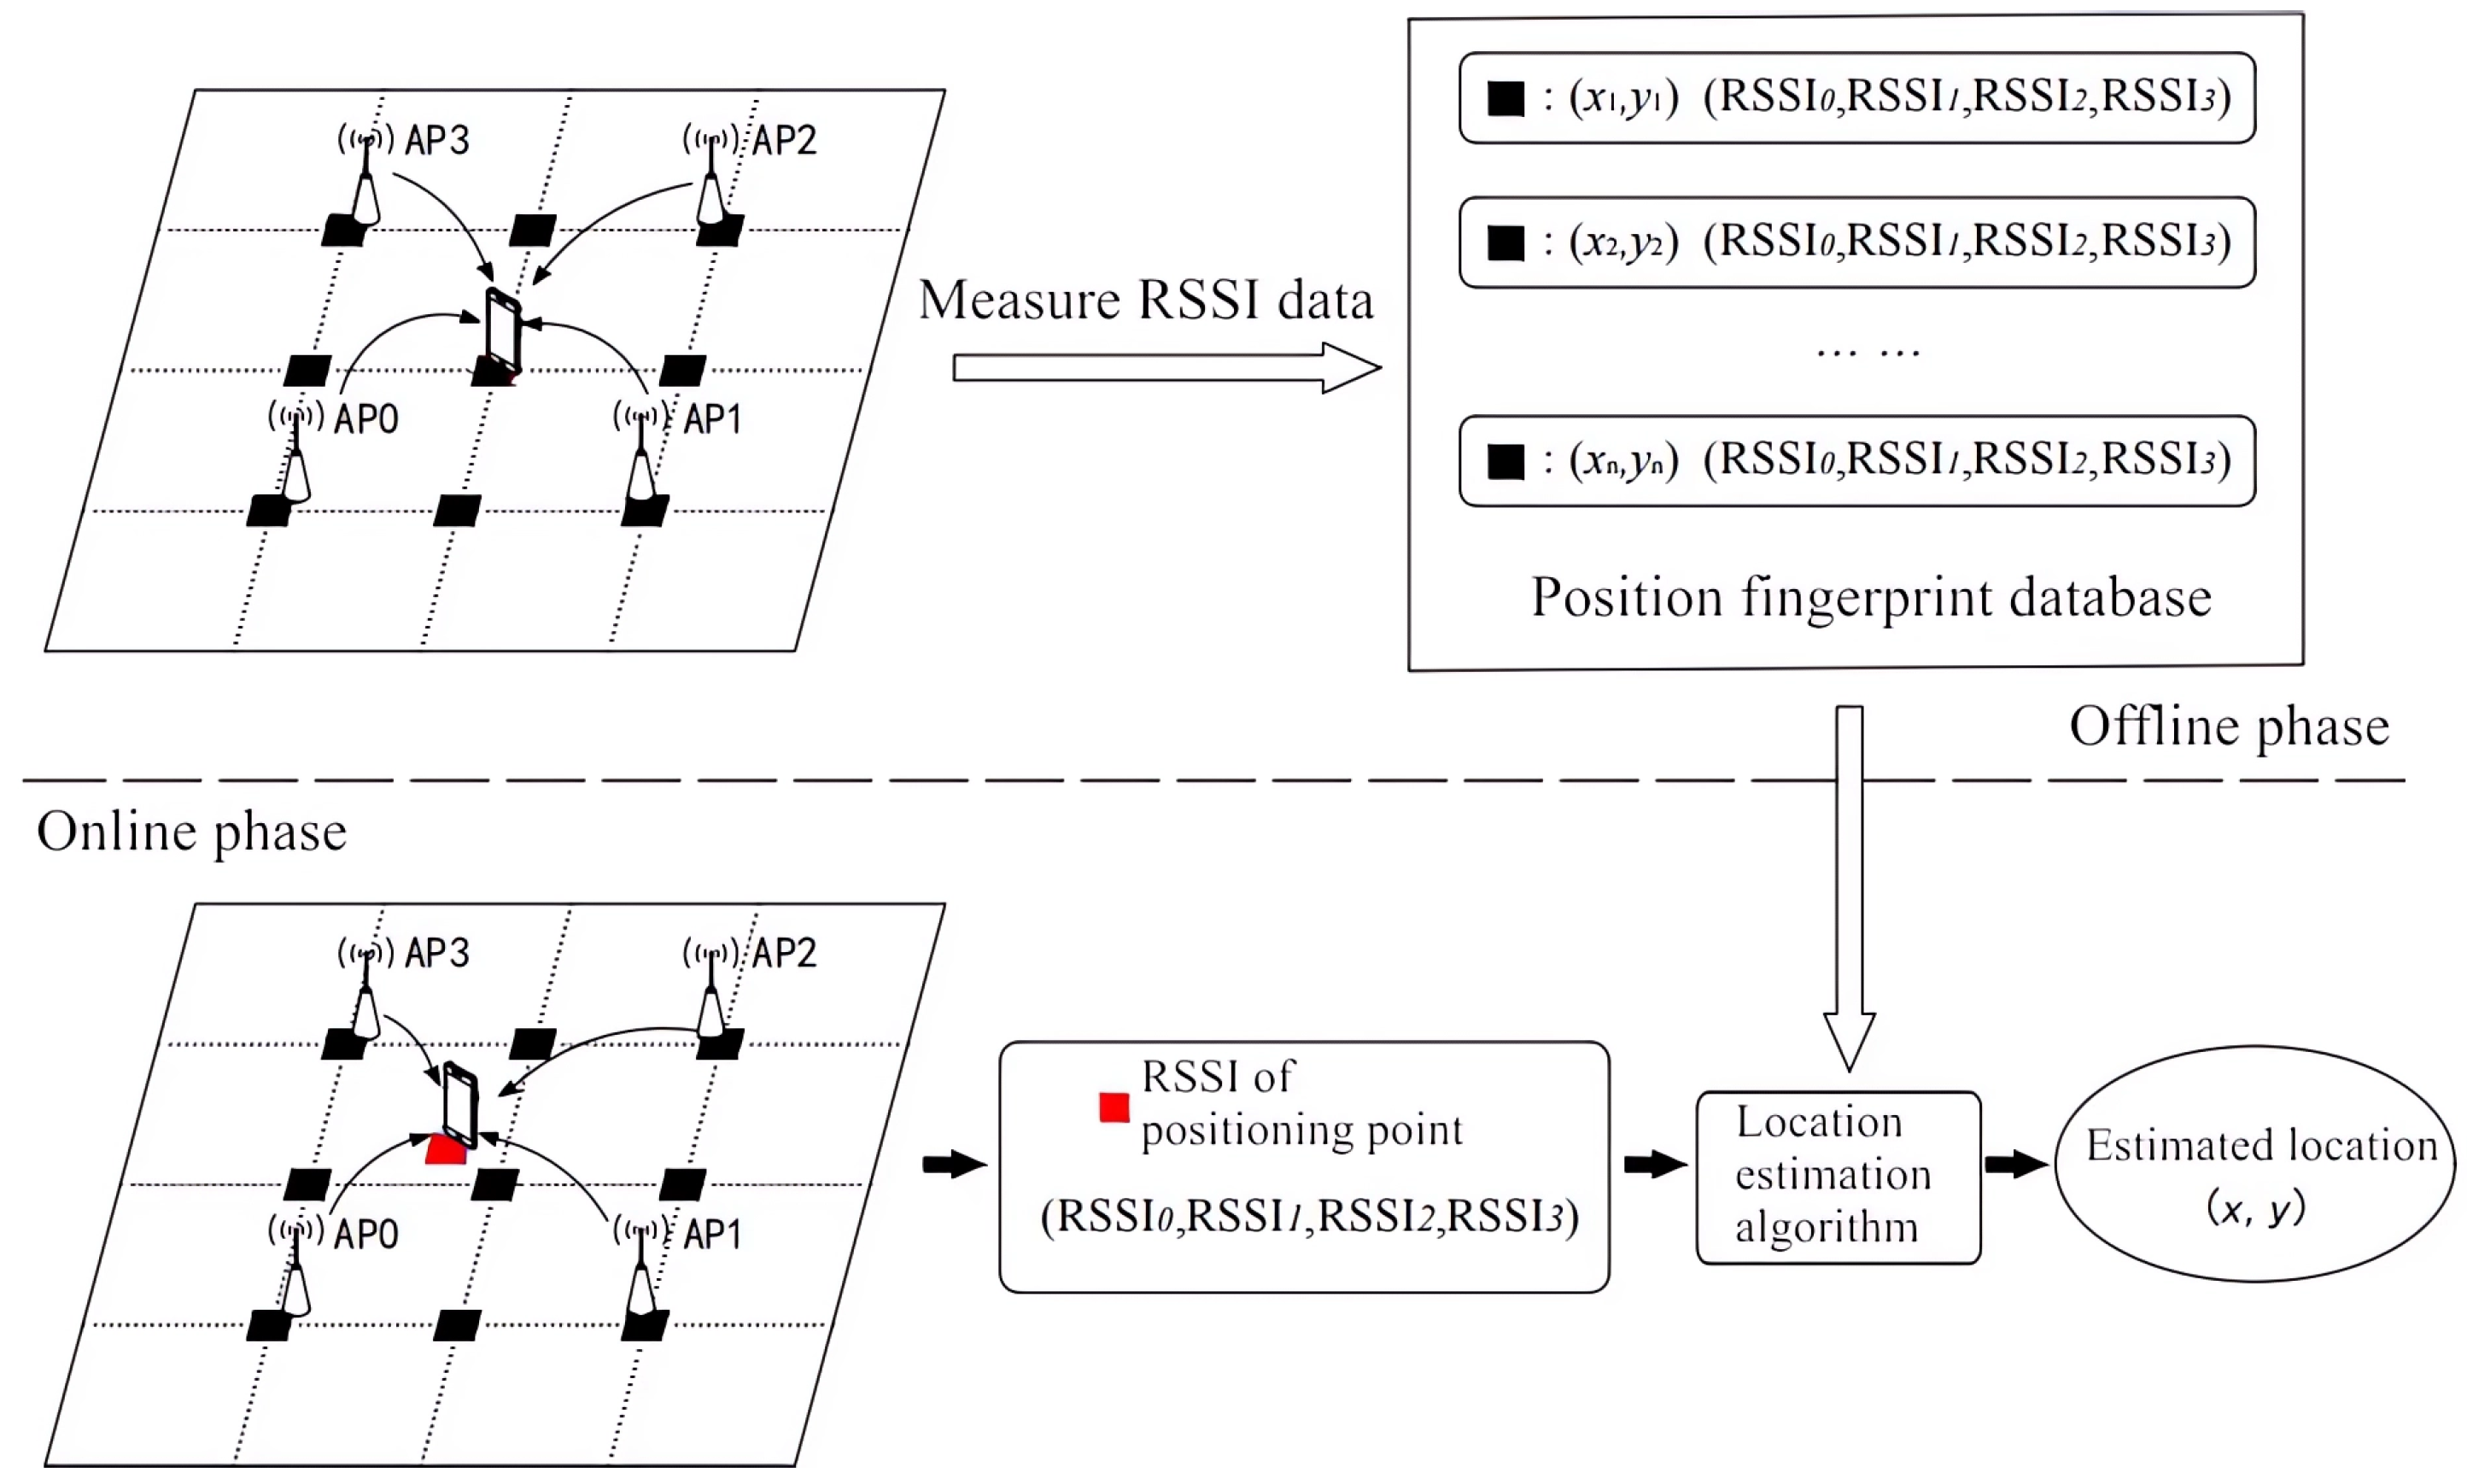
2.1. Position Fingerprinting Method
2.1.1. CNN-Based Location Estimation Method
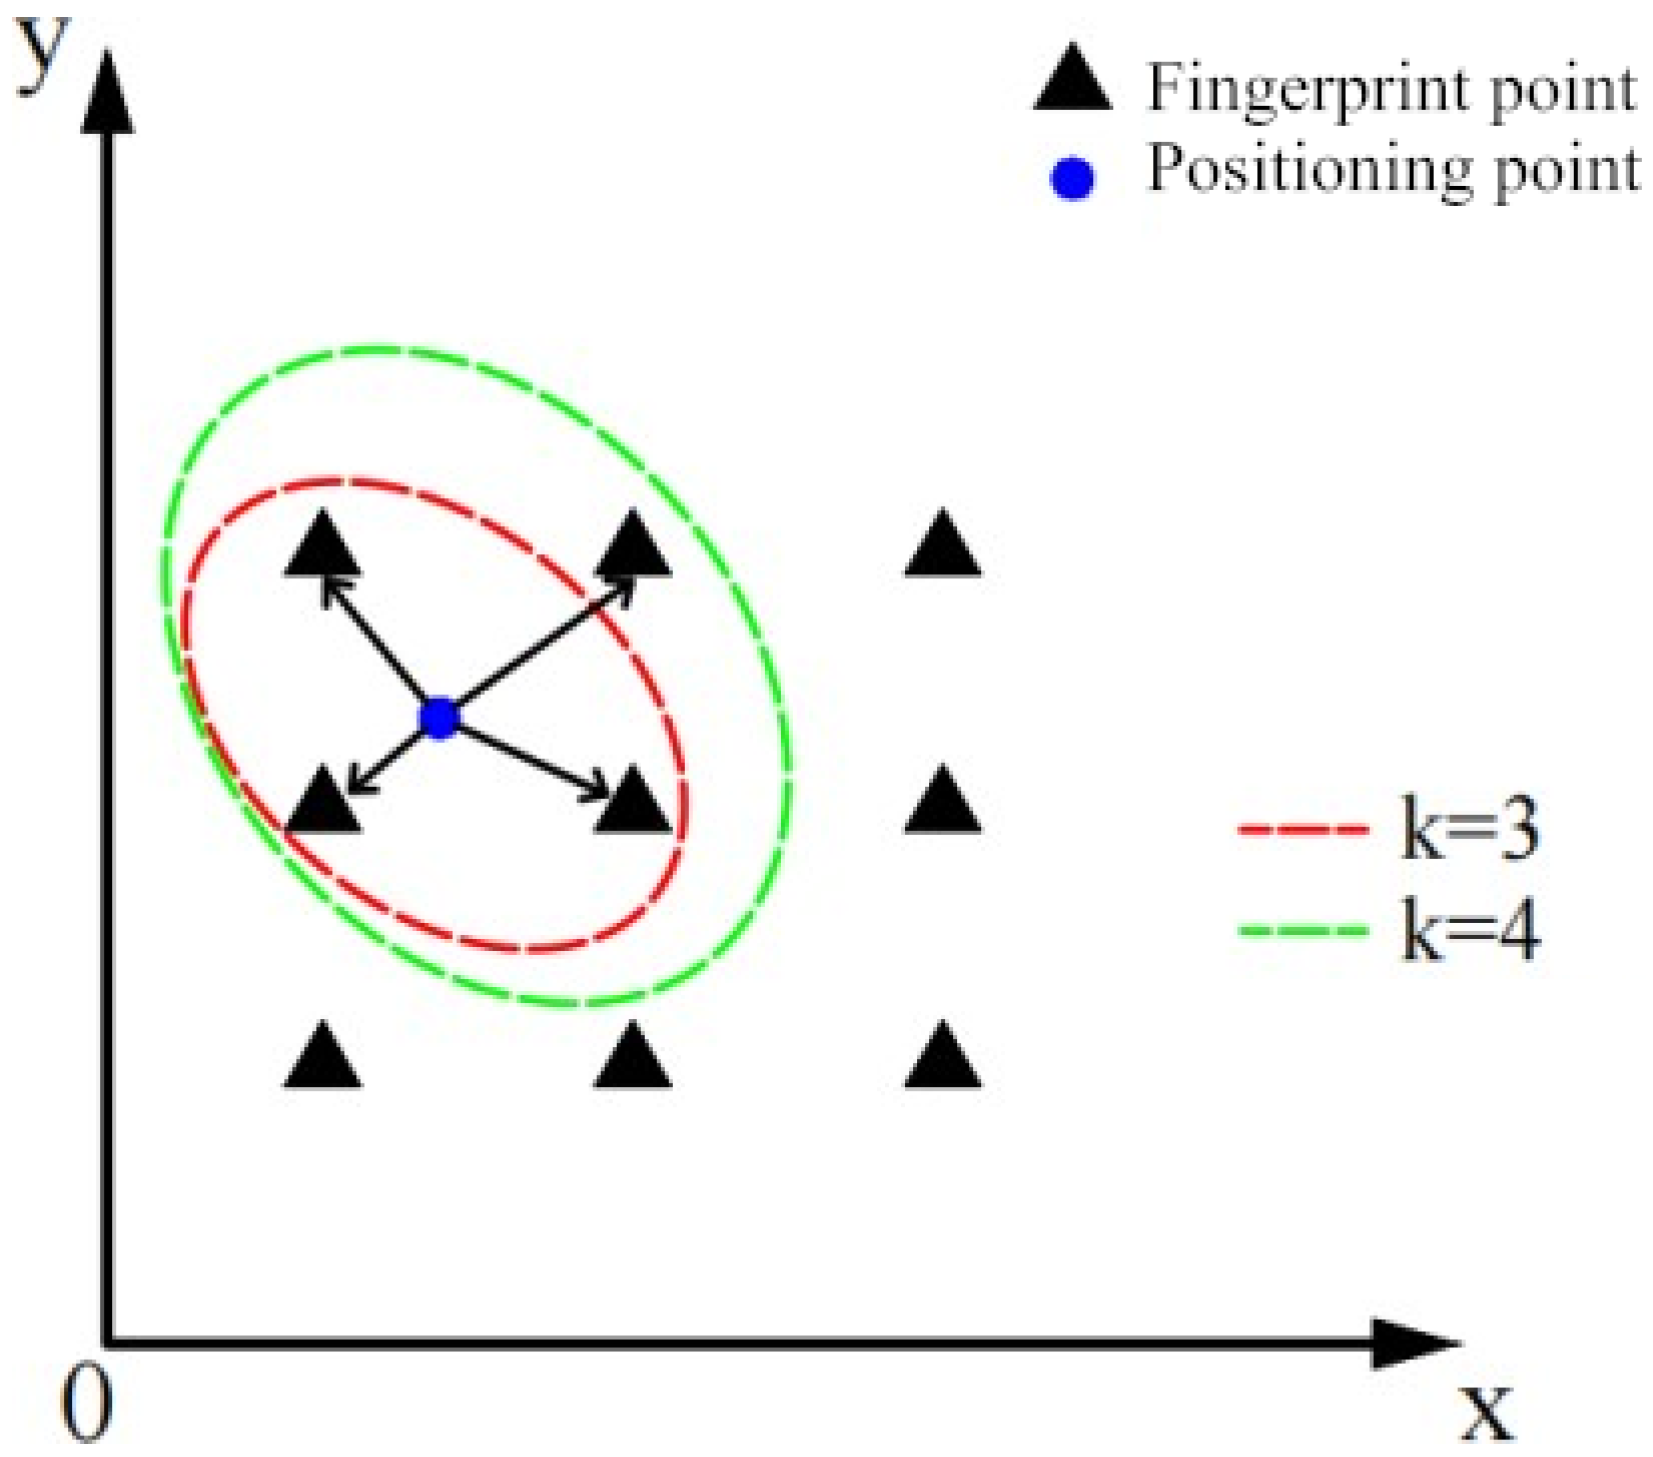
2.1.2. k-NN-Based Fingerprinting Method
2.1.3. SVM-Based Fingerprinting Method
2.2. Method Using Statistical Models
2.2.1. State-Space Model
2.2.2. Bayesian Filter
2.2.3. Particle Filter
3. Proposed System
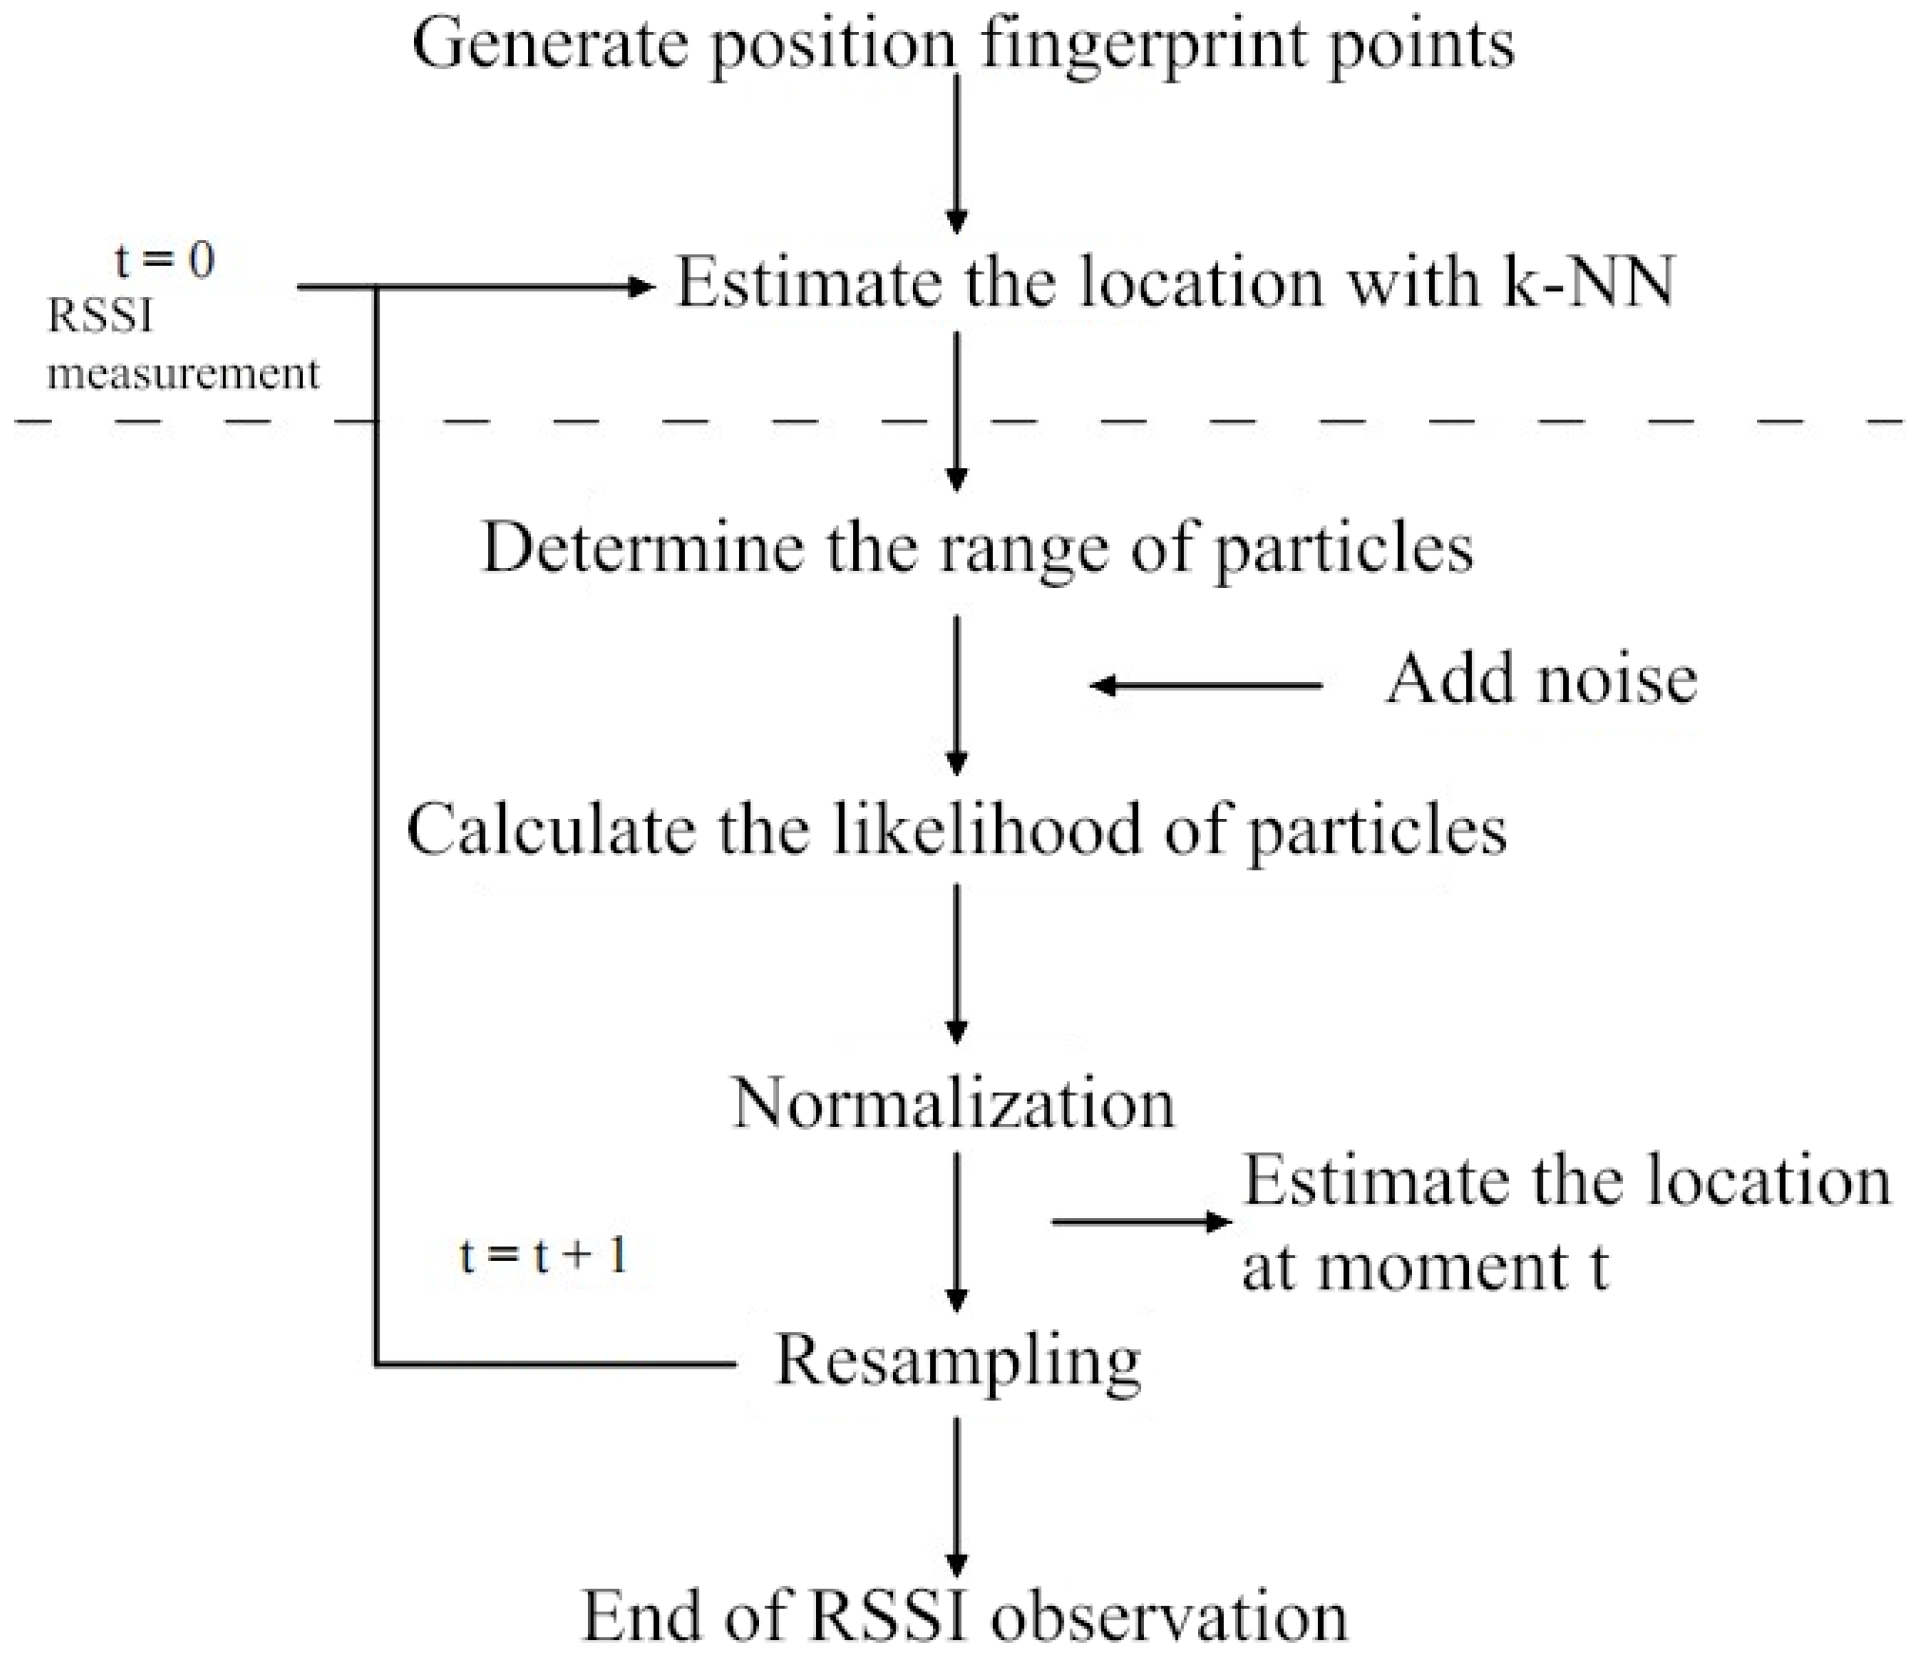
3.1. Configuration of the Proposed System
- Measure the RSSI values and create fingerprint points using the position fingerprinting method.
- Determine the initial state using the k-NN-based position estimation method based on the RSSI values of the location point.
- Correct the estimated coordinates by k-NN using a particle filter.
3.2. Position Correction with Particle Filter
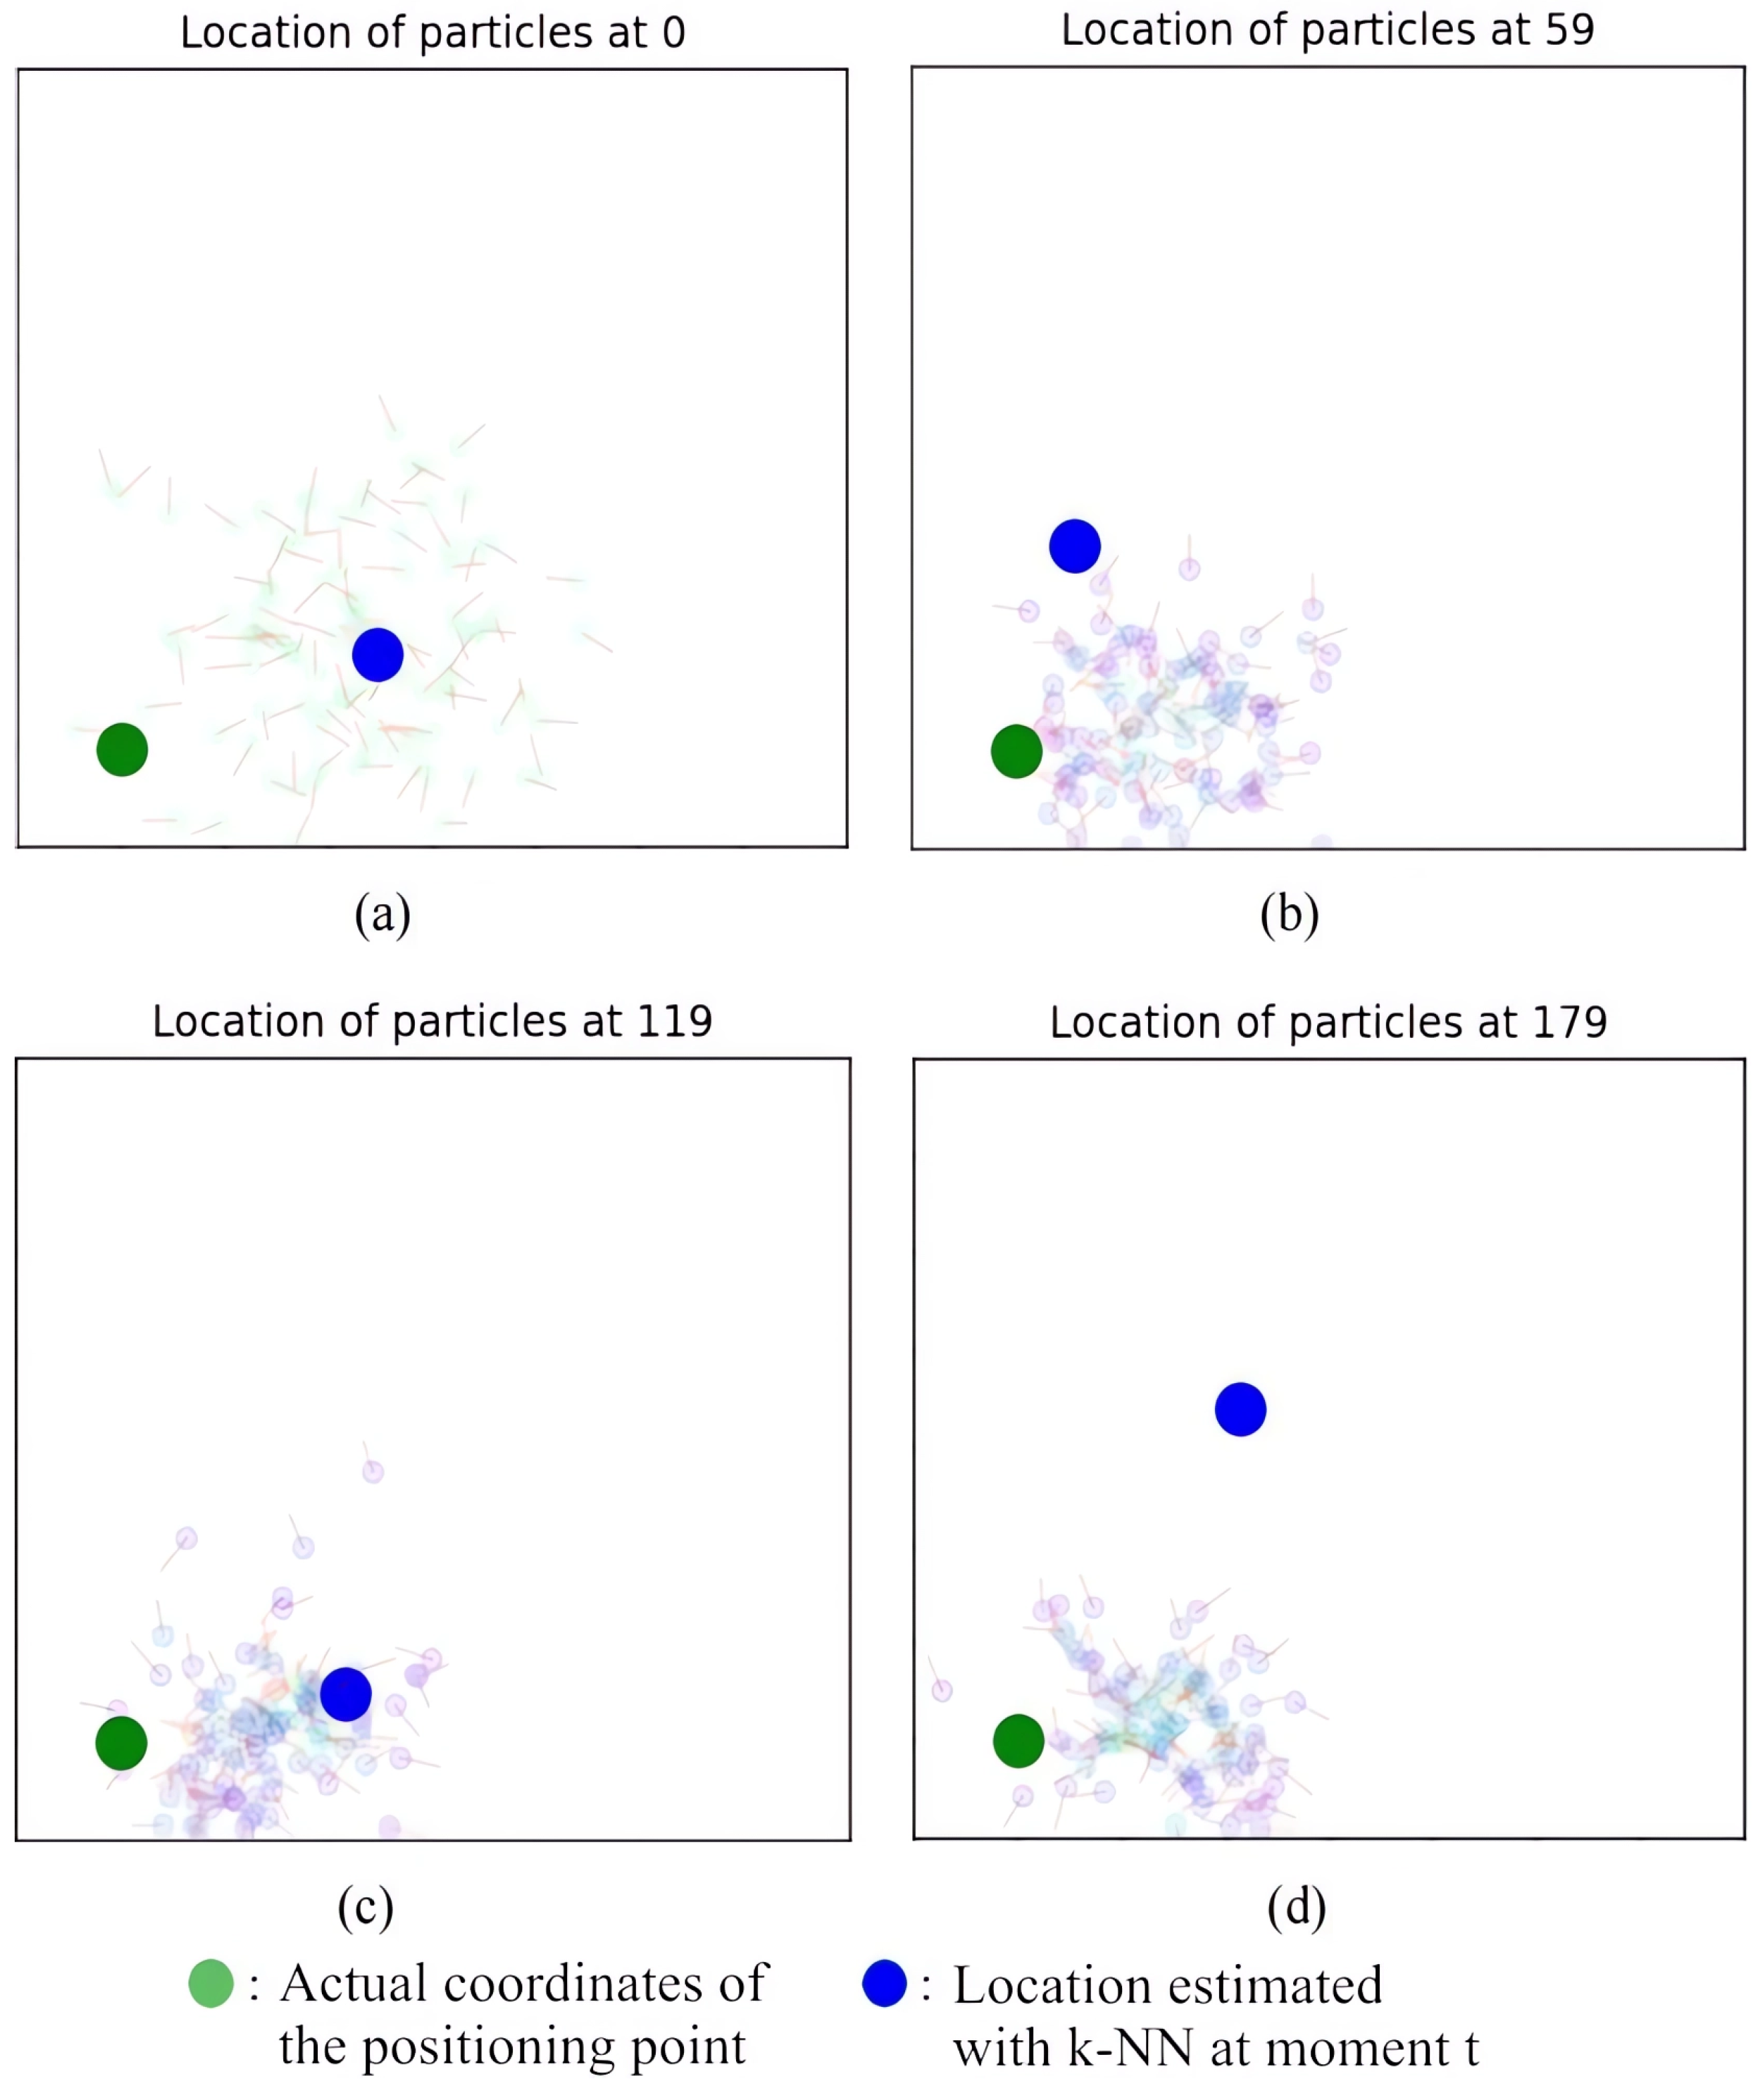
- Initial state At , determine the initial estimated location using the fingerprinting method with k-NN and generate N particles near the initial location, each randomly scattered and uniformly distributed. Let be the initial weight.
- Movement of particles Move N particles. Based on an average stride length, add noise at a distance of d = 0.65 m ± 0.1 m and completely randomize the direction of movement. Delete particles whose coordinates are outside the wall by comparing the coordinates of the experimental environment with the coordinates of the particles after moving. The particle movement equation, with the movement angle , can be expressed aswhere .
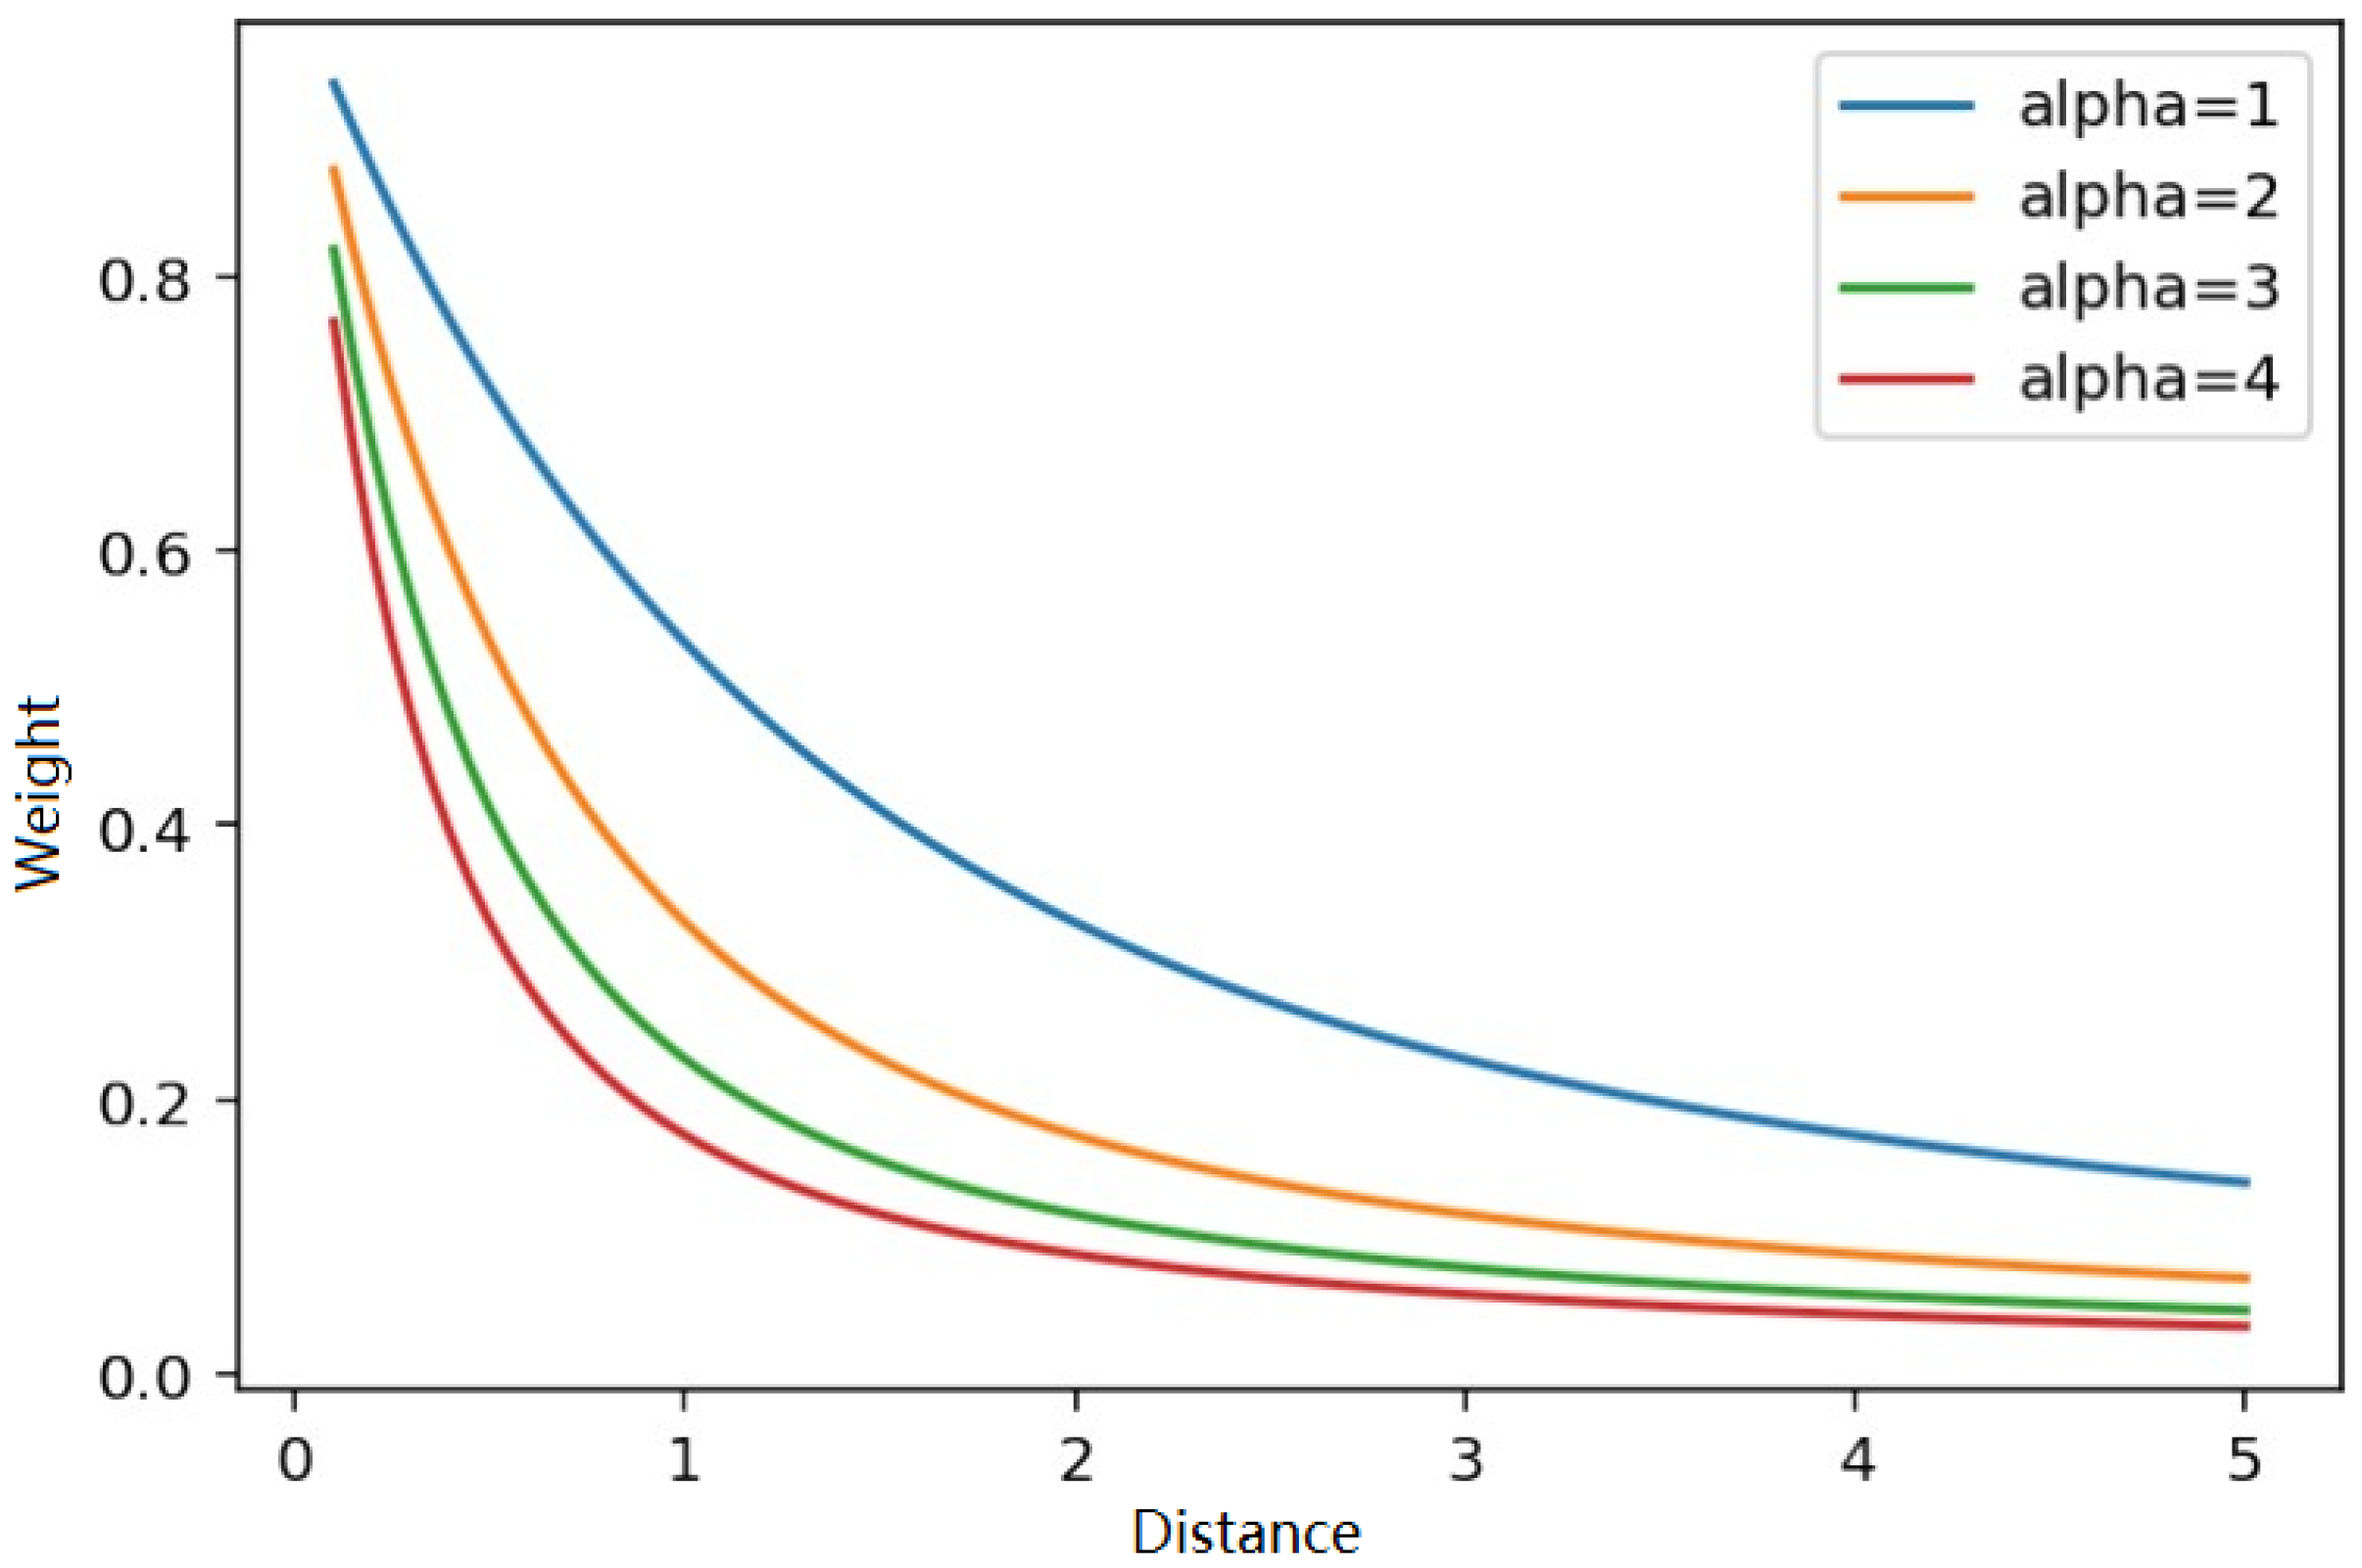
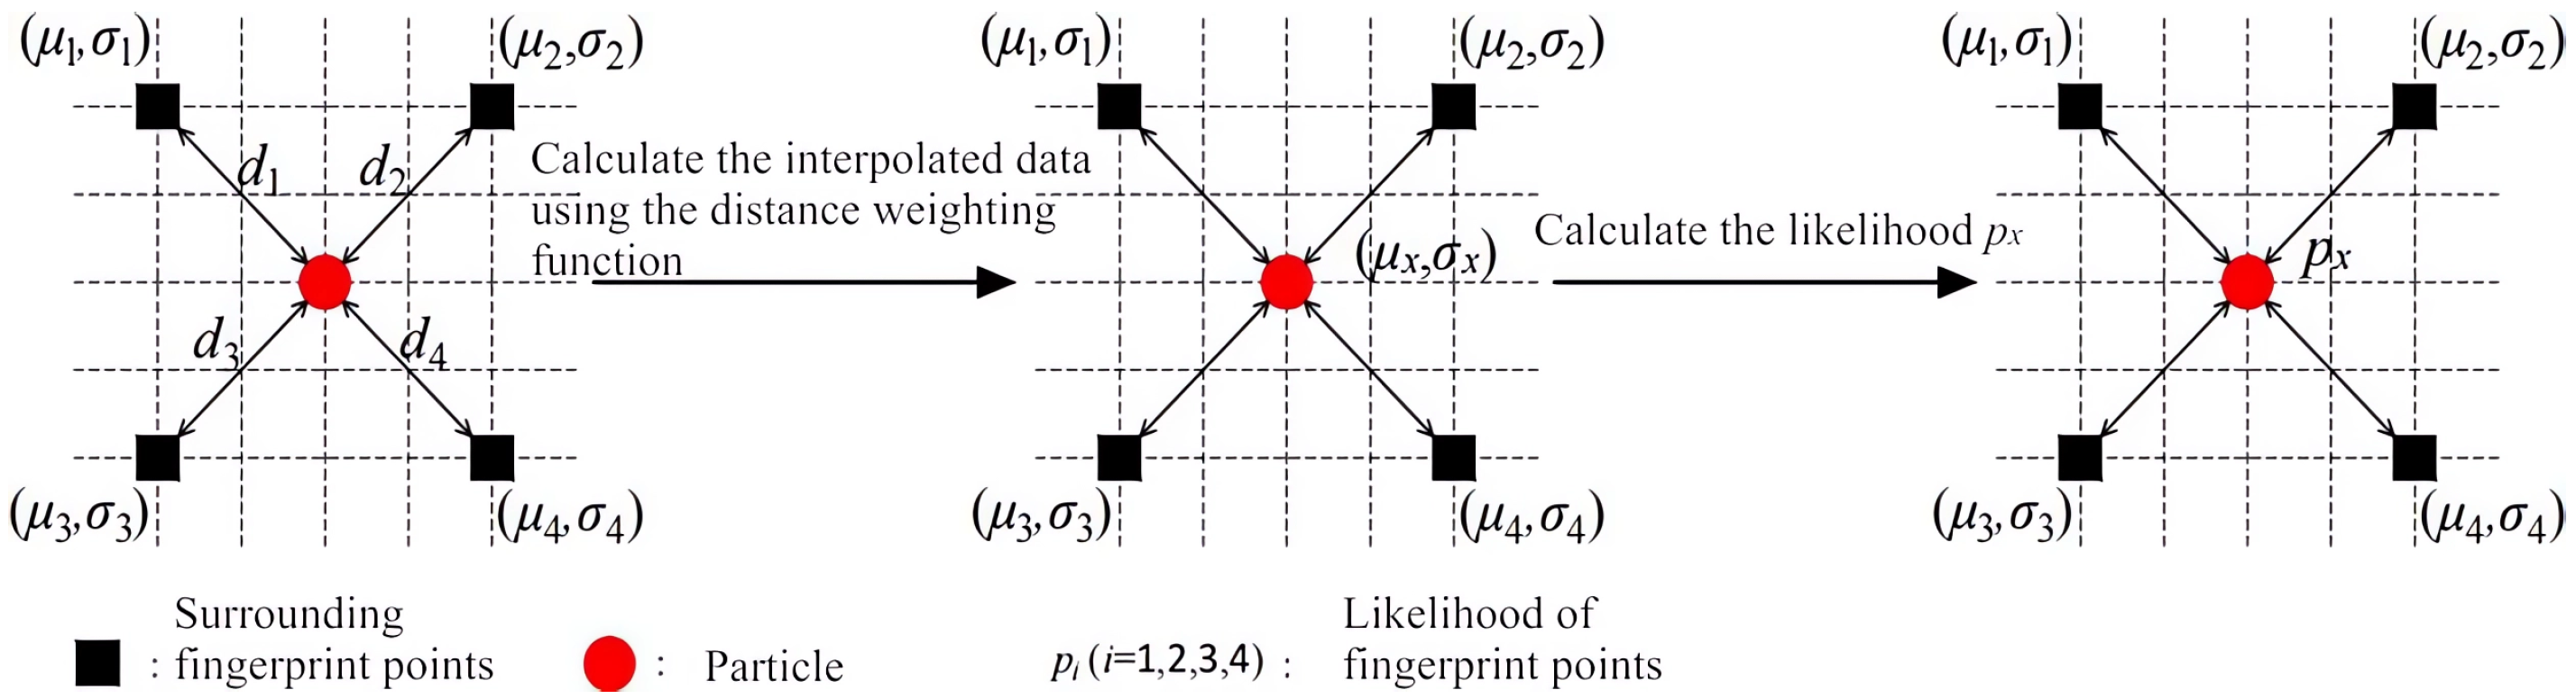
- Weighted by likelihood functionIn this study, the designed likelihood function is , where the new weights are obtained by the distance between the particle and the surrounding fingerprint points. The particle weights are . At this time, the weight of the particle is defined as the magnitude of the likelihood.
- NormalizationFor each particle, normalize as follows.
- ResamplingThe weight of the resampled particles is set to . The state can be predicted and the result of the position estimation can be output.
3.3. Design of Likelihood Functions
3.3.1. Generating a Mixed Normal Distribution
3.3.2. Weighting Function by Distance
3.3.3. Likelihood Function
Likelihood Function A
Likelihood Function B
4. Experiment
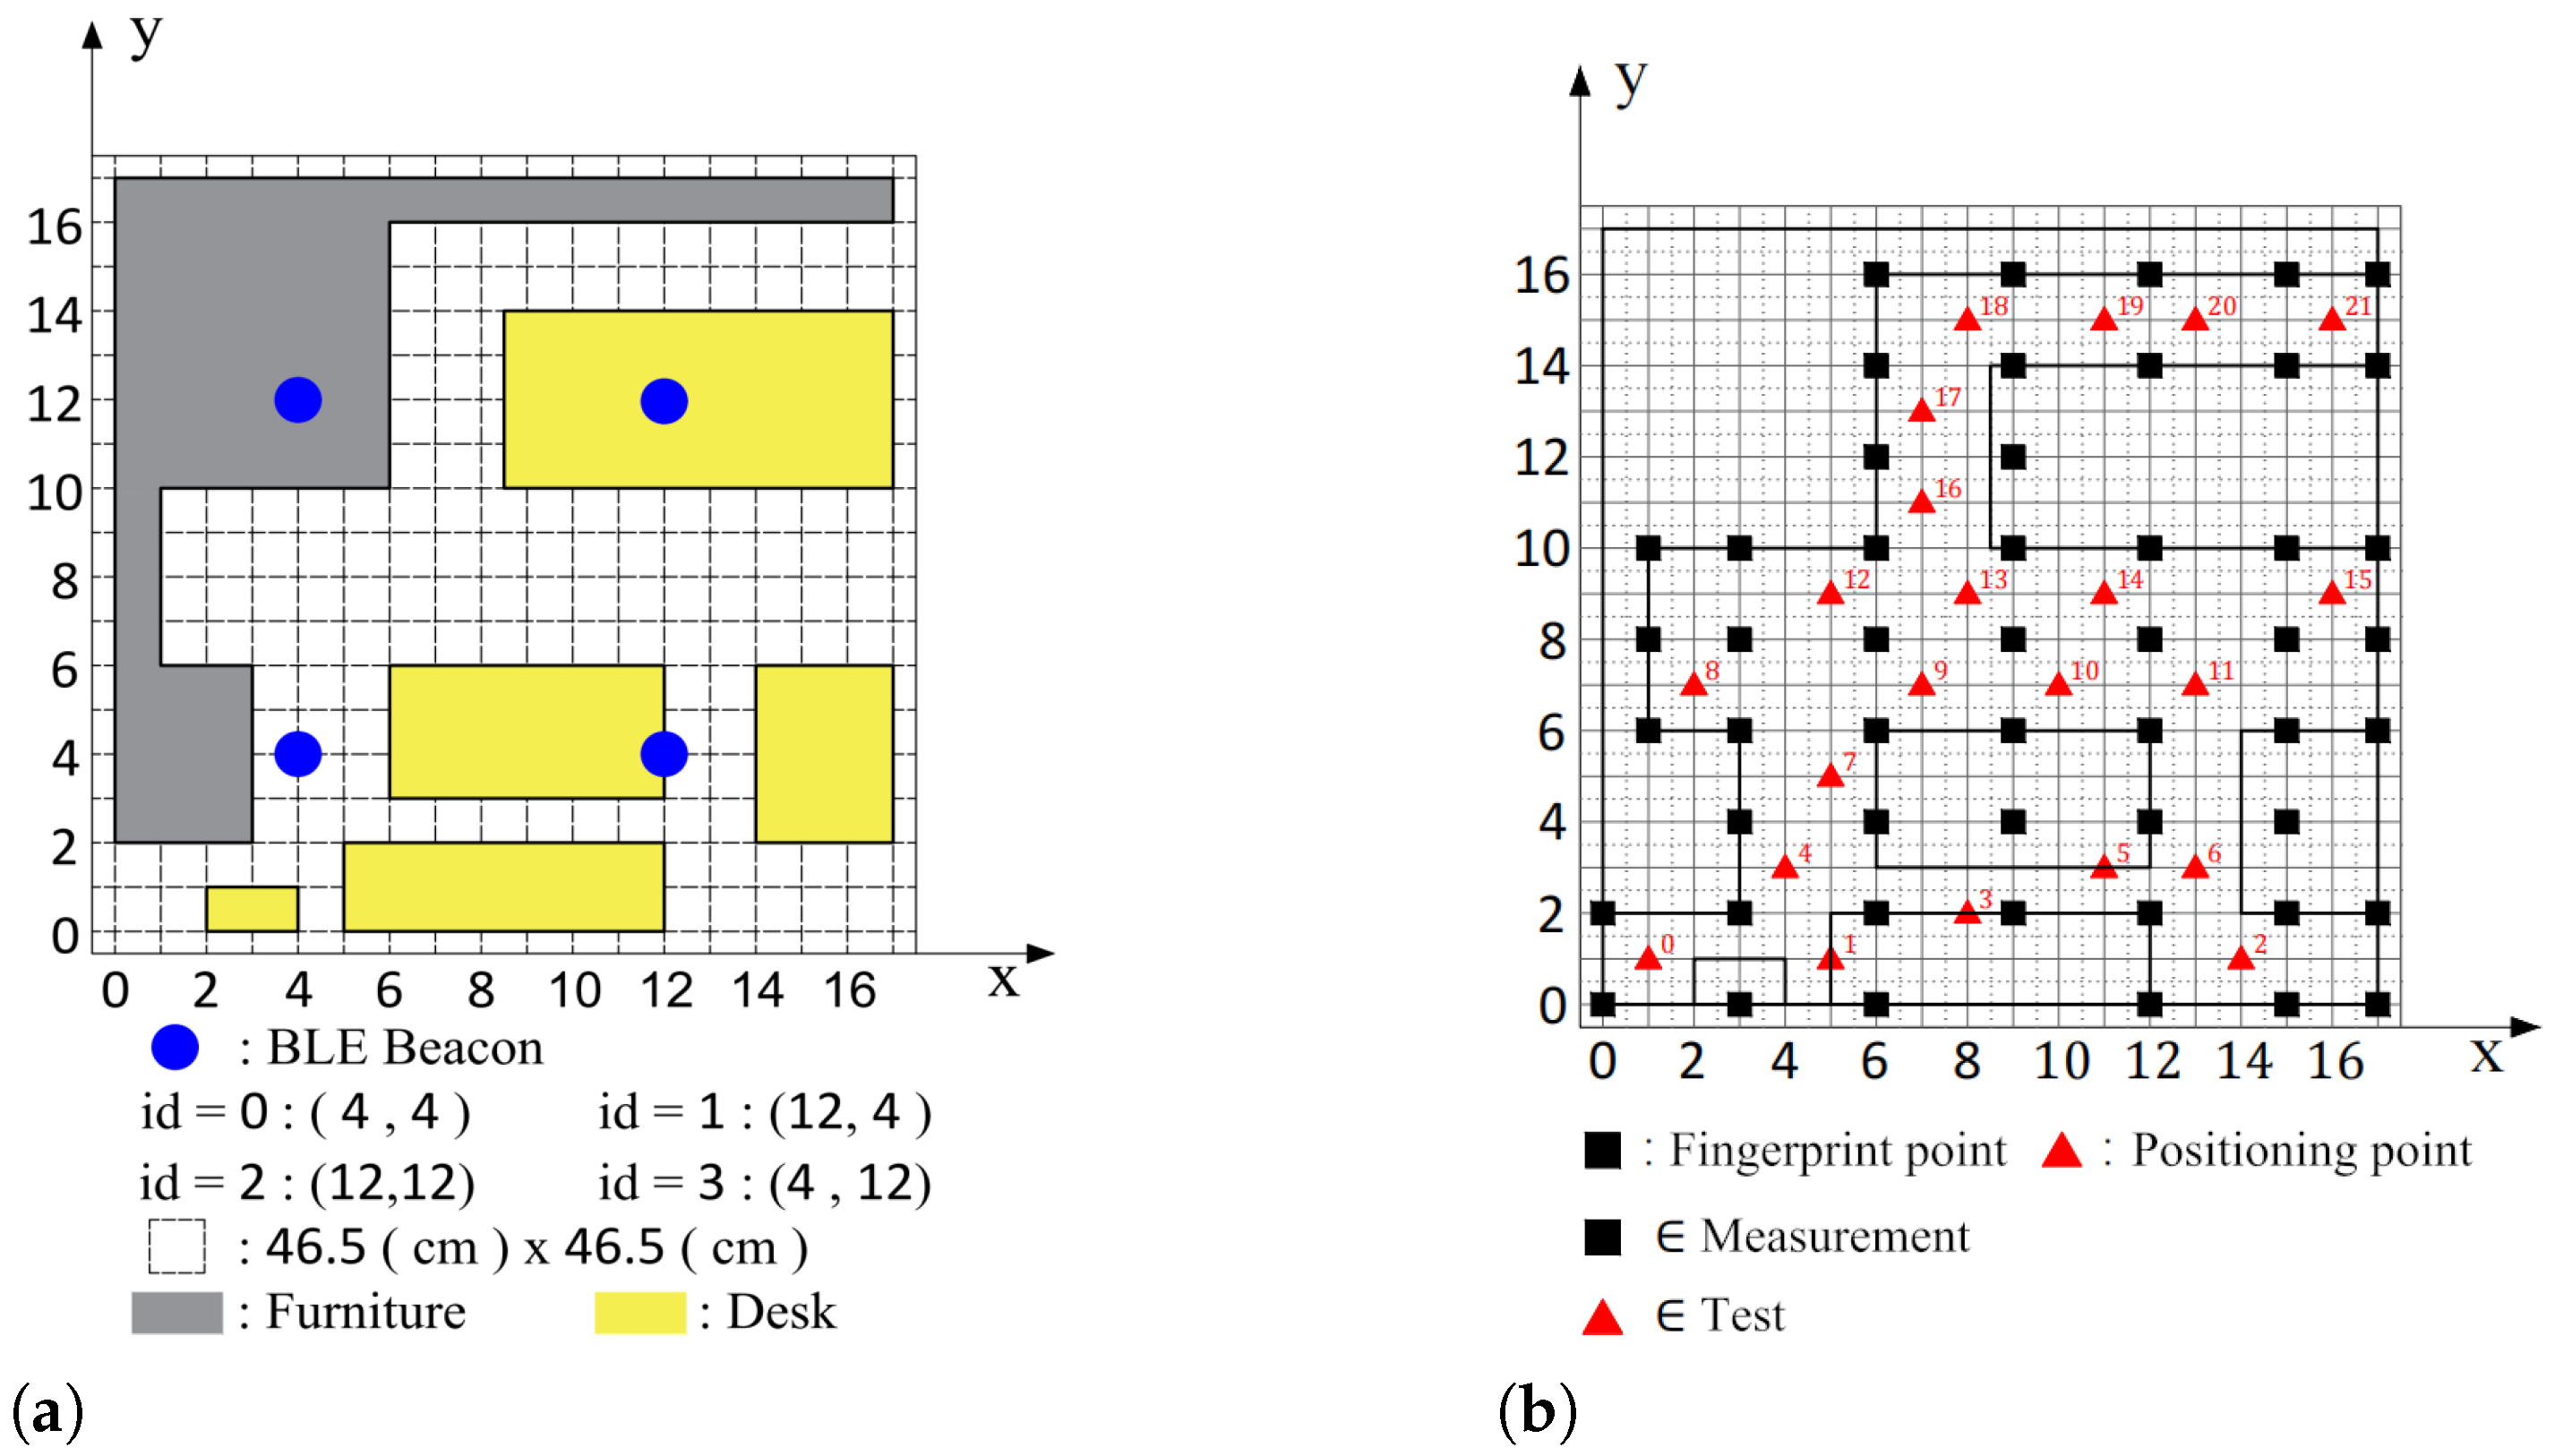
4.1. Generation of Position Fingerprints
4.1.1. Environment
4.1.2. Measurement of Fingerprints
4.2. Location Estimation by Existing Methods
4.2.1. Location Estimation by SVM
4.2.2. Location Estimation by k-NN
4.2.3. Location Estimation by Proposed Method
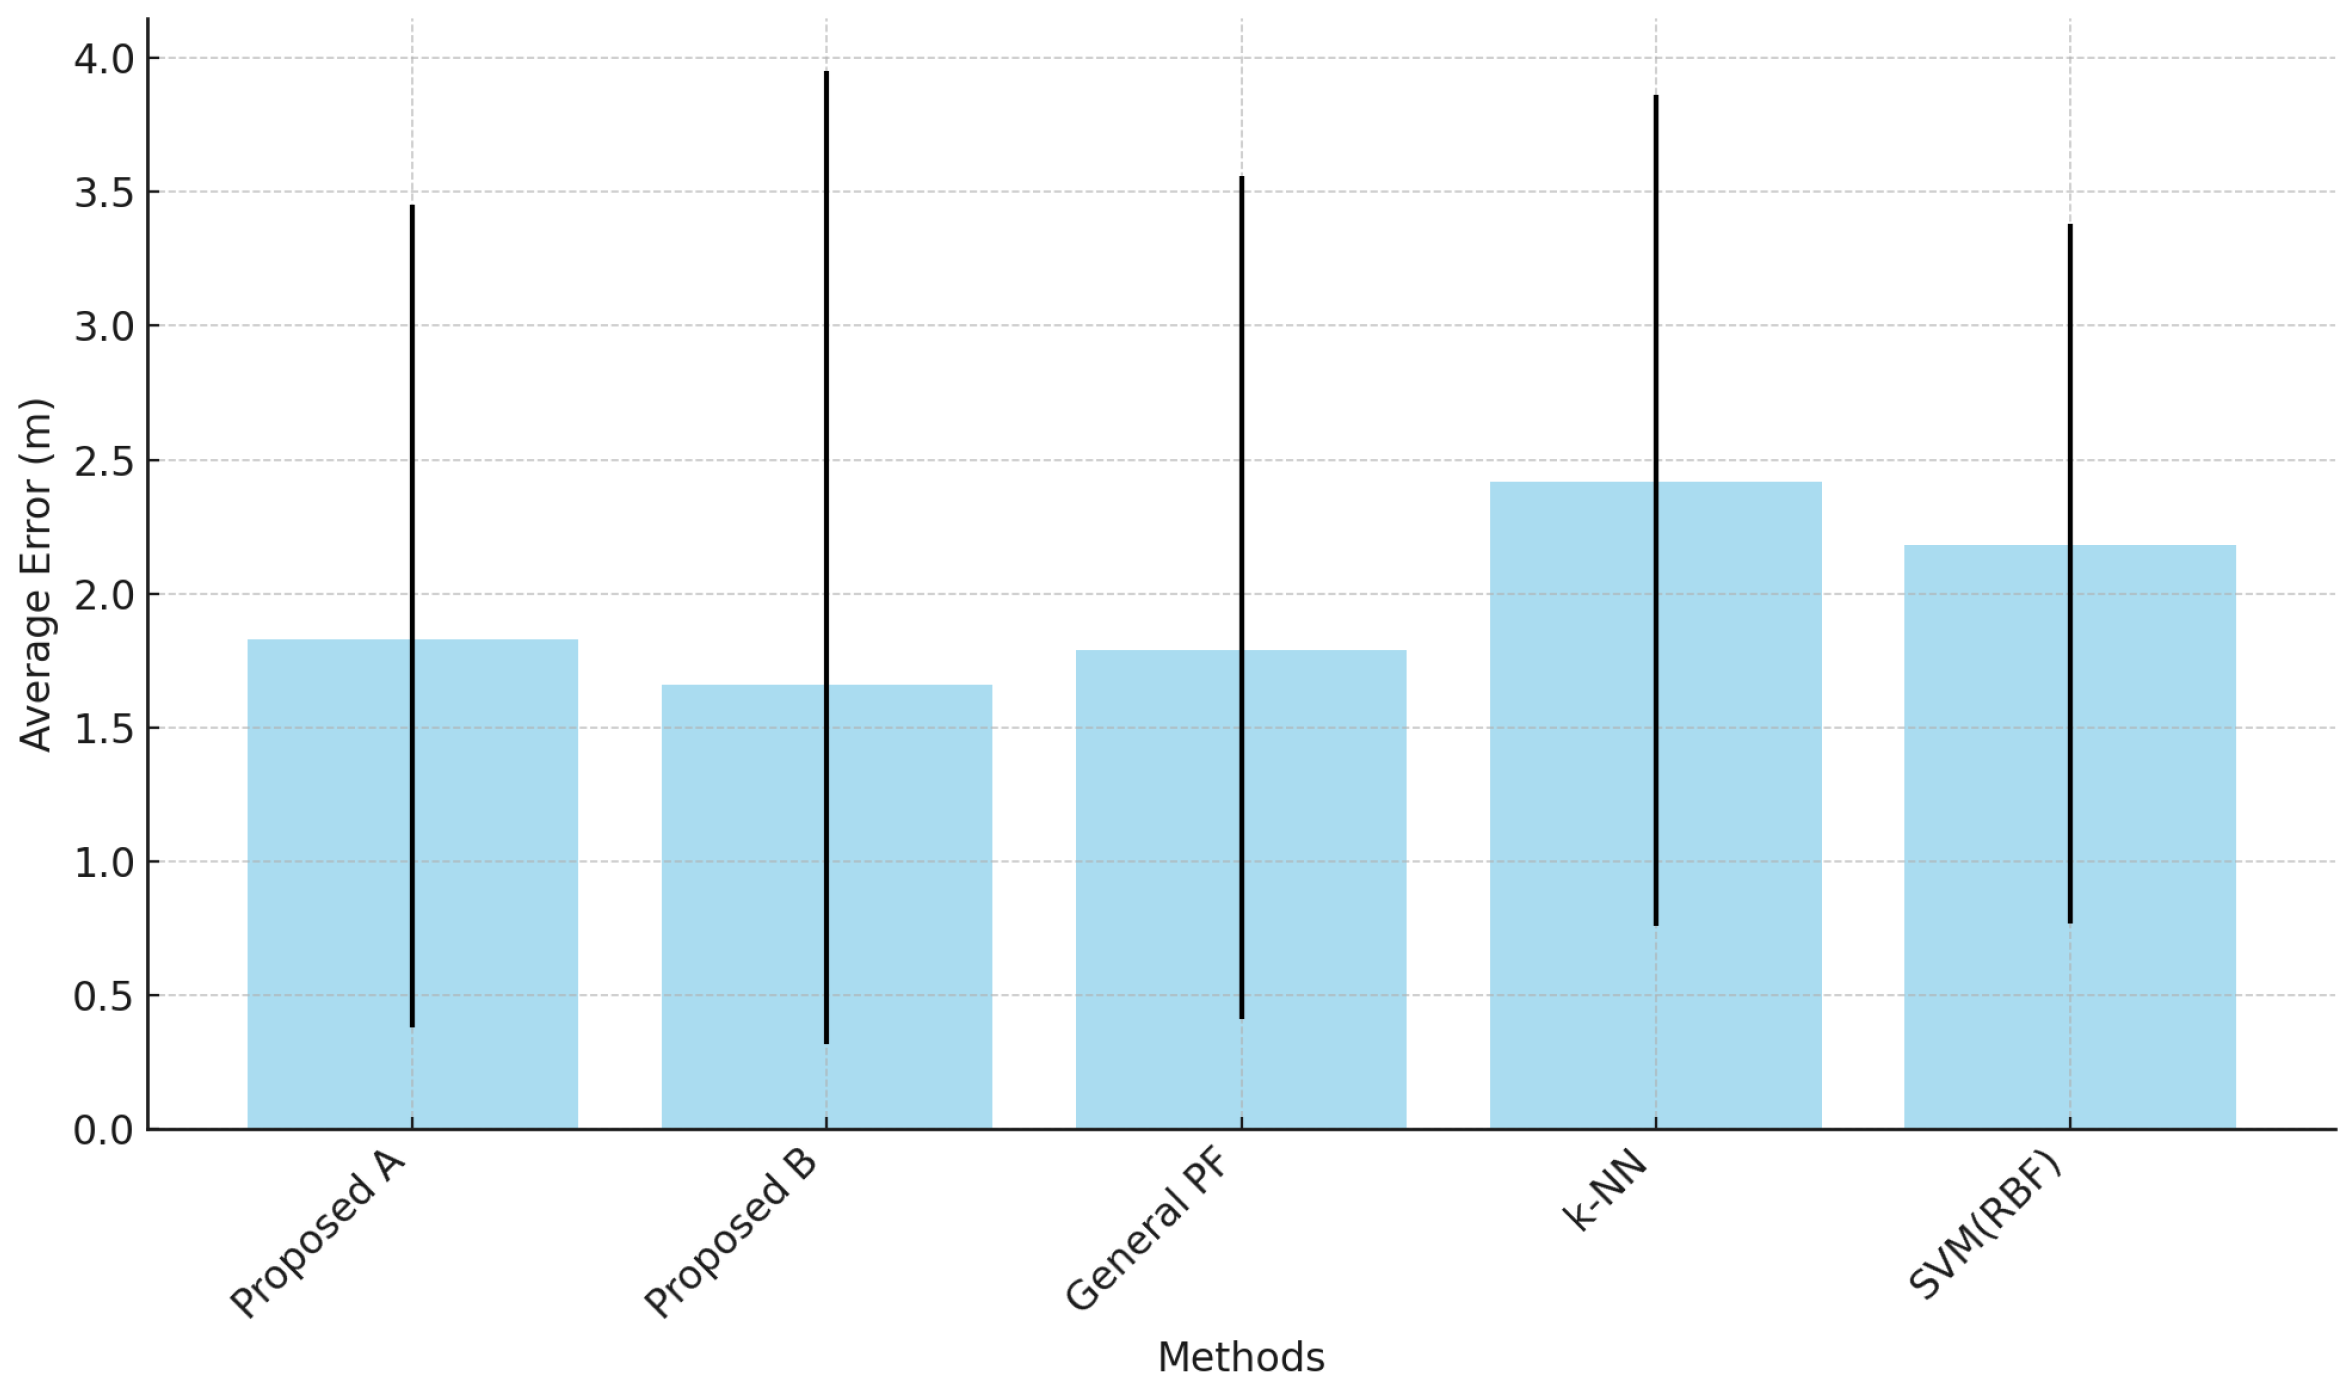
4.3. Results and Error Comparison
5. Conclusions
Author Contributions
Funding
Data Availability Statement
Conflicts of Interest
References
- Seo, W.; Hwang, S.; Park, J.; Lee, J.M. Precise outdoor localization with a GPS–INS integration system. Robotica 2013, 31, 371–379. [Google Scholar] [CrossRef]
- He, S.; Chan, S.H.G. Wi-Fi fingerprint-based indoor positioning: Recent advances and comparisons. IEEE Commun. Surv. Tutor. 2015, 18, 466–490. [Google Scholar] [CrossRef]
- Niu, J.; Wang, B.; Shu, L.; Duong, T.Q.; Chen, Y. ZIL: An energy-efficient indoor localization system using ZigBee radio to detect WiFi fingerprints. IEEE J. Sel. Areas Commun. 2015, 33, 1431–1442. [Google Scholar] [CrossRef]
- Ji, M.; Kim, J.; Jeon, J.; Cho, Y. Analysis of positioning accuracy corresponding to the number of BLE beacons in indoor positioning system. In Proceedings of the 2015 17th International Conference on Advanced Communication Technology (ICACT), Pyeong Chang, Republic of Korea, 1–3 July 2015; pp. 92–95. [Google Scholar]
- Zhuang, Y.; Yang, J.; Li, Y.; Qi, L.; El-Sheimy, N. Smartphone-Based Indoor Localization with Bluetooth Low Energy Beacons. Sensors 2016, 16, 596. [Google Scholar] [CrossRef] [PubMed]
- Röbesaat, J.; Zhang, P.; Abdelaal, M.; Theel, O. An Improved BLE Indoor Localization with Kalman-Based Fusion: An Experimental Study. Sensors 2017, 17, 951. [Google Scholar] [CrossRef] [PubMed]
- Goldoni, E.; Savioli, A.; Risi, M.; Gamba, P. Experimental analysis of RSSI-based indoor localization with IEEE 802.15. 4. In Proceedings of the 2010 European Wireless Conference (EW), Lucca, Italy, 12–15 April 2010; pp. 71–77. [Google Scholar]
- Bose, A.; Foh, C.H. A practical path loss model for indoor WiFi positioning enhancement. In Proceedings of the 2007 6th International Conference on Information, Communications & Signal Processing, Singapore, 10–13 December 2007; pp. 1–5. [Google Scholar]
- Patwari, N.; Hero, A.O.; Perkins, M.; Correal, N.S.; O’dea, R.J. Relative location estimation in wireless sensor networks. IEEE Trans. Signal Process. 2003, 51, 2137–2148. [Google Scholar] [CrossRef]
- Shu, Y.; Huang, Y.; Zhang, J.; Coué, P.; Cheng, P.; Chen, J.; Shin, K.G. Gradient-based fingerprinting for indoor localization and tracking. IEEE Trans. Ind. Electron. 2015, 63, 2424–2433. [Google Scholar] [CrossRef]
- Sinha, R.S.; Hwang, S.H. Comparison of CNN applications for RSSI-based fingerprint indoor localization. Electronics 2019, 8, 989. [Google Scholar] [CrossRef]
- Zhang, W.; Liu, K.; Zhang, W.; Zhang, Y.; Gu, J. Deep neural networks for wireless localization in indoor and outdoor environments. Neurocomputing 2016, 194, 279–287. [Google Scholar] [CrossRef]
- Shao, W.; Luo, H.; Zhao, F.; Ma, Y.; Zhao, Z.; Crivello, A. Indoor positioning based on fingerprint-image and deep learning. IEEE Access 2018, 6, 74699–74712. [Google Scholar] [CrossRef]
- Pu, Y.C.; You, P.C. Indoor positioning system based on BLE location fingerprinting with classification approach. Appl. Math. Model. 2018, 62, 654–663. [Google Scholar] [CrossRef]
- Yadav, R.K.; Bhattarai, B.; Gang, H.S.; Pyun, J.Y. Trusted k nearest bayesian estimation for indoor positioning system. IEEE Access 2019, 7, 51484–51498. [Google Scholar] [CrossRef]
- Fang, Y.; Deng, Z.; Xue, C.; Jiao, J.; Zeng, H.; Zheng, R.; Lu, S. Application of an improved K nearest neighbor algorithm in WiFi indoor positioning. In Proceedings of the China Satellite Navigation Conference (CSNC) 2015 Proceedings: Volume III, Xi’an, China, 13–15 May 2015; Springer: Berlin/Heidelberg, Germany, 2015; pp. 517–524. [Google Scholar]
- Cortes, C.; Vapnik, V. Support-vector networks. Mach. Learn. 1995, 20, 273–297. [Google Scholar] [CrossRef]
- Yi, Y.; Grejner-Brzezinska, D.A. Tightly-coupled GPS/INS integration using unscented Kalman filter and particle filter. In Proceedings of the 19th International Technical Meeting of the Satellite Division of The Institute of Navigation (ION GNSS 2006), Fort Worth, TX, USA, 26–29 September 2006; pp. 2182–2191. [Google Scholar]
- Fan, G.; Sheng, C.; Yu, B.; Huang, L.; Rong, Q. An Indoor and Outdoor Multi-Source Elastic Fusion Navigation and Positioning Algorithm Based on Particle Filters. Future Internet 2022, 14, 169. [Google Scholar] [CrossRef]
- Gustafsson, F.; Gunnarsson, F.; Bergman, N.; Forssell, U.; Jansson, J.; Karlsson, R.; Nordlund, P.J. Particle filters for positioning, navigation, and tracking. IEEE Trans. Signal Process. 2002, 50, 425–437. [Google Scholar] [CrossRef]
- Shin, S.; Park, C.; Kim, J.; Hong, H.; Lee, J. Adaptive step length estimation algorithm using low-cost MEMS inertial sensors. In Proceedings of the 2007 IEEE Sensors Applications Symposium, San Diego, CA, USA, 6–8 February 2007; pp. 1–5. [Google Scholar]
- Ascher, C.; Kessler, C.; Wankerl, M.; Trommer, G.F. Dual IMU indoor navigation with particle filter based map-matching on a smartphone. In Proceedings of the 2010 International Conference on Indoor Positioning and Indoor Navigation, Zurich, Switzerland, 15–17 September 2010; pp. 1–5. [Google Scholar]
- Zhang, S.; Yao, L.; Sun, A.; Tay, Y. Deep learning based recommender system: A survey and new perspectives. ACM Comput. Surv. (CSUR) 2019, 52, 1–38. [Google Scholar] [CrossRef]
- Xie, L.; Yuille, A. Genetic cnn. In Proceedings of the IEEE International Conference on Computer Vision, Venice, Italy, 22–29 October 2017; pp. 1379–1388. [Google Scholar]
- Smola, A.J.; Schölkopf, B. A tutorial on support vector regression. Stat. Comput. 2004, 14, 199–222. [Google Scholar] [CrossRef]
- Altendorfer, R.; Matzka, S. A new confidence estimator for vehicle tracking based on a generalization of Bayes filtering. IEEE Intell. Transp. Syst. Mag. 2012, 4, 30–41. [Google Scholar] [CrossRef]
- Kruschke, J.K. Bayesian estimation supersedes the t test. J. Exp. Psychol. Gen. 2013, 142, 573. [Google Scholar] [CrossRef]
- Kalman, R.E. A new approach to linear filtering and prediction problems. J. Basic Eng. 1960, 82, 35–45. [Google Scholar] [CrossRef]
- Doucet, A.; Godsill, S.; Andrieu, C. On sequential Monte Carlo sampling methods for Bayesian filtering. Stat. Comput. 2000, 10, 197–208. [Google Scholar] [CrossRef]
- Zhou, L.; Li, G.; Zheng, Z.; Xiao, T. A trust region-based particle filter algorithm for indoor tracking. Wirel. Pers. Commun. 2015, 80, 739–750. [Google Scholar] [CrossRef]
- Hammersley, J.M.; Morton, K.W. Poor man’s monte carlo. J. R. Stat. Soc. Ser. B (Methodol.) 1954, 16, 23–38. [Google Scholar] [CrossRef]
- Fu, X.; Jia, Y. An improvement on resampling algorithm of particle filters. IEEE Trans. Signal Process. 2010, 58, 5414–5420. [Google Scholar] [CrossRef]
- Murphy, K.; Russell, S. Rao-Blackwellised particle filtering for dynamic Bayesian networks. In Sequential Monte Carlo Methods in Practice; Springer: Berlin/Heidelberg, Germany, 2001; pp. 499–515. [Google Scholar]
- Pedregosa, F.; Varoquaux, G.; Gramfort, A.; Michel, V.; Thirion, B.; Grisel, O.; Blondel, M.; Prettenhofer, P.; Weiss, R.; Dubourg, V.; et al. Scikit-learn: Machine learning in Python. J. Mach. Learn. Res. 2011, 12, 2825–2830. [Google Scholar]
- Houwa System Design Company. Bluetooth Low Energy Beacon Module BLEAD-B Version 2. 2017. Available online: https://houwa-js.co.jp/service/product/blead-b/ (accessed on 19 December 2022).
- Huawei Technologies Co., Ltd. Honor 8. 2016. Available online: https://consumer.huawei.com/jp/support/phones/honor-8/ (accessed on 19 December 2022).
- Zhao, Y. Study of Gaussian Kernel Functions in Support Vector Machines. Ph.D. Thesis, East China Normal University, Shanghai, China, 2007. [Google Scholar]
- Wang, X.L.; Li, Z.B. Identifying the Parameters of the Kernel Function in Support Vector Machines Based on the Grid-Search Method. Period. Ocean. Univ. China 2005, 5, 859–862. [Google Scholar]
- Yuan, Z.; Zhang, X.; Zhou, P.; Wang, S. Research on Indoor Position Fingerprint Location Based on Machine Learning combined Particle Filter. In Proceedings of the 2019 2nd International Conference on Safety Produce Informatization (IICSPI), Chongqing, China, 28–30 November 2019; pp. 456–459. [Google Scholar] [CrossRef]
- Mohammadi, M. BLE RSSI Dataset for Indoor Localization. 2018. Available online: https://www.kaggle.com/datasets/mehdimka/ble-rssi-dataset/data (accessed on 29 May 2024).


| BLE Products | BLEAD-B Ver.2 [35] |
|---|---|
| Standard | Bluetooth Ver.4.0 |
| Size | Dia. 50 × 16.5 mm |
| Weight | 28 g |
| Range | Approx. 5–100 m |
| Locating Device | Honor 8 [36] |
| OS | Android ver.7 |
| SVM (RBF) | SVM (Polynomial) | |
|---|---|---|
| Minimum error (m) | 0.77 | 0.32 |
| Maximum error (m) | 3.38 | 4.56 |
| Average error (m) | 2.18 | 2.56 |
| Std Dev (m) | 0.31 | 0.38 |
| Proposed A | Proposed B | k-NN + General PF | k-NN | SVM (RBF) | |
|---|---|---|---|---|---|
| Minimum error (m) | 0.38 | 0.32 | 0.41 | 0.76 | 0.77 |
| Maximum error (m) | 3.45 | 3.95 | 3.56 | 3.86 | 3.38 |
| Average error (m) | 1.83 | 1.66 | 1.79 | 2.42 | 2.18 |
| Std Dev (m) | 0.18 | 0.25 | 0.19 | 0.30 | 0.31 |
| Proposed A | Proposed B | k-NN + General PF | k-NN | SVM (RBF) | |
|---|---|---|---|---|---|
| Minimum error (m) | 0.30 | 0.18 | 2.83 | 0.00 | 0.03 |
| Maximum error (m) | 18.59 | 24.08 | 18.26 | 25.88 | 19.84 |
| Average error (m) | 5.97 | 5.52 | 6.22 | 6.13 | 6.22 |
| Variance (m2) | 3.75 | 3.38 | 3.87 | 5.24 | 4.66 |
Disclaimer/Publisher’s Note: The statements, opinions and data contained in all publications are solely those of the individual author(s) and contributor(s) and not of MDPI and/or the editor(s). MDPI and/or the editor(s) disclaim responsibility for any injury to people or property resulting from any ideas, methods, instructions or products referred to in the content. |
© 2024 by the authors. Licensee MDPI, Basel, Switzerland. This article is an open access article distributed under the terms and conditions of the Creative Commons Attribution (CC BY) license (https://creativecommons.org/licenses/by/4.0/).
Share and Cite
Qian, J.; Li, J.; Komuro, N.; Kim, W.-S.; Yoo, Y. Improved Particle Filter in Machine Learning-Based BLE Fingerprinting Method to Reduce Indoor Location Estimation Errors. Future Internet 2024, 16, 211. https://doi.org/10.3390/fi16060211
Qian J, Li J, Komuro N, Kim W-S, Yoo Y. Improved Particle Filter in Machine Learning-Based BLE Fingerprinting Method to Reduce Indoor Location Estimation Errors. Future Internet. 2024; 16(6):211. https://doi.org/10.3390/fi16060211
Chicago/Turabian StyleQian, Jingshi, Jiahe Li, Nobuyoshi Komuro, Won-Suk Kim, and Younghwan Yoo. 2024. "Improved Particle Filter in Machine Learning-Based BLE Fingerprinting Method to Reduce Indoor Location Estimation Errors" Future Internet 16, no. 6: 211. https://doi.org/10.3390/fi16060211