Article

Leveraging Internet News-Based Data for Rockfall Hazard Susceptibility Assessment on Highways

Department of Civil Engineering, National Taipei University of Technology, Taipei 10608, Taiwan
*
Author to whom correspondence should be addressed.
Future Internet 2024, 16(8), 299; https://doi.org/10.3390/fi16080299
Submission received: 16 July 2024 / Revised: 15 August 2024 / Accepted: 19 August 2024 / Published: 21 August 2024

Abstract

:
Over three-quarters of Taiwan’s landmass consists of mountainous slopes with steep gradients, leading to frequent rockfall hazards that obstruct traffic and cause injuries and fatalities. This study used Google Alerts to compile internet news on rockfall incidents along Taiwan’s highway system from April 2019 to February 2024. The locations of these rockfalls were geolocated using Google Earth and integrated with geographical, topographical, environmental, geological, and socioeconomic variables. Employing machine learning algorithms, particularly the Random Forest algorithm, we analyzed the potential for rockfall hazards along roadside slopes. The model achieved an overall accuracy of 0.8514 on the test dataset, with a sensitivity of 0.8378, correctly identifying 83.8% of rockfall locations. Shapley Additive Explanations (SHAP) analysis highlighted that factors such as slope angle and distance to geologically sensitive areas are pivotal in determining rockfall locations. The study underscores the utility of internet-based data collection in providing comprehensive coverage of Taiwan’s highway system, and enabled the first broad analysis of rockfall hazard susceptibility for the entire highway network. The consistent importance of topographical and geographical features suggests that integrating detailed spatial data could further enhance predictive performance. The combined use of Random Forest and SHAP analyses offers a robust framework for understanding and improving predictive models, aiding in the development of effective strategies for risk management and mitigation in rockfall-prone areas, ultimately contributing to safer and more reliable transportation networks in mountainous regions.

1. Introduction

Rockfalls are a type of geological hazard occurring in mountainous regions with steep slopes and rock material, categorized under general landslides. Varnes [1] classified landslides into falls, topples, slides, spreads, and flows, with rockfalls being a specific type of fall movement involving rock rather than engineering soils. The susceptibility of highways to rockfall hazards is a critical concern due to the potential risks to traffic safety and infrastructure. Despite the importance of this issue, research focusing specifically on rockfall susceptibility along highways is relatively scarce, as most studies address broader regions and various types of slope instability rather than the specific dangers posed by rockfalls on highways. This underscores the need for more targeted studies in this area.
Traditionally, rockfall hazards have been analyzed using rating systems. For instance, in mainland China, many highways constructed in the western mountainous region face significant rockfall hazards. To address this, a rockfall rating system based on an Italian method was applied, adjusting weights for rockfall hazard factors and vehicle vulnerability factors to improve accuracy [2]. Additionally, another study in Italy developed a methodology to assess rockfall hazards and associated risks along transportation networks [3]. This approach combines historical recurrence data, frequency-volume statistics from recent rockfall events, and a physically-based, spatially distributed rockfall simulation model. By integrating this information within a Geographic Information System (GIS), the study identifies road sections potentially at risk of rockfalls. Expanding methodological approaches, another study in the Swiss Alps enhances regional rock-mass-failure susceptibility assessment by integrating detailed slope angle analysis of recent Digital Elevation Models (DEMs) with the Slope Angle Distribution procedure [4]. Introducing a normalized cumulative distribution function provides quantitative slope angle weighting, improving susceptibility assessments. Using GIS-based software Flow-R, the method also assesses rockfall runout, enabling the creation of hazard and risk maps. In a different geographic context, research from India examines rockfall issues on highly jointed, near-vertical rock cut slopes, excavated without thorough geotechnical and geological investigations along a riverbank [5]. Field inspections and kinematic analyses identified probable slope failure zones, and the study employed 2D rockfall analysis to estimate energy loss from falling blocks impacting the slope face and the road.
Further research in Italy used rockfall occurrence databases and thematic maps to compute a susceptibility map using the Analytical Hierarchy Process (AHP) [6]. The results underscore the significance of morphometric factors in rockfall phenomena. Another study in Iran combined AHP with Weight of Evidence (WoE) and Frequency Ratio (FR) to evaluate rockfall susceptibility mapping [7]. Data from 34 rockfall locations were compiled from various sources, identifying eight factors influencing rockfalls. The results indicate that the WoE method provides better prediction accuracy for rockfall susceptibility mapping compared to the AHP and FR methods. Additionally, a study in Iran analyzed rockfall susceptibility mapping using Artificial Neural Networks (ANN) with 15 factors and data from 57 historical rockfalls [8]. The findings revealed that the northern part of the studied region has a high risk of rockfall failures. Another approach emphasizes the optimization of algorithm hyperparameters for rockfall susceptibility mapping in China [9]. The authors constructed a geological database containing 220 historical rockfalls and 220 non-rockfall cells. Through their analysis using recursive feature elimination, they identified 9 key factors from a list of 23, underscoring the significance of feature selection in improving model performance.
A study that has more data points is the mapping of landslide susceptibility along the Karakoram Highway in Pakistan [10]. This study addresses not only rockfalls, but also rockslides and debris flows. Since the Karakoram Highway’s completion in 1979, frequent disruptions due to rockfalls, rockslides, and debris flows have been common, often triggered by heavy rainfall—conditions similar to those in Taiwan. The study employs machine learning models and a landslide inventory comprising 303 points to evaluate the relationship between landslide events and their causative factors.
The literature review reveals that few comprehensive studies have been conducted on rockfall hazard susceptibility, with many existing studies on rockfalls often including broader landslide phenomena, rather than focusing exclusively on rockfalls. Additionally, the data points in these studies are typically limited, ranging from 34 to 303, including rockslides and debris flows. Various methods have been employed in hazard susceptibility analysis, such as rockfall rating systems, AHP, physically-based methods, and ANN, among others.
In contrast, the current study leverages the power of the internet and Google Alerts to automatically collect daily news from Taiwan from April 2019 to February 2024, thereby creating a comprehensive database exclusively focusing on rockfall events. The locations of these events are pinpointed using Google Earth for an extensive rockfall hazard susceptibility analysis. Specifically, this research focuses on rockfall events near the highway system caused by rainfall, excluding events on other types of roads such as farm roads, urban roads, forest roads, or hiking trails or those caused by earthquakes. Furthermore, this study employs advanced machine learning algorithms, particularly the Random Forest algorithm, known for its superior performance in various applications. The primary objective is to develop a detailed rockfall hazard susceptibility assessment for Taiwan’s roadway system.

2. Materials and Methods

The following sections describe our methodology for leveraging the power of the internet and Google Alerts to automatically collect daily news from Taiwan, from April 2019 to February 2024, regarding rockfalls near highways. This process enabled us to create a comprehensive database exclusively focused on highway rockfall events. We combined geographical, topographical, environmental, geological, and socioeconomic data, and used machine learning to analyze rockfall hazards. During the preparation of this manuscript, we used ChatGPT to improve readability and language. We reviewed and edited the content as needed, and take full responsibility for the publication’s content.

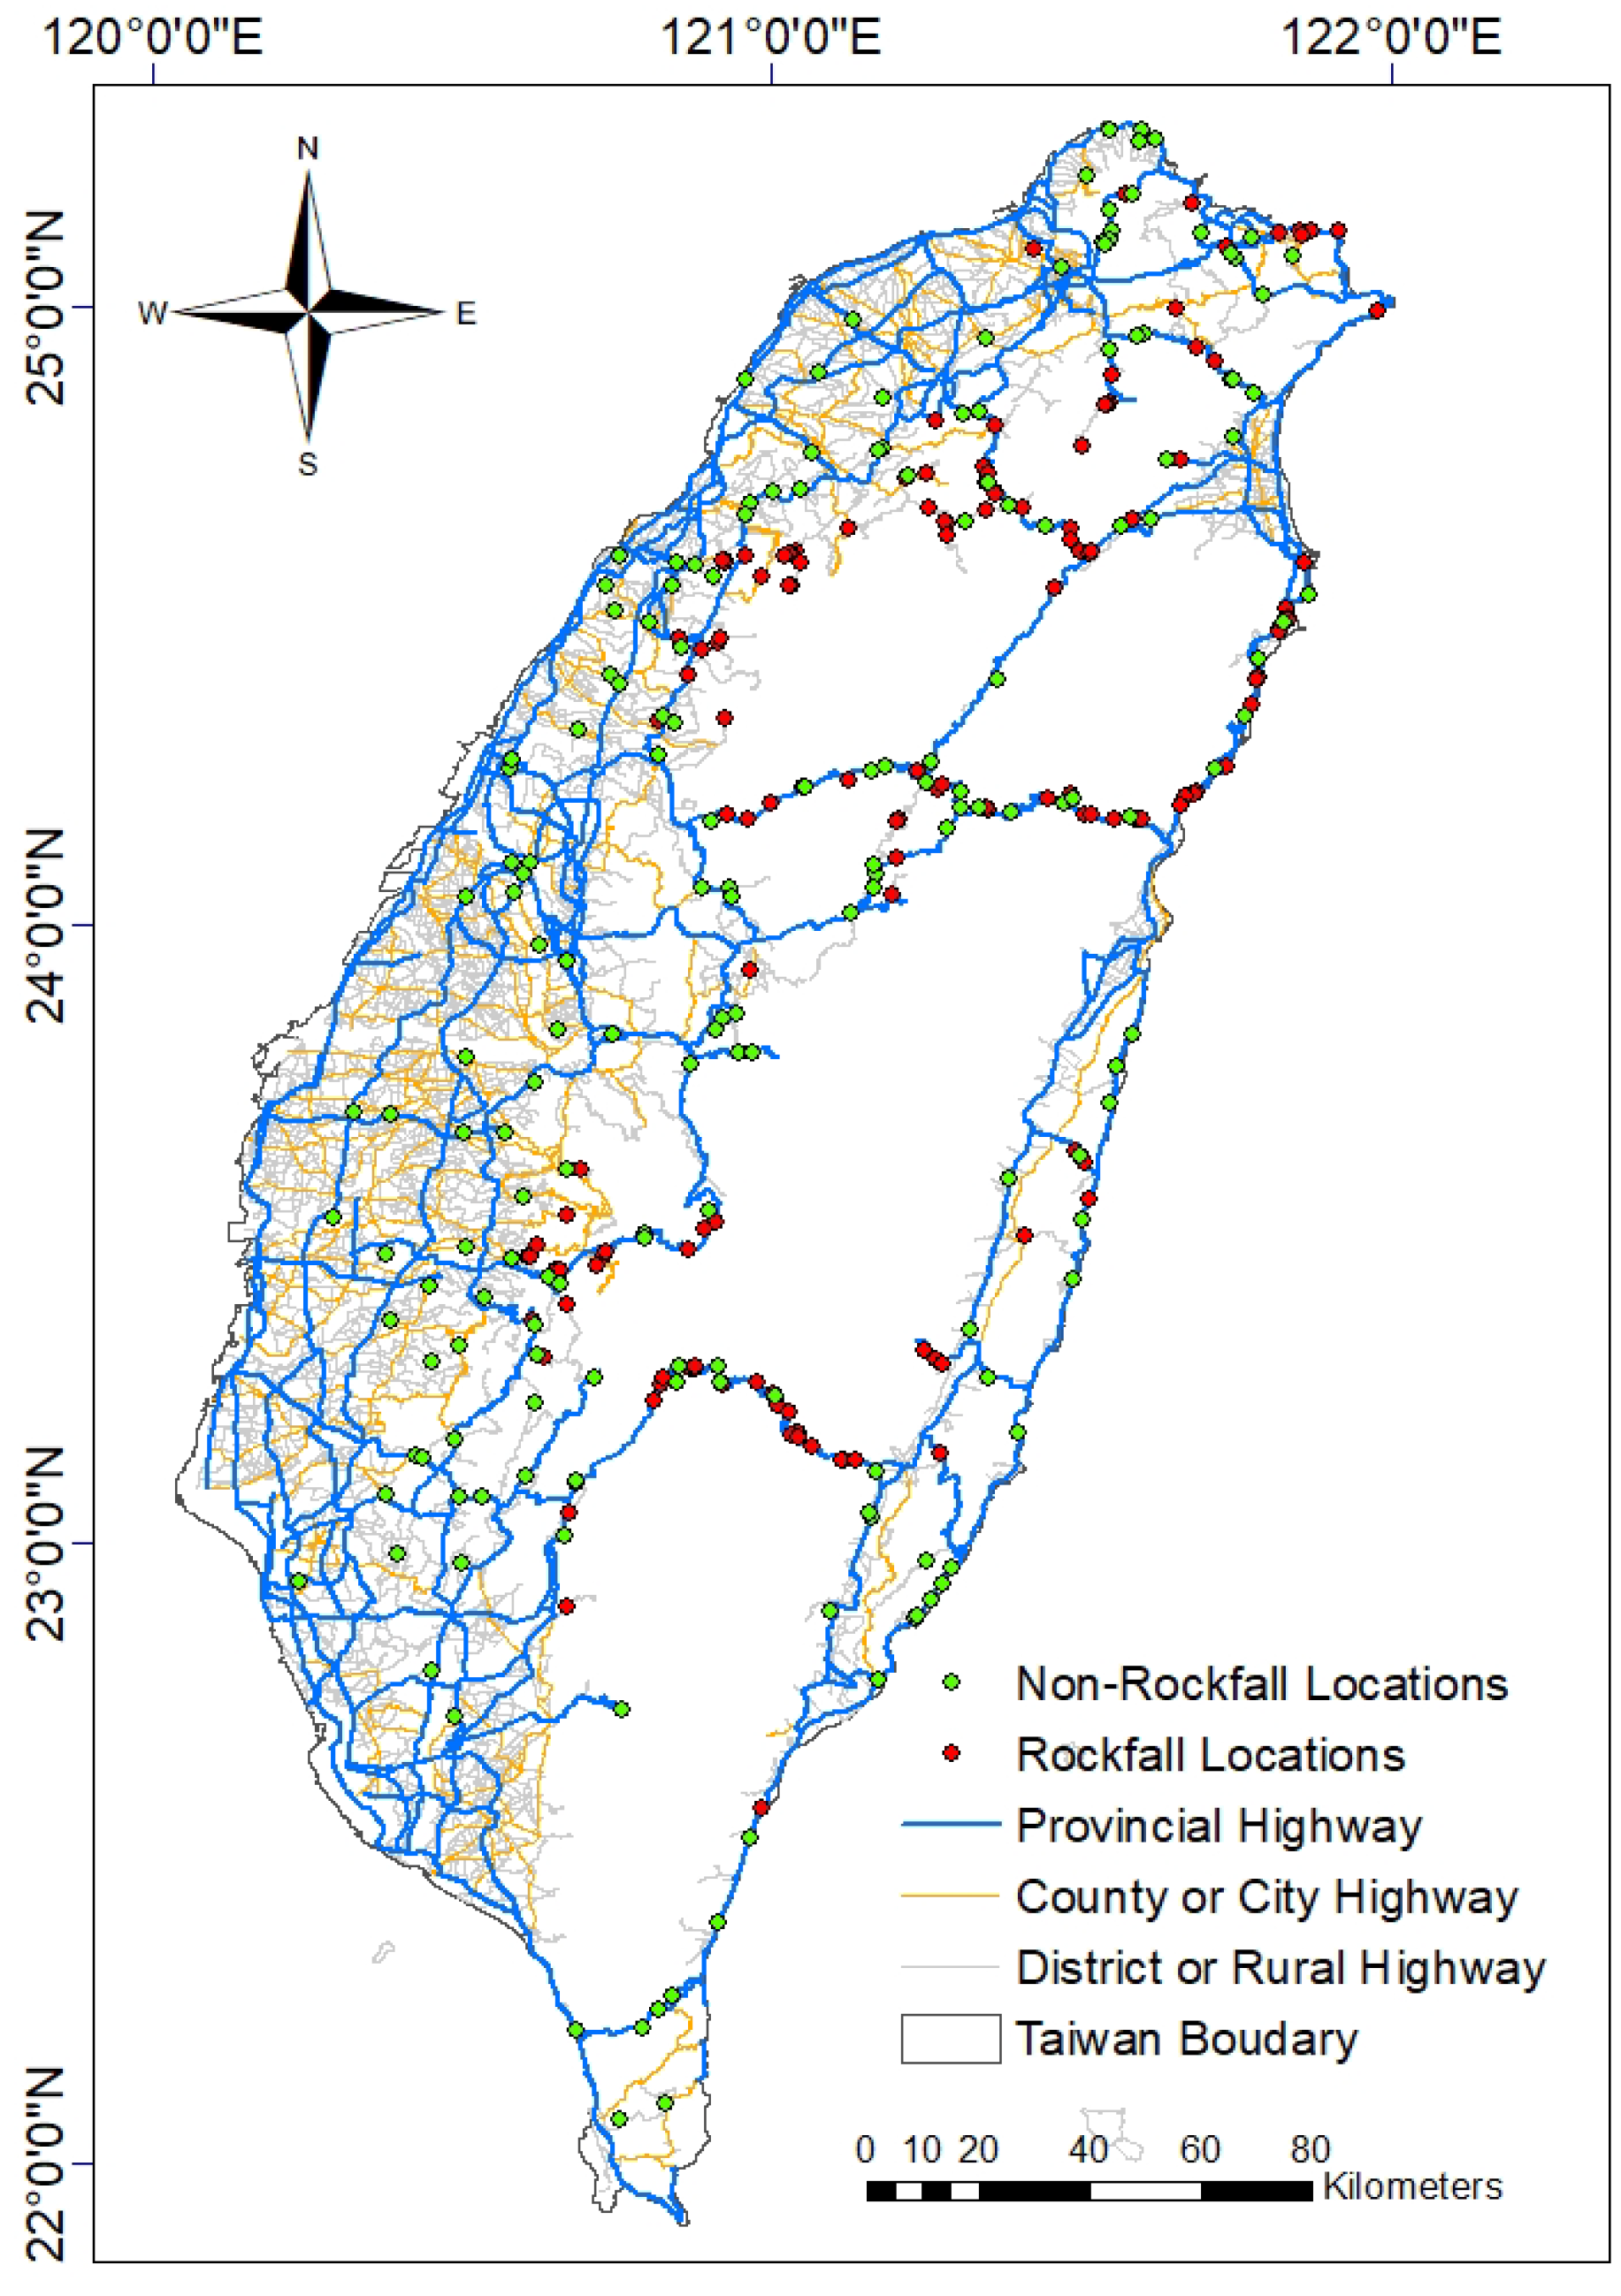
2.1. Rockfall Data Collection

Taiwan is an island celebrated for its unique environment and diverse geological landscapes. Positioned at the convergence of tectonic plates, and in the path of Pacific typhoons, Taiwan features rugged terrain with steep slopes and high mountains, making it highly vulnerable to natural hazards such as typhoons, floods, landslides, and earthquakes. In 2005, a World Bank report indicated that 73% of Taiwan’s land and population are exposed to three or more hazards, such as earthquakes, landslides, or floods, and almost 99% of its land and population are exposed to two or more hazards [11]. Taiwan may be considered one of the most vulnerable areas to natural hazards on Earth [12,13]. Many of these hazards have been extensively studied by various researchers. However, no one has systematically and comprehensively studied rockfall hazards specifically on Taiwan’s highway system or analyzed the rockfall hazard vulnerability.
Taiwan has an extensive highway system. The layout of the highways relevant to this study is shown in Figure 1, and the lengths of the highways are presented in Table 1. The total length is 21,839.6 km, which includes 1061.8 km of National Expressways, 5323.2 km of Provincial Highways, 3684.1 km of City and County Highways, 11,362.7 km of District and Rural Highways, and 407.8 km of Exclusive Highways [14].
Rockfall events are frequent in Taiwan, yet they often go unreported in mainstream TV news and newspapers, unless they are particularly significant. Consequently, identifying these occurrences frequently necessitates consulting local news reports, posing a challenge to the comprehensive collection of rockfall events essential for hazard susceptibility analysis. To address this, we used Google Alerts, a tool that sends notifications about new online content based on specified keywords, to automatically search for relevant reports from a wide range of news sources that are typically inaccessible or unnoticed. The Google Alerts were configured to search daily for rockfall events and send pertinent news to the author. Since April 2019, we have been employing this method, which has allowed us to gather data until February 2024. Note that most internet news in Taiwan is only available for a short period online. Usually, it is not possible to search and retrieve internet news that is a few months old, let alone a few years old.
The highway types targeted for this study are those listed in Table 1, which does not include farm roads, urban roads, forest roads, or hiking trails. Each rockfall event reported in the news was manually verified and geolocated using Google Earth by referencing kilometer markers and road names/numbers and utilizing street view. This meticulous process enabled us to compile a primary dataset essential for our rockfall hazard analysis. The dataset not only provides a comprehensive record of rockfall incidents, but also offers valuable insights into the spatial distribution and frequency of rockfalls across Taiwan, facilitating a more accurate and detailed hazard susceptibility assessment. In total, we identified 126 rockfall events along the Provincial Highways, 19 rockfall events along the City and County Highways, and 37 rockfall events along the District and Rural Highways. There were no rockfalls along the National Expressways and the Exclusive Highways. The rockfall locations are also shown in Figure 1 as red dots. Overall, 24.7% of the Provincial Highways experienced rockfalls, 8.2% of the City and County Highways experienced rockfalls, and 0.7% of the District and Rural Highways experienced rockfalls. In terms of the number of rockfalls per kilometer, the Provincial Highways have the highest frequency, followed by the City and County Highways, and finally the District and Rural Highways. These statistics highlight the Provincial Highways as experiencing the highest frequency of rockfall incidents and the most significant impact.
The primary objective of this study is to predict the occurrence of rockfalls along highways, with the model’s target outcome being binary—either the occurrence or non-occurrence of a rockfall. To build a robust predictive model, we used the 182 known rockfall locations (positive samples), and supplemented them with 182 randomly generated non-rockfall locations (negative samples) along the highways, as shown in Figure 1.
Given that different types of highways have varying design requirements and service levels—such as minimum lane widths, turning radius, pavement thickness, signage, lighting, and bridge design—the selection of negative samples needed to reflect the characteristics of the positive samples across different highway types. To achieve this, we maintained the same proportion of negative samples as positive samples within each type of highway. This was performed by generating a 20-m buffer around the roads and employing stratified random sampling within each highway category. Specifically, 126 negative samples were created along Provincial Highways, 19 along City and County Highways, and 37 along District and Rural Highways, resulting in a total of 364 data points for analysis.

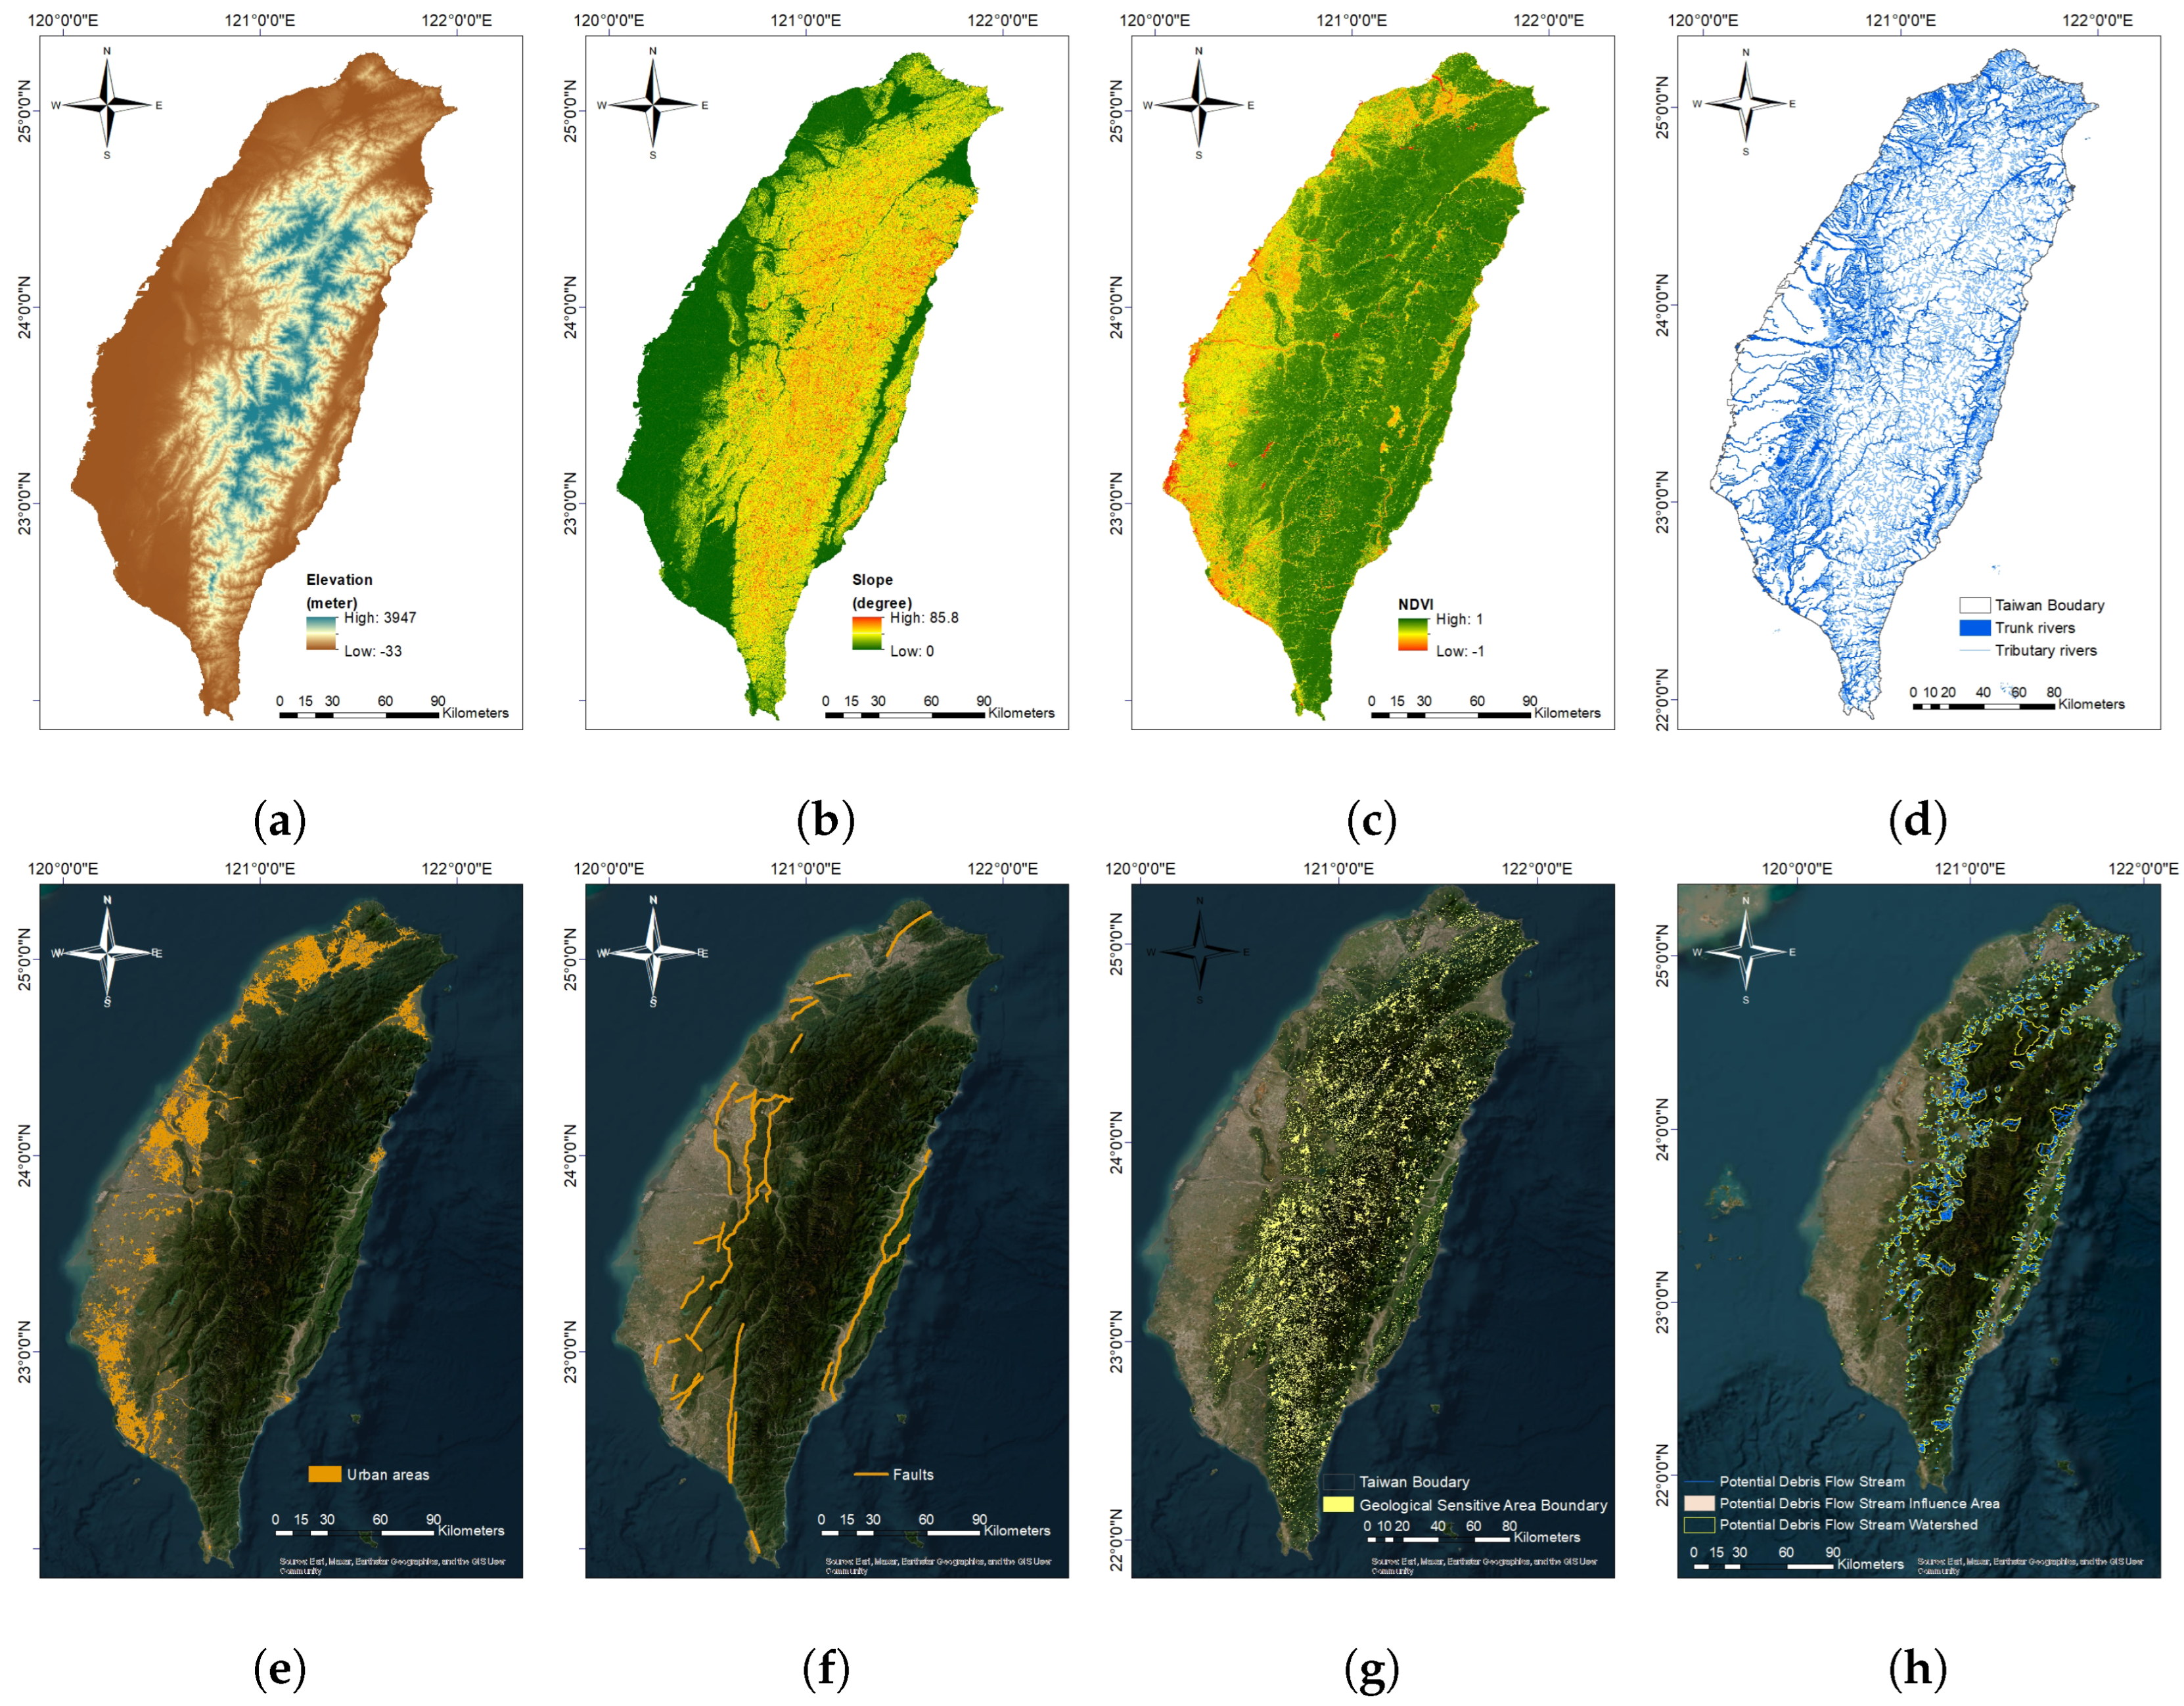
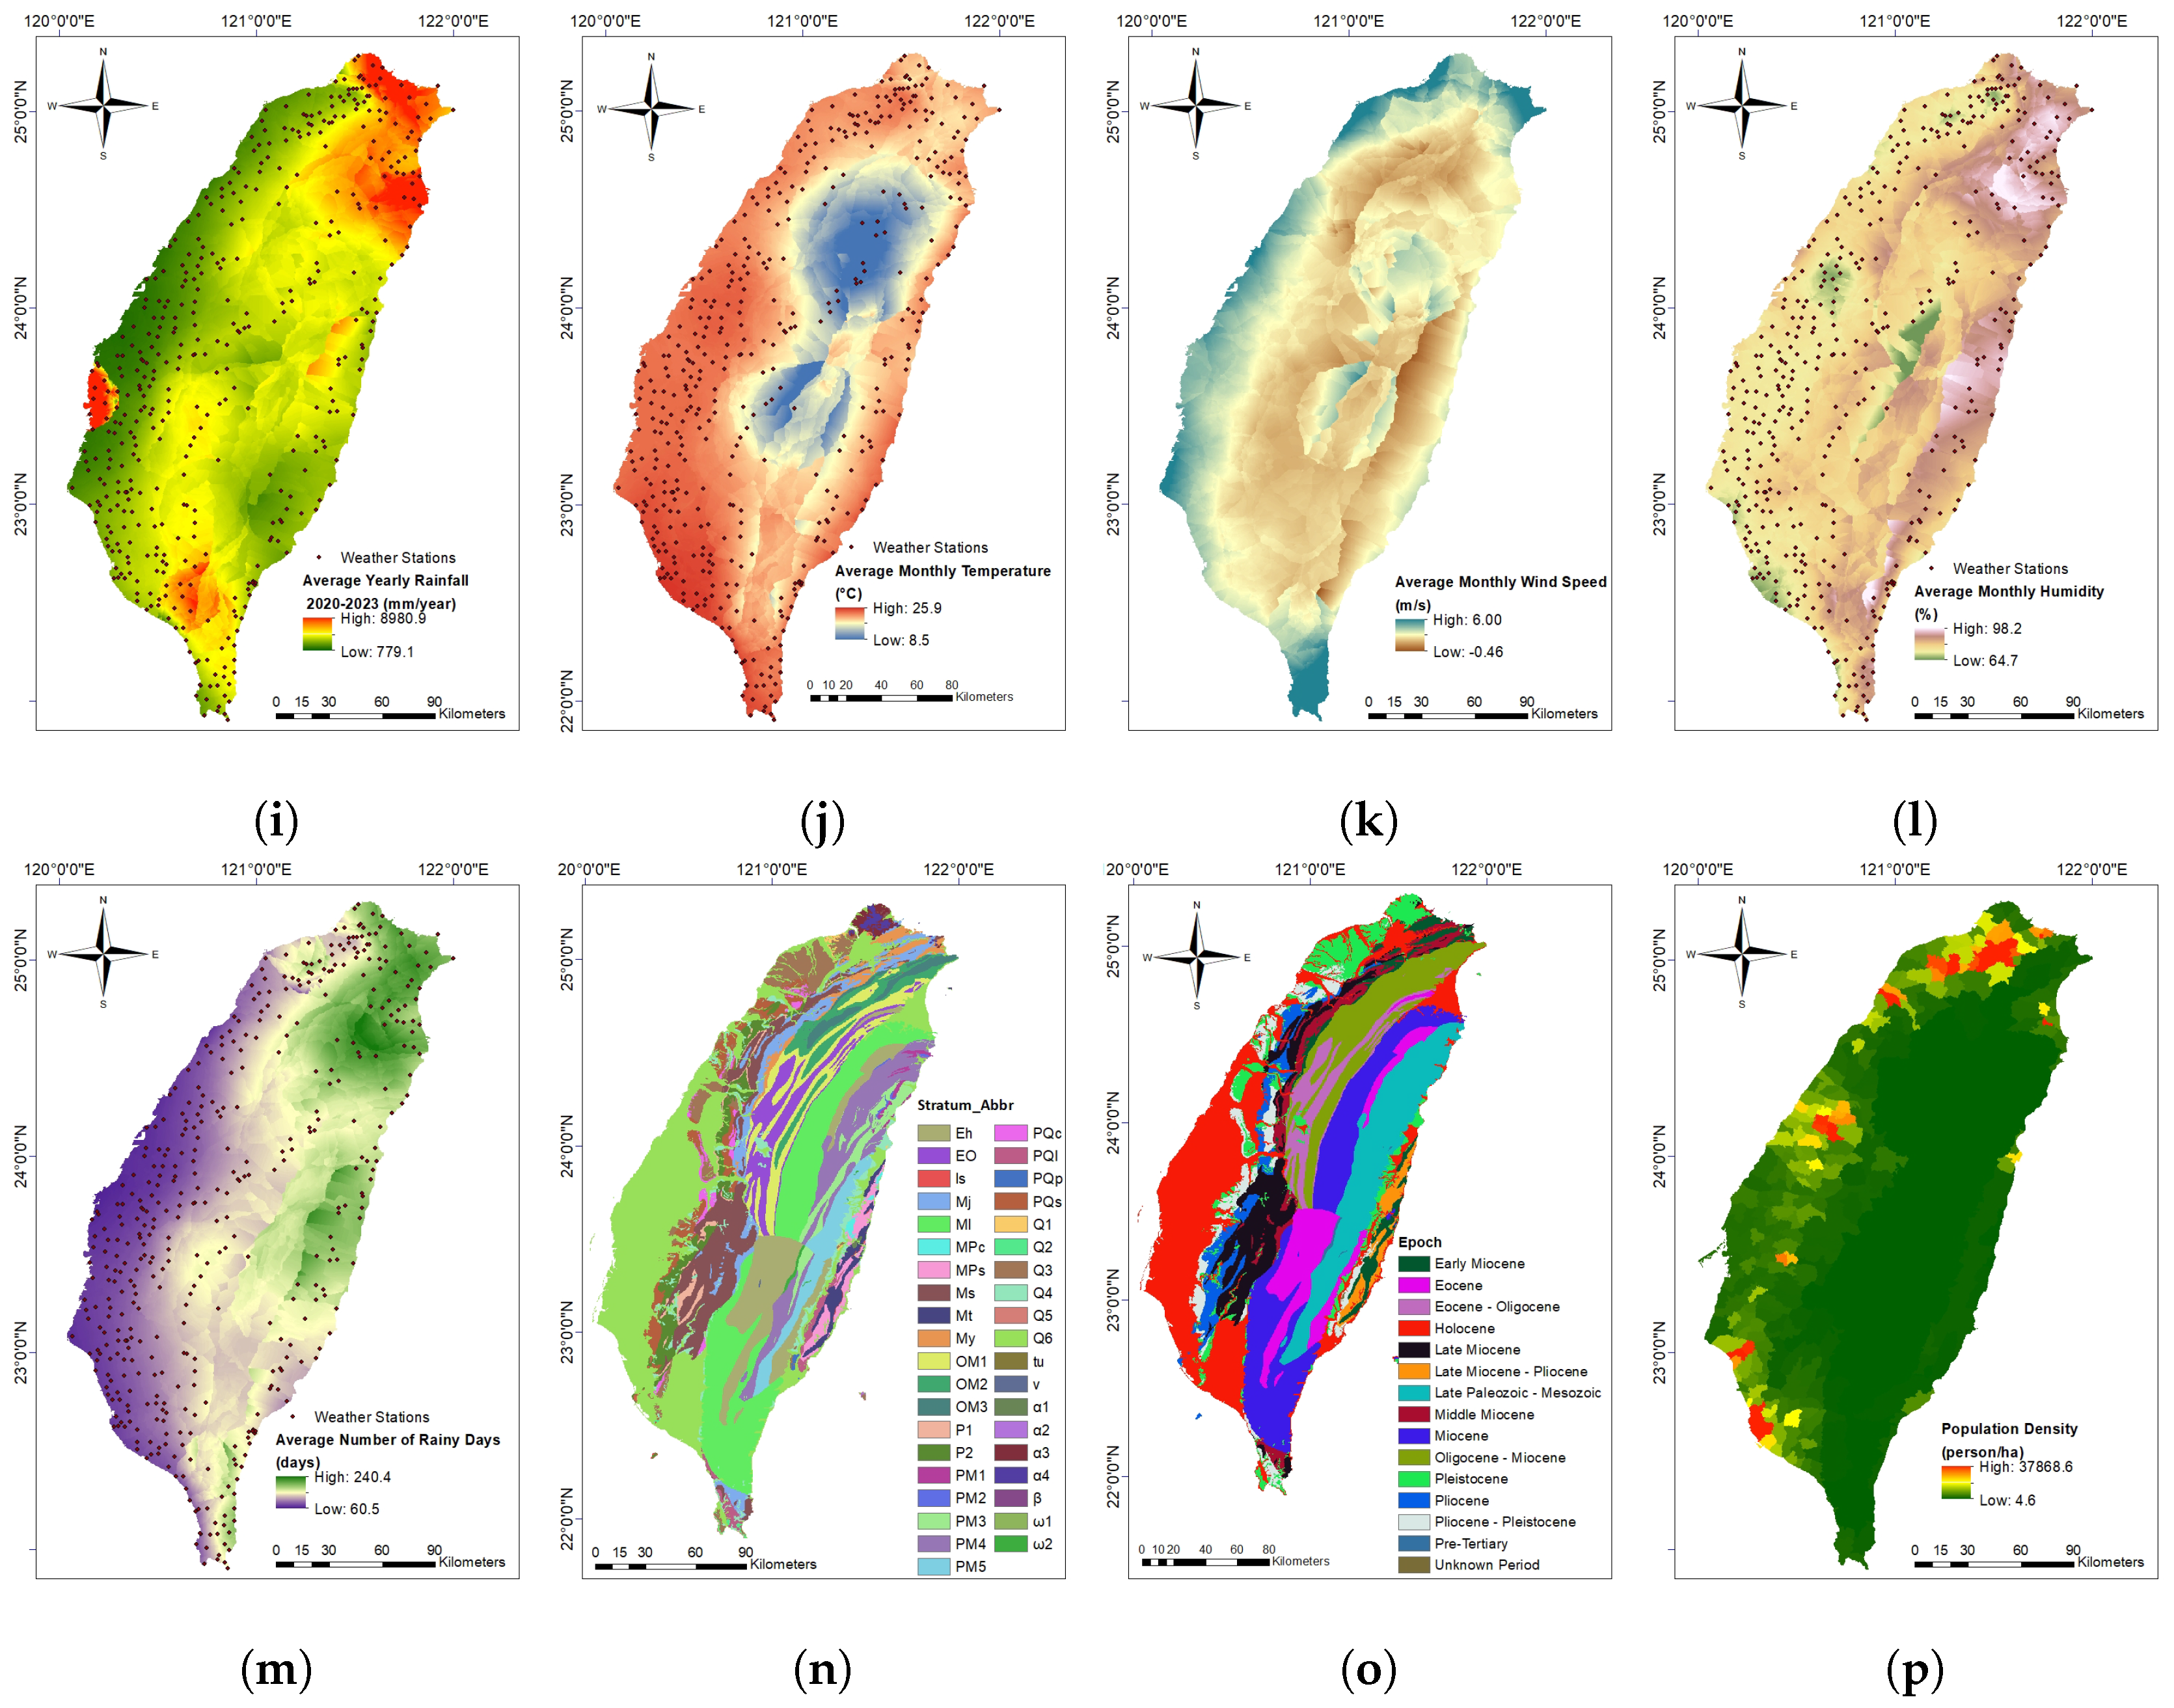
2.2. Independent Variables for Rockfall Analysis

To use machine learning for analyzing the rockfall hazard of Taiwan’s highway system, it is essential to collect independent variables related to rockfall occurrences. These variables, known as features or predictors, improve the accuracy of predictions. Gathering a diverse set of predictors helps in capturing the complex interactions between various factors influencing rockfall events, thereby enhancing the model’s predictive power.
In this study, we drew on our extensive experience with machine learning on soil erosion depths [15], cover management factors [16], and global vegetation growth [17] to compile a comprehensive list of 28 predictive variables. These variables are categorized into five groups: geographical, topographical, environmental, geological, and socioeconomic, as shown in Table 2. This categorization allows for a structured approach in analyzing the impact of different types of variables on rockfall occurrences.
The DEM and population density data in Table 2 were sourced from the Ministry of the Interior. Slope, aspect, curvature, topographic wetness index, stream power index, and terrain ruggedness index were calculated from the DEM. The river network data were obtained from the Water Resources Agency. Fault lines, geologically sensitive areas, epoch, and stratum data were provided by the Geological Survey and Mining Management Agency. Urban area data were sourced from the Global Urban Boundaries dataset [18]. Data on debris flow streams, watersheds, and influence areas were obtained from the Agency of Rural Development and Soil and Water Conservation. Distances to rivers, faults, urban boundaries, geologically sensitive areas, debris flow streams, their watersheds, and influence areas were calculated. Rainfall, temperature, wind speed, and humidity data were obtained from the Central Weather Administration.
The necessary computations were performed using both R and ArcMap GIS. The integration of R and ArcMap GIS facilitated systematic data processing and analysis, ensuring accuracy and reliability in our dataset. This dataset serves as a foundational resource for our study on rockfall hazard assessment, supporting evidence-based decision-making and proactive measures for disaster risk reduction in Taiwan.
Figure 2 illustrates the distribution of some of these variables across Taiwan. Each subfigure may represent a single predictor or a combination of predictors, from which additional predictors can be computed. For instance, distance to geologically sensitive areas and slope angle are critical geographical and topographical variables that influence the likelihood of rockfalls. Similarly, environmental variables such as average yearly rainfall and NDVI provide insights into climatic conditions and vegetation cover, which are essential for understanding the environmental context of rockfall events.
By integrating these diverse data sources, we aimed to develop a robust predictive model tailored to Taiwan’s conditions. The model leverages the comprehensive dataset to identify patterns and relationships that may not be immediately apparent through traditional analysis methods. This approach not only enhances the accuracy of predictions, but also provides a deeper understanding of the factors contributing to rockfall hazards in Taiwan.

2.3. Machine Learning and Accuracy Indices

The Random Forest technique is a robust and versatile machine learning method that operates by constructing multiple decision trees during training and combining their outcomes to enhance predictive accuracy and control overfitting. Each decision tree is built using a subset of the data, and the final prediction is obtained by averaging the results of these individual trees (regression) or by majority voting (classification). This ensemble approach not only improves the model’s performance, but also provides insights into the importance of various predictive variables.
In our rockfall hazard susceptibility study, the Random Forest technique [19] was employed due to its ability to handle complex, non-linear relationships and its effectiveness with large datasets. Recent studies have shown that among various machine learning algorithms, Random Forest consistently outperforms others in terms of precision and classification accuracy, achieving over 90% accuracy in predicting small rockfall locations [20]. This method has been successfully applied in studies of landslide susceptibility [21], soil erosion [22], forest growth [23], soil organic carbon [24], and potential groundwater zones [25]. Its capability to manage a wide range of input variables and its robustness against overfitting made it particularly suitable for our comprehensive analysis of rockfall susceptibility in Taiwan.
The dataset for this research was divided into a training dataset (approximately 80%, consisting of 145 positive and 145 negative samples) for training the Random Forest model, and a test dataset (approximately 20%, consisting of 37 positive and 37 negative samples) for evaluating the model’s performance. The Random Forest model was trained using the “randomForest” package in R, where we employed 5-fold cross-validation on the training dataset to determine the optimal hyperparameters.
The two hyperparameters considered in this study were “mtry,” representing the number of variables randomly sampled as candidates at each split, and “ntree,” representing the number of trees to grow. The default values for these parameters are mtry = 28 5 and ntree = 500 . We conducted the cross-validation over a grid of hyperparameter combinations, specifically mtry = ( 1 , 3 , 5 , 7 , 9 , 11 ) and ntree = ( 100 , 500 , 1000 ) .
Given the importance of highway types, as discussed previously in this section, each fold in the cross-validation was stratified based on highway type. Specifically, each fold contained 20 positive and 20 negative samples along the Provincial Highways, 3 positive and 3 negative samples along the City and County Highways, and 6 positive and 6 negative samples along the District and Rural Highways. When training the model, all 28 variables were considered, excluding the highway type.
To assess the performance of the classification model, we used several statistical indices: Precision, Sensitivity (Recall), Specificity, F1 score, Overall Accuracy, and Cohen’s kappa ( κ ), as shown in Equations (1)–(6). These indices provide a comprehensive evaluation of the model’s classification performance, offering unique insights into different aspects of the model’s accuracy and reliability.
Precision = T P T P + F P
Sensitivity = T P T P + F N
Specificity = T N T N + F P
F 1 score = 2 × Precision × Recall Precision + Recall
Overall Accuracy = T P + T N N
κ = P o P e 1 P e
where:
T P = True Positives ( correctly predicted rockfalls ) ; F P = False Positives ( incorrectly predicted rockfalls ) ; T N = True Negatives ( correctly predicted non - rockfalls ) ; F N = False Negatives ( incorrectly predicted non - rockfalls ) ; N = Total number of samples ; P o = Observed agreement between prediction and observation ; P e = Expected agreement by chance .
In addition, Shapley Additive Explanations (SHAP) [26] was used to interpret the predictions made by the machine learning model. SHAP provides a unified approach to explaining the outputs of machine learning models by attributing the contribution of each feature to the final prediction. Based on cooperative game theory, specifically the concept of Shapley values, SHAP ensures a fair distribution of contributions among features. By calculating the average marginal contribution of each feature across all possible feature combinations, SHAP offers consistent and locally accurate explanations. This method allows us to understand the influence of individual variables on the model’s decisions, offering insights into feature importance and interaction effects.
The application of SHAP in our study enhanced the interpretability of the machine learning model, enabling us to determine the relevance of key predictors and communicate the model’s decision-making process more transparently. This interpretative capability is crucial for ensuring the robustness and credibility of our findings, particularly in complex predictive modeling scenarios.
For the SHAP analysis, the alternative fast implementation of Random Forests, “ranger” in R, was used, applying the same hyperparameters as those determined by the slower “randomForest” package. The test dataset was selected for calculating SHAP values, while the training dataset was used as the background data.

3. Results

This section presents the results of applying the machine learning technique to predict rockfall occurrences near highways. The study dataset includes 182 rockfall events and an equal number of non-rockfall instances, totaling 364 observations. Using 28 variables, the predictive models was constructed and evaluated. The subsequent section details the performance metrics and insights derived from these models, highlighting their effectiveness in identifying and understanding the factors influencing rockfall occurrences.

3.1. Random Forest Model Performance in Rockfall Prediction

The performance of the Random Forest model, as shown in Table 3, demonstrates strong predictive capabilities across various hyperparameter settings during the 5-fold cross-validation (showing average metrics across the five folds). The results indicate consistent performance, with overall accuracy ranging from 0.7690 to 0.8069, and a Kappa statistic between 0.5379 and 0.6138, highlighting the model’s stability across different hyperparameter combinations. Sensitivity and precision were well-balanced, with sensitivity values ranging from 0.8207 to 0.8759, and precision values between 0.7473 and 0.7721, suggesting that the model effectively identifies rockfalls while maintaining high accuracy in its predictions. According to the results, the optimal hyperparameter combination was found to be mtry = 1 and ntree = 100. Using this optimal combination, a final Random Forest model was trained on the entire training dataset and subsequently tested on the test dataset.
On the test dataset, the model achieved an accuracy of 0.8514, demonstrating its strong ability to correctly classify instances in previously unseen data. The sensitivity on the test dataset was 0.8378, indicating the model’s consistent effectiveness in identifying rockfalls. Precision was also high at 0.8611, underscoring the model’s reliability in making accurate rockfall predictions. The F1 score on the test dataset was 0.8493, indicating that the model maintains a good balance between precision and recall. Additionally, the Kappa statistic on the test dataset was 0.7027, suggesting substantial agreement between the predicted and actual classifications, even after accounting for chance.
The Receiver Operating Characteristic (ROC) curve depicted in Figure 3 illustrates the predictive performance of the Random Forest model against the test dataset. This curve provides a graphical representation of the model’s diagnostic ability by plotting the True Positive Rate (sensitivity) against the False Positive Rate (1-specificity) across various threshold settings. The orange line signifies the ROC curve of the model, while the diagonal blue dashed line represents the performance of a random classifier, which has an Area Under the Curve (AUC) of 0.5. The ROC curve’s proximity to the upper left corner and the larger area under the curve indicate better model performance. In this instance, the model achieved an AUC value of 0.9317, indicating excellent discriminative ability in identifying rockfall occurrences with minimal misclassifications. Such a high AUC value suggests that the model maintains a high true positive rate while keeping the false positive rate low, thereby confirming the robustness and reliability of the Random Forest model in effectively distinguishing between the rockfall and non-rockfall classes.
After validating the machine learning model, a section of Provincial Highway 7, also known as the Northern Cross-Island Highway, which has numerous occurrences of rockfalls, was selected to create a detailed rockfall susceptibility map. A 200-m buffer was generated around the road to encompass the potential impact area. This buffer zone was then converted from a shapefile to a raster format with a 5-m resolution to ensure high spatial accuracy. Subsequently, all relevant datasets for this road section, including geographical, topographical, environmental, geological, and socioeconomic variables, were input into the model.
Using the quantile method in ArcMap, we classified the rockfall susceptibility into five distinct categories: very low, low, moderate, high, and very high. This method divides the data into equal-sized intervals, allowing for a balanced representation of susceptibility levels across the area.
Figure 4 illustrates the rockfall susceptibility of the selected section of Provincial Highway 7. The map highlights areas with varying levels of susceptibility, with black dots indicating the locations of past rockfalls. The agreement between the model’s predictions and the actual rockfall occurrences demonstrates the model’s accuracy and reliability in identifying high-risk zones.

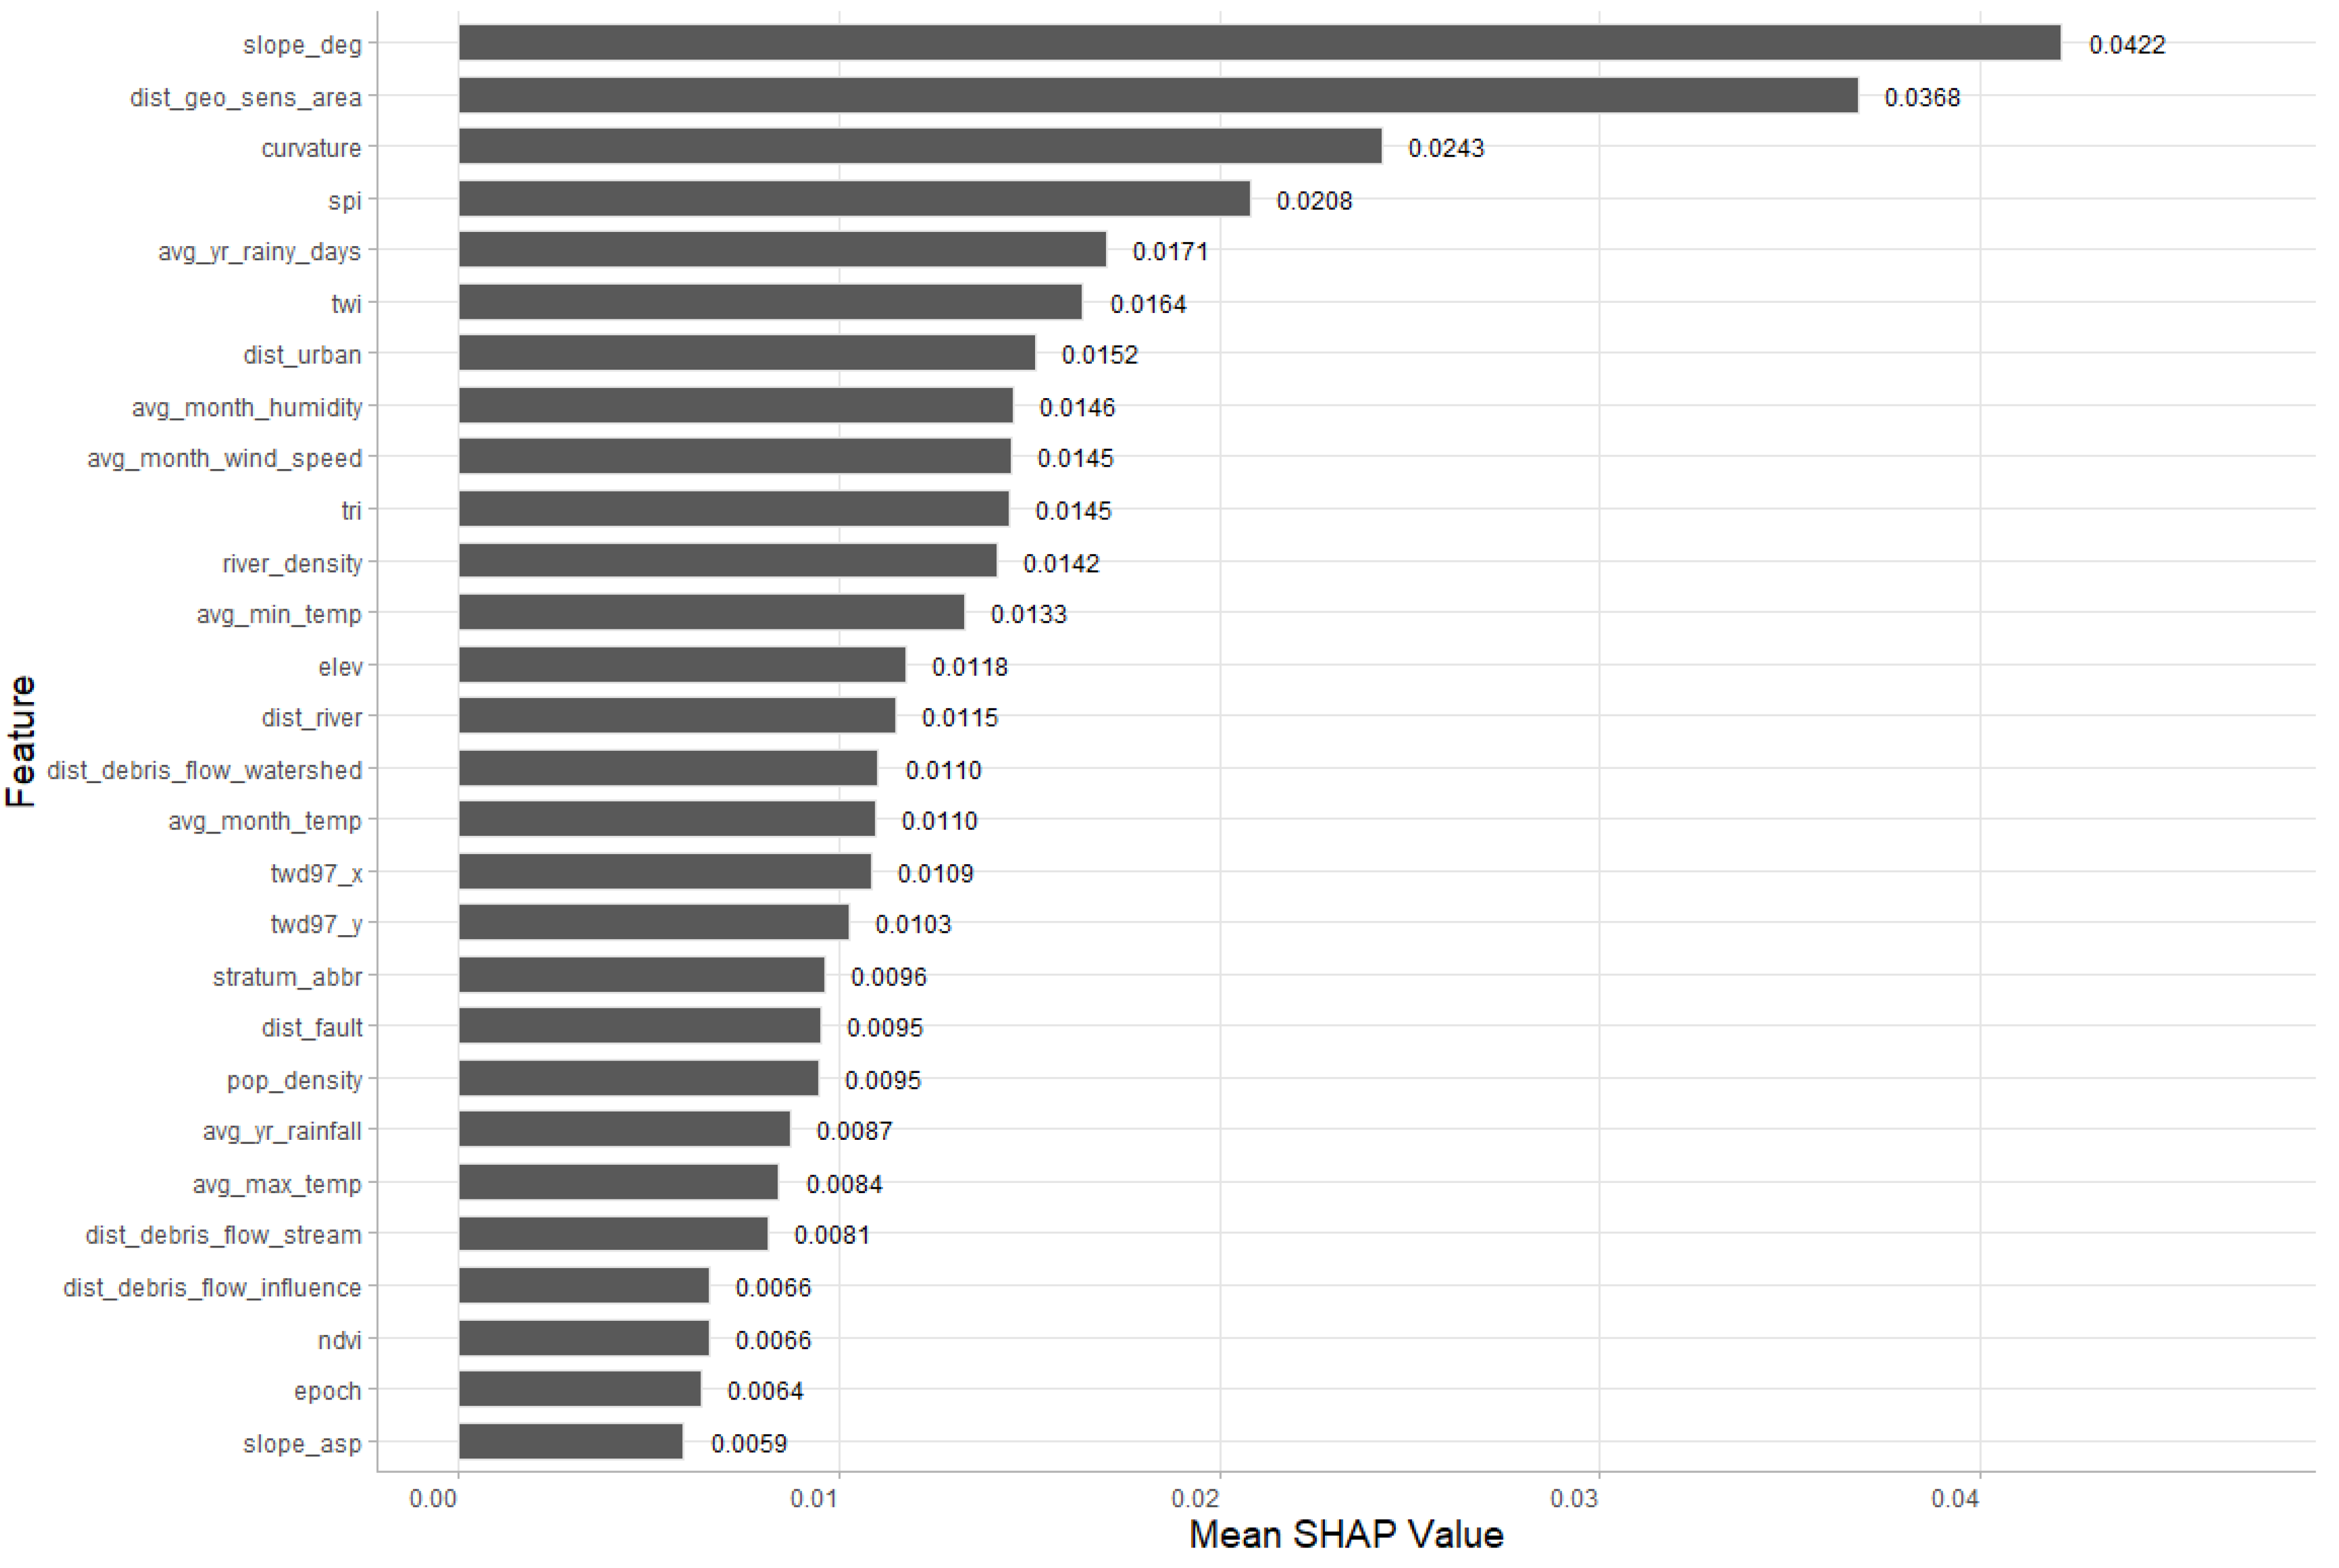
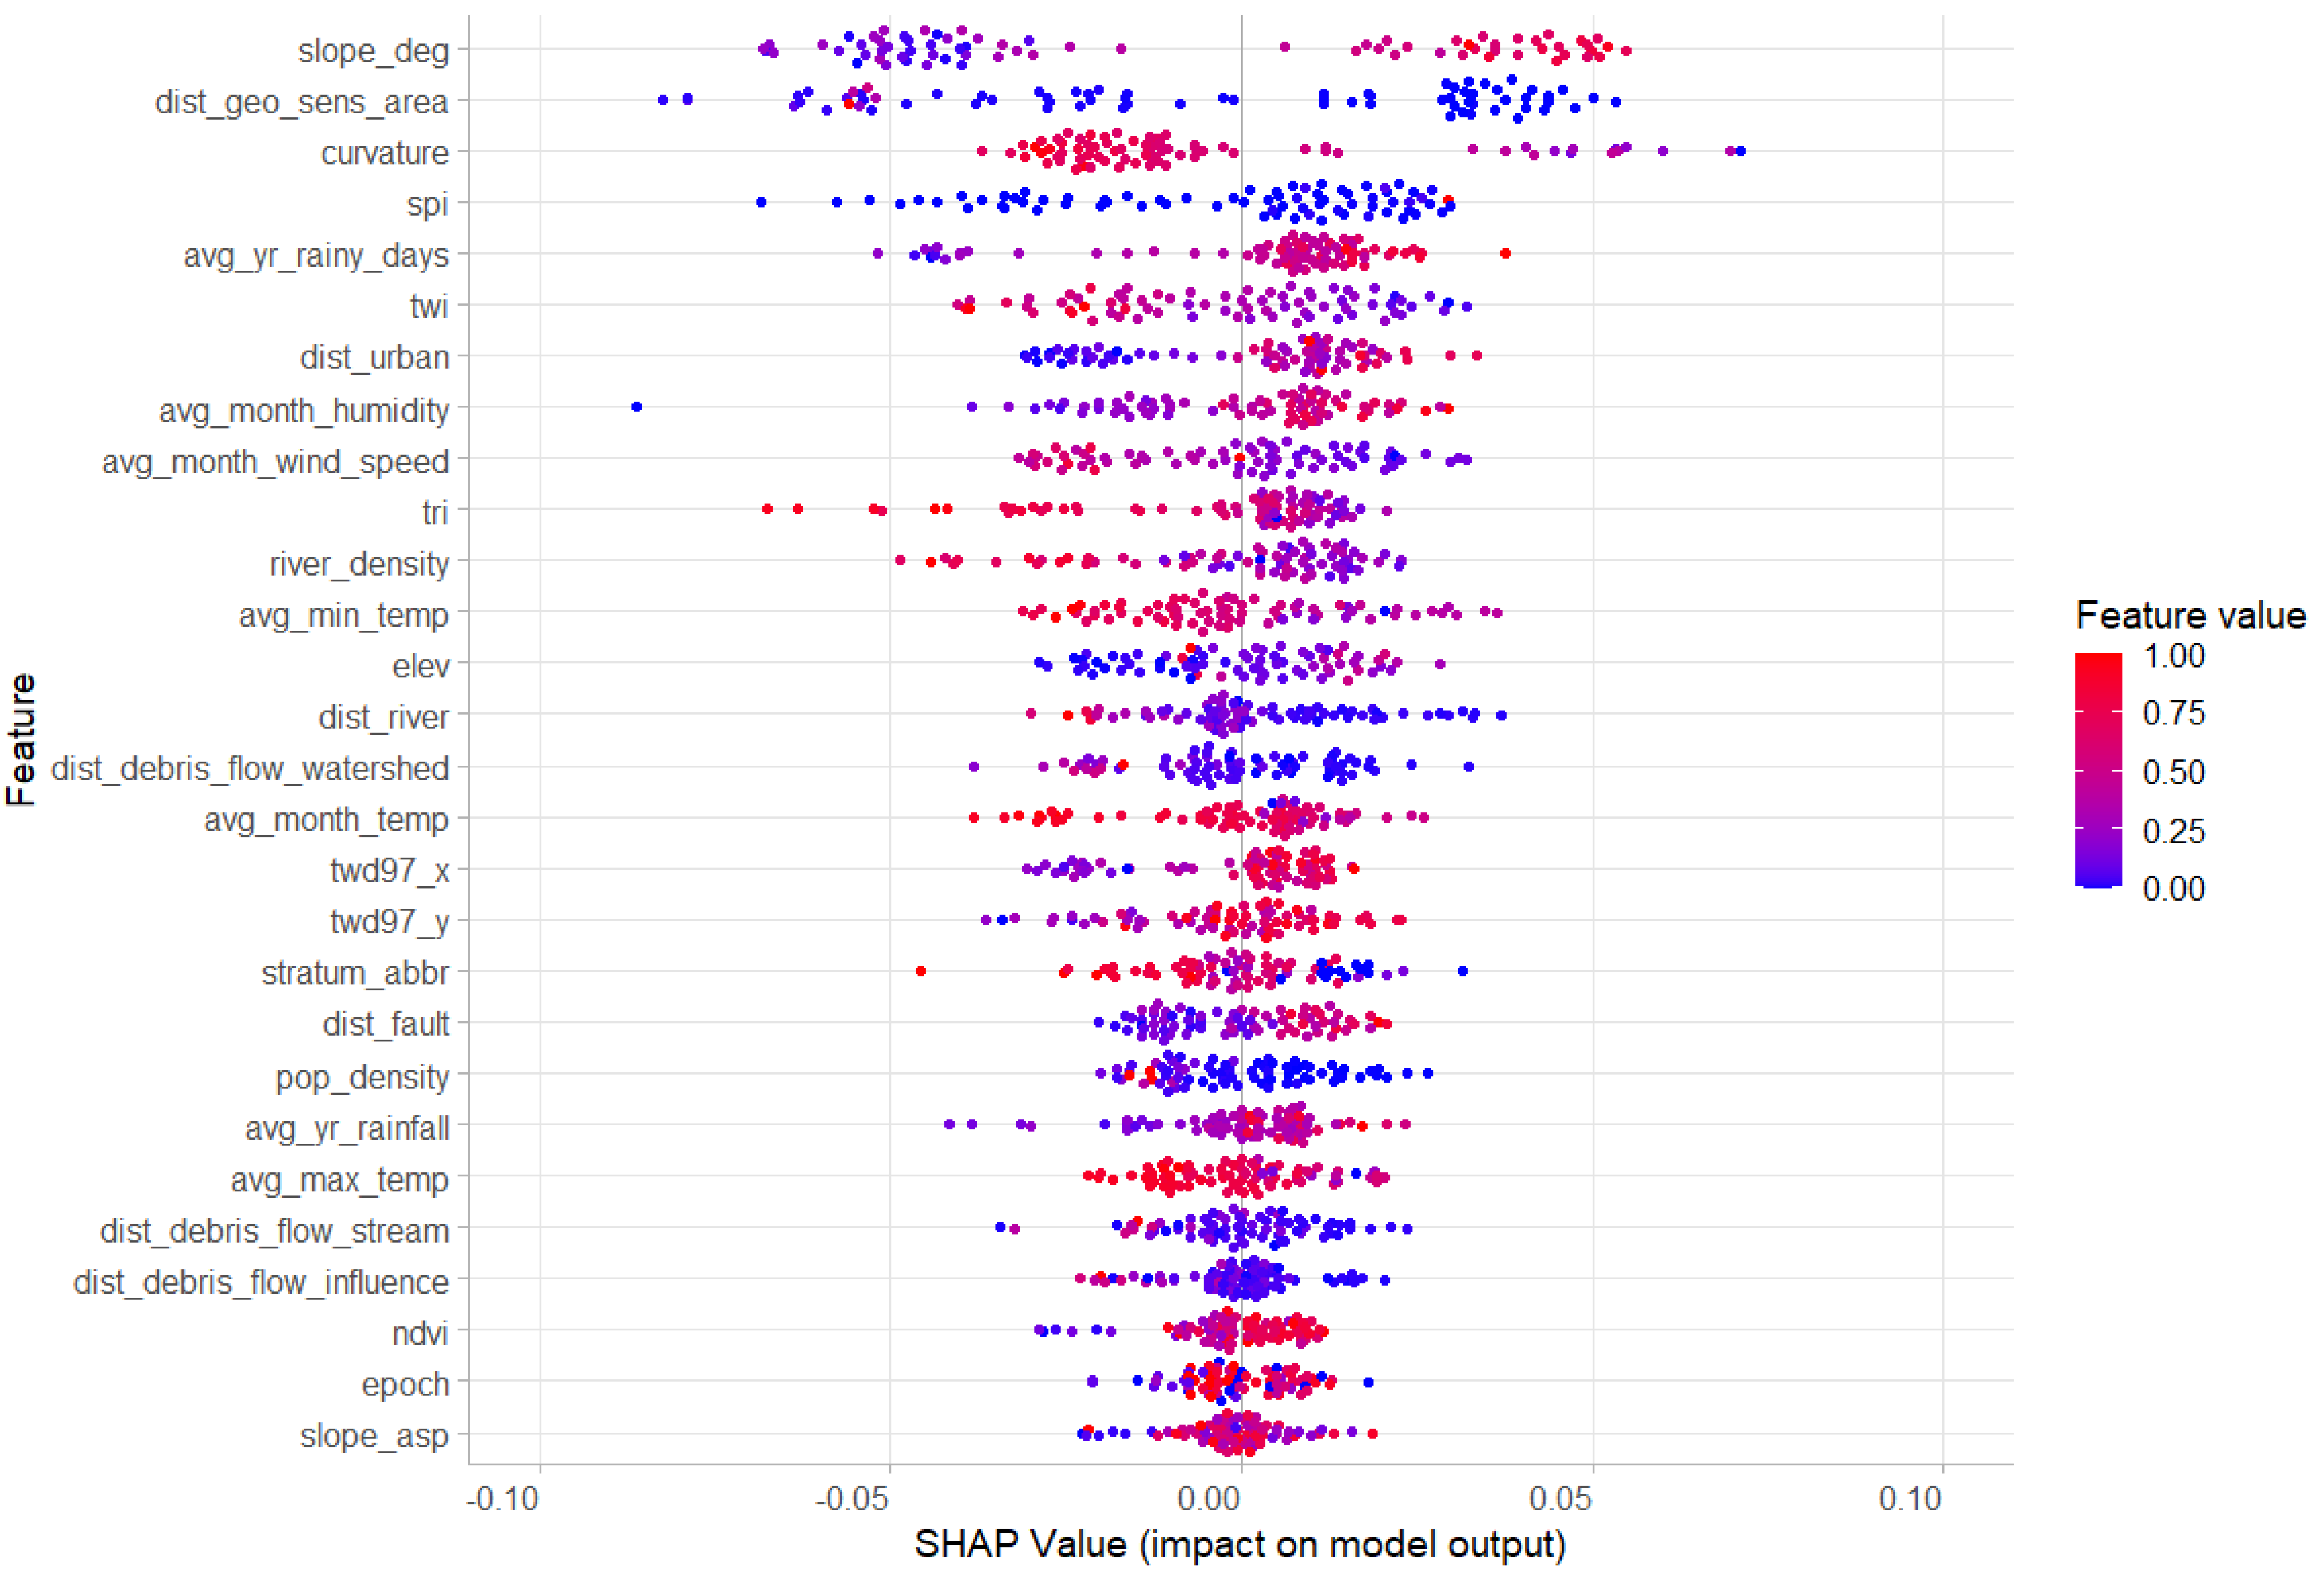
3.2. Feature Importance Visualization

Figure 5 illustrates the variable importance derived from the Random Forest model. The 28 predictors are categorized into five groups: geographical, topographical, environmental, geological, and socioeconomic variables, each labeled with different colors for clarity. The figure shows that the most influential factor is slope_deg, a topographical variable, indicating its significant impact on the model’s predictions. Following closely are dist_geo_sens_area, a geographical variable, and dist_urban, another geographical variable, highlighting the crucial role of topographical and geographical features.
Other notable variables include curvature, spi, twd97_y, twd97_x, and twi, which also fall within the geographical and topographical categories. Environmental variables are ranked next, indicating that they are of lesser importance compared to topographical and geographical variables. The socioeconomic variable pop_density and the two geological variables rank near the bottom of the figure, suggesting their relatively minor impact on rockfall occurrence predictions. Overall, this figure highlights the model’s ability to integrate a diverse range of variables across different domains, reflecting the complex interplay of geographical, topographical, environmental, geological, and socioeconomic factors in the analysis.
The mean SHAP values shown in Figure 6 represent the average impact of various features on the output of the machine learning model. The features are ranked by importance, with slope_deg and dist_geo_sens_area exhibiting the highest mean SHAP values of 0.0422 and 0.0368, respectively, signifying their significant influence on the model’s predictions. Other notable features, such as curvature, spi, avg_yr_rainy_days, and twi, also contribute meaningfully, albeit to a lesser extent. The remaining features display lower mean SHAP values, reflecting their gradually diminishing impact on the model’s predictions. This plot provides a clear hierarchy of feature importance, enhancing our understanding of which variables most strongly influence the model’s outcomes.
The comparison between the Random Forest feature importance and the SHAP values demonstrates a strong alignment in identifying key predictors. Both methods concur on the top features, with slope_deg and dist_geo_sens_area consistently ranked as the two most important variables. Additionally, the top four features in the SHAP values are among the top five features identified by the Random Forest. However, there are some minor differences; for instance, SHAP values assign greater importance to avg_yr_rainy_days compared to its ranking in the Random Forest results, whereas Random Forest ranks twd97_y and twd97_x higher than the SHAP values do. Despite these differences, both methods emphasize the critical significance of the top features, particularly those related to geographical and topographical variables. SHAP values enhance interpretability by quantifying the average contribution of each feature, complementing the Random Forest’s ranking. This similarity between the two methods supports confidence in the model’s identification of key predictors, providing a robust understanding of the features driving the model’s predictions.
The SHAP values illustrated in Figure 7 demonstrate the impact of each feature on the model’s output, providing a detailed understanding of feature importance and interaction. Each dot represents a SHAP value for a specific feature and instance. The position on the x-axis shows the feature’s impact on the model’s output, with values ranging from negative to positive. The color of the dots indicates the feature value, with red representing high values and blue representing low values.
The importance of a feature is assessed by the average magnitude of its SHAP value across all predictions, rather than simply the range of those values. The plot demonstrates that slope_deg and dist_geo_sens_area exert the most significant influence on the model’s output. The SHAP values for these features are spread across both sides of zero, indicating that they can either increase or decrease the likelihood of rockfall occurrences, depending on their specific values. For slope_deg, the red dots on the right side of the plot suggest that higher values of slope_deg are associated with an increased likelihood of rockfall occurrences. Conversely, the presence of purple and blue dots on the left side indicates that lower values of slope_deg are linked to a decreased likelihood of rockfall occurrences.
For dist_geo_sens_area, most of the dots are blue, indicating that low values of dist_geo_sens_area are prevalent on both sides of the plot. In contrast, the presence of a few red dots suggests that high values of dist_geo_sens_area are less common and generally associated with a decreased likelihood of rockfall occurrences.

4. Discussion

The integration of machine learning techniques with diverse data sources has proven to be a powerful approach in enhancing the predictive capabilities of models used for rockfall hazard analysis. This study demonstrates how leveraging internet-based data collection, combined with advanced analytical methods, can provide comprehensive insights into rockfall occurrences. By systematically collecting data over an extended period, this research offers a robust framework for understanding the multifaceted nature of rockfall hazards. The combination of diverse data types and an effective machine learning model not only improves prediction accuracy, but also contributes to a deeper understanding of the underlying factors influencing rockfall events.

4.1. The Usefulness of Internet-Based Data Collection for Rockfall Hazards

This study highlights the significant utility of using internet-based data collection to study rockfall hazards. Internet news sources can provide diverse information from various locations that might otherwise go unnoticed. By systematically collecting and automatically notifying researchers of relevant data, the study ensured a comprehensive dataset over the span of 4 years and 11 months. This approach enabled the first comprehensive rockfall hazard susceptibility analysis of Taiwan’s entire highway system, rather than focusing on specific locations or slopes. This breadth of coverage is unprecedented in the literature, providing a more holistic understanding of the risks involved.

4.2. Machine Learning Applications in Rockfall Hazard Prediction

The application of machine learning techniques, particularly the Random Forest model, has yielded insightful results in predicting rockfall occurrences near highways. A comparison of the Random Forest model’s variable importance with SHAP value analysis provided complementary perspectives on feature contributions, underscoring the critical role of various factors in predicting rockfall events.
The variable importance analysis from the Random Forest model emphasized the predominant role of topographical and geographical features in predicting rockfalls. Variables such as slope_deg and dist_geo_sens_area ranked highest on the importance list, highlighting their substantial impact on the model’s predictions. Other significant variables included dist_urban, curvature, and spi, which are also key geographical and topographical factors. In contrast, environmental factors exerted a lesser influence, while socioeconomic and geological variables had the least impact. Collectively, these findings illustrate the model’s capability to integrate a diverse array of factors—geographical, topographical, environmental, geological, and socioeconomic—into accurate predictions.

4.3. Insights from SHAP Value Analysis

The SHAP value analysis offers a more granular view of feature contributions. The SHAP summary plot revealed that topographical and geographical features such as slope_deg and dist_geo_sens_area had the highest mean SHAP values, signifying their dominant influence on the model’s predictions. This finding aligns with the Random Forest’s identification of similar key features, indicating consistent results across both methods. The visualization of SHAP values highlighted the in-depth effects of each feature, providing deeper insights into their contributions compared to the simple variable importance ranking from the Random Forest model.
Comparing the Random Forest and SHAP analyses reveals several key insights. Both methods consistently identify topographical and geographical features as highly influential. However, the SHAP analysis provides a more detailed understanding of individual feature impacts, illustrating how specific feature values affect model predictions. This granularity helps in understanding the diverse influences on the model, guiding future feature engineering and model refinement efforts. The ability to see how each feature value impacts predictions enhances their interpretability, providing actionable insights for domain experts.

4.4. Practical Implications for Model Accuracy and Reliability

These findings have practical implications for improving model accuracy and reliability. The consistent importance of geographical and topographical features suggests that incorporating more detailed spatial data could further enhance predictive performance. Additionally, the in-depth insights from the SHAP analysis can inform targeted feature engineering, focusing on the most impactful variables while considering the specific contexts in which they operate. The complementary use of Random Forest and SHAP analyses offers a robust framework for understanding and improving predictive models. By integrating diverse features from different domains, the model reflects the complex interplay of factors influencing rockfall occurrences. This comprehensive approach not only enhances model performance, but also aids in developing more effective strategies for risk management and mitigation in rockfall-prone areas.

4.5. Limitations of the Study

This study offers valuable insights into rockfall hazard modeling and prediction across Taiwan, representing the first attempt at such an analysis on an island-wide basis. However, several limitations should be acknowledged and addressed, as outlined below.

4.5.1. Bias in Data Collection via Google Alerts

Rockfall incidents often go unnoticed, and do not always make national news. Even diligent efforts to collect information on rockfalls can easily miss incidents reported only in local news. However, Google Alerts can scan a vast array of news sources and provide instant notifications, significantly enhancing the breadth and depth of rockfall incident data collection beyond what is possible for an individual. Despite these advantages, we acknowledge potential omissions and biases that may arise from relying solely on Google Alerts for data collection. Google Alerts may not capture all relevant rockfall incidents, leading to incomplete or biased datasets, which can affect the generalizability and accuracy of the model predictions.

4.5.2. Omission of Severity of Rockfalls

Another limitation of the current study is that it classifies data solely as rockfall or non-rockfall points, without considering the severity and impact of the rockfalls. This limitation arises from the nature of the news reports used, which are often written by general reporters or based on witness accounts rather than experts in rockfall analysis. Consequently, these reports typically lack detailed information on the severity or magnitude of the rockfalls, and there is currently no reliable method to infer this information accurately from the news. Therefore, we chose not to perform this level of analysis to avoid drawing misleading conclusions.

4.5.3. Effects of Seasonal Vegetation and Precipitation Patterns

This study dedicated nearly five years to collecting rockfall incidents in Taiwan. Despite this extensive period, the dataset comprises only 182 incidents, which is insufficient for conducting a detailed seasonal analysis of rockfalls and assessing the influence of vegetation changes and rainfall patterns. A more comprehensive temporal analysis of rockfall distribution may become feasible with the collection of additional incidents over a longer period.

4.5.4. Effect of Climate Change on Model Prediction

Finally, this study does not account for the long-term effects of climate change on rockfall hazards, primarily due to the limited duration of data collection. Climate change can alter precipitation patterns, vegetation cover, and other environmental factors that influence rockfalls. Although this study analyzes many of these factors to demonstrate their roles in a data-driven rockfall susceptibility model, it does not incorporate climate change projections. Future models should include these projections to better predict and mitigate rockfall risks.

5. Conclusions

This study successfully applied machine learning techniques, particularly the Random Forest model, to predict rockfall occurrences near highways. The analysis used a comprehensive dataset comprising 182 rockfall events from April 2019 to February 2024 (4 years and 11 months), and an equal number of non-rockfall instances, incorporating 28 distinct variables. The performance metrics of the Random Forest model demonstrated robust predictive capabilities, with high accuracy, precision, recall, and F1 scores, alongside a substantial Kappa statistic and an impressive AUC value of 0.9317. These results affirm the model’s reliability and effectiveness in classifying rockfall occurrences.
The comparison between the Random Forest model’s variable importance and the SHAP value analysis provided valuable insights into the contributions of various features. Both methods consistently identified slope_deg and dist_geo_sens_area as highly influential in predicting rockfall events.
This study also highlights the use of internet news-based data collection and analysis. Internet news not only helps collect information from various sources that might otherwise go unnoticed, but also systematically gathers this information and automatically notifies researchers. Our sustained work over 4 years and 11 months has proven the efficacy of this process. Consequently, this has resulted in the first rockfall hazard susceptibility analysis of Taiwan’s entire highway system, rather than just specific roads or sections, a comprehensive scope that is unprecedented in the literature.
Overall, the findings underscore the critical importance of incorporating detailed spatial data and leveraging advanced machine learning techniques to enhance predictive accuracy. The complementary use of Random Forest and SHAP analyses provides a robust framework for understanding and improving predictive models, ultimately contributing to safer and more reliable road infrastructure management in rockfall-prone regions. Future research should focus on integrating additional detailed spatial and environmental data to further enhance the predictive capabilities and practical applications of these models. Moreover, efforts should be made to address the biases in data collection and the limitations of severity assessment by exploring alternative data sources or developing new methods to quantify the impact of rockfalls more accurately. Extending the duration of data collection will allow for a more comprehensive temporal analysis, facilitating the examination of seasonal patterns and the long-term effects of climate change. By incorporating climate change projections and increasing the dataset’s size and scope, future models can provide more in-depth and reliable predictions, thereby improving rockfall risk management strategies.

Author Contributions

Conceptualization, W.C.; Data curation, Y.-J.J., C.-S.H., M.-H.K. and W.C.; Formal analysis, K.A.N. and W.C.; Funding acquisition, W.C.; Investigation, K.A.N., Y.-J.J., C.-S.H., M.-H.K. and W.C.; Methodology, K.A.N. and W.C.; Project administration, W.C.; Resources, W.C.; Software, K.A.N.; Supervision, W.C.; Validation, K.A.N.; Visualization, K.A.N.; Writing—original draft, K.A.N. and W.C.; Writing—review and editing, Y.-J.J., C.-S.H., M.-H.K. and W.C. All authors have read and agreed to the published version of the manuscript.

Funding

This study was partially funded by the National Science and Technology Council (Taiwan) Research Projects under Grant Numbers NSTC 112-2121-M-027-001 and NSTC 113-2121-M-008-004.

Data Availability Statement

The data used in this study are not publicly available due to restrictions imposed by the data owner or source. Therefore, the data cannot be disseminated or shared as part of this publication. Interested researchers can request access to the data directly from the data owner or source, subject to their terms and conditions. The authors confirm that they do not have the right to distribute the data used in this study.

Acknowledgments

We would like to thank Hao-Jun Sun for his assistance in geolocating some of the rockfall sites for this study. During the preparation of this work, the author used ChatGPT to improve readability and language. After using this tool/service, the author reviewed and edited the content as needed and takes full responsibility for the content of the publication.

Conflicts of Interest

The authors declare no conflicts of interest.

References

  1. Varnes, D.J. Slope movement types and processes. Spec. Rep. 1978, 176, 11–33. [Google Scholar]
  2. Li, Z.H.; Huang, H.W.; Xue, Y.D.; Yin, J. Risk assessment of rockfall hazards on highways. Georisk 2009, 3, 147–154. [Google Scholar]
  3. Guzzetti, F.; Reichenbach, P.; Ghigi, S. Rockfall hazard and risk assessment along a transportation corridor in the Nera Valley, Central Italy. Environ. Manag. 2004, 34, 191–208. [Google Scholar]
  4. Michoud, C.; Derron, M.-H.; Horton, P.; Jaboyedoff, M.; Baillifard, F.-J.; Loye, A.; Nicolet, P.; Pedrazzini, A.; Queyrel, A. Rockfall hazard and risk assessments along roads at a regional scale: Example in Swiss Alps. Nat. Hazards Earth Syst. Sci. 2012, 12, 615–629. [Google Scholar]
  5. Singh, P.K.; Kainthola, A.; Panthee, S.; Singh, T.N. Rockfall analysis along transportation corridors in high hill slopes. Environ. Earth Sci. 2016, 75, 1–11. [Google Scholar]
  6. Cignetti, M.; Godone, D.; Bertolo, D.; Paganone, M.; Thuegaz, P.; Giordan, D. Rockfall susceptibility along the regional road network of Aosta Valley Region (northwestern Italy). J. Maps 2021, 17, 54–64. [Google Scholar]
  7. Shirzadi, A.; Chapi, K.; Shahabi, H.; Solaimani, K.; Kavian, A.; Ahmad, B.B. Rock fall susceptibility assessment along a mountainous road: An evaluation of bivariate statistic, analytical hierarchy process and frequency ratio. Environ. Earth Sci. 2017, 76, 1–17. [Google Scholar]
  8. Nanehkaran, Y.A.; Zhu, L.; Chen, J.; Azarafza, M.; Mao, Y. Application of artificial neural networks and geographic information system to provide hazard susceptibility maps for rockfall failures. Environ. Earth Sci. 2022, 81, 475. [Google Scholar]
  9. Wen, H.; Hu, J.; Zhang, J.; Xiang, X.; Liao, M. Rockfall susceptibility mapping using XGBoost model by hybrid optimized factor screening and hyperparameter. Geocarto Int. 2022, 37, 16872–16899. [Google Scholar]
  10. Kulsoom, I.; Hua, W.; Hussain, S.; Chen, Q.; Khan, G.; Shihao, D. SBAS-InSAR based validated landslide susceptibility mapping along the Karakoram Highway: A case study of Gilgit-Baltistan, Pakistan. Sci. Rep. 2023, 13, 3344. [Google Scholar]
  11. Dilley, M. Natural Disaster Hotspots: A Global Risk Analysis; World Bank Publications: Washington, DC, USA, 2005. [Google Scholar]
  12. Su, Y.-F.; Wu, C.-H.; Lee, T.-F. Public health emergency response in Taiwan. Health Secur. 2017, 15, 137–143. [Google Scholar] [PubMed]
  13. Tso, Y.-E.; McEntire, D.A. Emergency management in Taiwan: Learning from past and current experiences. In Comparative Emergency Management: Understanding Disaster Policies, Organizations, and Initiatives from around the World; Federal Emergency Management Agency: Emmitsburg, MD, USA, 2011. [Google Scholar]
  14. Executive Yuan. Overview of National Conditions: Land Transport. 2024. Available online: https://www.ey.gov.tw/state/A44E5E33CDA7E738/738c0735-9a67-4bb8-a7da-5a9b0e956461 (accessed on 26 June 2024).
  15. Nguyen, K.A.; Chen, W. DEM-and GIS-based analysis of soil erosion depth using machine learning. ISPRS Int. J. -Geo-Inf. 2021, 10, 452. [Google Scholar]
  16. Tsai, F.; Lai, J.-S.; Nguyen, K.A.; Chen, W. Determining cover management factor with remote sensing and spatial analysis for improving long-term soil loss estimation in watersheds. ISPRS Int. J. Geo-Inf. 2021, 10, 19. [Google Scholar] [CrossRef]
  17. Nguyen, K.A.; Seeboonruang, U.; Chen, W. Projected Climate Change Effects on Global Vegetation Growth: A Machine Learning Approach. Environments 2023, 10, 204. [Google Scholar] [CrossRef]
  18. Li, X.; Gong, P.; Zhou, Y.; Wang, J.; Bai, Y.; Chen, B.; Hu, T.; Xiao, Y.; Xu, B.; Yang, J.; et al. Mapping global urban boundaries from the global artificial impervious area (GAIA) data. Environ. Res. Lett. 2020, 15, 094044. [Google Scholar]
  19. Breiman, L. Random forests. Mach. Learn. 2001, 45, 5–32. [Google Scholar]
  20. Šegina, E.; Jemec Auflič, M.; Mikoš, M.; Bezak, N. A preliminary investigation of the small rockfall triggering conditions along a road network in Slovenia. Landslides 2024, 1–13. [Google Scholar] [CrossRef]
  21. Usta, Z.; Akıncı, H.; Akın, A.T. Comparison of tree-based ensemble learning algorithms for landslide susceptibility mapping in Murgul (Artvin), Turkey. Earth Sci. Inform. 2024, 17, 1459–1481. [Google Scholar]
  22. Qi, L.; Zhou, Y.; Van Oost, K.; Ma, J.; van Wesemael, B.; Shi, P. High-resolution soil erosion mapping in croplands via Sentinel-2 bare soil imaging and a two-step classification approach. Geoderma 2024, 446, 116905. [Google Scholar]
  23. Jevšenak, J.; Klisz, M.; Mašek, J.; Čada, V.; Janda, P.; Svoboda, M.; Vostarek, O.; Treml, V.; van der Maaten, E.; Popa, A.; et al. Incorporating high-resolution climate, remote sensing and topographic data to map annual forest growth in central and eastern Europe. Sci. Total Environ. 2024, 913, 169692. [Google Scholar]
  24. Sharma, R.; Levi, M.R.; Ricker, M.C.; Thompson, A.; King, E.G.; Robertson, K. Scaling of soil organic carbon in space and time in the Southern Coastal Plain, USA. Sci. Total Environ. 2024, 933, 173060. [Google Scholar] [PubMed]
  25. Singha, C.; Swain, K.C.; Pradhan, B.; Rusia, D.K.; Moghimi, A.; Ranjgar, B. Mapping groundwater potential zone in the Subarnarekha basin, India, using a novel hybrid multi-criteria approach in Google Earth Engine. Heliyon 2024, 10, 1–25. [Google Scholar]
  26. Lundberg, S.M.; Lee, S.I. A unified approach to interpreting model predictions. Adv. Neural Inf. Process. Syst. 2017, 30, 1–10. [Google Scholar]
Figure 1. The highway system in Taiwan, highlighting the locations of rockfall and non-rockfall events.
Futureinternet 16 00299 g001
Figure 2. Predictive variables used for rockfall analysis: (a) elevation, (b) slope angle in degrees, (c) NDVI, (d) river system, (e) urban areas, (f) fault lines, (g) geologically sensitive areas, (h) potential debris flow areas, (i) average yearly rainfall, (j) average monthly temperature, (k) average monthly wind speed, (l) average monthly humidity, (m) average number of rainy days, (n) strata, (o) epoch, (p) population density.
Futureinternet 16 00299 g002aFutureinternet 16 00299 g002b
Figure 3. The ROC curve of the Random Forest model, highlighting the AUC value of 0.9317, which indicates excellent model performance.
Futureinternet 16 00299 g003
Figure 4. Rockfall susceptibility map of a section of Provincial Highway 7, showing the classification into five susceptibility levels. Black dots indicate the locations of past rockfalls.
Futureinternet 16 00299 g004
Figure 5. Variable importance derived from the Random Forest model, highlighting the significant predictors across geographical, topographical, environmental, geological, and socioeconomic categories.
Futureinternet 16 00299 g005
Figure 6. Mean SHAP values indicating the average impact of each feature on model predictions. Features are ranked by importance, with slope_deg and dist_geo_sens_area showing the highest impact.
Futureinternet 16 00299 g006
Figure 7. SHAP values illustrating the impact of each feature on the model’s output. Red dots represent high feature values, while blue dots represent low feature values.
Futureinternet 16 00299 g007
Table 1. Summary of rockfall incidents on different types of highways in Taiwan.
Highway TypeNum.Total Length (km)Num. of RockfallRockfall Roads% Rockfall RoadsRockfall/km
National Expressway101061.8000.0%0.0000
Provincial Highway975323.21262424.7%0.0237
City/County Highway1583684.119138.2%0.0052
District/Rural Highway225011362.737160.7%0.0033
Exclusive Highway35407.8000.0%0.0000
Table 2. Independent variables for analyzing rockfall occurrences.
No.VariableDescription
Geographical Variables
1twd97_yThe northing coordinate in the TWD97 coordinate system (also known as the 1997 Taiwan Datum), which is used for mapping and surveying in Taiwan.
2twd97_xThe easting coordinate in the TWD97 coordinate system.
3dist_riverDistance to the nearest river (meters).
4dist_faultDistance to the nearest fault line (meters).
5dist_urbanDistance to the urban boundary (meters).
6dist_geo_sens_areaDistance to the geologically sensitive area boundary (meters).
7dist_debris_flow_streamDistance to the potential debris flow stream (meters).
8dist_debris_flow_watershedDistance to the potential debris flow stream watershed boundary (meters).
9dist_debris_flow_influenceDistance to the potential debris flow stream influence area boundary (meters).
Topographical Variables
10elevElevation from 20 m resolution DEM (meters).
11slope_degSlope measured in degrees.
12slope_aspSlope aspect.
13curvatureSlope curvature.
14twiTopographic Wetness Index.
15spiStream Power Index.
16triTerrain Ruggedness Index.
17river_densityRiver density (km/km2).
Environmental Variables
18avg_yr_rainfallAverage yearly rainfall from 2020 to 2023 (mm/year).
19avg_yr_rainy_daysAverage number of rainy days per year from 2020 to 2023 (days).
20avg_month_tempAverage monthly temperature from 2020 to 2023 (℃).
21avg_min_tempAverage minimum temperature per year from 2020 to 2023 (℃).
22avg_max_tempAverage maximum temperature per year from 2020 to 2023 (℃).
23avg_month_wind_speedAverage monthly wind speed from 2020 to 2023 (m/s).
24avg_month_humidityAverage monthly humidity from 2020 to 2023 (%).
25ndviNormalized Difference Vegetation Index (NDVI).
Geological Variables
26epochGeological time period.
27stratum_abbrStratum abbreviation.
Socioeconomic Variables
28pop_densityPopulation density (persons/ha).
Table 3. Performance metrics from 5-fold cross-validation and test dataset.
5-Fold Cross-Validation
mtryntreeAccuracyKappaSensitivitySpecificityPrecisionF1
111000.80690.61380.87590.73790.77210.8170
215000.78970.57930.85520.72410.75920.8008
3110000.80000.60000.86900.73100.76540.8108
431000.79310.58620.85520.73100.76690.8041
535000.78620.57240.82760.74480.76880.7929
6310000.77930.55860.82760.73100.75890.7879
751000.78620.57240.83450.73790.76420.7946
855000.78280.56550.83450.73100.76230.7924
9510000.78620.57240.82760.74480.76880.7928
1071000.78970.57930.84140.73790.76580.7998
1175000.78280.56550.82760.73790.76700.7914
12710000.77930.55860.83450.72410.75680.7904
1391000.78620.57240.84140.73100.76030.7967
1495000.77930.55860.82070.73790.76200.7865
15910000.79310.58620.84830.73790.77020.8040
16111000.76900.53790.82760.71030.74730.7808
17115000.79310.58620.84830.73790.76790.8035
181110000.77930.55860.84140.71720.75290.7914
Test Dataset
AccuracyKappaSensitivitySpecificityPrecisionF1
0.85140.70270.83780.86490.86110.8493
Disclaimer/Publisher’s Note: The statements, opinions and data contained in all publications are solely those of the individual author(s) and contributor(s) and not of MDPI and/or the editor(s). MDPI and/or the editor(s) disclaim responsibility for any injury to people or property resulting from any ideas, methods, instructions or products referred to in the content.

