Article

Advanced Trajectory Analysis of NASA’s Juno Mission Using Unsupervised Machine Learning: Insights into Jupiter’s Orbital Dynamics

1
Intelligent Systems Department, Faculty of Artificial Intelligence, Al-Balqa Applied University, Al-Salt 19117, Jordan
2
Department of Computer Information Systems, Prince Abdullah Bin Ghazi Faculty of Information and Communication Technology, Al-Balqa Applied University, Al-Salt 19117, Jordan
3
Department of Information Technology Systems and Networks, Faculty of Informatics, University of Debrecen, 4032 Debrecen, Hungary
*
Author to whom correspondence should be addressed.
Future Internet 2025, 17(3), 125; https://doi.org/10.3390/fi17030125
Submission received: 23 January 2025 / Revised: 3 March 2025 / Accepted: 4 March 2025 / Published: 11 March 2025
(This article belongs to the Special Issue AI and Security in 5G Cooperative Cognitive Radio Networks)

Abstract

:
NASA’s Juno mission, involving a pioneering spacecraft the size of a basketball court, has been instrumental in observing Jupiter’s atmosphere and surface from orbit since it reached the intended orbit. Over its first decade of operation, Juno has provided unprecedented insights into the solar system’s origins through advanced remote sensing and technological innovations. This study focuses on change detection in terms of Juno’s trajectory, leveraging cutting-edge data computing techniques to analyze its orbital dynamics. Utilizing 3D position and velocity time series data from NASA, spanning 11 years and 5 months (August 2011 to January 2023), with 5.5 million samples at 1 min accuracy, we examine the spacecraft’s trajectory modifications. The instantaneous average acceleration, jerk, and snap are computed as approximations of the first, second, and third derivatives of velocity, respectively. The Hilbert transform is employed to visualize the spectral properties of Juno’s non-stationary 3D movement, enabling the detection of extreme events caused by varying forces. Two unsupervised machine learning algorithms, DBSCAN and OPTICS, are applied to cluster the sampling events in two 3D state spaces: (velocity, acceleration, jerk) and (acceleration, jerk, snap). Our results demonstrate that the OPTICS algorithm outperformed DBSCAN in terms of the outlier detection accuracy across all three operational phases (OP1, OP2, and OP3), achieving accuracies of 99.3%, 99.1%, and 98.9%, respectively. In contrast, DBSCAN yielded accuracies of 98.8%, 98.2%, and 97.4%. These findings highlight OPTICS as a more effective method for identifying outliers in elliptical orbit data, albeit with higher computational resource requirements and longer processing times. This study underscores the significance of advanced machine learning techniques in enhancing our understanding of complex orbital dynamics and their implications for planetary exploration.

1. Introduction

In recent years, space research efforts have shifted toward distant celestial bodies, with a projected focus on far-reaching planets. Achieving the goals of these missions, which require significant energy, has led to the development of high-efficiency propulsion systems such as electric propulsion and solar sails [1]. A trajectory, defined as the movement of a quantity, behavior, or other recurring measures of interest over time, is a key concept when analyzing longitudinal data [2]. Launched on 5 August 2011, NASA’s Juno spacecraft is the first mission to explore beneath Jupiter’s thick clouds, offering insights into the gas giant and the origins of the solar system. Now in its extended mission phase, Juno continues its pioneering research. This study investigates the trajectory characteristics of Juno during the initial phase of its mission, employing Hamiltonian mechanics to define the momentum and position concurrently. This research aims to develop a strategy for assessing Juno’s trajectory and identifying related changes, contributing to a deeper understanding of spacecraft dynamics in deep-space exploration.
Identifying causal effects is challenging, but analysis of temporal and spatial data trends allows for predictions and deep analysis, enhancing comprehension of trajectories.
Analyzing precise trajectories and detecting changes within them is crucial to understanding object dynamics and the relationships between phenomena. Trajectory analysis provides timely and contextual information that is often unattainable through other means. Remote sensing data have become a key component of change detection due to its high temporal frequency, digital processing capabilities, comprehensive perspective, and enhanced spatial and multidimensional resolution.
Human-controlled trajectory modification was considered an extreme event of the time series. The Hilbert transform of the amplitudes of the higher order derivatives of the position vector in the reference system connected to the solar system was used. There were analyzed derivatives up to order four of the position vector: velocity, acceleration, jerk, and snap. It was proved that information in the higher-order derivatives serves to identify extreme events. The novel aspect of our contribution is that it is incorporated into the supplied learning model, allowing it to be adapted to a non-stationary challenge. Also, during the experimental assessment, many sorts of conceptions of data streams with various attributes were considered.
The next parts of this article are structured as follows. Related work is given in Section 2 of this research, Section 3 presents the problem statement, while Section 4 provides the details of the data source and pre-processing. Section 5 describes the geometry of the Juno trajectory. Section 6 represents the methodology, results analysis and discussion, Section 7 contains the conclusions, while Section 8 includes the limitations and future work.

2. Related Work

The primary objectives of change detection in remote sensing include identifying the spatial locations and types of changes, quantifying those changes, and evaluating the accuracy of the results. Previous studies in Space Scientific Reviews provide detailed insights into the equipment and mission plans for Jupiter’s scientific exploration [3]. Juno’s status reports, covering phases such as the preliminary design [4,5], launch year [6], early cruise [7], Earth flyby [8], and the period leading up to Jupiter’s arrival [9], offer a comprehensive overview of the mission’s progress. These publications collectively enhance our understanding of Juno’s trajectory and its scientific contributions. Simply stated, these computer simulations provide quick insights that enhance space exploration efficiency. In addition, they help supply more information. The one-minute accuracy-based periodic sampled position and velocity data downloaded from the Juno project of the National Aeronautics and Space Administration (NASA) were found to be 3D non-linear and non-stationary signals. We searched for the answer to identify the time moments of the trajectory modification based on these specific time series. Because of the non-stationarity property of the data, classical statistical methods are less usable to evaluate particular events. Trajectory analysis is one of the most important aspects of successful activities on space missions.
Traditionally, trajectory analysis has relied heavily upon first-order derivatives of parameters such as velocity and acceleration. Nevertheless, a number of recent contributions suggest that second- or higher-order derivatives can investigate different dynamic properties of systems more deeply. As an example, in 2019, Demyanov and his team focused on using second-order derivatives of GPS carrier phase data to find small disturbances in the ionosphere. They realized that by looking at these derivatives, they could more easily identify tiny changes in how signals travel [10].
In the analysis of spacecraft trajectories, the use of higher-order derivatives can be especially beneficial. Juuso and Lahdelma (2023) [11] suggested a method using real-order derivatives and generalized norms for feature extraction and signal processing. The authors stressed that the use of higher-order derivatives has the ability to identify complex features in dynamic signals, thus enhancing the accuracy of condition monitoring and fault detection of mechanical systems.
Recent years have seen developments in spacecraft trajectory analysis bring about new methods for enhancing mission design and operations. One such development involves the use of diffusion models to create ballistic spacecraft trajectories. Presser et al. (2024) [12] employed a new generative model that utilizes score-based diffusion models to create Earth-to-Mars transfers. Their method showed that it was possible for such models to learn and reproduce the inherent dynamics of interplanetary trajectories, making it an excellent mission design tool for the future.
Traditional trajectory analysis techniques tend to prioritize the analysis of first-order derivatives like velocity and acceleration. In the current research, the usefulness of the inclusion of higher-order derivatives to describe the finer dynamics of spacecraft movement was also discussed. For instance, Yu et al. (2024) [13] established a solution with the inclusion of the perturbative effect of the J2 (the second zonal harmonic coefficient in the expansion of the Earth’s gravitational potential) by employing perturbative techniques to obtain solutions that include the intricate effect of the complex gravitational forces to improve the fidelity of the trajectory predictions. Through the use of compositional diffusion modeling, Briden et al. [14] presented an improved approach for generating spacecraft trajectories in their research from 2025. Within a few-shot learning framework, the authors were able to efficiently adapt to new restrictions and out-of-distribution data by using diffusion models to express solutions as probability density functions. Presser et al. (2024) [12] established the groundwork upon which this study expands, and 6-degree-of-freedom powered descent trajectory-generating challenges confirmed their methods.
Based on these advances, this work analyzes higher-order derivatives of position vectors to identify substantial trajectory alterations in spacecraft missions. This study tries to find severe trajectory changes by applying the Hilbert transform to amplitude differences in the velocity, acceleration, jerk, and snap. Spacecraft dynamics are better understood using this approach, which advances deep-space navigation and exploration.

3. Problem Statement

Space missions, particularly to distant objects in space, need efficient propulsion systems to cut down on energy consumption and path planning. A path, as the movement of an object over a given period, is essential when analyzing spacecraft mechanics and efficiency during a mission. NASA’s Juno space probe, launched into space in 2011 with the directive of researching Jupiter, provides the framework for evaluating paths in terms of mathematical analysis methods such as Hamiltonian mechanics. Evaluation of precise orbits and detection of alterations are crucial to examining the orbits of spacecraft and mission planning performance. Traditional statistical analysis in view of highly complex and dynamic trajectory data from Juno’s flight is at a disadvantage when identifying meaningful alterations in orbits. The primary hurdle lies in creating a robust framework for analysis that is strong enough to consistently monitor and comprehend such orbit modifications under the transient environment of space.
This paper attempts to address the problem of identifying significant trajectory changes in Juno’s mission from higher-order derivatives of its position vector. By applying the Hilbert transform to the amplitude fluctuations of the velocity, acceleration, jerk, and snap, this study is trying to identify extreme events (EEs) of trajectory changes. Furthermore, the integration of these findings into a learning model facilitates adaptation to non-stationary challenges, thus enhancing our forecasting and comprehension of trajectory modifications in space flights. The new technique described here also improves our understanding of spacecraft dynamics and the overall research on deep-space exploration and navigation.

4. Data Source and Pre-Processing

The Juno spacecraft’s 53-day orbit around Jupiter allows it to directly sample Jupiter’s equatorial ionosphere [3]. An auxiliary information system’s data are its most essential component. The position and velocity are examples of supplementary data, as are the target body size, shape, and orientation, records of monitoring plans, spacecraft and sensor instructions, and notes explaining how things performed. Coordinate and time systems serve as good examples of reference systems. During pre-flight, flight operations, and post-flight long-term data analysis, archives that facilitate easy and rapid access to data and other components of the information system are essential [15].
The American space research community strongly advocated the construction of improved information systems and their accompanying standards in 1982, to make fast access to and use of stored scientific data less of a pipe dream and more of an expectation [16]. The report recommends establishing standards and protocols for gathering and utilizing ancillary/engineering data to properly comprehend measurements from scientific instruments and cross-reference the results across different instruments and missions. This suggestion spawned the “SPICE” auxiliary information system at NASA. The SPICE implementation attempts to meet the previously described specified criteria. Kernels are a common name for the core SPICE datasets. Using SPICE kernels, space scientists and engineers may quickly and accurately access and utilize information about a spacecraft’s location, orientation, and other auxiliary data [15]. The “SPICE” observation geometry information system is available to NASA flight projects and NASA-sponsored researchers through NASA’s Navigation and Ancillary Information Facility (NAIF). This system is intended to support scientists in planning and analyzing scientific observations conducted by space-based instruments on robotic planetary missions. Additionally, engineering duties connected to these missions are supported by SPICE via its usage in this capacity. Although planetary exploration was the primary emphasis when SPICE was first developed, it has now expanded to include applications in heliophysics and Earth science. There are no restrictions on who may use the SPICE system, as long as they adhere to the rules and guidelines outlined on SPICE’s Support and Rules webpages. In addition, it is open to the general public, but only with little assistance from the NAIF. The first step in the SPICE implementation process is the generation of auxiliary data. An application program interface (API) is included in the SPICE Toolkit. Customers use it to read the SPICE auxiliary data files and calculate the derived observation geometry, like the height, lat/lon and illumination angles. Furthermore, many sorts of solar system events utilize these data. The Jet Propulsion Laboratory at the California Institute of Technology, working under contract with NASA, created the SPICE system. Dataset files were obtained from the Planetary Data System (PDS; https://naif.jpl.nasa.gov/naif/index.html accessed on 22 January 2025). Data uniformity and consistency throughout space and time are crucial for spotting changes [17]. Pre-processing steps must be implemented to provide reliable data and forestall any possible mistakes. Pre-processing is a term borrowed from data mining that describes assembling, cleansing, normalizing, and transforming data [18]. The integration of data is an essential step that must be taken before matching and organizing information, as it is the only way to detect and eliminate data duplication and inconsistencies. Integration of remote sensing data is related to aligning visuals via rectifying and co-registration employing the same benchmark and control points. In addition, it entails reprojecting and resampling raw data so that they may be converted from their original forms into a standard format to be compared.

5. Juno Trajectory Geometry

The Juno expedition to Jupiter has been separated into a total of 13 stages, each of which will last for a varying amount of time. As the lengthy Juno mission continues, each phase will reach unique milestones and experience exceptional occurrences. The Juno mission was scheduled to begin in August 2011 and was anticipated to continue for six and a half years, concluding in February 2018. The launch of Juno occurred on 5 August 2011. A two-part maneuver in deep space was performed by the spacecraft on the 30 August and 14 September 2012, subsequently assisted by an Earth gravity maneuver on 9 October 2013, at an altitude of 559 km. This trajectory is known as a deltaV-EGA trajectory [19,20].
After reaching its nearest approach to Jupiter, known as perijove, during orbit 36, Juno performed a deorbit burn to be ready for its mission’s end, which will include a devastating impact on the gas giant. After the conclusion of the mission, the scientists will conduct data analysis for two years [21]. The Juno spacecraft is a spinning orbiter that revolves along its +Z axis, which is the axis that is perpendicular to the plane in which the solar arrays are positioned. The mission phase determines whether the spacecraft spins at an average speed of 1, 2, or 5 revolutions per minute (RPM). For an interplanetary cruise, the spin rate is typically 1 RPM, 2 RPM during the orbit around Jupiter, and 5 RPM during propulsion system maneuvers after processing to the burn position. Instrument inspection and calibration are exempt from the spacecraft spinning at 1 RPM during interplanetary flight, as are the post-cleaning maneuvers [16]. The Launch phase begins at L − 40 min (also written as Launch − 40 min), and it lasts until the satellite has established a Sun-pointed attitude that is pre-defined, steady, and slowly changing. At this point, the cruise attitude control schemes and ephemerides can be used. Post-launch safety and health examinations decide whether the Launch phase continues or comes to a conclusion [20,22].
In the system of differential equations that characterize the planetary, solar, and lunar movements, the independent variable is the uniform time scale known as Barycentric Dynamical Time (TDB). Table 1 presents a breakdown of the various stages of the Juno mission expressed in TBD, as seen below. It provides the phase’s name, commencement date, and end date. The Juno spacecraft, which NASA operates, left Earth in 2011 to begin its trip to Jupiter, the giant planet in our solar system. It is possible to use cruise orientation control algorithms and ephemerides during the Inner Cruise 1 phase, which began after the post-launch establishment of a pre-defined and stable Sun-pointed orientation was achieved, when the orbiter moves far enough away from the Sun to allow for Earth-pointing instead of Sun-pointing. It was decided that TCM 1 (the earliest scheduled trajectory correction maneuver) was not required; hence, it was not carried out [8,23]. Launch plus 66 days and continuing until Launch plus 663 days constituted the duration of the Inner Cruise 2 phase. During this phase, around the aphelion of Juno’s first orbit around the Sun, the deep space maneuvers (DSMs) took place. After the Earth Flyby (EFB), Juno continued to Jupiter [20,24,25]. The duration of the Inner Cruise 3 phase was between L + 663 and L + 823 days. This portion of the voyage lasted 160 days. This phase included the Earth flyby, which provided Juno with a gravitational assist (7.3 km/s of velocity difference, ∆v) on its journey to Jupiter. It had perihelion and happened when the spacecraft completed one elliptical revolution around the Sun [8,26].
Three TCMs were scheduled before EFB, with the final judged unnecessary and one following EFB. As a result of the four maneuvers and EFB, there was greater DSN coverage. Subject to flight system restrictions, the Inner Cruise 3 phase focused on conducting the appropriate maneuvers and an integrated missions exercise around Earth Flyby. The greatest encounter with the Earth happened at 19:21 universal time coordinated (UTC) on 9 October 2013 [27]. The outer cruise phase lasted from L + 823 days to the beginning of the Jupiter approach phase, which occurred six months after Jupiter orbit insertion (JOI) (L + 1614 days or JOI − 182 days). This portion of the trip lasted for a total of 791 days, which was more than 2 years [25]. While preparing for JOI, the spacecraft’s instruments were restricted in their operations near JOI due to orbital insertion preparations. The Jupiter Approach phase lasted for the last six months of the trip before JOI. TCM began at JOI − 5 months, and the DSN coverage increased due to these more regular movements. The 26-month Outer Cruise period preceded the 178-day Jupiter Approach phase. Just before JOI, which began three months later, the project was entirely prepared for the 1.3-year scientific orbit. The JOI critical sequence began at JOI − 4 days, at which point the phase concluded [24,28]. After traveling 1740 million miles over five years, Juno finally reached Jupiter on 4 July 2016 and immediately entered a polar orbit with a period of 53 days that stretched from just over Jupiter’s cloud tops to the furthest limits of the planet’s magnetosphere [29]. The JOI critical sequence was included in the scope of the JOI phase. It started four days in advance of the commencement of the orbit insertion maneuver and continued for one hour after it began. The JOI phenomenon happened when the spacecraft was closest to Jupiter and slowed it down to the point where Jupiter pulled it into an orbit for 53.8 days. This was the second most important event of the mission. To correct any JOI maneuver execution mistakes, a cleaning burn was performed at JOI + 8.6 days while the phase was in progress for capturing orbits. During the JOI phase, there was never a break in the DSN broadcast [30].
Orbit 0 through Orbit 35 were all included in the Science Orbits phase. Orbit N is defined as the region beginning at apojove (AJ) N-1 and continuing to apojove N, and it also involves perijove (PJ) N. The process of assigning orbit numbers began before the Science Orbits phase. Orbit 0 is defined as lasting from PJ0 to AJ0, which included a JOI cleaning maneuver that took place at JOI + 8.6 days. Orbit 1 encompassed PJ1 and extended from AJ0 to AJ1 in its entirety. Orbit 2 encompassed PJ2 and extended from AJ1 to AJ2 in its entirety. Orbit 3 encompassed PJ3 and extended from AJ2 to AJ3 in its entirety. Before the JOI keep-out zone was established, the early orbital research baselines were established in Orbits 0, 1, 2, and 3. The first scientific experiment took place in Orbit 4. It began at AJ3 and continued through AJ4, taking in PJ4 along the way (including the first OTM at PJ4 + 7.5 h). The orbital period was shortened from about 53 days to approximately 43 days as a result of the flyby of Ganymede (the largest satellite of Jupiter) (PJ34) [31,32].
The many findings from Juno have altered our perception of Jupiter’s atmosphere and interior, illuminating a weather layer in Jupiter’s atmosphere that reaches far beyond the planet’s water clouds as well as a deep interior with a core composed of diluted heavy elements. Juno is now conducting an extended mission, during which it will continue its examination of the biggest planet in the solar system until September 2025 or until the mission reaches the end of its operational lifetime, whichever comes first. This extension gives Juno the mission of becoming an explorer of the Jovian system, including Jupiter and all of its moons and rings. In addition, Juno will have extra meetings with Europa and Io, two of Jupiter’s most interesting moons [33].

5.1. Trajectory Components

A sequence of trajectory rectification maneuvers must be performed on the Juno spacecraft to ensure that it is guided to the appropriate target points along the reference trajectory. These maneuvers must be performed without breaching the mission’s pointing, power, or other limitations [22]. Juno’s travel route from Earth to Jupiter is shown in Figure 1. There was an August 2011 launch for the Juno spacecraft. The mission was on course to enter Jupiter’s orbit on 4 July 2016, after which it was maneuvered back toward Earth for a rendezvous on its way to Jupiter, which is confirmed by [29,34]. It is essential to mention that we are providing our analysis between August 2011 (start of analysis interval), the launch phase, and January 2023 (end of analysis interval). The latter is the last date of data that NASA has provided, as the next release of data was available in the second half of 2023. As seen in Figure 1, the spacecraft moved around the Sun, firing its main engine twice at a distance beyond Mars’ orbit.
A blue line marks the Earth’s trajectory. The flyby of the Earth took around two years after launch and was built up by these deep space maneuvers.
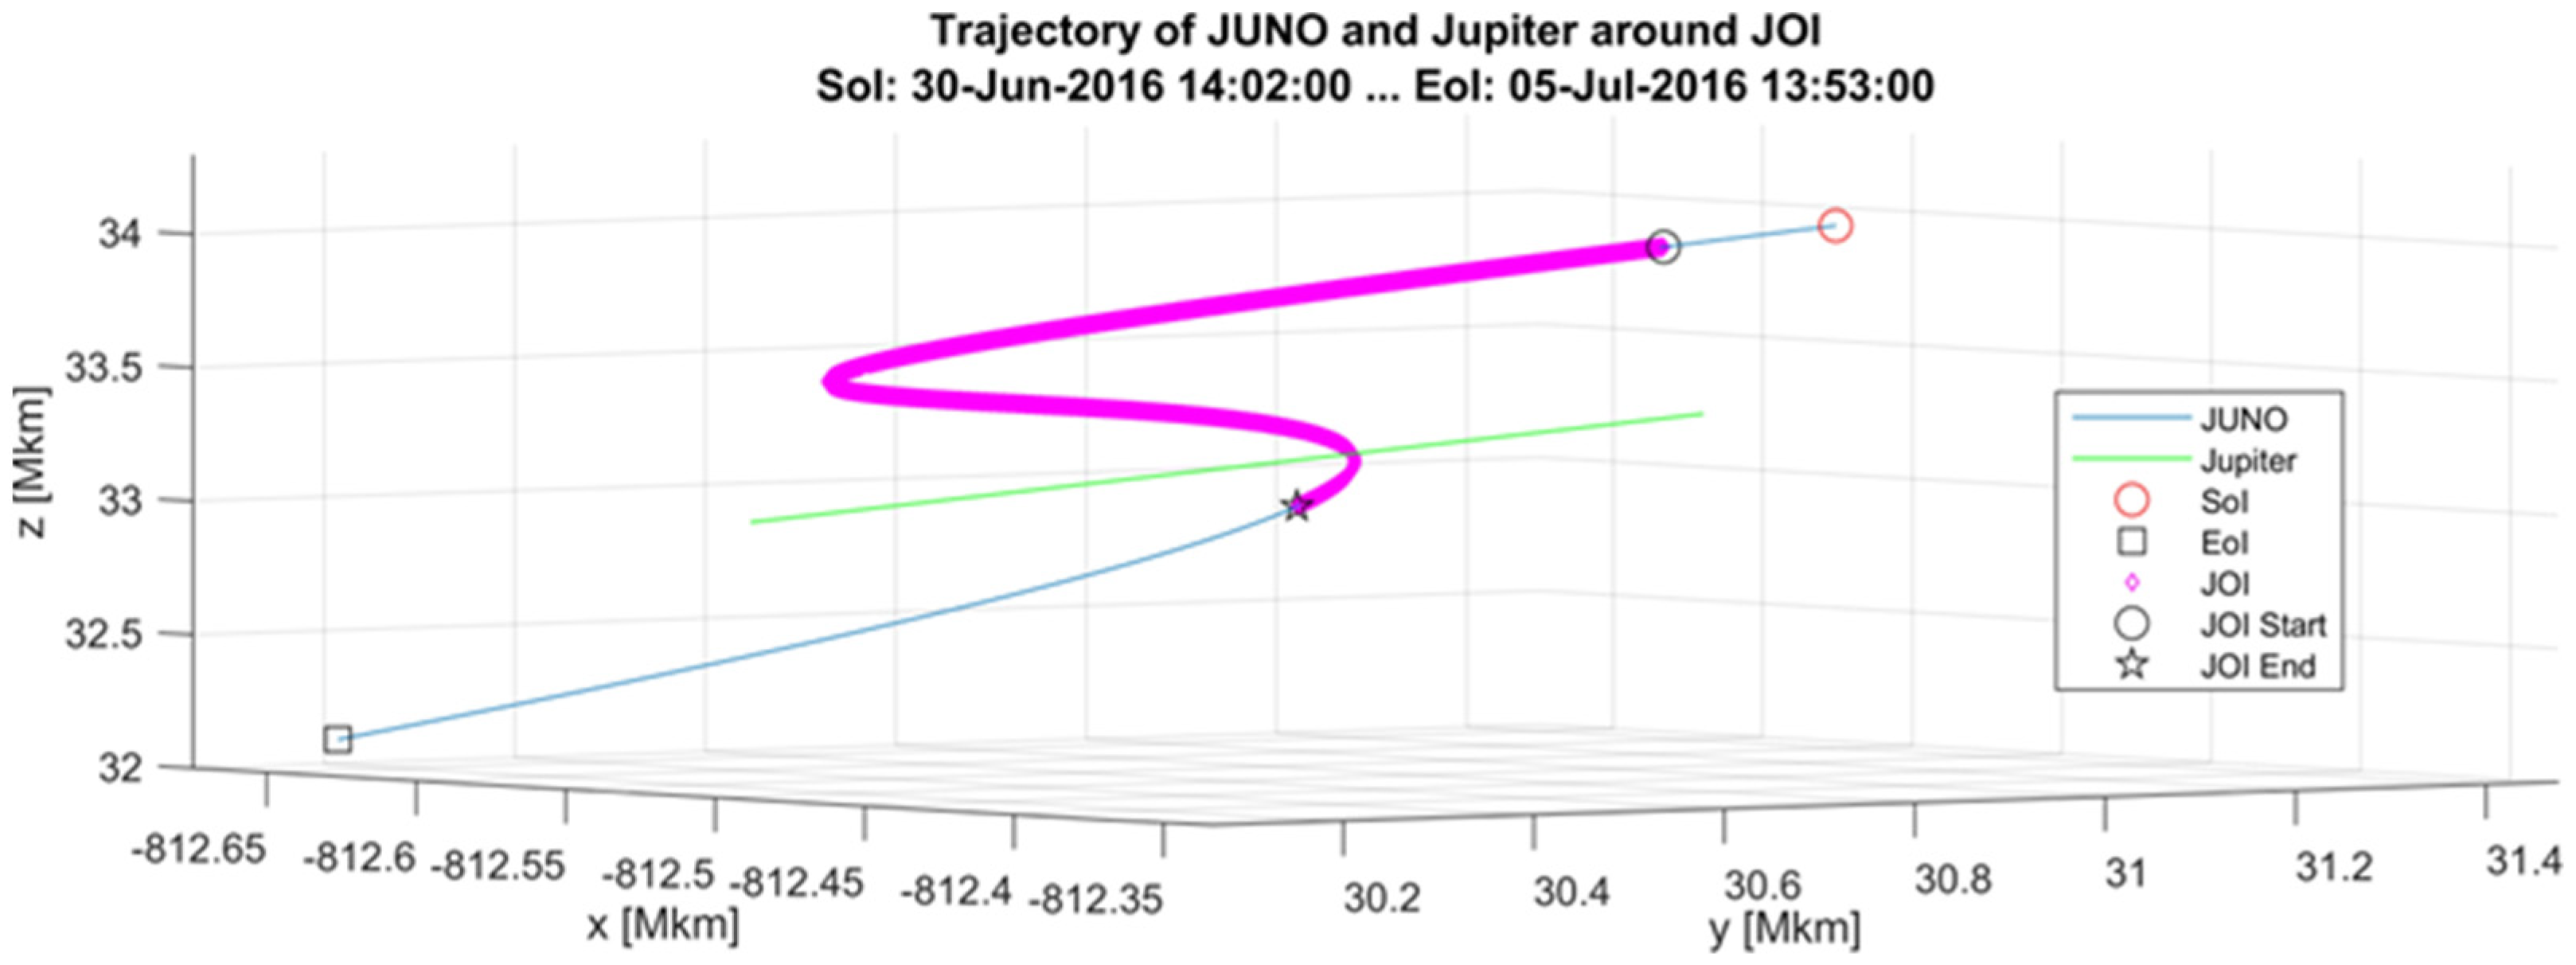
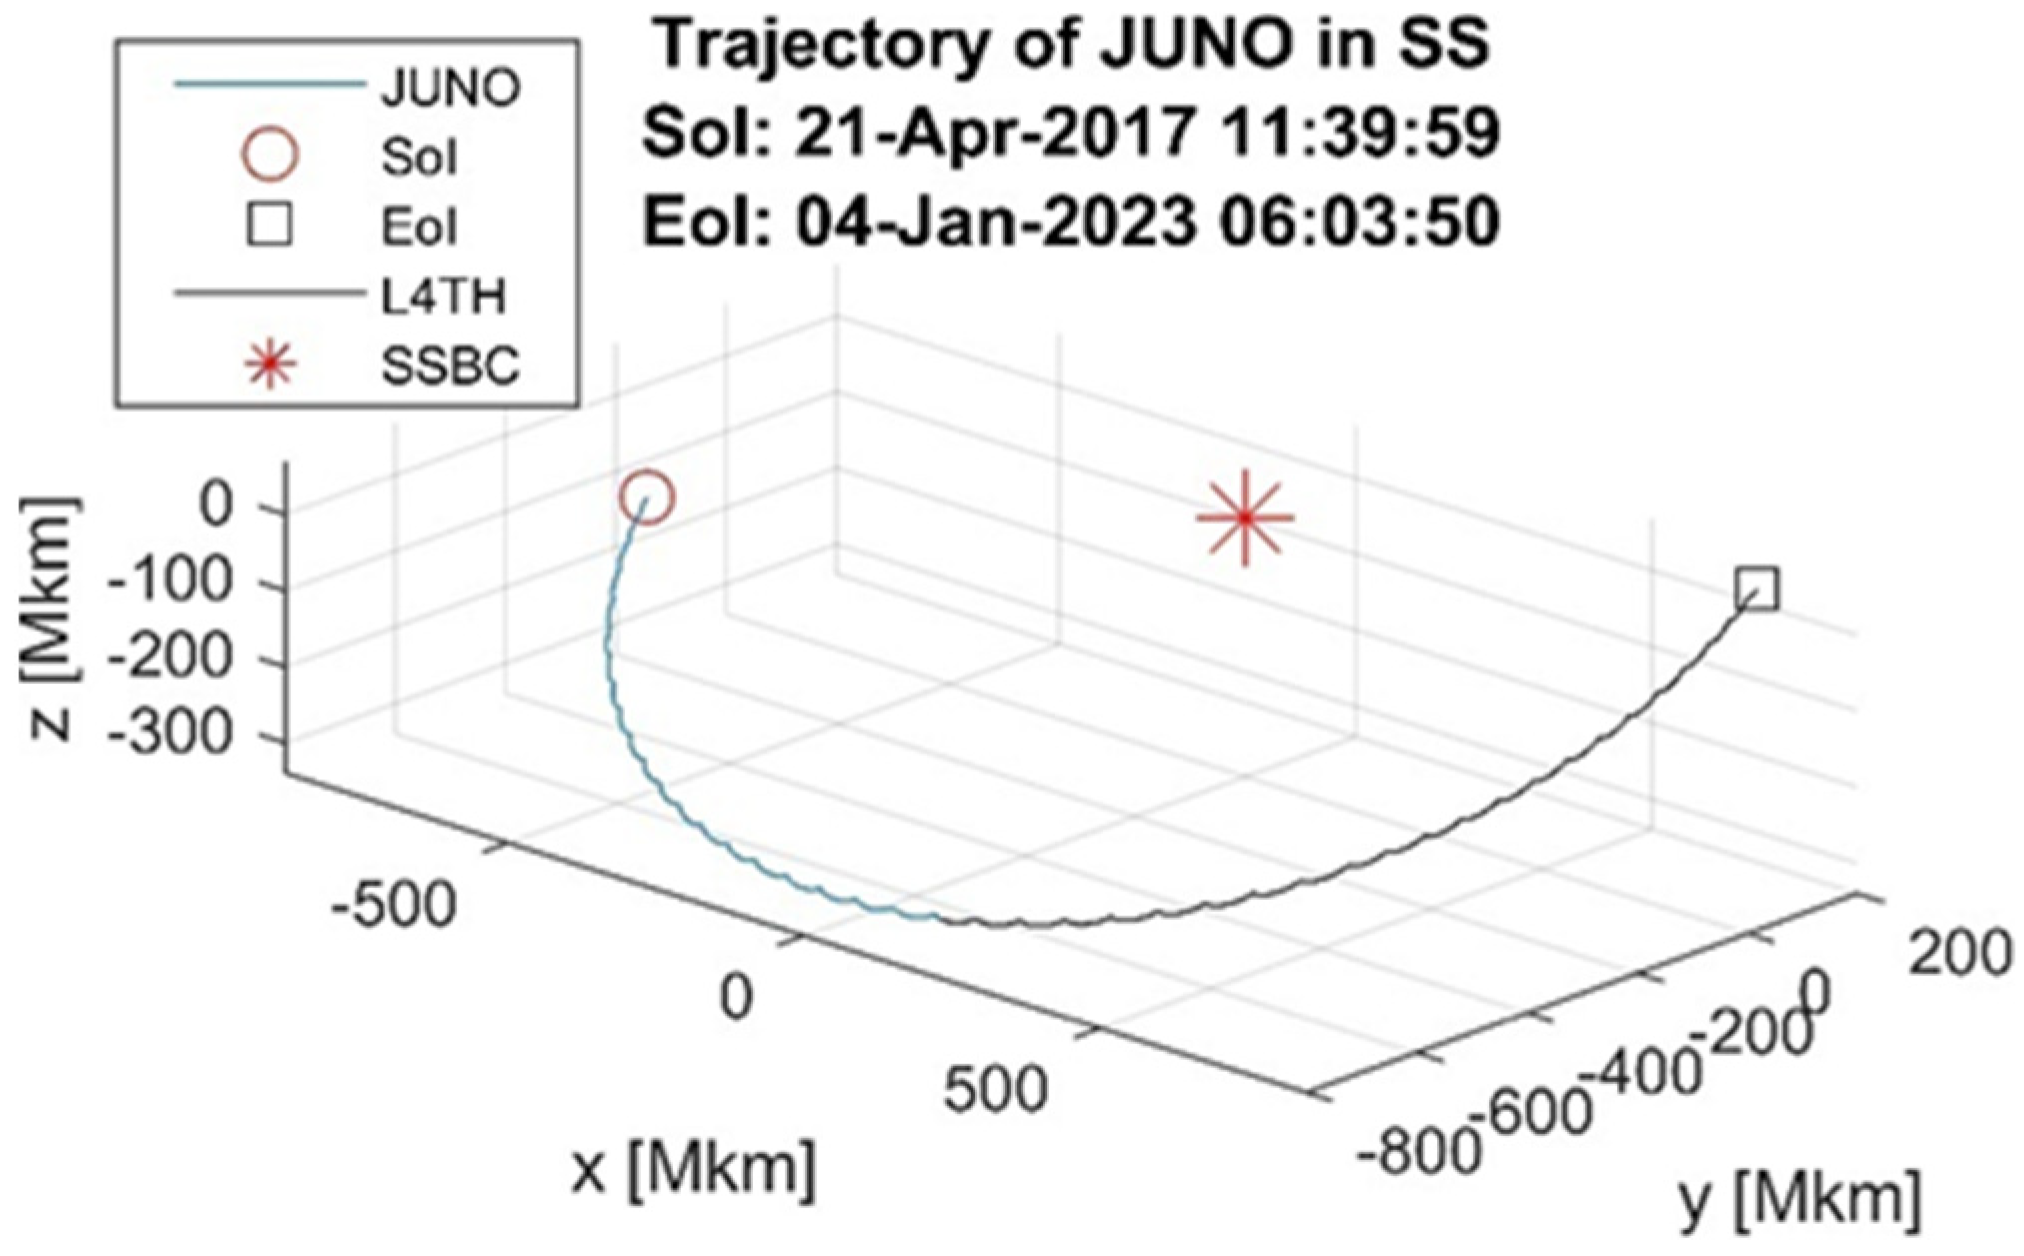
Each X marker in the figure represents the first sample at the start of the Earth new year. An Earth flyby helped Juno gain the momentum to cruise straight into Jupiter’s orbit. In July 2016, Juno arrived at orbit around Jupiter. Juno’s trajectory is shown by the (red) line. The start of the interval is symbolized by a red circle, while the black box represents the last date of the analyzed time interval. A green line represents Jupiter’s orbit. A red star and the Juno Orbit Insertion with a purple diamond object symbolize the solar system barycenter (SSBC). Because the JOI process took just around five days, the diamond object moves very little around the orbit in the scale of years. It can be noticed that when it was on its way back to Earth after a deep-space maneuver, Juno stayed inside the ecliptic, but when it was traveling to Jupiter from Earth, it strayed outside of the ecliptic. As soon as it reached Jupiter, Juno performed a significant maneuver to enter a capture orbit that lasted for 78 days. This JOI burn took about 33 min and sent Juno into a polar, elliptical orbit with Jupiter (see Figure 1 and Figure 2).
During the following perijove passage, which occurred on 19 October 2016, Juno executed a period reduction maneuver (PRM) that lasted about 34 min. The goal of this maneuver was to bring the orbital period down to just under 11 days so that the research portion of the mission could begin. Because any problems that may have occurred during the PRM execution were scheduled to be fixed during the first 11-day orbit, the first science orbit occurred during the second 11-day orbit. The orbit of capture was considered Orbit 1, the orbit of clean-up was considered Orbit 2, and the first main scientific orbit was considered Orbit 3. After each science orbit, a maneuver occurred four hours after the perijove to achieve the proper circumstances for the subsequent perijove (discussed later). After the main scientific phase of each orbit had been completed (about three hours after perijove), an orbit trim maneuver (OTM) took place. Figure 3 depicts Juno’s trajectory in the last quarter of the overall analyzed time interval. In July 2016, Juno arrived at Jupiter and immediately commenced an elliptical orbit around the planet’s poles. The Juno probe investigated regions of the galaxy that have never been scrutinized before because of its unique orbital path.
As discussed earlier, the Juno spacecraft was successfully launched onto a heliocentric trajectory in August 2011. Because the spacecraft used an Earth gravity assist a little over two years after launch, the Juno reference trajectory is referred to as a “2+ dV-EGA” trajectory. Here, “2+ dV-EGA” is the official designation given to Juno’s path to reach Jupiter. The abbreviation EGA refers to “Earth Gravity Assist”, and the number “2+” indicates that the flyby took place a bit over two years into the mission. The term dV suggests that the route chosen by Juno leverages hyperbolic surplus velocity.

5.2. Statistical Properties of Position, Velocity and Acceleration Components

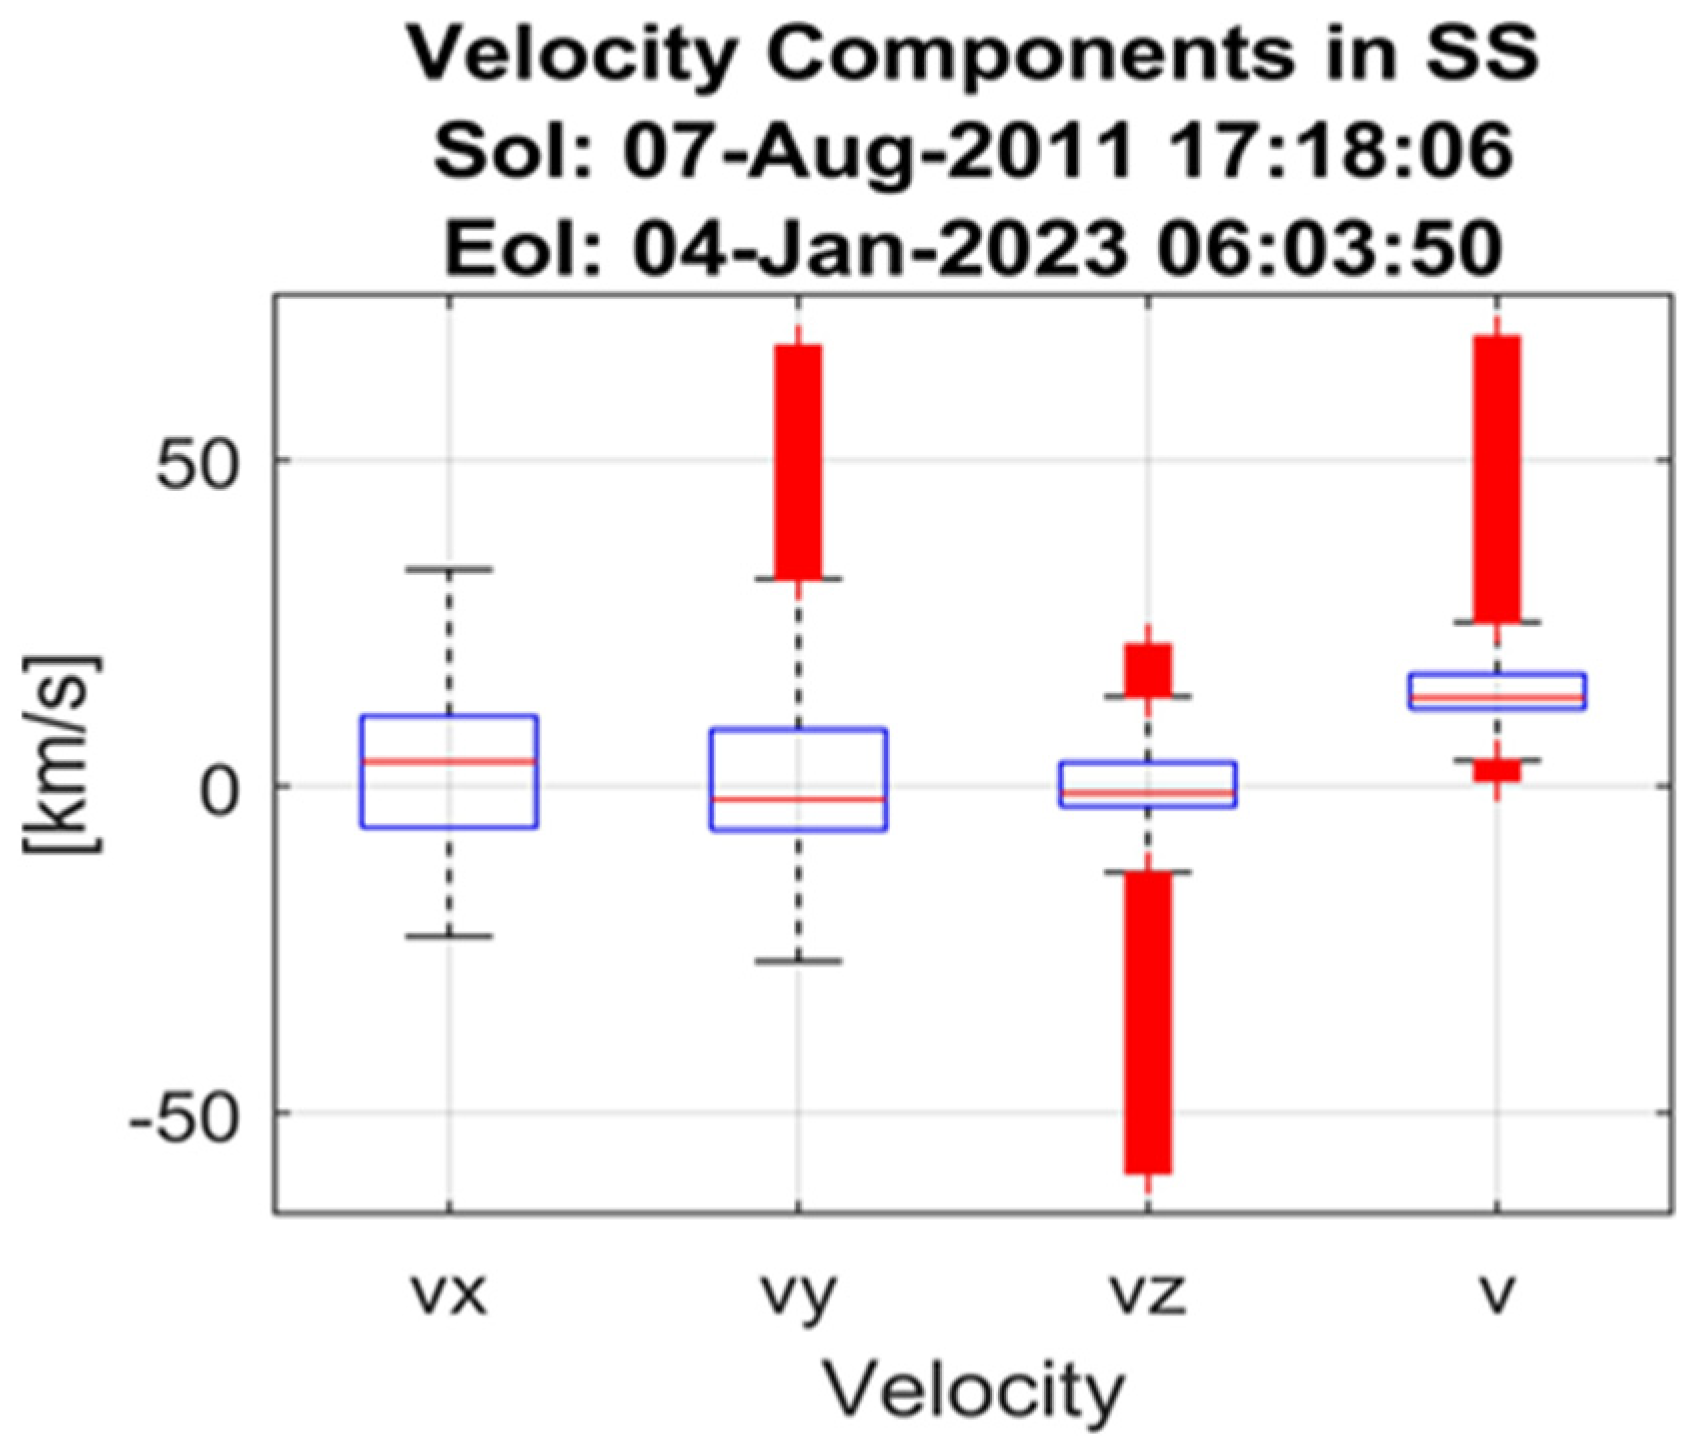
They are designed to convey high-level information at a glance, providing broad knowledge about the uniformity, skew, volatility, and outliers of a set of data at a glance. They offer a practical method for visually representing the variety of replies a large group provides, in addition to their other qualities. It is easy to determine where most of the data are located and compare the characteristics of the various groupings easily.
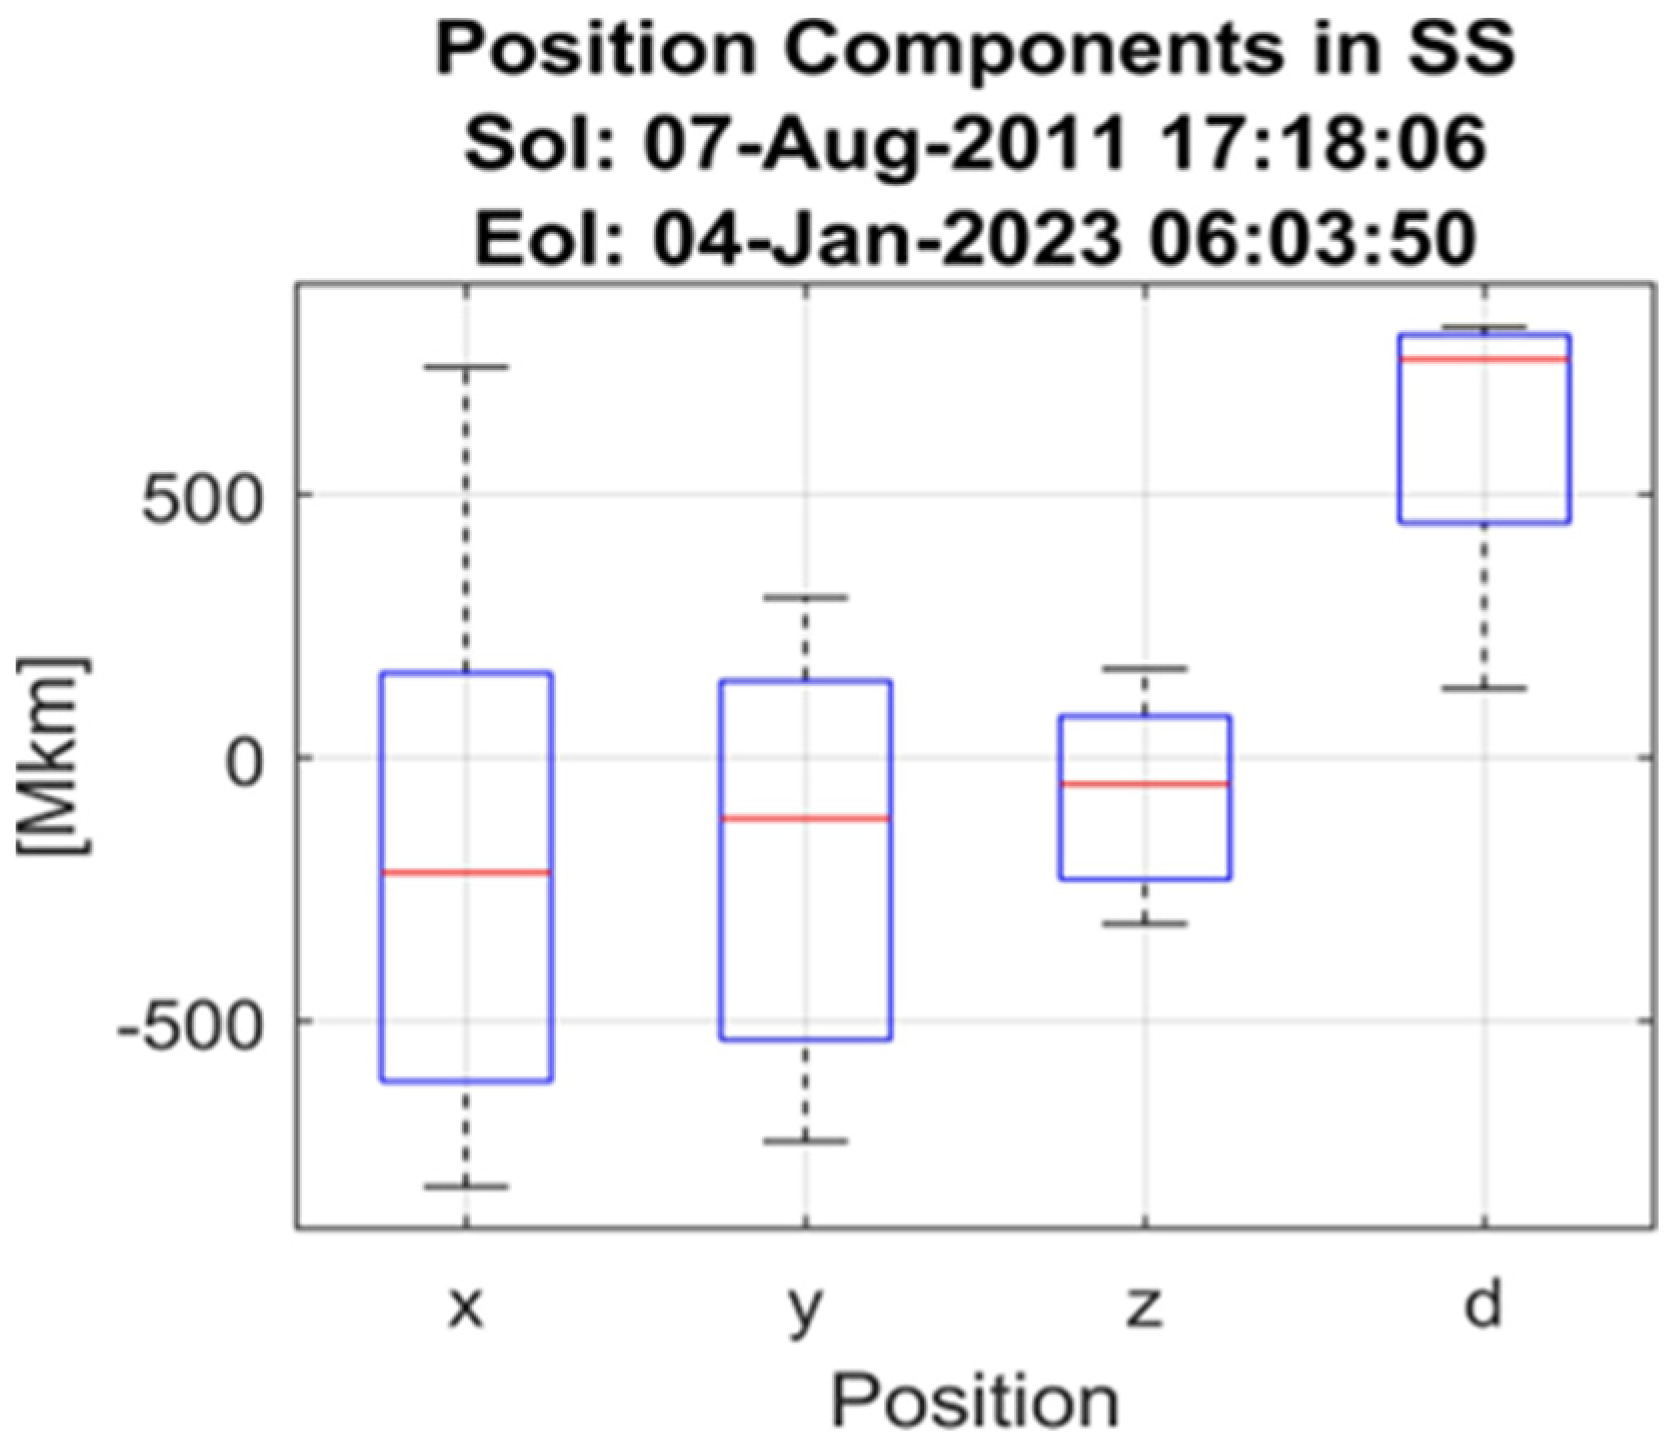
In the boxplot in Figure 4, each box visually represents the median million kilometer over different position components in the barycenter for the Juno spacecraft in the sample data. For example, the median for position y is approximately −300,000 km. The minimum value at boxplot y is about −600,000 km and the maximum is about 200,000 km. This graphic illustrates that the distance at point d exceeds that at the other places, which are z, y, and x in succession. Several versions of the boxplot are feasible: represent outliers with dashed lines, where an outlier is often defined as any point 1.5 IQR (inter-quartile range) distance measurements from the box. The scores range from the lower to upper quartile and are referred to as the interquartile range.
There are a few alternative variants of the boxplot, including displaying outliers using dashed lines, where an outlier is generally understood to be any point that is further than 1.5 IQR distance measurements from the box. In the plots, the whiskers can only be drawn a maximum of 1.5 IQR distance measurements out from the box. If, however, the whisker is going to be drawn beyond the bounds of the data vector, then it is redrawn at the data’s border (i.e., it is clamped to sidestep it exceeding). The box’s upper bound is unequal to the box’s lower bound, except for the boxplot (x). All the boxplots show the negative skewness of the dataset, except the boxplot (x), which is normal. A boxplot does not reveal the actual distribution of the data. For example, the boxplot z in Figure 5 shows that the data are skewed left due to a higher median and a longer lower tail than the upper tail. The traveled distance concerning the acceleration is described in Figure 6. Based on the figure, all the components have positive and negative acceleration values except component (a). To plan and adapt the spacecraft’s trajectory, we must understand how its speed changes (i.e., whether it is accelerating or decelerating). This is critical for operations like orbital insertion, rendezvousing with other spacecraft, and landing on a celestial body. Acceleration determines the forces exerted on the spacecraft. High accelerations may cause stress on the spacecraft’s construction. Simply said, velocity informs you how fast the spacecraft is moving, and acceleration tells you how quickly that speed is changing. This information is critical to precise control and mission success. As can be seen in Figure 7, the boxplot can be a useful tool to visualize the distribution of the acceleration derivative data. The first derivative of acceleration, referred to as jerk, offers crucial insights that go beyond the information provided by basic acceleration when studying the motion of a spacecraft. Jerk quantifies the rate at which the acceleration is changing. To execute a seamless maneuver, it is essential to minimize the jerk, hence reducing abrupt movements and vibrations experienced by both the spacecraft and its passengers.
Examining jerk aids in attaining seamless acceleration patterns that save gasoline. Abrupt variations in acceleration may serve as indications of certain occurrences, such as the activation of thrusters or the unexpected collision with external forces. Examining the rate of change of acceleration, known as the jerk, aids in identifying these occurrences and comprehending their influence on the spacecraft’s movement. Essentially, acceleration informs you about the rate at which the velocity is changing, whereas jerk indicates the speed at which that change is occurring. Here’s what a boxplot of the acceleration derivative (Jerk) would typically show:
  • The center line of the box represents the median, which is the middle value when the data are ordered from least to greatest.
  • The box itself encompasses the middle 50% of the data, also known as the interquartile range (IQR). The lower boundary of the box corresponds to the first quartile (Q1), while the upper boundary indicates the third quartile (Q3).
  • Lines extending from the box, called whiskers, typically reach up to 1.5 times the IQR from the quartiles. These whiskers capture most of the remaining data points.
  • Any data points falling outside the whiskers are considered outliers and are plotted individually as circles or asterisks.
This visual summary allows you to quickly assess the following:
  • Center: The typical value of the acceleration derivative.
  • Spread: How much the data vary around the center.
  • Skewness: If the distribution leans toward positive or negative values.
  • Outliers: Any extreme values in the dataset.
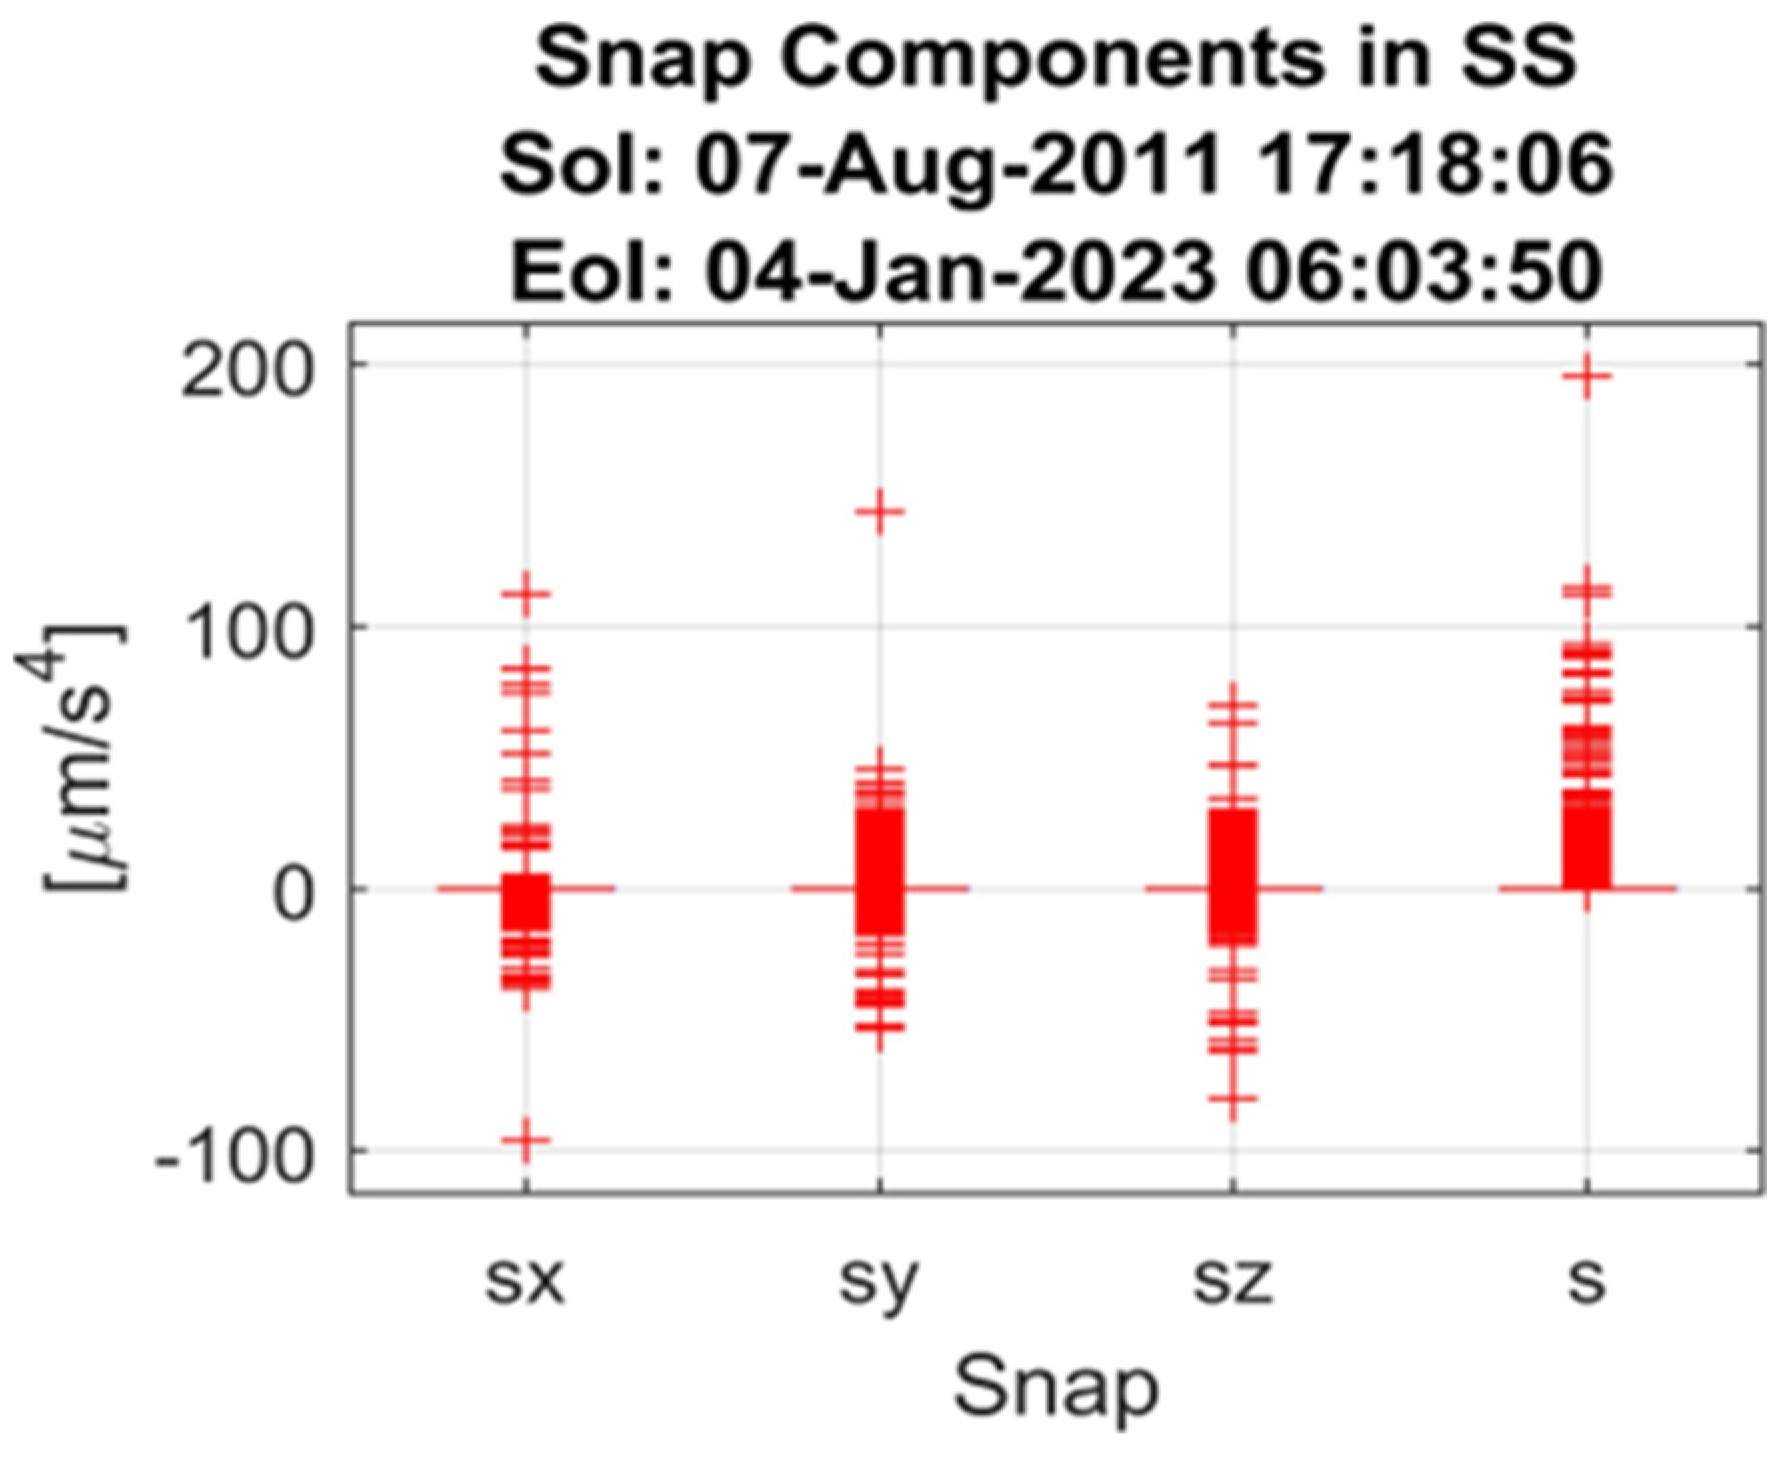
While the acceleration (the first derivative of velocity) and jerk (the first derivative of acceleration) are crucial for spacecraft control, analyzing the snap, the second derivative of acceleration, provides even deeper insight. Figure 8 shows the second derivative of the velocity (the snap). The center line of the boxplot shows the median, which is the middle number when the data are ranked from lowest to highest. This is also called the interquartile range (IQR) and it shows the middle 50% of the data. The first quartile (Q1) is shown at the bottom of the box, and the third quartile (Q3) is shown at the top. The lines that go out from the box are called whiskers, and they usually go up to 1.5 times the IQR from the quartiles. Most of the last few data points are picked up by these edges. Although the impacts of snap may not be as apparent as those of acceleration or jerk, it offers a more profound comprehension of the subtleties of a spacecraft’s movement.
Through the analysis of the snap, engineers may attain remarkable fluidity, improve control systems for maximum effectiveness, and guarantee the comfort and welfare of astronauts or the integrity of delicate cargo. It is crucial to emphasize that the analysis of snap becomes more significant for high-precision operations or spacecraft carrying very delicate payloads. When it comes to regular missions, it may be enough to prioritize acceleration and jerk. Nevertheless, when the limits of accuracy and comfort are tested in space exploration, snap analysis emerges as a significant technique for attaining improved control over spacecraft. While this study focuses on the Juno mission, the methods and findings have broad applicability to other spacecraft missions. The analytical approaches developed here are designed to be adaptable to various mission profiles and orbital characteristics. For example, our anomaly detection method can be applied to future outer planet missions, helping to identify potential navigation issues early.
The spatial–temporal clustering approach can be used in mission planning for future asteroid or comet rendezvous missions, optimizing trajectory design. The insights gained from analyzing Juno’s trajectory variations can inform the design of future missions to the outer solar system, improving our understanding of the challenges in navigating these environments. By developing these tools using the complex case of the Juno mission, we ensure their robustness and applicability to a wide range of space exploration scenarios.

6. Methodology

A change probability is a number calculated to indicate the possibility of change in space and is often obtained via temporal investigation of historical datasets. This value estimates the chance of change occurring in an area. Forecasting future circumstances is essential for planning-related research, and identifying the likelihood of change permits this capability. Both non-periodic and periodic datasets may be examined to conclude trajectory change detection [35]. The pattern is a parameter that could be figured out from observations made at either regular intervals or irregular intervals. Most of the time, trends from observations that do not happen at regular intervals are found in large amounts of data, such as annual or other regularly collected observations [36]. When analyzing patterns, curve fitting may be employed in non-periodic sampling. Estimating pattern parameters may be accomplished using conventional statistical methods such as regression. It is worth mentioning that our current dataset is periodic.
The model has additional flexibility in choosing which filters to use in threshold queries, thanks to the dynamic query parameters. Whereas descriptive statistics describe a dataset’s features, inferential statistics allow us to draw inferences and establish predictions depending on the data. Upon acquiring the dataset, we applied inferential statistics to gain insights into the broader population from which the sample originated. Inferential statistics enable us to draw conclusions about the larger population based on the sample data. A formal approach to conducting statistical analysis through inferential methods is hypothesis testing, which aims to analyze populations or investigate relationships between variables using sample data. With the use of statistical tests, hypotheses or predictions are examined. A valid conclusion may be drawn using statistical tests that evaluate sample errors. Utilizing stationary or non-stationary decomposition strategies allows for the collection of pattern characteristics [37]. The interpretation of stationary temporal patterns may restrict the use of these approaches to events that exhibit certain material change features.
The stationarity criteria are violated when sudden changes significantly depart from a temporal curve of biophysical parameters. Natural occurrences like volcanic eruptions might cause these kinds of changes and therefore do not satisfy the stationarity criterion. The spacecraft dynamics must be mathematically represented as an initial step in approaching the spacecraft trajectory analytic aspect. A route or time history of the location and velocity of the spaceship may be represented by a collection of ordinary differential equations, which is how the spacecraft trajectory scheme is defined. These equations can be thought of as spacecraft trajectory modeling. In a broad sense, the movement equations for the spacecraft [38,39] used as the model may be stated in a first-order notation. We have represented the state of the object ( U ¯ ) with the formula as follows:
U ¯ ( t ) = f r ¯ x , y , z , v ¯ x , y ,   z , t ,
We denote the relative position and relative velocity of Juno around Jupiter by X ¯ = X ¯ ( t ) and X ¯ = X ¯ ( t ) as two-column vectors dependent on time t , respectively. Movement of Juno in the solar system is executed and conforms to a non-linear differential equation:
v ¯ = d d t r ¯ = r ¯ = g r ¯ , t .
where the position vector has the following formula:
  r ¯ = [ x   y   z ] T = [ d x d t   d y d t   d z d t ] T = [ v x   v y   v z ] T .
And f ,   g are control functions of the trajectory and velocity, respectively. The operator T represents the transposition of a vector or matrix. These control functions f ,   g are not accessible publicly but, based on the phase-state vectors, can be determined as extreme modifications of the trajectory curve in the 3D coordinate system set in the solar system. The position vector represents the trajectory and velocity of Juno in the solar reference system r J U N ¯ and r J U N ¯ , respectively. Similarly, the trajectory and velocity of Jupiter are represented by r J U P ¯ and r J U P ¯ , respectively. It is evident that:
d d t r J U N ¯ = r J U N ¯ .
And
d d t r J U P ¯ = r J U P ¯ .
Because Juno is a spinning orbiter with high stability, it needs higher-order position vector derivatives to detect the object’s status change. Similar to the Formulae (4) and (5), the acceleration, jerk and snap of Juno are second, third and fourth derivative of the position. Because we have a discrete sampling period in the scale of one minute, we have to consider the average of these quantities. The instantaneous average acceleration (a), jerk (j) and snap (s) of Juno are determined with the following formulae:
a J U N ¯ = Δ v J U N ¯ Δ t .
j J U N ¯ = Δ a J U N ¯ Δ t .
s J U N ¯ = Δ j J U N ¯ Δ t .
The sampling period of our dataset is Δ t = 60   s . The position and velocity values were downloaded from the data source, but the acceleration, jerk and snap were calculated based on the velocity and time period. The acceleration, jerk and snap values are not instantaneous but average values (see Formulae (6)–(8)) in each time period Δ t . Because the value of Δ t is very small relative to the overall movement process (~11.5 years), we consider these average ratios as instantaneous values. All the 3D vectors are continuous in time, but we have N discrete-time samplings with a period of one minute downloaded from the database of NASA. This makes us use discrete vectors X ¯ R 3 x N , v ¯ R 3 x N , a ¯ R 3 x N , j ¯ R 3 x N and s ¯ R 3 x N with N = 5,583,178 samplings in the time interval between the launch time on 8 August 2011 of Juno (SOI) and the end of the accessible data on 4 January 2023 (EOI). The use of the higher-order velocity derivatives makes it possible to detect EEs more accurately. We had to distinguish three phases in time of the trajectory during the analysis:
(i)  
OP1: Before the JOI phase, Juno’s trajectory is a smoothed 3D curve in the solar system. This phase lasts approximately five years after the launch from the Earth. The reference system is the solar system.
(ii) 
OP2: In the JOI phase, Juno approaches Jupiter and, based on the gravity effects, starts, step-by-step, to move around it. The reference system remains the solar system.
(iii)
OP3: After the JOI phase in the solar reference system, Juno has a helicoid orbit in 3D with Jupiter in the gravity center (see Figure 3). In a time of weeks, the trajectory of Juno around Jupiter is an ellipse, with one of the focal points being Jupiter. It should be mentioned that this trajectory modifies slowly on the scale of several months or years, and this relative trajectory is slowly modifying over time, too. An overview of the applied methods is given in Table 2. Evaluation of the acceleration, jerk, and snap is considered in each operation phase to be relative to the barycenter of the solar system. Trajectory modification is considered an extreme event (EE).
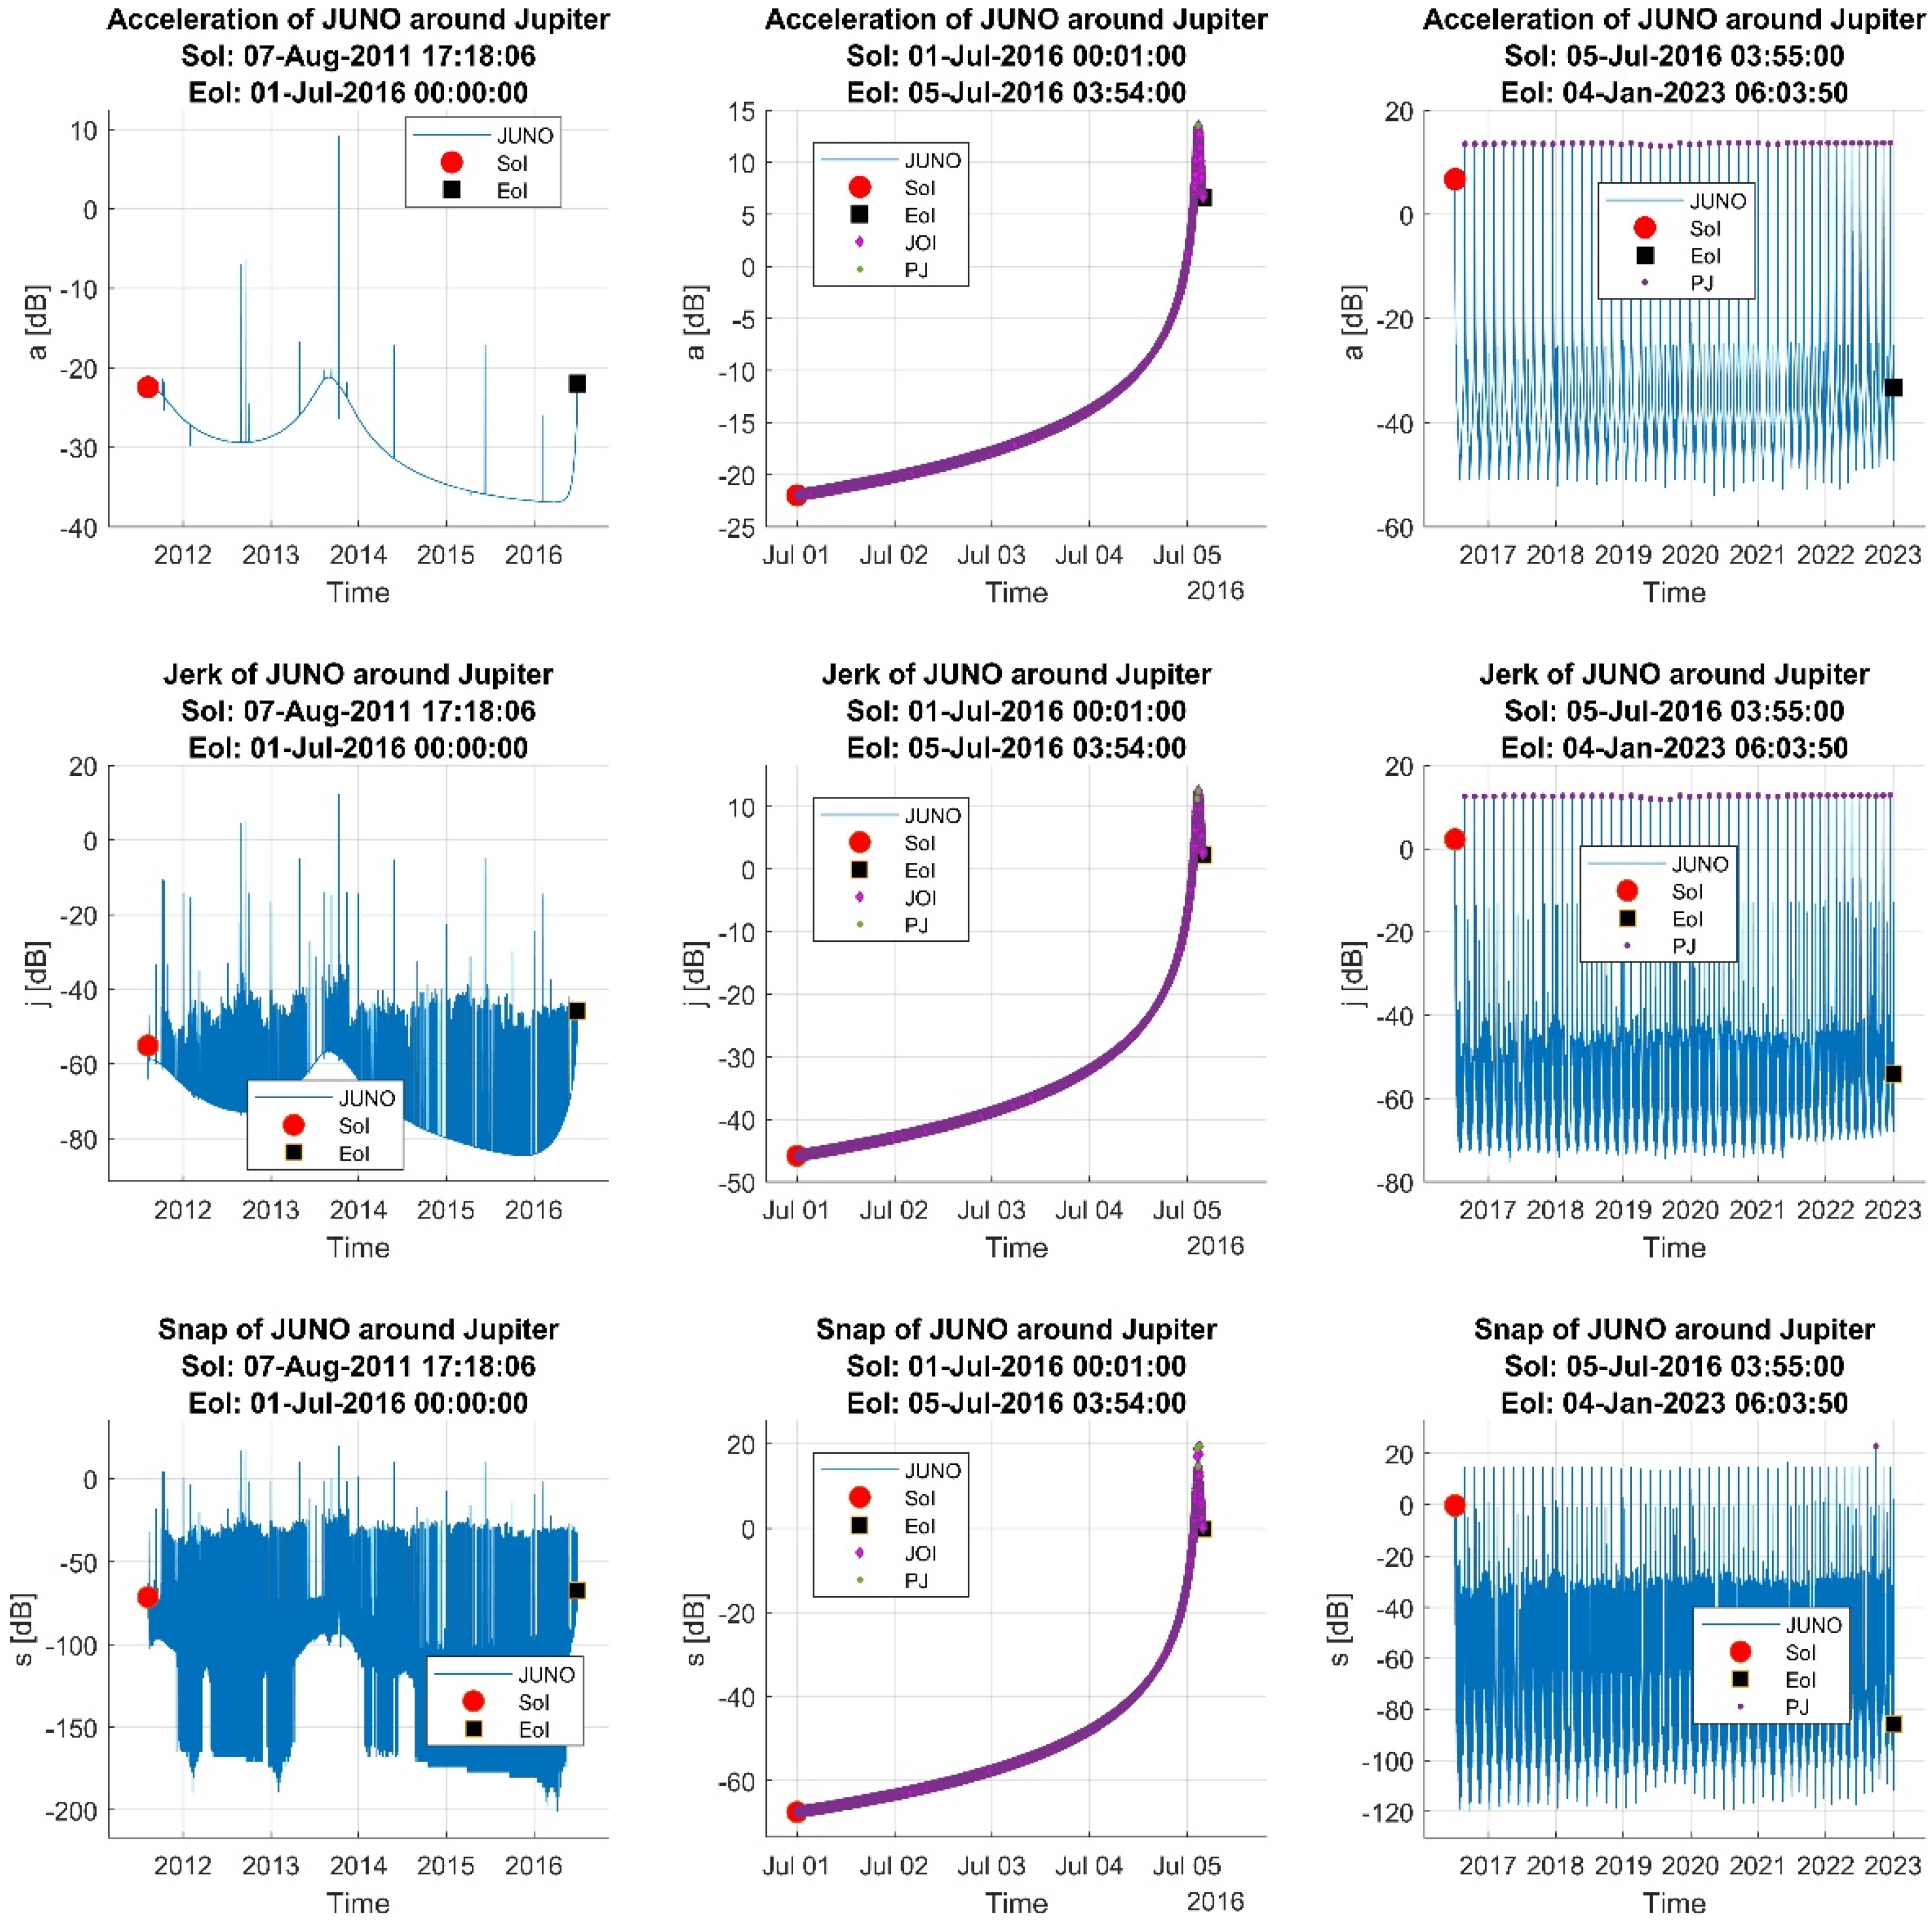
A powerful event happens when the complex logical expression of the EE condition is true. These conditions are logical functions of the logical variables A 1 , A 2 , S 2 , S 3 . These conditions are determined and explained in the next parts of the paper. The absolute values of the acceleration (row one), jerk (row two) and snap (row three) of the Juno are represented in the array of Figure 9 below. Each column of figures belongs to the same operation phase. PJ stands for perijove, which appears once at the end of OP2 and repeats 42 times in OP3. It uses a decibel function of the signals a, j and s because the logarithm of a time series amplifies low values in smaller orders of magnitudes and makes the visualization of small and large values easier in the same plot.
Detecting EEs belonging to trajectory modification in OP1 and OP2 is possible, with the most simple data series being the acceleration compared with the jerk and snap. The OP3 decision about which time series to use for extreme event detection is not automatic. Perijove and apojove events can be seen around −25 dB of acceleration, −15 dB jerk and 0 dB snap.

6.1. Detection of Trajectory Modification

The method of extreme event detection is based on the identification of sampling moments when a considerable modification happens to the velocity or higher-order derivatives of the velocity. Each of these time series is non-linear. Based on the first two laws of Newton, an extreme event of the trajectory is caused by force, implying velocity modification. Because the Juno object being in the solar system is always influenced by the gravitation force of the Sun, other planets (i.e., Earth, Jupiter) are in the temporal vicinity.
To detect extreme modification of a signal u ( t ) , we use the Hilbert transform (HT), which is a convolution between the signal and function w t = 1 π t multiplied with the constant conforming to the following formula:
H u t = 1 π u t w t = 1 π P . V . u τ t τ d τ = lim ε 0 t ε u τ t τ d τ + t + ε u τ t τ d τ .
where “ ” is the convolution operation, P.V. has the meaning of the Cauchy principal value integral, because the integral diverges when τ = t . Readers should note the important properties of the HT:
H u t + d = H u t + d .
H { u α t } = H { u } α t .
H e i ω t = e i ω t s i g n ω π 2 .
where d , α , ω are constant in time and i 2 = 1 .
The third property implies that H u t = c o n s t = 0 , and for u t c o n s t HT executes a modification with an angle Δ θ = s i g n ω π / 2 of the phase of the original signal u(t). If we consider the signal as an inverse Fourier transform (FT) of the FT, Ϝ { u ( t ) } = u ( ω ) ^ :
u t = 1 2 π u ( ω ) ^ e i ω t d ω .
Then, using the relation of cos   ( s i g n ω π ) = −1 for any ω 0 , we get another important feature of the HT. The AC (Alternate Current–dynamic part) component u A C ( t ) of the signal u ( t ) is:
H 2 u t = H 2 Ϝ 1 Ϝ u = Ϝ 1 H Ϝ H { u = u A C ( t ) .
This last property makes it possible to determine the DC (Direct Current–constant part) component u D C t of the signal:
u D C t = u t u A C t = u t + H 2 u t .
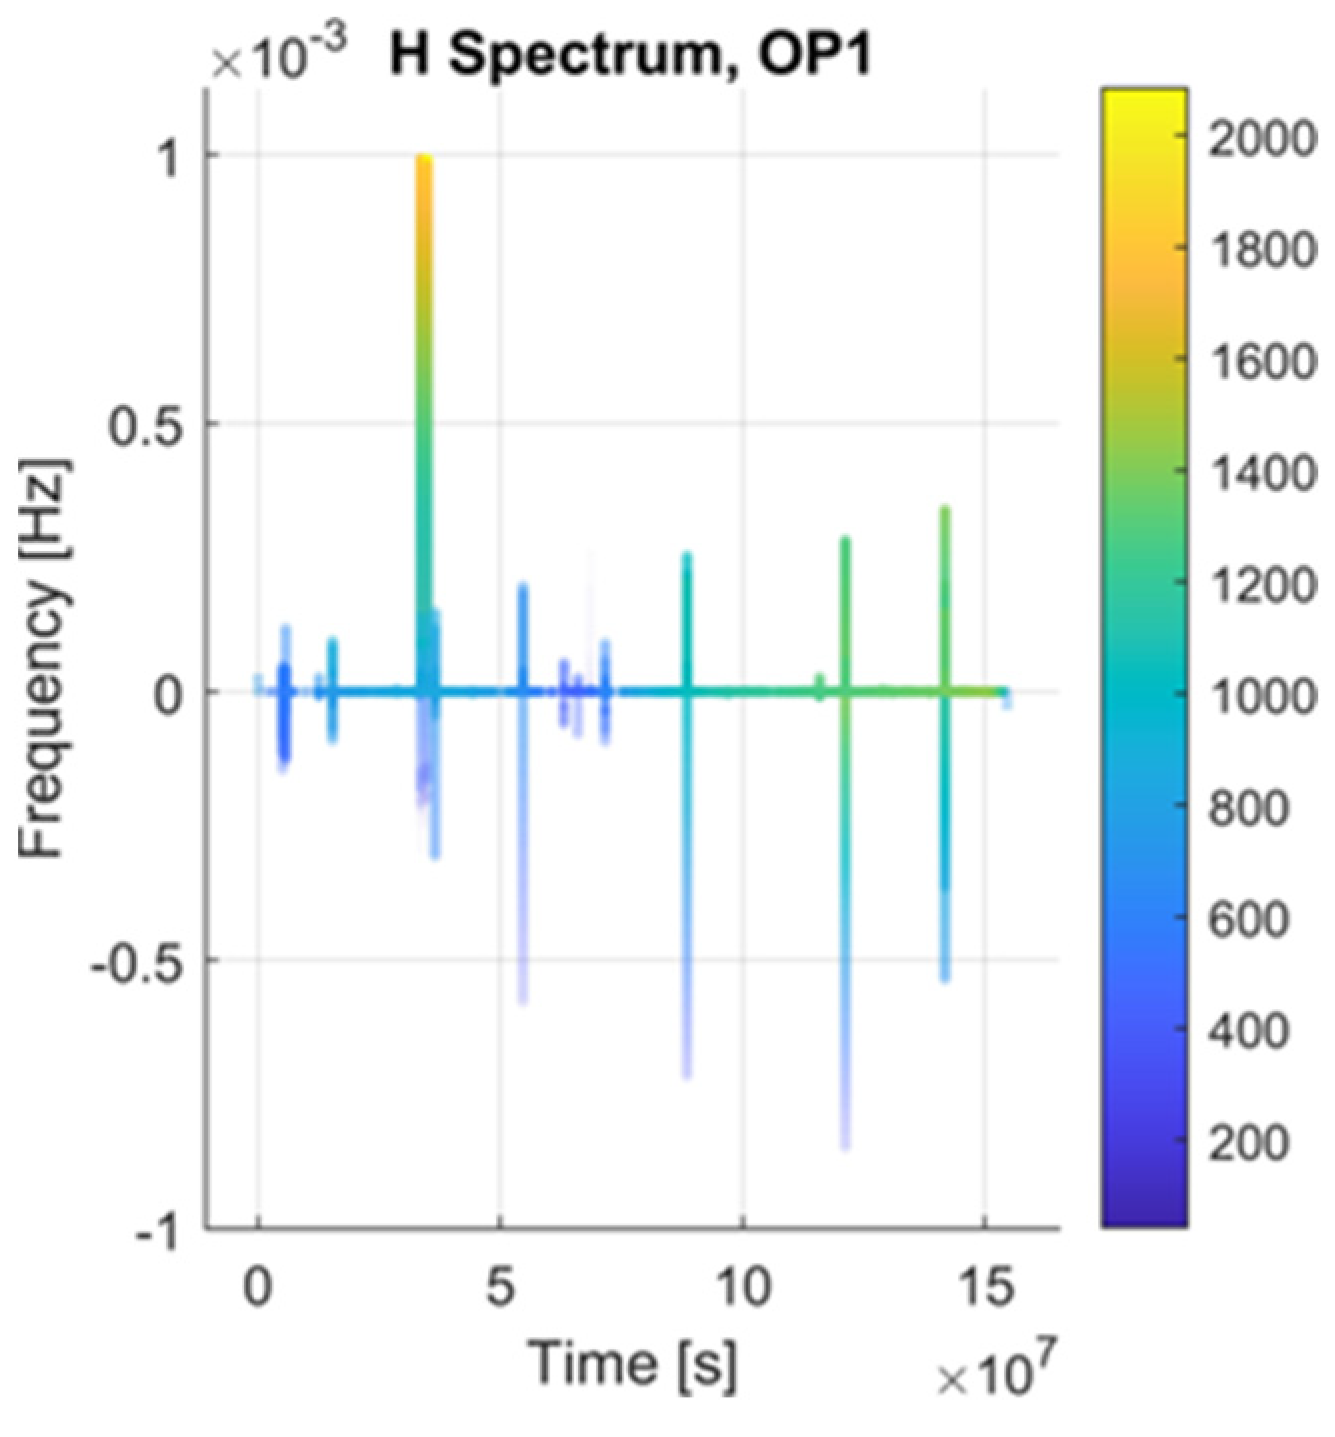
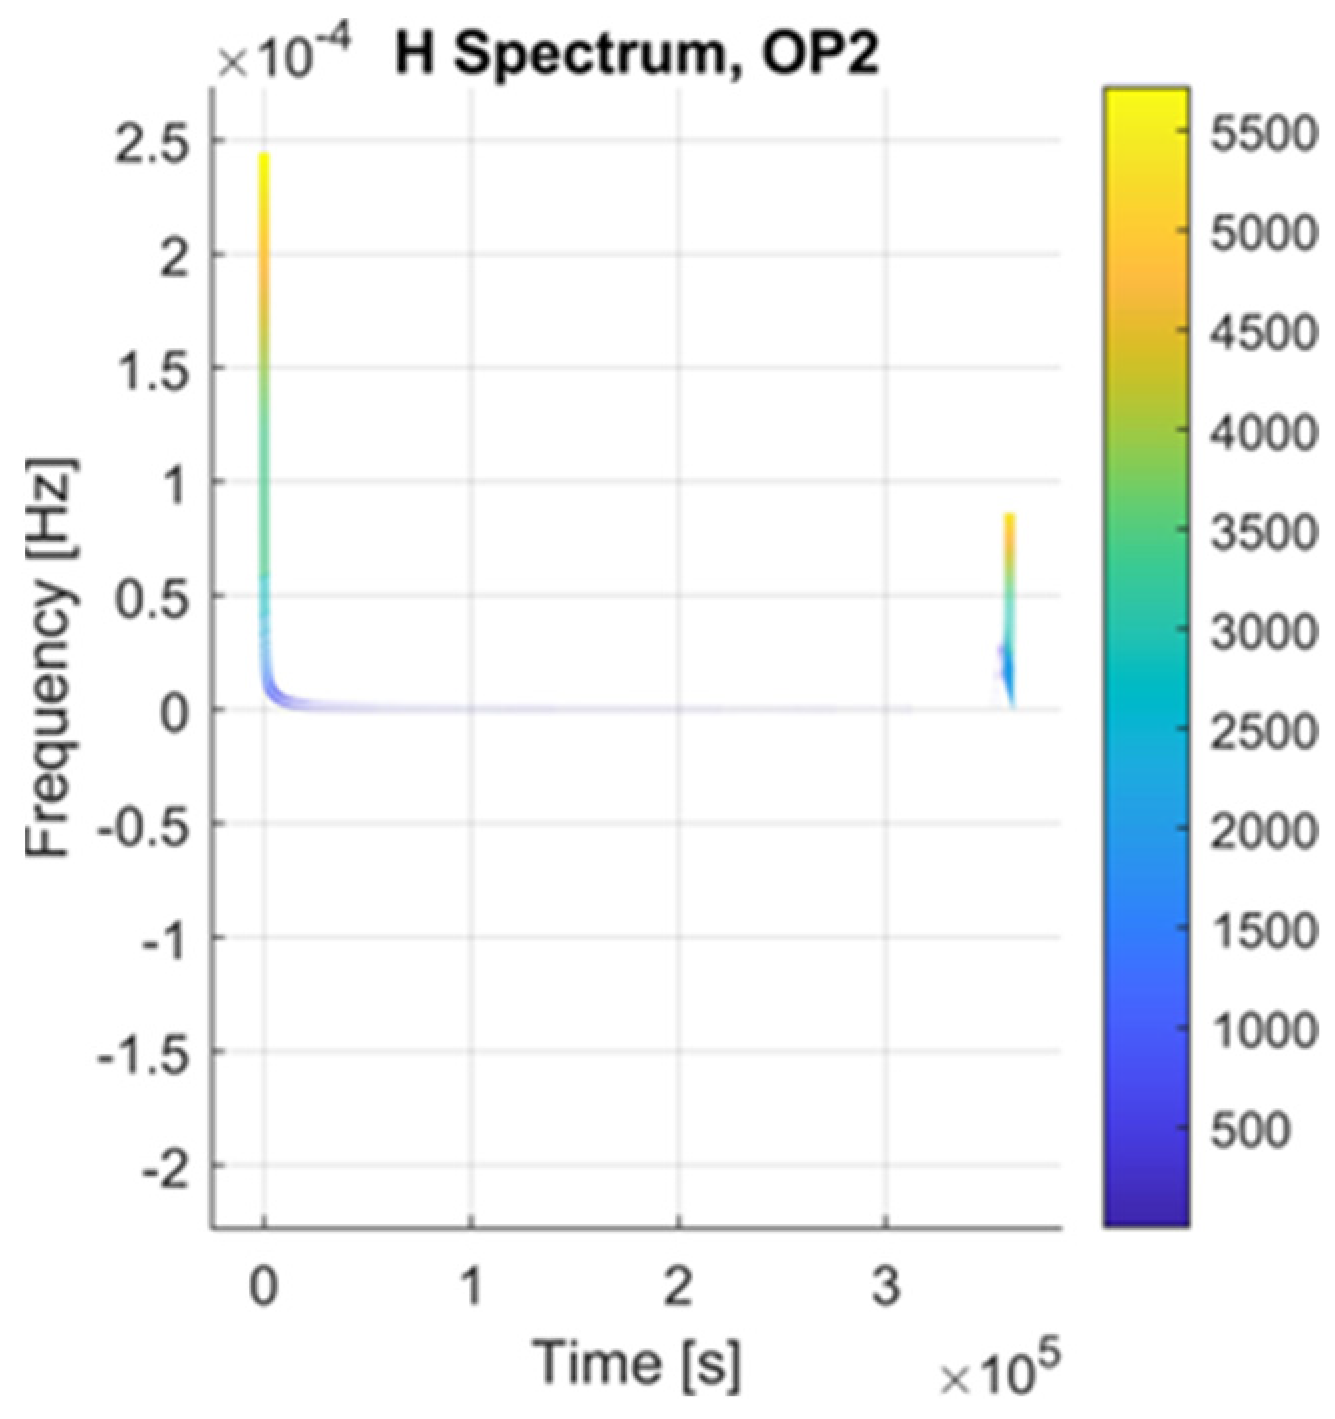
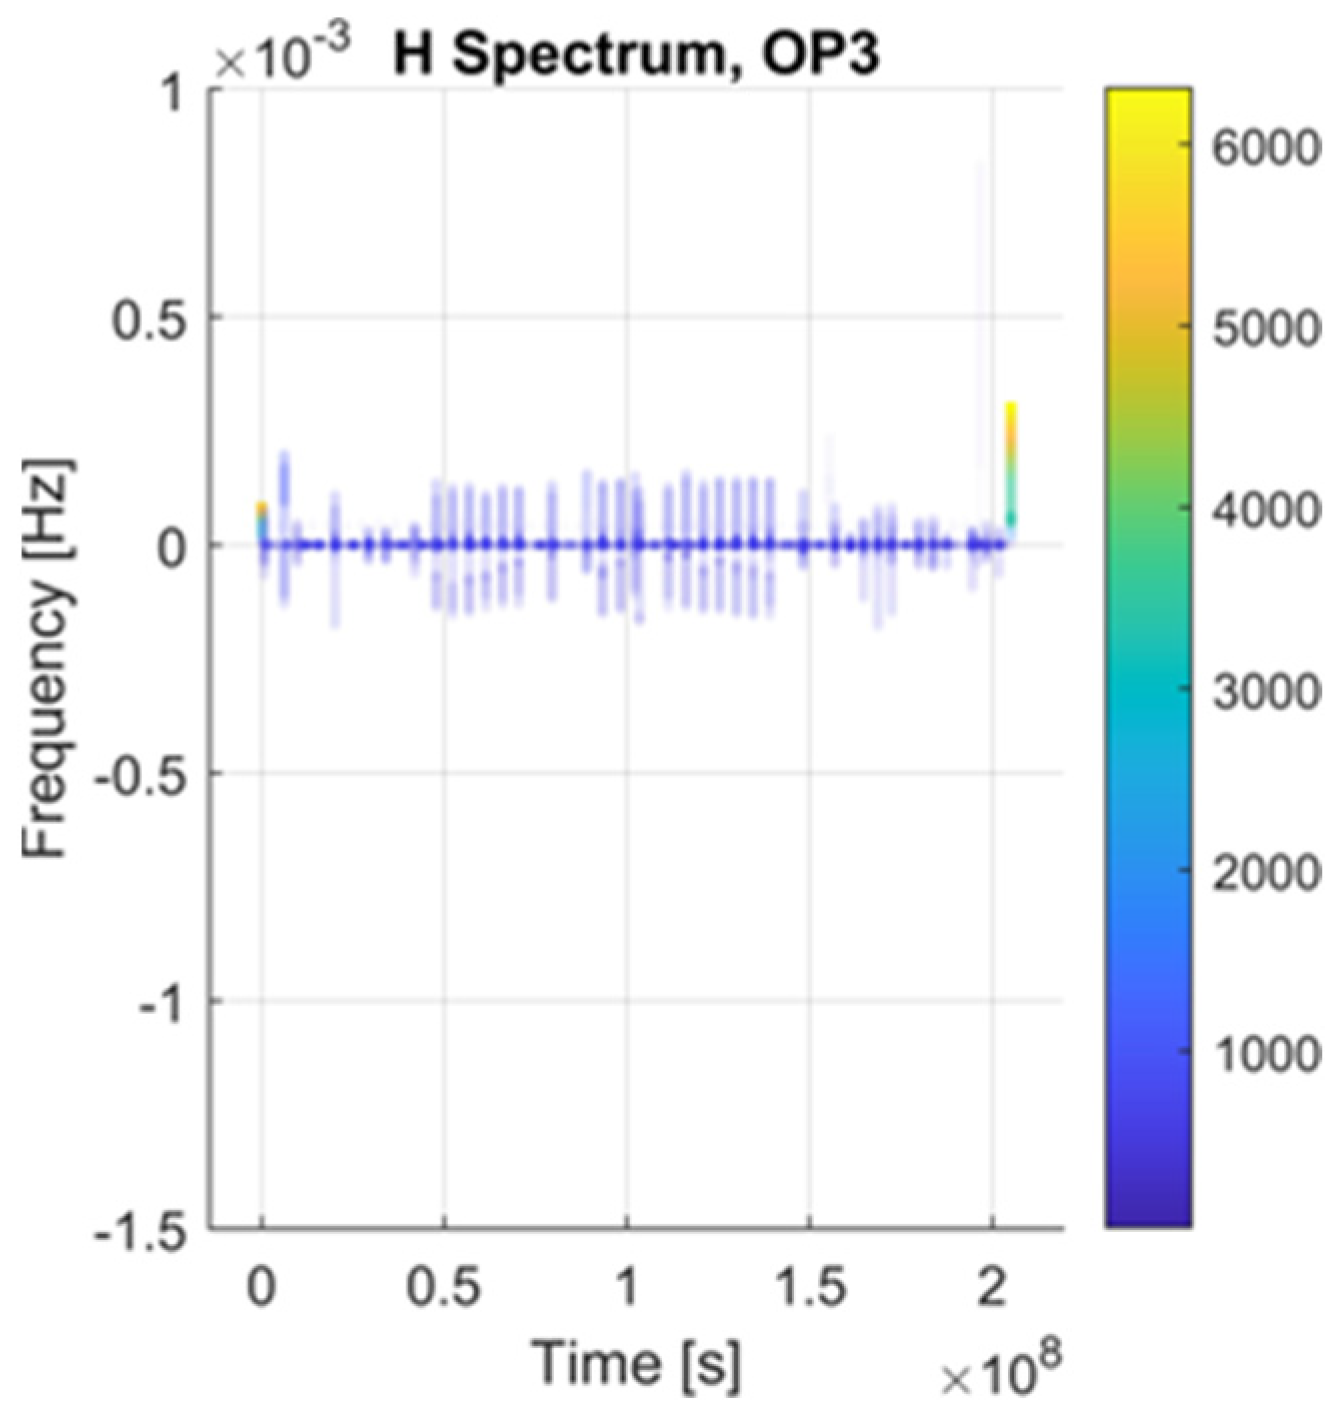
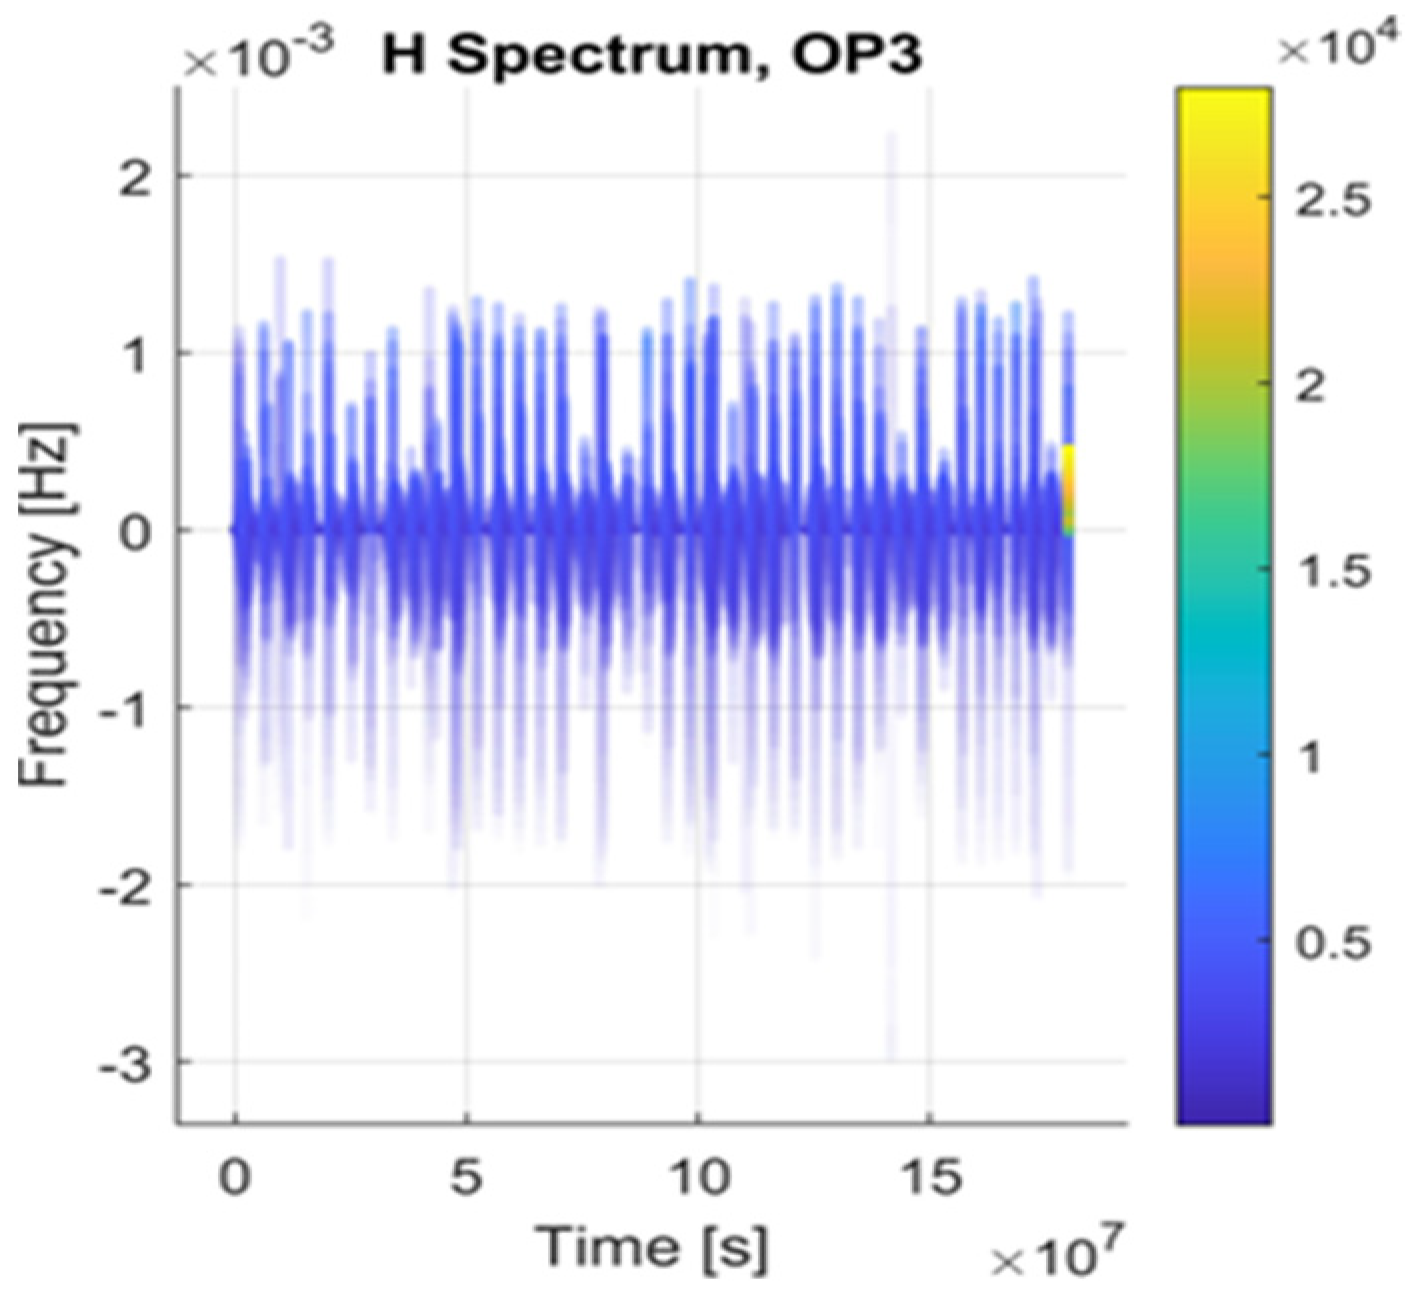
We use HT to identify extreme signal u(t) changes in our case. Figure 10, Figure 11 and Figure 12 show the Hilbert transform of the acceleration signal in the first and second operation phases. The Hilbert transform may elucidate the frequency and instantaneous amplitude properties of a time domain signal. The Hilbert transform is a useful method for examining the properties of acceleration signals.
The Hilbert transform generates a new signal by imposing a 90-degree phase displacement on all the positive frequencies of the preceding signal in the frequency domain. This may be characterized as a signal that has undergone a time delay. The process of combining the original signal with its Hilbert transform results in the creation of the analytical signal, which is a signal with complex values.
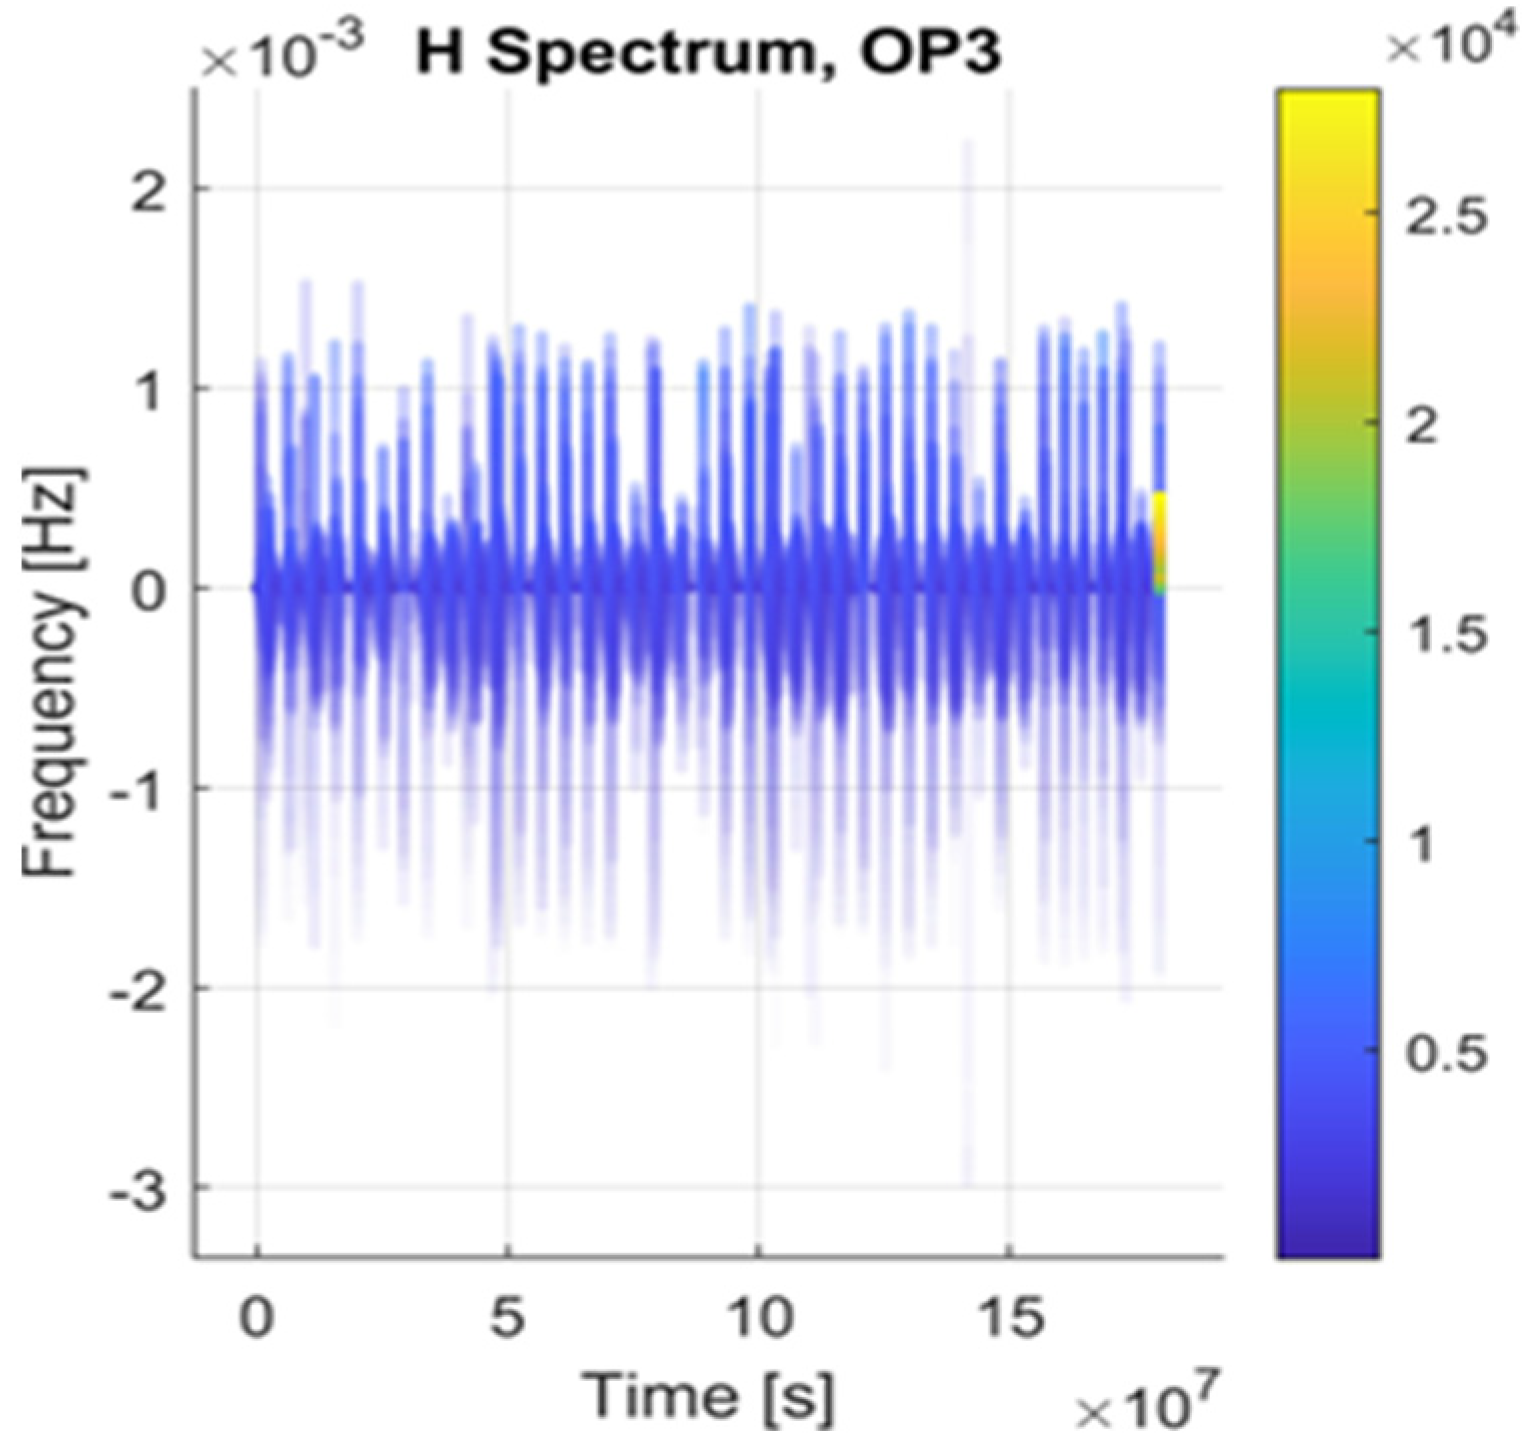
The analytic signal preserves essential information from the original acceleration signal. To identify changes in the strength of the motion, one may use the magnitude of the analytic signal, which indicates the current level of acceleration. To ascertain the phase of the acceleration at a certain place, one may analyze the phase of the analytic signal. Calculation is a technique used to ascertain the rate of change of a phase. Reaction rate: this analysis may provide a valuable understanding of the temporal variations in the acceleration frequency for non-stationary vibrations. We must evaluate the velocity’s second- and third-order derivatives: jerk and snap. The HT of these time series is represented in Figure 13 and Figure 14 between frequencies belonging to perijove and apojove events that can also be seen in other events. These are around 1 × 10⁻³ Hz of the snap.
Table 3 contains the trajectory modification dates. In the case of OP1, these are identified by large spectrum values for positive frequencies. In OP2, there were two modifications: at JOI, the start and end. In the case of OP3, there are perijoves of Juno around Jupiter.
In the analyzed time interval, there were 42 perijoves and 42 apojoves executed, which are approximatively constant frequency-based events. We have to look into a smaller frequency scale of 1 × 10⁻⁶. Neither trivial deterministic condition can be seen for the EE in this small acceleration scale. Based on the observations above, the extreme event conditions for each of the OPs are compound logical expressions and are given in Table 3. H S ( a ) , H S ( s )   f ( a ) and f ( s ) are the Hilbert spectrum and frequency of the acceleration (a) and snap (S), respectively.

6.2. State Space Analysis and Discussion

EEs detected in each of the Juno OP are listed in Table 4. EEs are logical expressions of the elemental event conditions (i.e., an extreme event in OP1 is an AND operation between event conditions A_11 and A_12, where A_11 means all the time moments when the Hilbert spectrum of the acceleration is greater than 800). A neutral elemental event condition is noted by ∅. The dates are in the astronautical format of “YYYY-MM-DDThh:mm:ss”. A total of 9, 2, and 12 EEs were identified as trajectory modifications in the three different operation phases, OP1, OP2, and OP3.
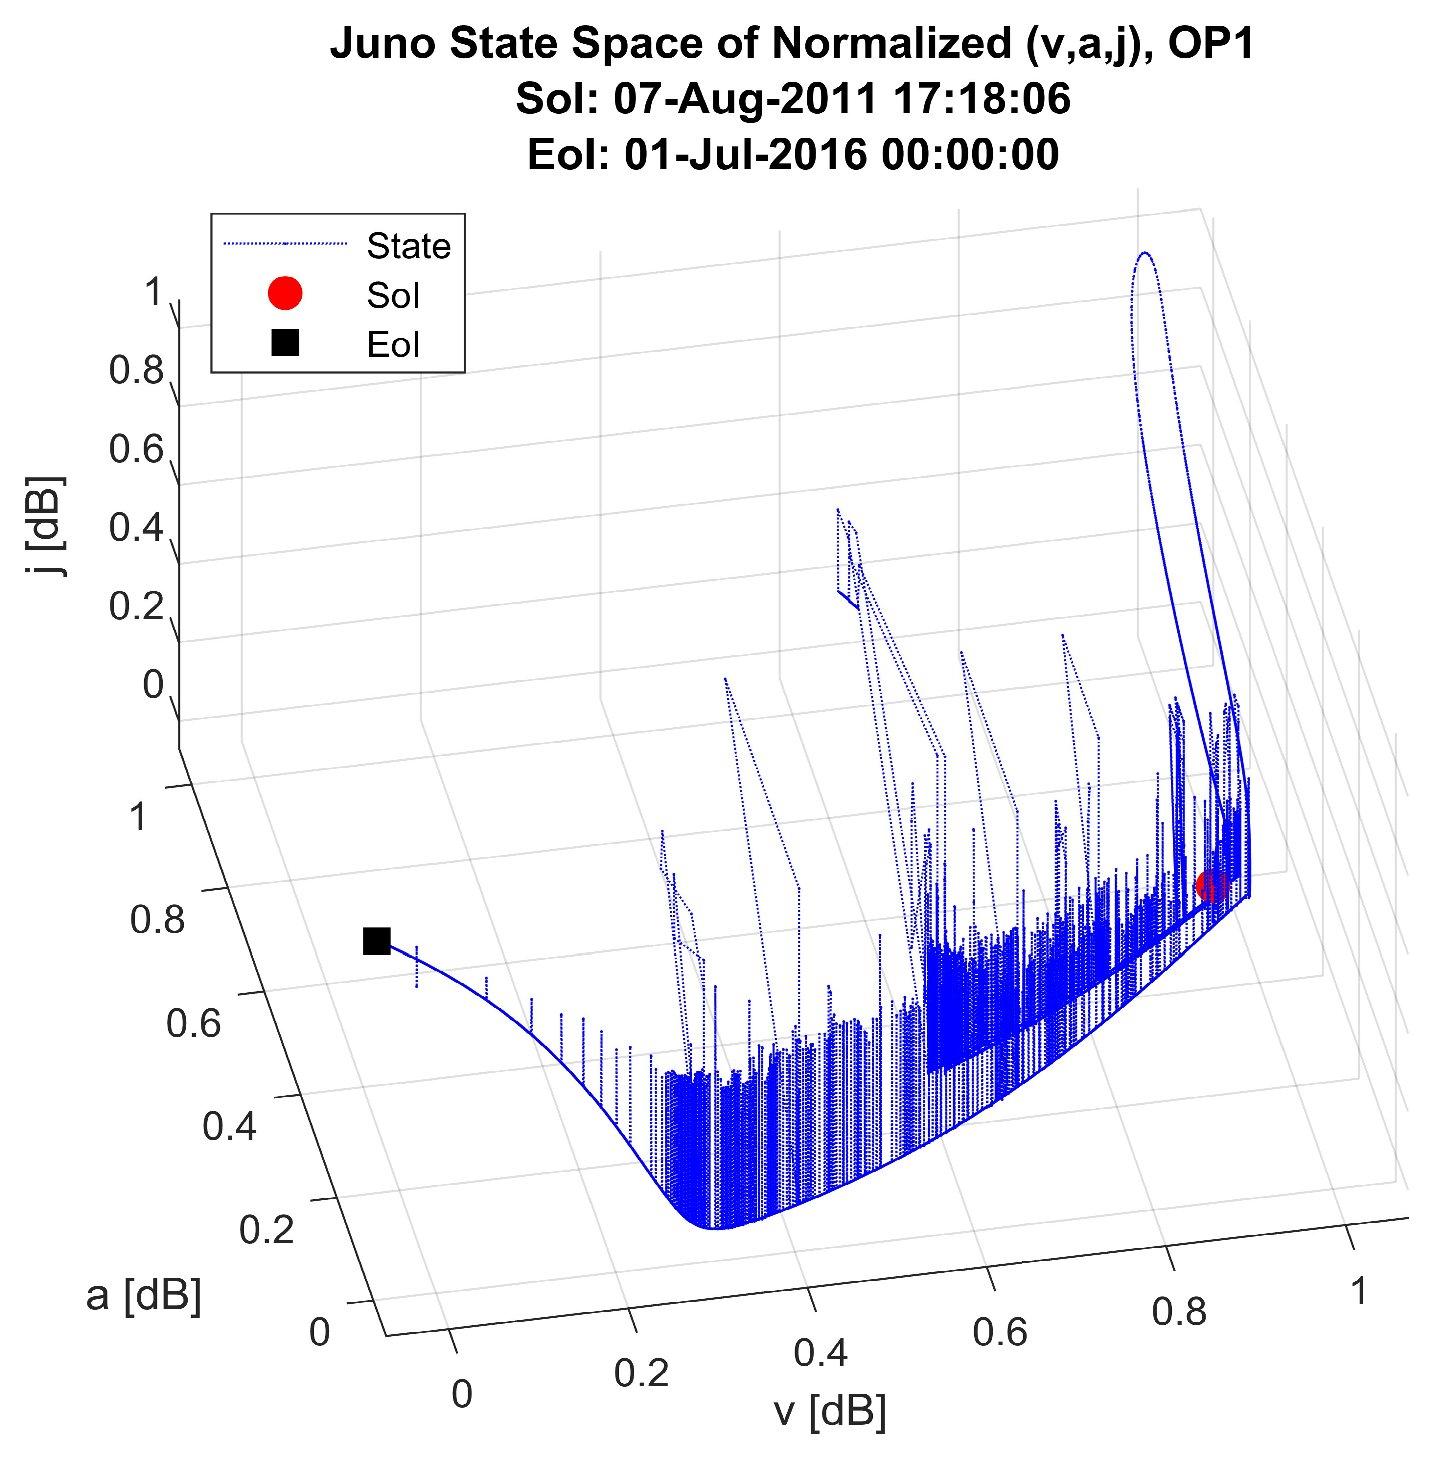
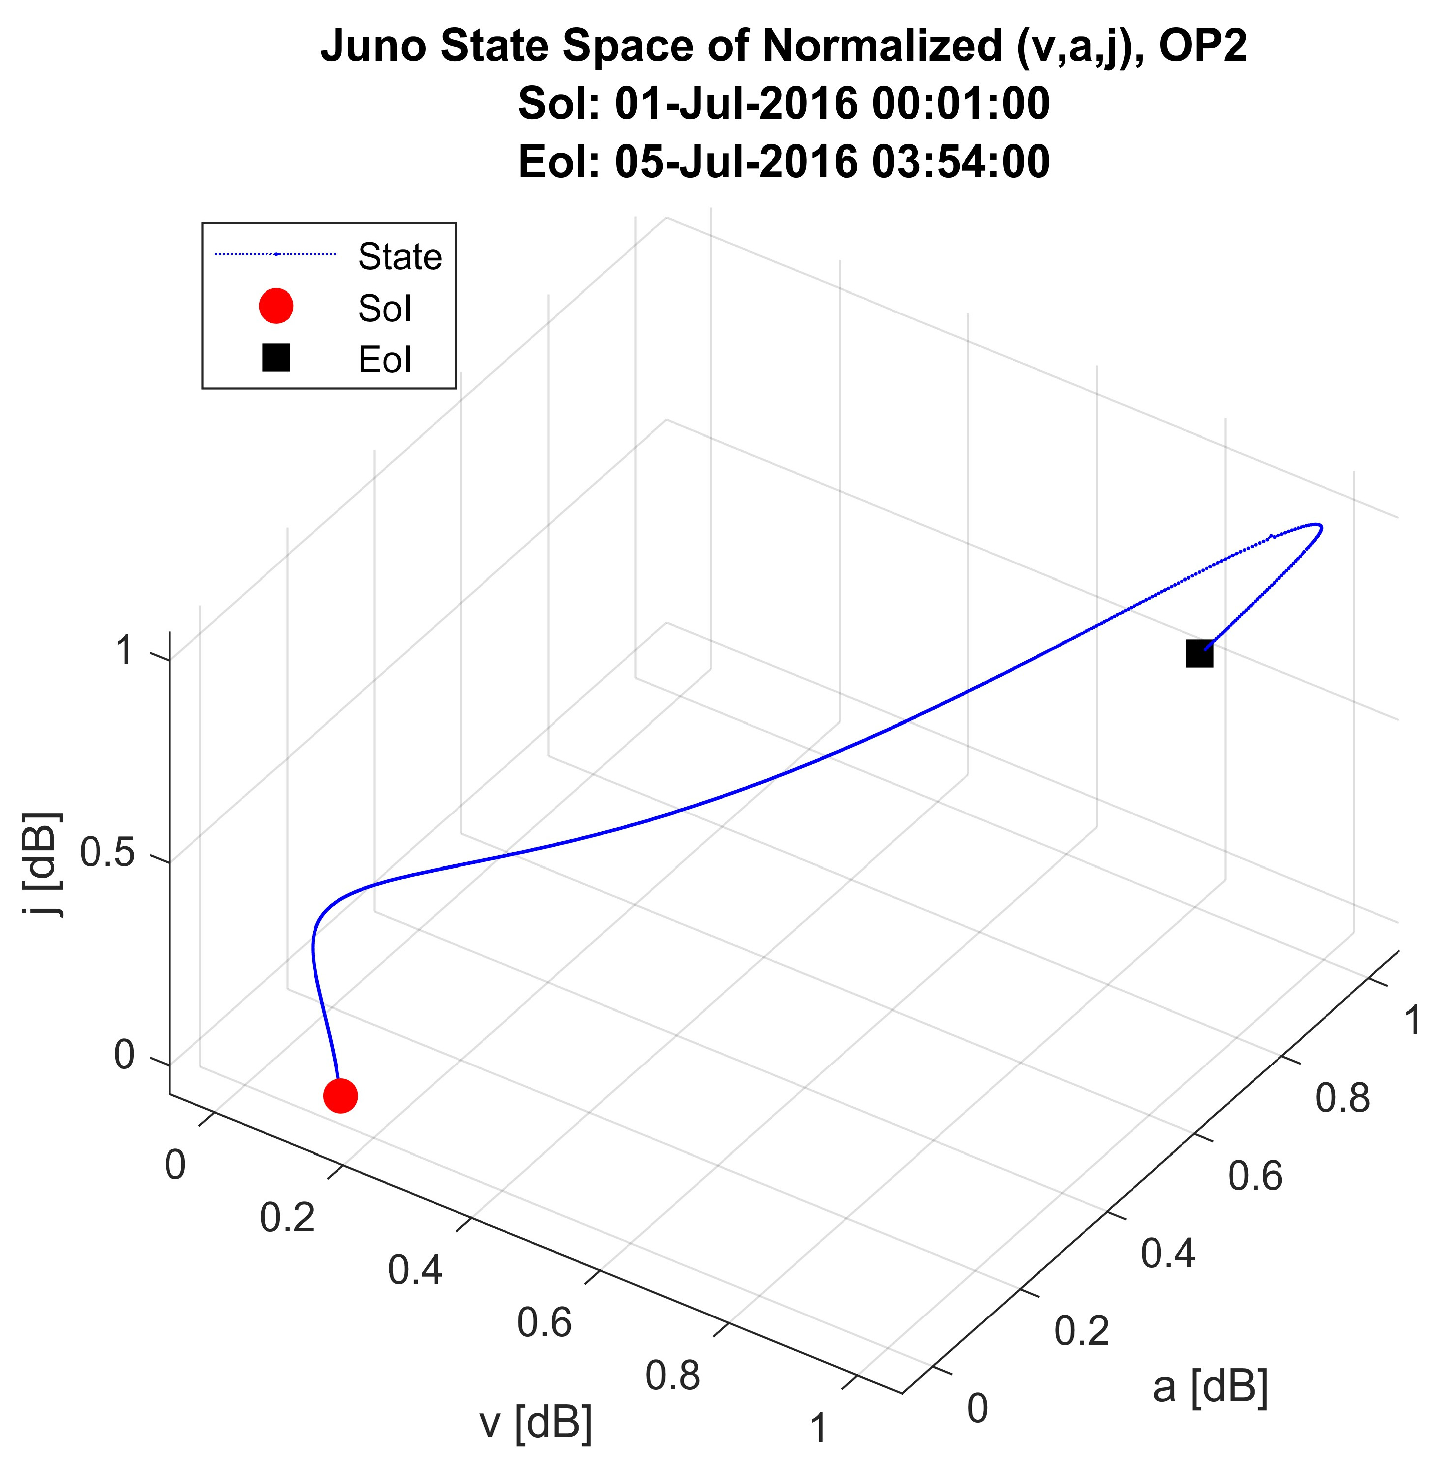
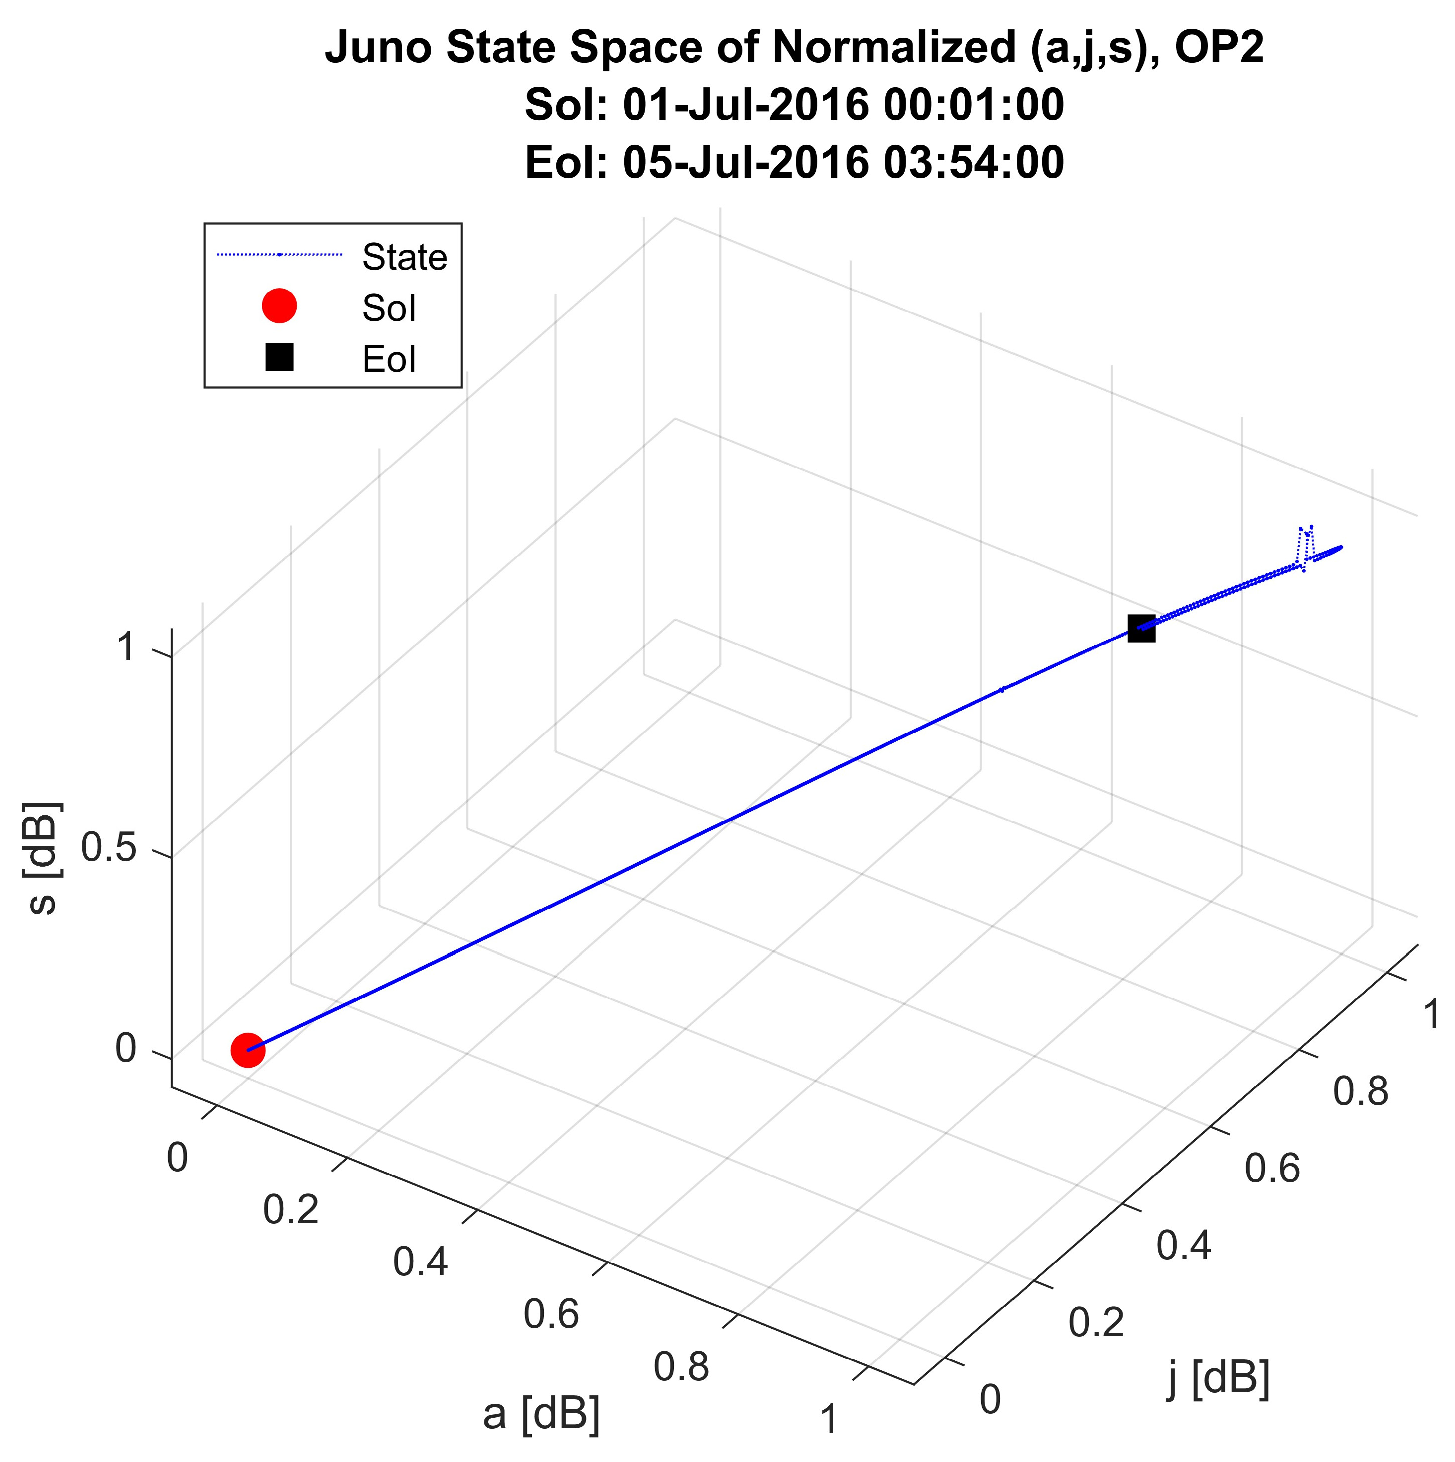
It should be mentioned that these events are closed in time to the well-known maneuvers shared by the project Juno. Modifications to the trajectory were sensed in a larger time difference than the propagation time of the communication radio signal between the Earth and Juno. Even the time difference between the local time on Juno or Earth, or in the barycenter of the solar system, is smaller than the time differences between the maneuvers mentioned by NASA and the EEs detected in this research work. Figure 15, Figure 16, Figure 17, Figure 18, Figure 19 and Figure 20 show the (v, a, j) and (a, j, s) normalized space state of Juno in the three different operation phases. As shown in Figure 17, jerk, which is the derivative of acceleration, enables and represents variations in body accelerations without considering sensor orientation. The following graph (Figure 18) displays the Juno state space of the normalized acceleration, jerk and snap (a, j, s) during Operation Phase 2. It depicts the average jerk length, which refers to the distance covered by the jerk within a certain time interval.
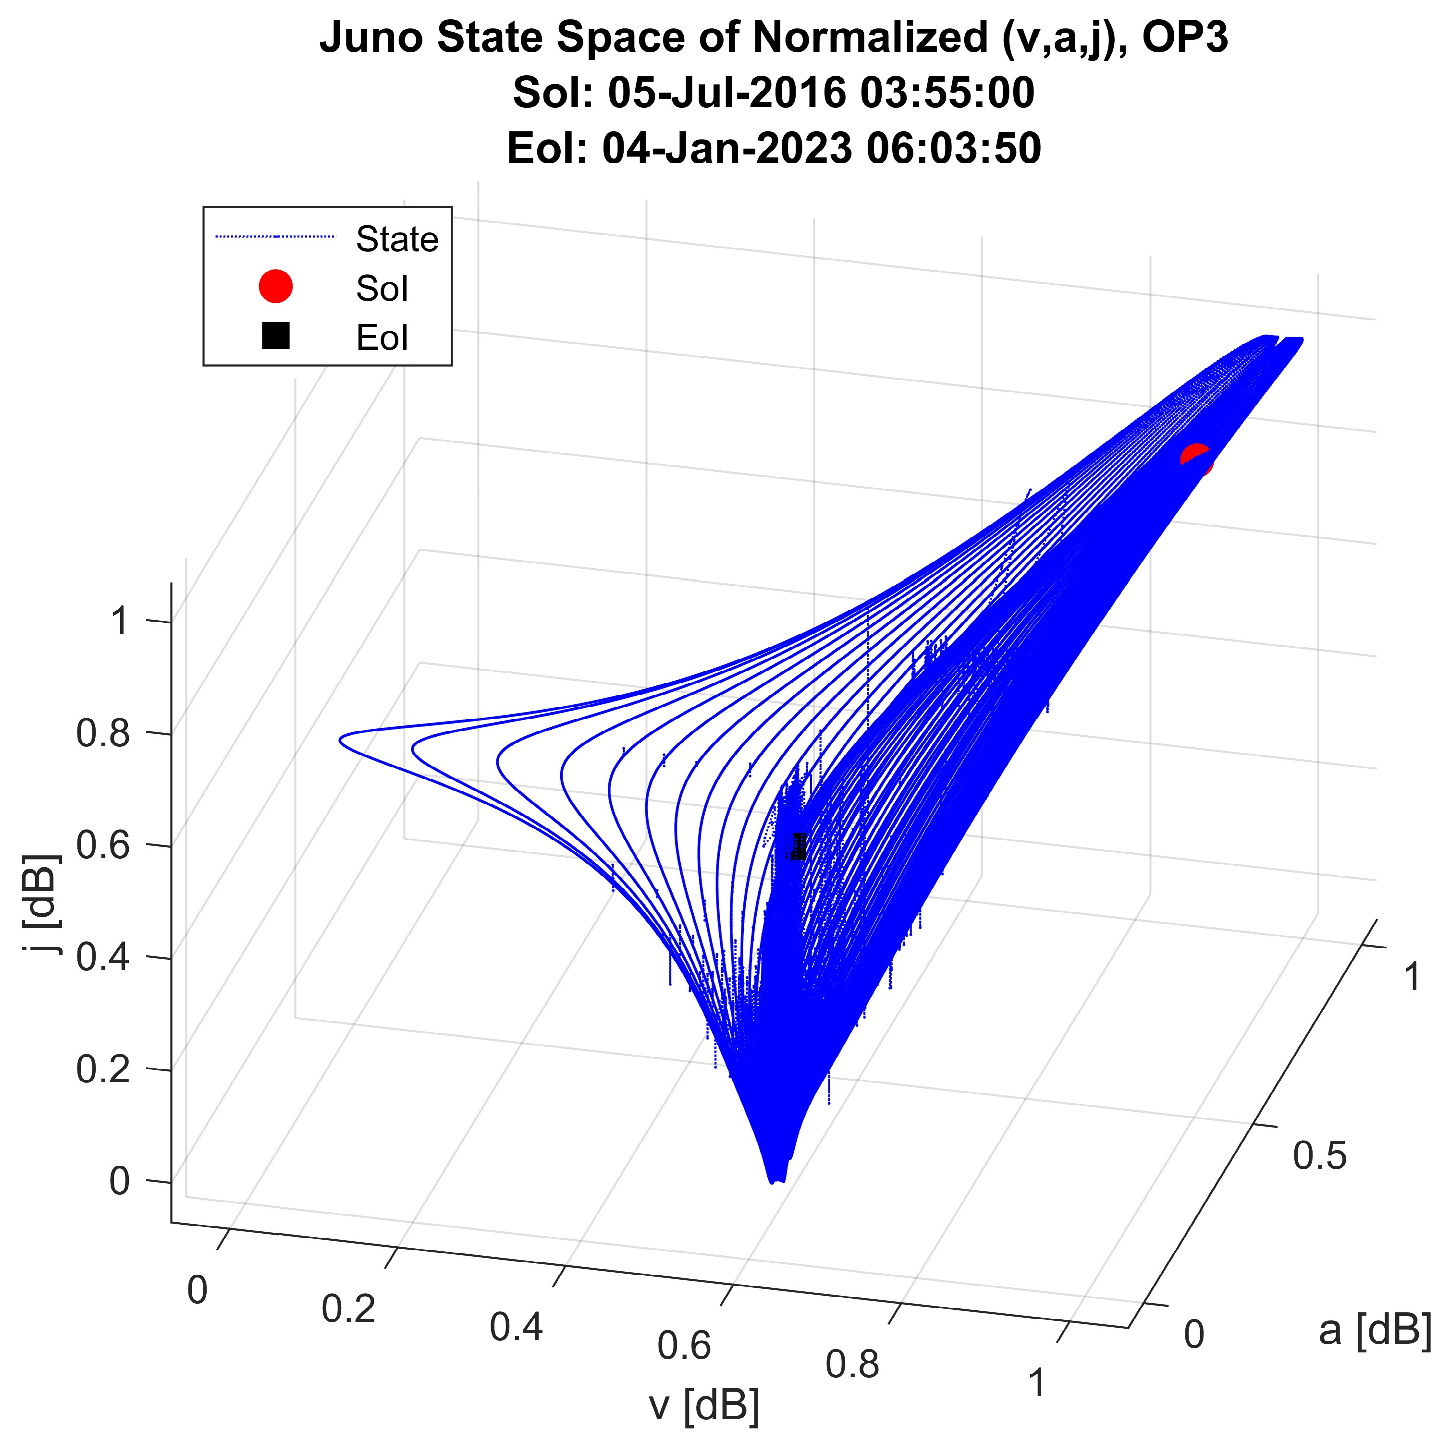
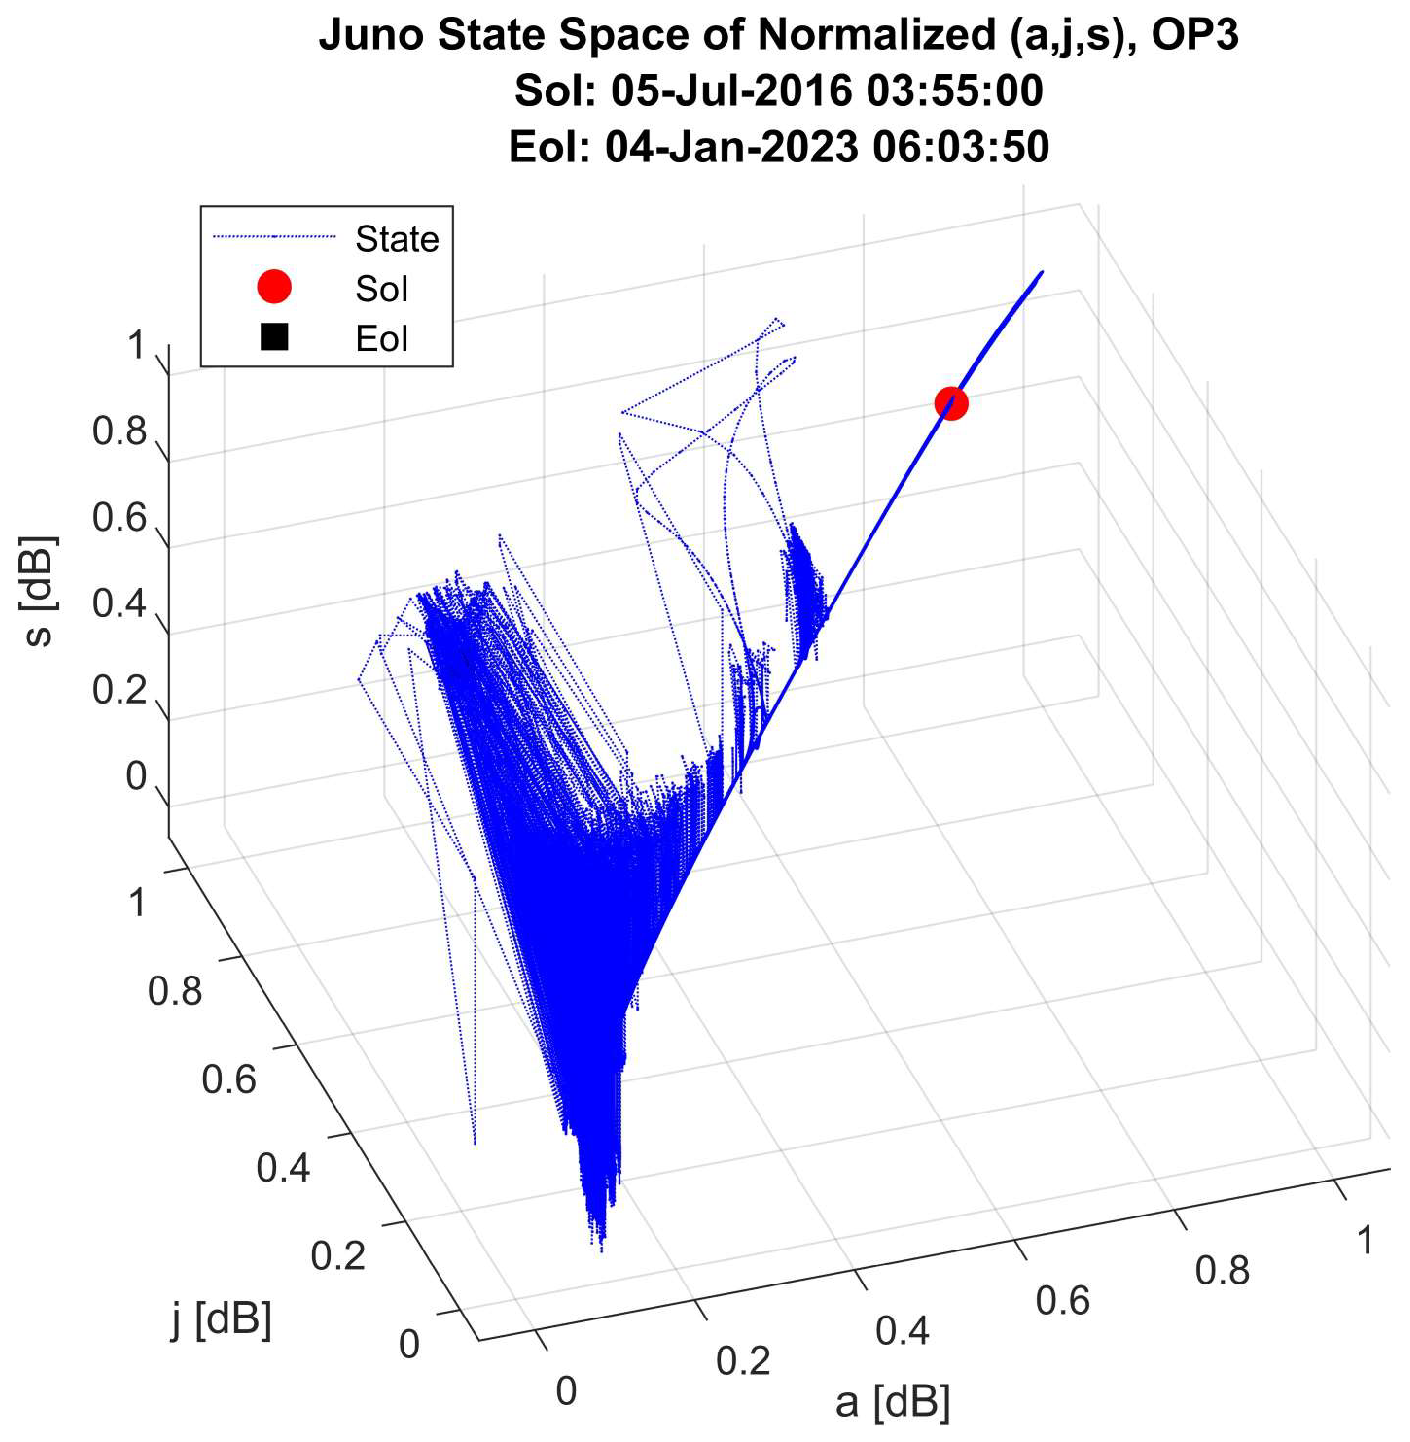
Figure 19 shows that in the state space v ,   a ,   j , Juno executes a chaotic movement in the actual operation phase (OP3). This phenomenon is not observable in the state space (a, j, s) in Figure 20. A possible reason for the chaotic movement of Juno is the magnetic sensor on just one of the propellers, providing no precise balance around the rotation axis. This may alleviate the problems caused by sensor distortion. The jerk and snap flow are utilized to identify EEs in the trajectory analysis, and the findings show that both methods are adaptable to interplanetary data analysis. The jerk and snap are used by means of unsupervised clustering approaches to improve the learning significantly and, therefore, the comprehension of notions about the outer space trajectory.
Key elements in Figure 20: Status structures (y-axis): This refers to the normalized measurements of Juno’s motion, likely including acceleration (a), jerk (j), and snap (s). These values range from −1 to 1. Time (x-axis): The x-axis displays time in hours. Operation phases (OPs): The data are presented for three different operation phases, potentially representing various engine thrust configurations or flight modes for Juno.
The first, second, third, and fourth derivatives of the position are used as status vector U ( t ) in time with a resolution of one minute, t = 1 , , N :
U ¯ t = r t , r ¯ t , r ¯ t , r ¯ t , r ¯ t = r ¯ t , v ¯ t , a ¯ t , j ¯ t , s ¯ t .
By normalization of the components in the corresponding dimension, we obtain the normalized status vector U ^ t :
U ^ t = [ r ¯ t / r ¯ , v ¯ t / v ¯ , a ¯ t / a ¯ , j ¯ t / j ¯ , s ¯ t / s ¯ ] .
U ^ t = [ r t ^ , v t ^ , a t ^ , j t ^ , s t ^ ] .
where a ¯ represents the Euclidean norm of the vector a ¯ .

6.3. Cauterization Analysis and Discussion

This section presents the acquired experimental findings. To gain deeper insights into the data, we employed two algorithms: density-based spatial clustering of applications with noise (DBSCAN) and ordering points to identify the clustering structure (OPTICS) to extract clusters of varying data densities. Both algorithms can significantly enhance the efficiency and accuracy of data analysis in space missions, leading to new insights. The dependence in time of the normalized status vector is shown in Figure 21, the figure shows the dependence in time of the state space of Juno (Juno’s position and motion over time) for three operation phases (OPs): OP1 (top), OP2 (middle), and OP3 (bottom). The y-axis represents the “Status Structures”, which likely refers to the normalized values of the acceleration, jerk, and snap (a.j.s). The x-axis shows the time in hours. The graph shows how the normalized acceleration, jerk and snap (a.j.s) of Juno change over time for the three different operation phases. The x-axis shows the time in hours; we have 900 rows (5x vectors/minute x 60 min).
Clustering is a fundamental methodology that has witnessed meteoric expansion in recent years within the realm of machine learning algorithms. DBSCAN is a popular clustering algorithm used in predictive analytics that identifies dense regions in a dataset by grouping data points that are in proximity to one another according to a specified distance metric [40]. DBSCAN and OPTICS are both density-based clustering algorithms used in unsupervised machine learning. DBSCAN starts by selecting a random point and identifying all the elements within a certain radius (eps) from that point. These elements are then classified as either “core”, “border” or “noise” points based on their distance from other elements. Core points are those that have a minimum number of neighboring elements (minPts) within an e p s radius, while border points are those that are within eps radius of core points but do not have the required number of neighbouring points. The algorithm then groups the core points and their border points into clusters, and any remaining elements are classified as noise.
DBSCAN does have the capability to locate clusters of varying sizes and forms, and it can also identify noise in the data [41]. The DBSCAN algorithm should be employed to reveal links and patterns in data that are challenging to identify manually yet may be significant and beneficial for discerning patterns and forecasting trends. These linkages and structures may be pertinent and beneficial since they can aid in predicting trends [42].
It creates a single cluster out of data points that have been “densely packed”. It does this by analyzing the localized density of the data elements in the vast datasets to find any clusters that may exist. The fact that DBSCAN clustering can withstand the presence of outliers is the most fascinating aspect of this method. In contrast to K-means, which requires us to define the number of centroids in advance, this method does not demand that we provide any information on the number of clusters in advance. Epsilon and minPoints are the only two parameters that DBSCAN requests from its users. Epsilon represents the radius of the region that must be created around each data point to evaluate its density, while minPoints specifies the minimum number of data points that must fall within this region for the point to be identified as a core point.
OPTICS is an extension of DBSCAN that aims to overcome some of its limitations. OPTICS also identifies core points, border points, and noise points, but it does not require the e p s parameter to be set in advance. Instead, it uses a reachability distance measure to determine the density of points in the dataset. The reachability distance is the minimum distance required to reach a point from a core point. OPTICS creates a hierarchical cluster ordering based on the reachability distances, allowing the algorithm to identify clusters of varying densities and shapes. One advantage of DBSCAN is that it is relatively fast and efficient for small to medium-sized datasets with well-defined clusters. It is also easy to implement and does not require setting many parameters. However, it can struggle with datasets that have clusters of varying densities, shapes or sizes. OPTICS, on the other hand, can handle datasets with varying densities and shapes more effectively than DBSCAN. It also provides a hierarchical clustering ordering that can be useful for data exploration and visualization. However, OPTICS can be more computationally expensive than DBSCAN and may require more parameter tuning.
The imagery provided in Figure 22 expresses the properties of the hourly status vectors in OP3, downsampled by 20. It shows the dependence of the number of DBSCAN clusters on the normalized radius of DBSCAN. Downsampling refers to reducing the number of data points in a dataset. In this case, the hourly status vectors in OP3 have been downsampled by a factor of 20. This means that only one data point out of every twenty is included in the analysis.
The normalized radius refers to the epsilon (ε) value used in the DBSCAN algorithm, but scaled to a range between 0 and 1. This makes it easier to compare the results across different datasets or experiments.
Dependence of the number of clusters on the radius: The graph shows how the number of clusters identified by DBSCAN changes as the normalized radius (ε) increases. With a smaller ε (represented by a lower value on the x-axis), the data points must be very close together to be considered in the same cluster. This typically leads to a larger number of smaller clusters. As ε increases (higher values on the x-axis), more distant points can be included in a cluster, potentially resulting in fewer but larger clusters. As we can see from the imagery, the x-axis represents the normalized radius, which controls how tightly or loosely clusters are formed. The y-axis represents the number of clusters identified by DBSCAN. As the normalized radius increases, the clusters become more relaxed and fewer, larger clusters are formed. This is because more points are considered neighbors, leading to larger cluster mergers. Conversely, with a smaller normalized radius, only very close points are considered neighbors, resulting in more numerous, smaller clusters. The work point in the image refers to a specific operating condition or state of interest in OP3. The location of the work point on the curve indicates the number of clusters obtained for that specific operating condition using a chosen normalized radius.
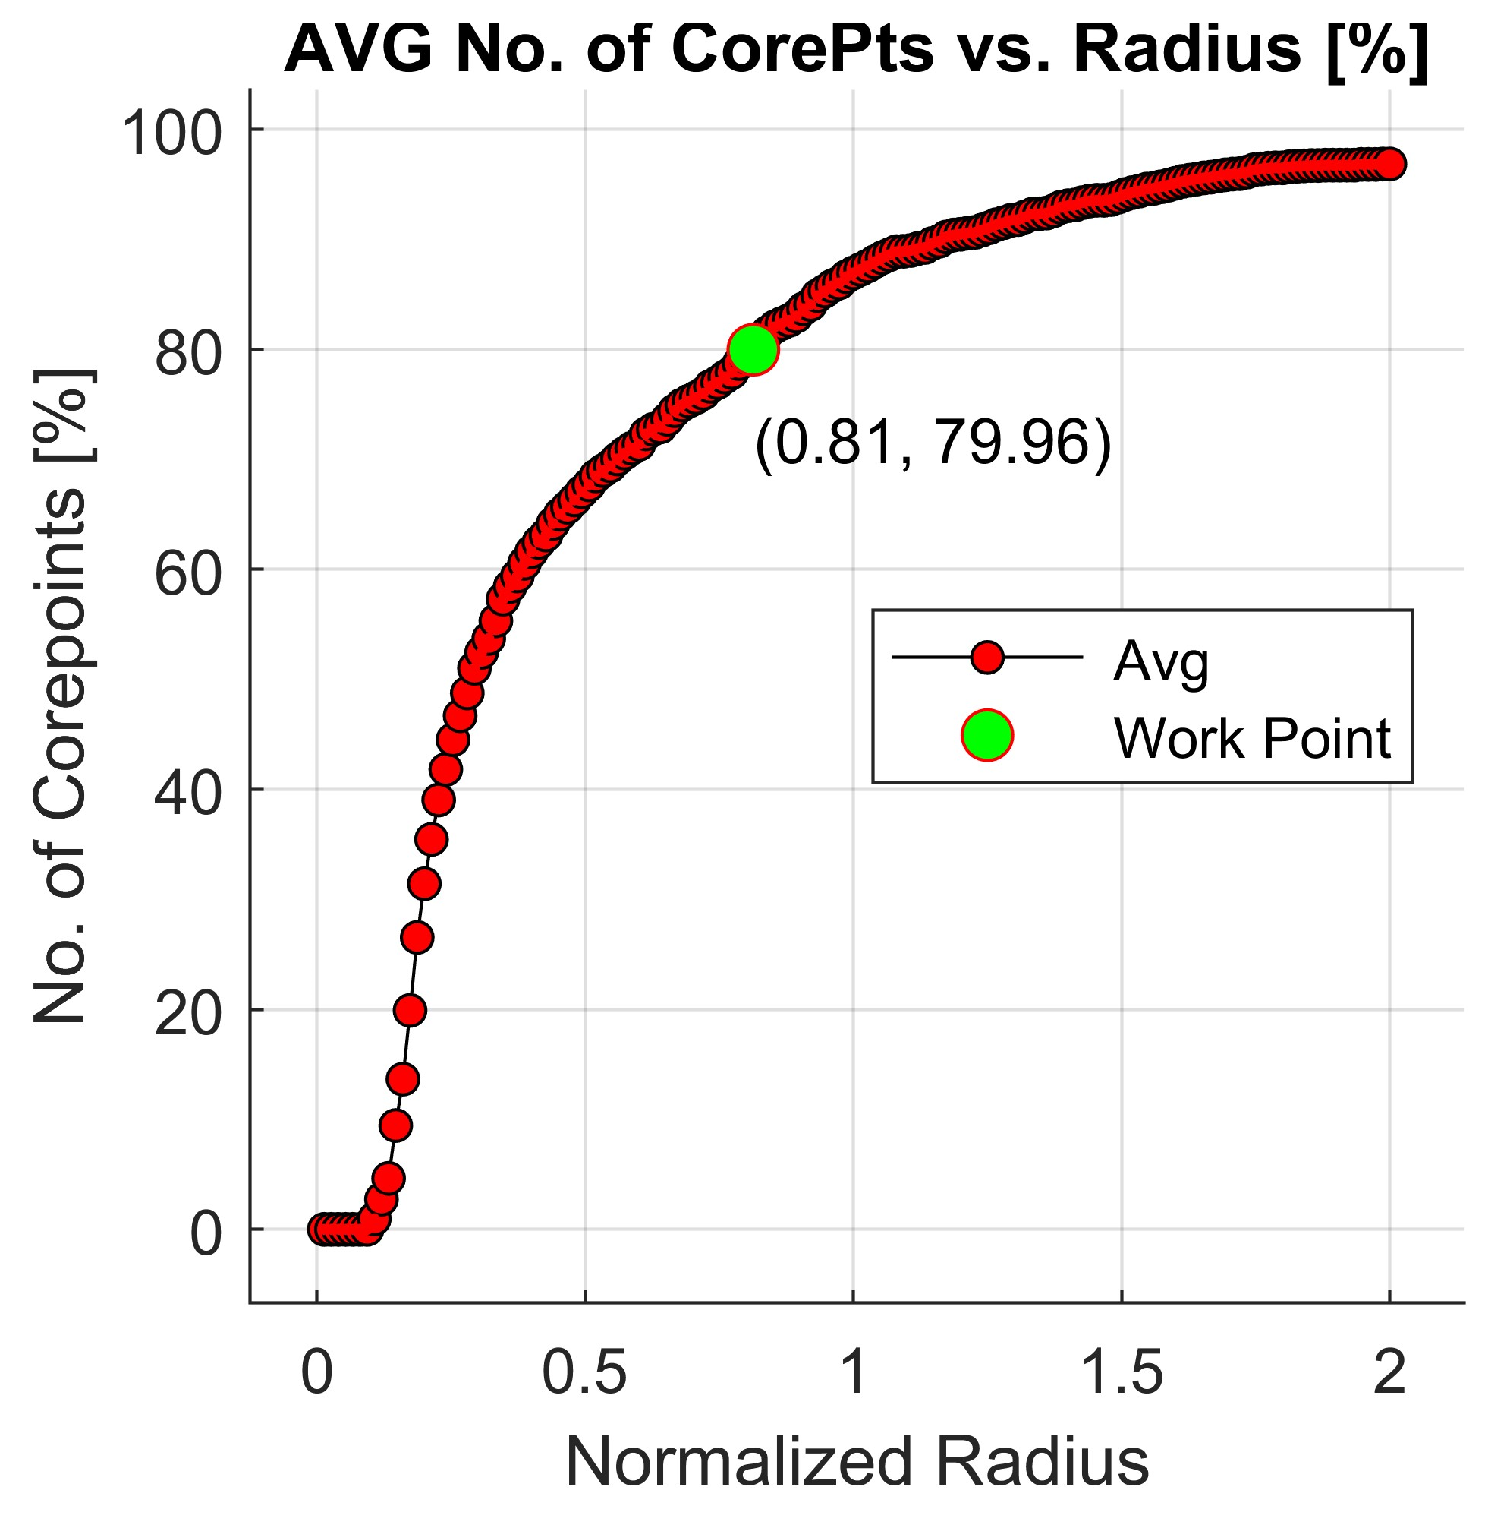
Figure 23 depicts the relationship between the normalized radius and the mean number of DBSCAN core points in a dataset. The normalized radius is obtained by dividing Eps by the characteristic distance scale of the data. This allows for comparing clustering results across datasets with different units or scales. As the normalized radius increases, the clusters become more relaxed and fewer, larger clusters are formed. This is because more data points are considered neighbors of a given point, potentially causing smaller, denser clusters to merge into larger ones. Consequently, the average number of core points generally decreases. Conversely, with a smaller normalized radius, only very close points are considered neighbors. This can lead to the separation of data points into more numerous, smaller clusters, potentially increasing the number of core points (since more data points might be central to smaller clusters). This behavior aligns with the expected characteristics of DBSCAN clustering.
A large normalized radius signifies a larger Eps value, which means more data points are considered neighbors of a given point. DBSCAN merges points and clusters that are within the Eps distance, reducing the overall number of clusters and potentially reducing the number of core points (fewer central points in larger clusters).
A small normalized radius signifies a smaller Eps value. Only very close neighbors are considered. This can lead to the separation of data points into more numerous, smaller clusters, potentially increasing the number of core points (more data points might be central to smaller clusters). The work point in the image likely refers to a specific operating condition or state of interest. The location of the work point on the curve indicates the average number of core points obtained for that specific condition using a chosen normalized radius. The information about the hourly status vectors in OP3, downsampled by 20: the DBSCAN cluster elements are provided in Figure 24. The image depicts a graph showing the results of applying the DBSCAN clustering algorithm to the hourly status vectors in OP3, after downsampling the data by a factor of 20.
This axis represents the value of the normalized radius used in the DBSCAN algorithm. As discussed earlier, the normalized radius is obtained by dividing the Eps parameter (neighborhood radius) by a characteristic distance scale of the data. It allows for comparing the clustering results across datasets with different units or scales. The y-axis shows the number of clusters identified by DBSCAN for different values of the normalized radius. The graph typically shows a curve that starts high on the left and decreases as the normalized radius increases on the x-axis. This is because, with a larger normalized radius (larger Eps), more data points are considered neighbors, leading to the merging of smaller clusters into larger ones, resulting in fewer overall clusters. Conversely, a smaller normalized radius (smaller Eps) creates stricter neighborhood criteria, causing data points to be separated into more numerous, smaller clusters. The hourly status vectors in OP3 likely represent a set of numerical values that capture the state of the system at each hour. By applying DBSCAN and analyzing how the number of clusters varies with the normalized radius, we can gain insights into the inherent groupings or patterns within the status vectors.
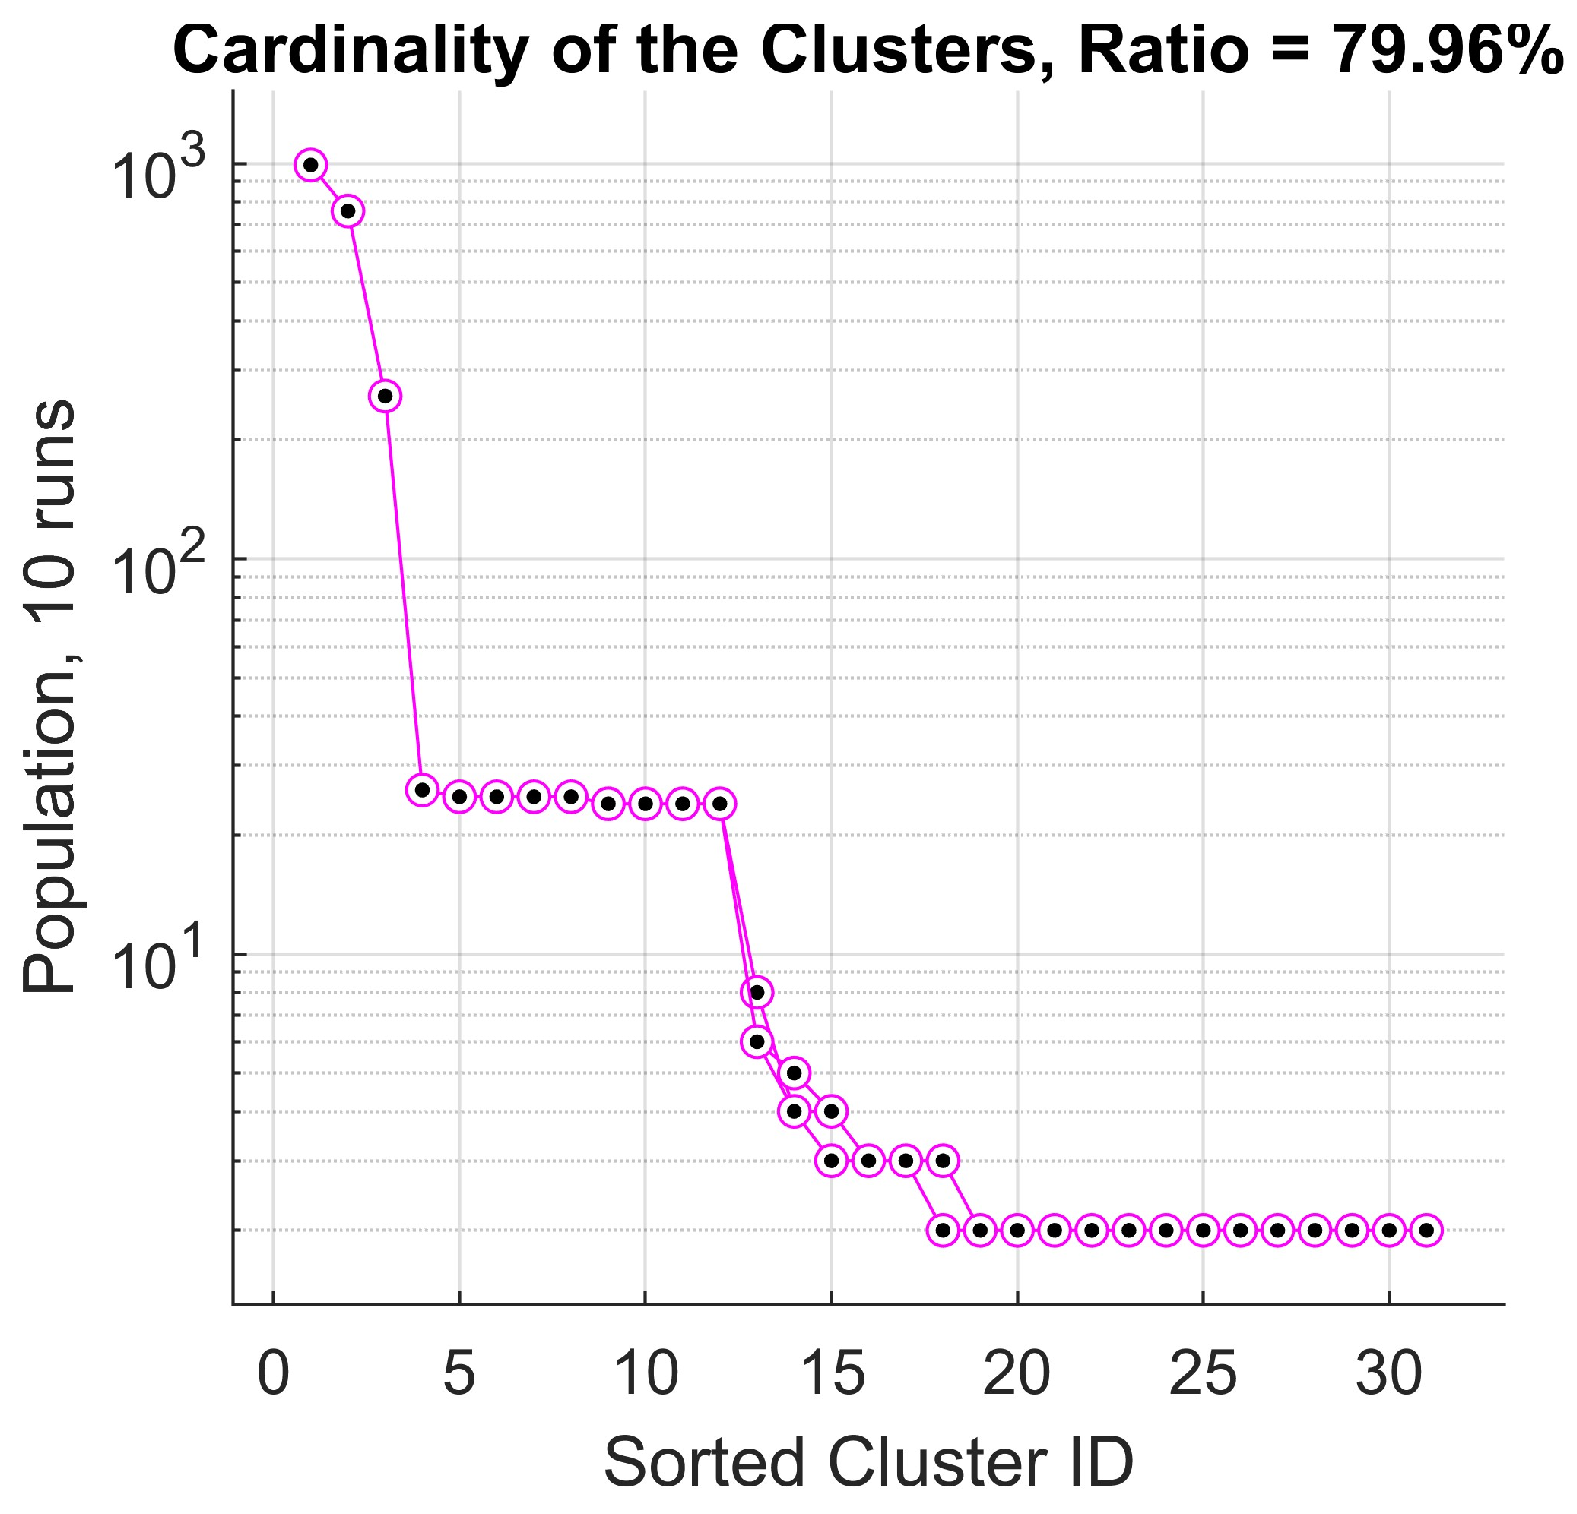
The imagery in Figure 25 depicts a graph that shows the distribution of the number of clusters (cardinality) identified by the DBSCAN algorithm across 100 runs. The graph visualizes the variability in the number of clusters obtained by DBSCAN across multiple runs. This can be due to several factors.
Sensitivity to initialization order: DBSCAN can be sensitive to the order in which data points are processed, especially for data on the borders of clusters. Running the algorithm multiple times with different starting points can sometimes lead to slightly different clusterings.
Parameter sensitivity: The choice of the normalized radius (Eps) can significantly impact the number of clusters. The graph might show a spread of cluster cardinalities if the chosen radius falls in a sensitive region of the curve (where small changes in the radius lead to large changes in the cluster count).
Stochasticity: If the DBSCAN implementation uses any random elements (e.g., random tie-breaking rules), it can introduce some level of randomness into the clustering process, potentially leading to variations across runs. The ideal scenario would be a tight cluster around a specific cardinality value, indicating consistent clustering across all the runs. The interpretation of the variability depends on the specific application and the desired level of consistency in the clustering results. By analyzing the distribution of cluster cardinalities across multiple runs, we can gain insights into the sensitivity of the clustering process and potentially improve the reliability of the results.
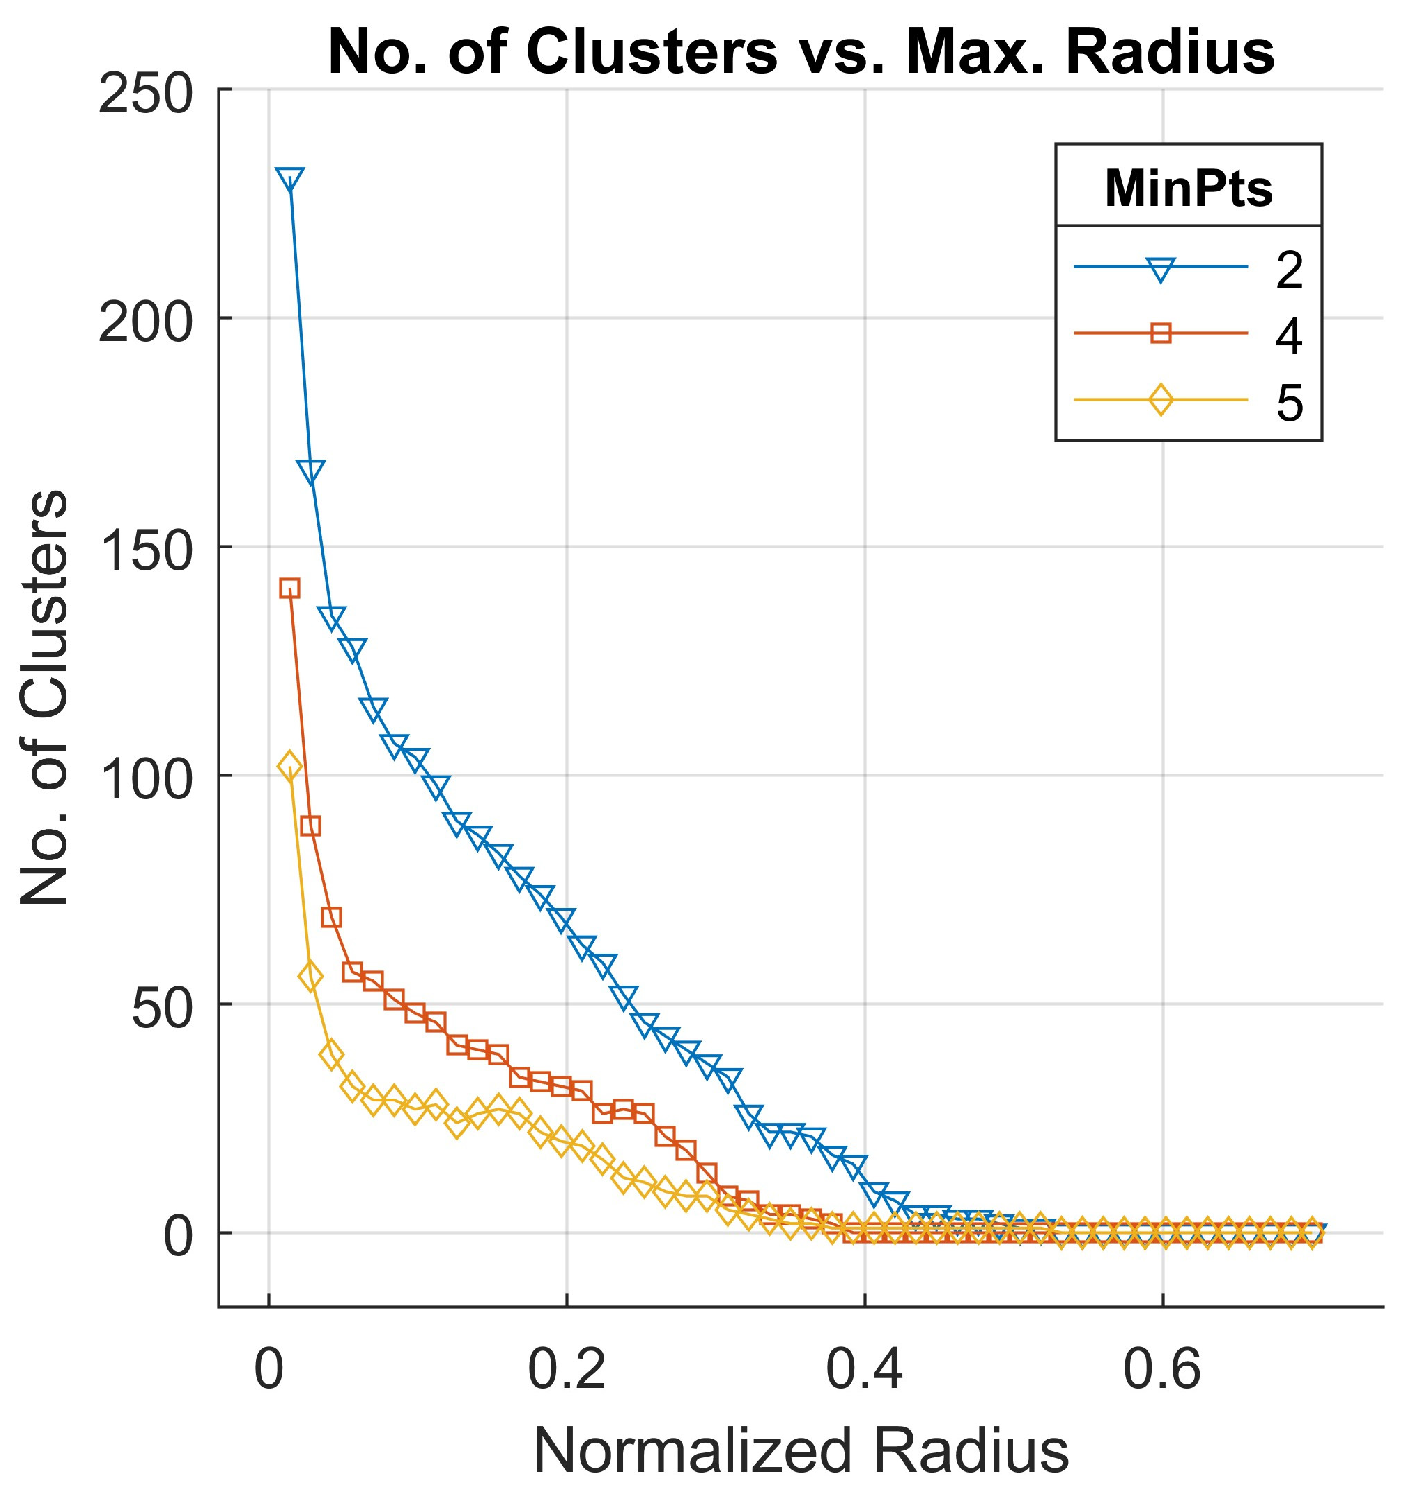
It can be noticed in Figure 26 that the dependence of the number of clusters on the maximum radius parameter for the OPTICS algorithm applied to the OP3 data was downsampled by 20. OPTICS is a clustering algorithm that can identify clusters of varying densities in data. Unlike DBSCAN (which we discussed earlier), OPTICS does not require pre-definition of the number of clusters or a minimum number of points in a cluster (MinPts).
It focuses on identifying points that are density-reachable from each other, and then clusters are formed based on these reachability relationships. The graph shows a curve that starts high on the left and decreases as the maximum radius increases on the x-axis. With a larger maximum radius (Eps), more data points are considered reachable from a given point, potentially leading to the merging of smaller, denser clusters into larger ones, resulting in fewer overall clusters. Conversely, a smaller maximum radius creates stricter reachability criteria, causing data points to be separated into more numerous, smaller clusters.
By applying OPTICS and analyzing how the number of clusters varies with the maximum radius, you can gain insights into the inherent groupings or patterns within the status vectors. Clusters might represent different operational modes of OP3. The radius value that yields a stable number of clusters (e.g., neither too high nor too low) could indicate the range corresponding to normal operating conditions. The way clusters merge or separate with varying radius values can provide clues about how the different status vector elements interact and influence each other. OPTICS can handle data with varying densities more effectively than DBSCAN, which might struggle with clusters of different shapes and sizes. It does not require pre-definition of the number of clusters or MinPts, making it more flexible for exploratory data analysis. By analyzing how the OPTICS cluster structure changes with the maximum radius, you can gain insights into the system’s behavior and potentially identify normal operating ranges, anomalies, or underlying relationships within the data. The Juno orbit events were clusterized with unsupervised machine learning DBSCAN and OPTICS algorithms. This mechanism separated outliers from the core part to conform to the accuracy values included in Table 5.
The five-dimensional status vector is U t . The minimum value of the EE identification accuracy was detected in the OP3 as being 97.4% and 98.9% for the DBSCAN and OPTICS, respectively. The reason for the lowest accuracy in the OP3 is the high number of perijoves executed by Juno around Jupiter. We measured that the OPTICS clusterization mechanism needed a 10.8 times longer execution time than the DBSCAN, showing the significantly higher expense of the unsupervised calculations.

7. Conclusions

The purpose of this research is to provide a framework for the analysis of the Juno spacecraft’s trajectory attributes. Within this framework, the attributes’ temporal and spatial changes are described and evaluated as trajectories. In this model, the trajectory coordinate characteristics, together with the upper order derivatives (velocity, acceleration, jerk, snap) until order four, help determine the human-controlled modification of the Juno spacecraft. It is proved that usage of the Hilbert transform on the instantaneous average acceleration, jerk, and snap makes visible the time–frequency dependence of the object moving in 3D and being influenced by gravity and other artificial activated forces. The Hilbert spectrum of this non-linear and non-stationary 3D movement process helps to detect extreme-event-type situations of the Juno spacecraft. It was found that the Juno satellite executes chaotic movement in the state space of velocity, acceleration and jerk.
When applied to spacecraft trajectory, unsupervised machine learning offers a potent tool for research and improvement and improved skills to choose from various possibilities for trajectories to fulfil strategic objectives. The use of visual analytics paves the way for the successful completion of mission design procedures and gives access to hitherto unexplored possibilities. Although this framework was created by analyzing the trajectory of moving objects over time, it applies to the study of objects with additional qualities. The paradigm developed is helpful in terms of characteristic changes that may be regarded as time series data. In remote sensing analysis, the idea of trajectories has been employed; however, such trajectories have not been examined using approaches specific to moving object trajectories. Because of this, extending this concept to remote sensing trajectories might also be intriguing. In conclusion, the presented paradigm has the potential to serve as a springboard for using attribute trajectory examination in several other domains.
In conclusion, our findings demonstrate the superiority of the OPTICS algorithm in outlier detection compared to DBSCAN across all the investigated orbital phases (OP1, OP2, OP3). OPTICS achieved accuracy levels of 99.3%, 99.1%, and 98.9% for OP1, OP2, and OP3, respectively, while DBSCAN obtained 98.8%, 98.2%, and 97.4% for the corresponding phases. This suggests that OPTICS may be a more dependable method for identifying outliers within elliptical orbit data analysis.

8. Limitations and Future Work

In order to identify orbital deviations, we used high-resolution velocity and acceleration data to evaluate Juno’s trajectory using classical Newtonian physics. Although this method offers a strong foundation for comprehending the velocity of the spacecraft, relativistic effects—which may cause minute but detectable variations in trajectory calculations—are not specifically taken into consideration.
General relativity foresees that a spacecraft traveling in the gravitational field of a large body, like Jupiter, is subject to time dilation and gravitational redshift. Moreover, the spacetime curvature around Jupiter also moderately changes the path more than is anticipated in Newtonian mechanics. Such relativistic effects are mainly applicable in long-duration missions with high-precision tracking, since tiny perturbations can build up over time. With the time resolution of our dataset (intervals of one minute) and the interest in finding changes in velocity and acceleration, skipping relativistic corrections can cause small errors in our findings. Nevertheless, it has been demonstrated in earlier research that for spacecraft orbiting Jupiter in elliptical orbits, the general relativistic effect on trajectory prediction is generally in the order of millimeters per second in velocity and several meters in position over extended periods of time [43]. Though small in comparison to the size of Juno’s orbital fluctuations, these effects might be considerable in high-precision anomaly detection.
The Hilbert transform is commonly used to analyze instantaneous frequency fluctuations in stationary and linear signals. Juno’s orbital trajectory is non-stationary and non-linear owing to the complicated interactions with Jupiter’s gravitational field, magnetosphere, and solar radiation pressure. These dynamic forces cause time-dependent fluctuations that Hilbert-based spectrum analysis may not capture.
The Hilbert transform may introduce spectrum distortions when processing non-stationary data. Juno’s rapid motion shifts may distort the retrieved frequency components. The Hilbert transform accentuates localized fluctuations, but it does not account for the spacecraft’s trajectory non-linearities, which may lead to misinterpretations of severe occurrences.
To address these problems, we used the Hilbert transform as an exploration tool rather than a diagnostic measure of trajectory abnormalities. We also cross-validated our results using wavelet transformations, which are superior for non-stationary data. The wavelet-based findings matched the Hilbert-based methodology, validating our event detection technique. However, adaptive time–frequency decomposition approaches like empirical mode decomposition (EMD) or variational mode decomposition (VMD) might improve spectrum analysis in complicated orbital dynamics.
Future research may include relativistic corrections in the study, either by applying post-processing modifications using the Schwarzschild metric approximation or by including relativistic equations of motion into the orbital modeling procedure. Moreover, juxtaposing the outcomes of classical and relativistic trajectory calculations may provide additional insights into the importance of these effects in spacecraft motion analysis.
Based on the findings of this research, a number of opportunities for future research are available to complement the analysis of Juno’s trajectory dynamics further. This work lays the foundation for future research on space mission trajectory analysis. Potential areas for further investigation include the following:
  • Adapting our methods for real-time trajectory analysis and anomaly detection during ongoing missions.
  • Integrating machine learning techniques to further enhance the prediction accuracy and pattern recognition in trajectory data.
  • Extending our approach to analyze and optimize multi-body trajectories for future complex mission designs.
In addition, exploring hybrid clustering approaches with OPTICS in combination with other anomaly detection frameworks—autoencoders or GANs—is expected to yield more robust class detection of unusual events without influencing the computational burden. Increasing the dataset to incorporate real-time telemetry data and benchmarking model performance against physics-based orbital simulations may also yield more insight into spacecraft dynamics.
Finally, the extrapolation of the methodology developed to other spacecraft missions, i.e., the Europa Clipper or future deep-space probes, can validate the usefulness of these techniques and set the stage for even more advances in planetary exploration. These future opportunities will enhance the ability to study complex orbital dynamics and optimize mission design techniques for interplanetary spaceflight.

Author Contributions

Validation, Z.M.; Formal analysis, A.A.; Investigation, A.A.; Writing—original draft, A.A.; Writing—review & editing, A.A.; Supervision, Z.G. All authors have read and agreed to the published version of the manuscript.

Funding

This research was supported by the QoS-HPC-IoT Laboratory and project TKP2021-NKTA of the University of Debrecen, Hungary. Project no. TKP2021-NKTA-34 has been implemented with support provided by the Ministry of Culture and Innovation of Hungary from the National Research, Development and Innovation Fund, financed under the TKP2021-NKTA funding scheme.

Data Availability Statement

Datasets will be provided upon request.

Acknowledgments

The authors would like to thank Boris Semenov from NASA’s Navigation and Ancillary Information Facility (NAIF), located at the Caltech/Jet Propulsion Laboratory (JPL), for the practical advice and for providing the validation data.

Conflicts of Interest

The authors declare no conflicts of interest.

References

  1. Yamaguchi, T.; Mimasu, Y.; Tsuda, Y.; Funase, R.; Sawada, H.; Mori, O.; Morimoto, M.Y.; Takeuchi, H.; Yoshikawa, M. Trajectory analysis of solar sail spacecraft considering the large uncertainty of solar radiation pressure. In Proceedings of the ISSFD21, Advances in the Astronautical Sciences, Toulouse, France, 28 September–2 October 2009; Volume 134, pp. 123–142. [Google Scholar]
  2. Elmer, J.; Jones, B.L.; Nagin, D.S. Using the Beta distribution in group-based trajectory models. BMC Med. Res. Methodol. 2018, 18, 152. [Google Scholar] [CrossRef] [PubMed]
  3. Föhn, M.; Galli, A.; Vorburger, A.; Tulej, M.; Lasi, D.; Riedo, A.; Fausch, R.; Althaus, M.; Brungger, S.; Fahrer, P.; et al. Description of the Mass Spectrometer for the Jupiter Icy Moons Explorer Mission. In Proceedings of the IEEE Aerospace Conference, Big Sky, MT, USA, 6–13 March 2021. [Google Scholar] [CrossRef]
  4. Matousek, S. The Juno new frontiers mission. Acta Astronaut. 2007, 61, 932–939. [Google Scholar] [CrossRef]
  5. Grammier, R.S. A look inside the Juno Mission to Jupiter. In Proceedings of the 2009 IEEE Aerospace Conference, Big Sky, MT, USA, 7–14 March 2009; pp. 1–10. [Google Scholar]
  6. Nybakken, R. The Juno mission to Jupiter—A pre-launch update. In Proceedings of the 2011 Aerospace Conference, Big Sky, MT, USA, 5–12 March 2011; IEEE: Piscataway, NJ, USA, 2011; pp. 1–8. [Google Scholar]
  7. Nybakken, R. The Juno mission to Jupiter launch campaign and early cruise report. In Proceedings of the 2012 IEEE Aerospace Conference, Big Sky, MT, USA, 3–10 March 2012; pp. 1–14. [Google Scholar]
  8. Lewis, J. Juno spacecraft operations lessons learned for early cruise mission phases. In Proceedings of the 2014 IEEE Aerospace Conference, Big Sky, MT, USA, 1–8 March 2014; pp. 1–20. [Google Scholar]
  9. Stephens, S.K. The Juno mission to Jupiter: Lessons from cruise and plans for orbital operations and science return. In Proceedings of the 2015 IEEE Aerospace Conference, Big Sky, MT, USA, 7–14 March 2015; pp. 1–20. [Google Scholar]
  10. Demyanov, V.V.; Yasyukevich, Y.V.; Klimenko, M.V.; Klimenko, V.V.; Sergeeva, M.A. The second-order derivative of GPS carrier phase as a promising means for ionospheric scintillation research. Pure Appl. Geophys. 2019, 176, 4555–4573. [Google Scholar] [CrossRef]
  11. Juuso, E.; Karioja, K.; Nissilä, J. Real order derivatives and spectral norms in fault detection. In Proceedings of the 5th International Conference on Maintenance, Condition Monitoring and Diagnostics, Oulu, Finland, 16–17 February 2021; Juuso, E., Galar, D., Eds.; Springer: Berlin/Heidelberg, Germany, 2023. MCMD 2021. pp. 105–116. [Google Scholar] [CrossRef]
  12. Presser, T.; Dasgupta, A.; Erwin, D.; Oberai, A. Diffusion models for generating ballistic spacecraft trajectories. arXiv 2024, arXiv:2405.11738. [Google Scholar]
  13. Yu, Z.; Chen, W.; Yu, W. Analytical trajectory prediction of high-eccentricity spacecraft transfer orbits considering J2 perturbation. Aerosp. Sci. Technol. 2024, 153, 109462. [Google Scholar] [CrossRef]
  14. Briden, J.; Johnson, B.; Linares, R.; Cauligi, A. Diffusion policies for generative modeling of spacecraft trajectories. arXiv 2025, arXiv:2501.00915. [Google Scholar]
  15. Acton, C.H.; Bachman, N.; Elson, L.S.; Semenov, B.; Wright, E.L. SPICE: A real example of data system reuse to reduce the costs of ground data systems development and mission operations. In Proceedings of the 2003 IEEE Aerospace Conference, Big Sky, MT, USA, 8–15 March 2003; IEEE: Piscataway, NJ, USA, 2003; pp. 1–9. [Google Scholar]
  16. Space Studies Board. Data Management and Computation—Volume I: Issues and Recommendations; National Academies Press: Washington, DC, USA, 1982. [Google Scholar] [CrossRef]
  17. Panuju, D.R.; Paull, D.J.; Griffin, A.L. Change detection techniques based on multispectral images for investigating land cover dynamics. Remote Sens. 2020, 12, 1781. [Google Scholar] [CrossRef]
  18. García, S.; Luengo, J.; Herrera, F. Data preparation basic models. In Data Preprocessing in Data Mining; Springer: Cham, Switzerland, 2015; pp. 39–57. [Google Scholar] [CrossRef]
  19. Thompson, P.F.; Abrahamson, M.; Ardalan, S.; Bordi, J.J. Reconstruction of Earth flyby by the Juno spacecraft. In Proceedings of the AAS/AIAA Space Flight Mechanics Meeting, Santa Fe, NM, USA, 26–30 January 2014; No. AAS 14-435. American Astronautical Society: Springfield, VA, USA, 2014. [Google Scholar]
  20. Kowalkowski, T.; Johannesen, J.; Lam, T. Launch period development for the Juno mission to Jupiter. In Proceedings of the AIAA/AAS Astrodynamics Specialist Conference and Exhibit, Honolulu, HI, USA, 18–21 August 2008; American Institute of Aeronautics and Astronautics (AIAA): Reston, VA, USA, 2008; p. 7369. [Google Scholar]
  21. Stephens, S.K. Juno at Jupiter: The mission and its path to unveiling secrets of the history of the solar system. In Proceedings of the 2018 IEEE Aerospace Conference, Big Sky, MT, USA, 3–10 March 2018; pp. 1–19. [Google Scholar] [CrossRef]
  22. Pavlak, T.A.; Frauenholz, R.B.; Helfrich, C.E.; Kangas, J.A.; Bordi, J.J. Maneuver design for the Juno mission: Inner cruise. In Proceedings of the AIAA/AAS Astrodynamics Specialist Conference, San Diego, CA, USA, 4–7 August 2014; p. 4149. [Google Scholar]
  23. Chang, X.H.; Cui, P.Y.; Cui, H.T. Research on autonomous navigation method of deep space cruise phase based on the Sun observation. Yuhang Xuebao/J. Astronaut. 2010, 31, 1017–1023. [Google Scholar]
  24. Pavlak, T.A.; Bhat, R.S.; Stumpf, P.W. Maneuver Operations During Juno’s Approach, Orbit Insertion, and Early Orbit Phase. In Proceedings of the 27th AAS/AIAA Space Flight Mechanics Meeting, AAS 17-422, San Antonio, TX, USA, 5–9 February 2017; Advances in the Astronautical Sciences (AAS) series. American Astronautical Society (AAS): Springfield, VA, USA, 2017; Volume 161. [Google Scholar]
  25. Janssen, M.A.; Oswald, J.E.; Brown, S.T.; Gulkis, S.; Levin, S.M.; Bolton, S.J.; Wang, C.C. MWR: Microwave radiometer for the Juno mission to Jupiter. Space Sci. Rev. 2017, 213, 139–185. [Google Scholar] [CrossRef]
  26. Lee, M.; Weidner, R.J. Juno mission simulation. In Proceedings of the 2008 IEEE Aerospace Conference 2008, Big Sky, MT, USA, 1–8 March 2008; pp. 1–9. [Google Scholar]
  27. Bordi, J.; Bryant, L. Conjunction Assessment Plans for the Juno Earth Flyby. NASA Technical Reports Server; 2013. Available online: https://ntrs.nasa.gov/citations/20150007245 (accessed on 22 January 2025).
  28. Dawson, S.; Stella, P.; McAlpine, W.; Smith, B. JUNO photovoltaic power at Jupiter. In Proceedings of the 10th International Energy Conversion Engineering Conference, Atlanta, GA, USA, 30 July–1 August 2012; p. 3833. [Google Scholar] [CrossRef]
  29. Bolton, S.J.; Lunine, J.; Stevenson, D.; Connerney, J.E.P.; Levin, S.; Owen, T.C.; Bagenal, F.; Gautier, D.; Ingersoll, A.P.; Orton, G.S.; et al. The Juno mission. Space Sci. Rev. 2017, 213, 5–37. [Google Scholar] [CrossRef]
  30. Soriano, M.; Finley, S.; Jongeling, A.; Fort, D.; Goodhart, C.; Rogstad, D.; Navarro, R. Spacecraft-to-Earth communications for Juno and Mars Science Laboratory critical events. In Proceedings of the 2012 IEEE Aerospace Conference, Big Sky, MT, USA, 3–10 March 2012; pp. 1–11. [Google Scholar] [CrossRef]
  31. Ardalan, S.; Bordi, J.; Bradley, N.; Farnocchia, D.; Takahashi, Y.; Thompson, P. Juno Orbit Determination Experience During First Year at Jupiter. NASA Technical Reports Server; 2017. Available online: https://ntrs.nasa.gov/citations/20210007704 (accessed on 22 January 2025).
  32. Pavlak, T.A.; Johannesen, J.R.; Bordi, J.J. Juno Trajectory Redesign Following PRM Cancellation. NASA Technical Reports Server; 2017. Available online: https://ntrs.nasa.gov/citations/20210007701 (accessed on 22 January 2025).
  33. Helled, R.; Stevenson, D.J.; Lunine, J.I.; Bolton, S.J.; Nettelmann, N.; Atreya, S.; Guillot, T.; Militzer, B.; Miguel, Y.; Hubbard, W.B. Revelations on Jupiter’s formation, evolution and interior: Challenges from Juno results. Icarus 2022, 378, 114937. [Google Scholar] [CrossRef]
  34. Jorgensen, J.L.; Benn, M.; Connerney, J.E.P.; Denver, T.; Jorgensen, P.S.; Andersen, A.C.; Bolton, S.J. Distribution of interplanetary dust detected by the Juno spacecraft and its contribution to the zodiacal light. J. Geophys. Res. Planets 2021, 126, e2020JE006509. [Google Scholar] [CrossRef]
  35. Feng, H.; Liu, Y. Trajectory based detection of forest-change impacts on surface soil moisture at a basin scale [Poyang Lake Basin, China]. J. Hydrol. 2014, 514, 337–346. [Google Scholar] [CrossRef]
  36. Verbesselt, J.; Hyndman, R.; Newnham, G.; Culvenor, D. Detecting trend and seasonal changes in satellite image time series. Remote Sens. Environ. 2010, 114, 106–115. [Google Scholar] [CrossRef]
  37. Verbesselt, J.; Hyndman, R.; Zeileis, A.; Culvenor, D. Phenological change detection while accounting for abrupt and gradual trends in satellite image time series. Remote Sens. Environ. 2010, 114, 2970–2980. [Google Scholar] [CrossRef]
  38. Wilde, M.; Kwok Choon, S.; Grompone, A.; Romano, M. Equations of motion of free-floating spacecraft-manipulator systems: An engineer’s tutorial. Front. Robot. AI 2018, 5, 41. [Google Scholar] [CrossRef] [PubMed]
  39. Kirk, D.E. Optimal Control Theory: An Introduction; Courier Corporation: North Chelmsford, MA, USA, 2012; pp. 3–17. [Google Scholar]
  40. Liu, B. A fast density based clustering algorithm for large databases. In Proceedings of the IEEE Fifth International Conference on Machine Learning and Cybernetics, Dalian, China, 13–16 August 2006; pp. 226–231. [Google Scholar]
  41. Ping, Y.; Tian, Y.-J.; Zhou, Y.-J.; Yang, Y.-X. Convex decomposition-based cluster labeling method for support vector clustering. J. Comput. Sci. Technol. 2012, 27, 428–442. [Google Scholar] [CrossRef]
  42. Ester, M.; Kriegel, H.P.; Sander, J.; Xu, X. A density-based algorithm for discovering clusters in large spatial databases with noise. In Proceedings of the Second International Conference on Knowledge Discovery and Data Mining, Portland, OR, USA, 2–4 August 1996; AAAI Press: Washington, DC, USA, 1996; pp. 226–231. [Google Scholar]
  43. Iorio, L. A possible new test of general relativity with Juno. Class. Quantum Gravity 2013, 30, 195011. [Google Scholar] [CrossRef]
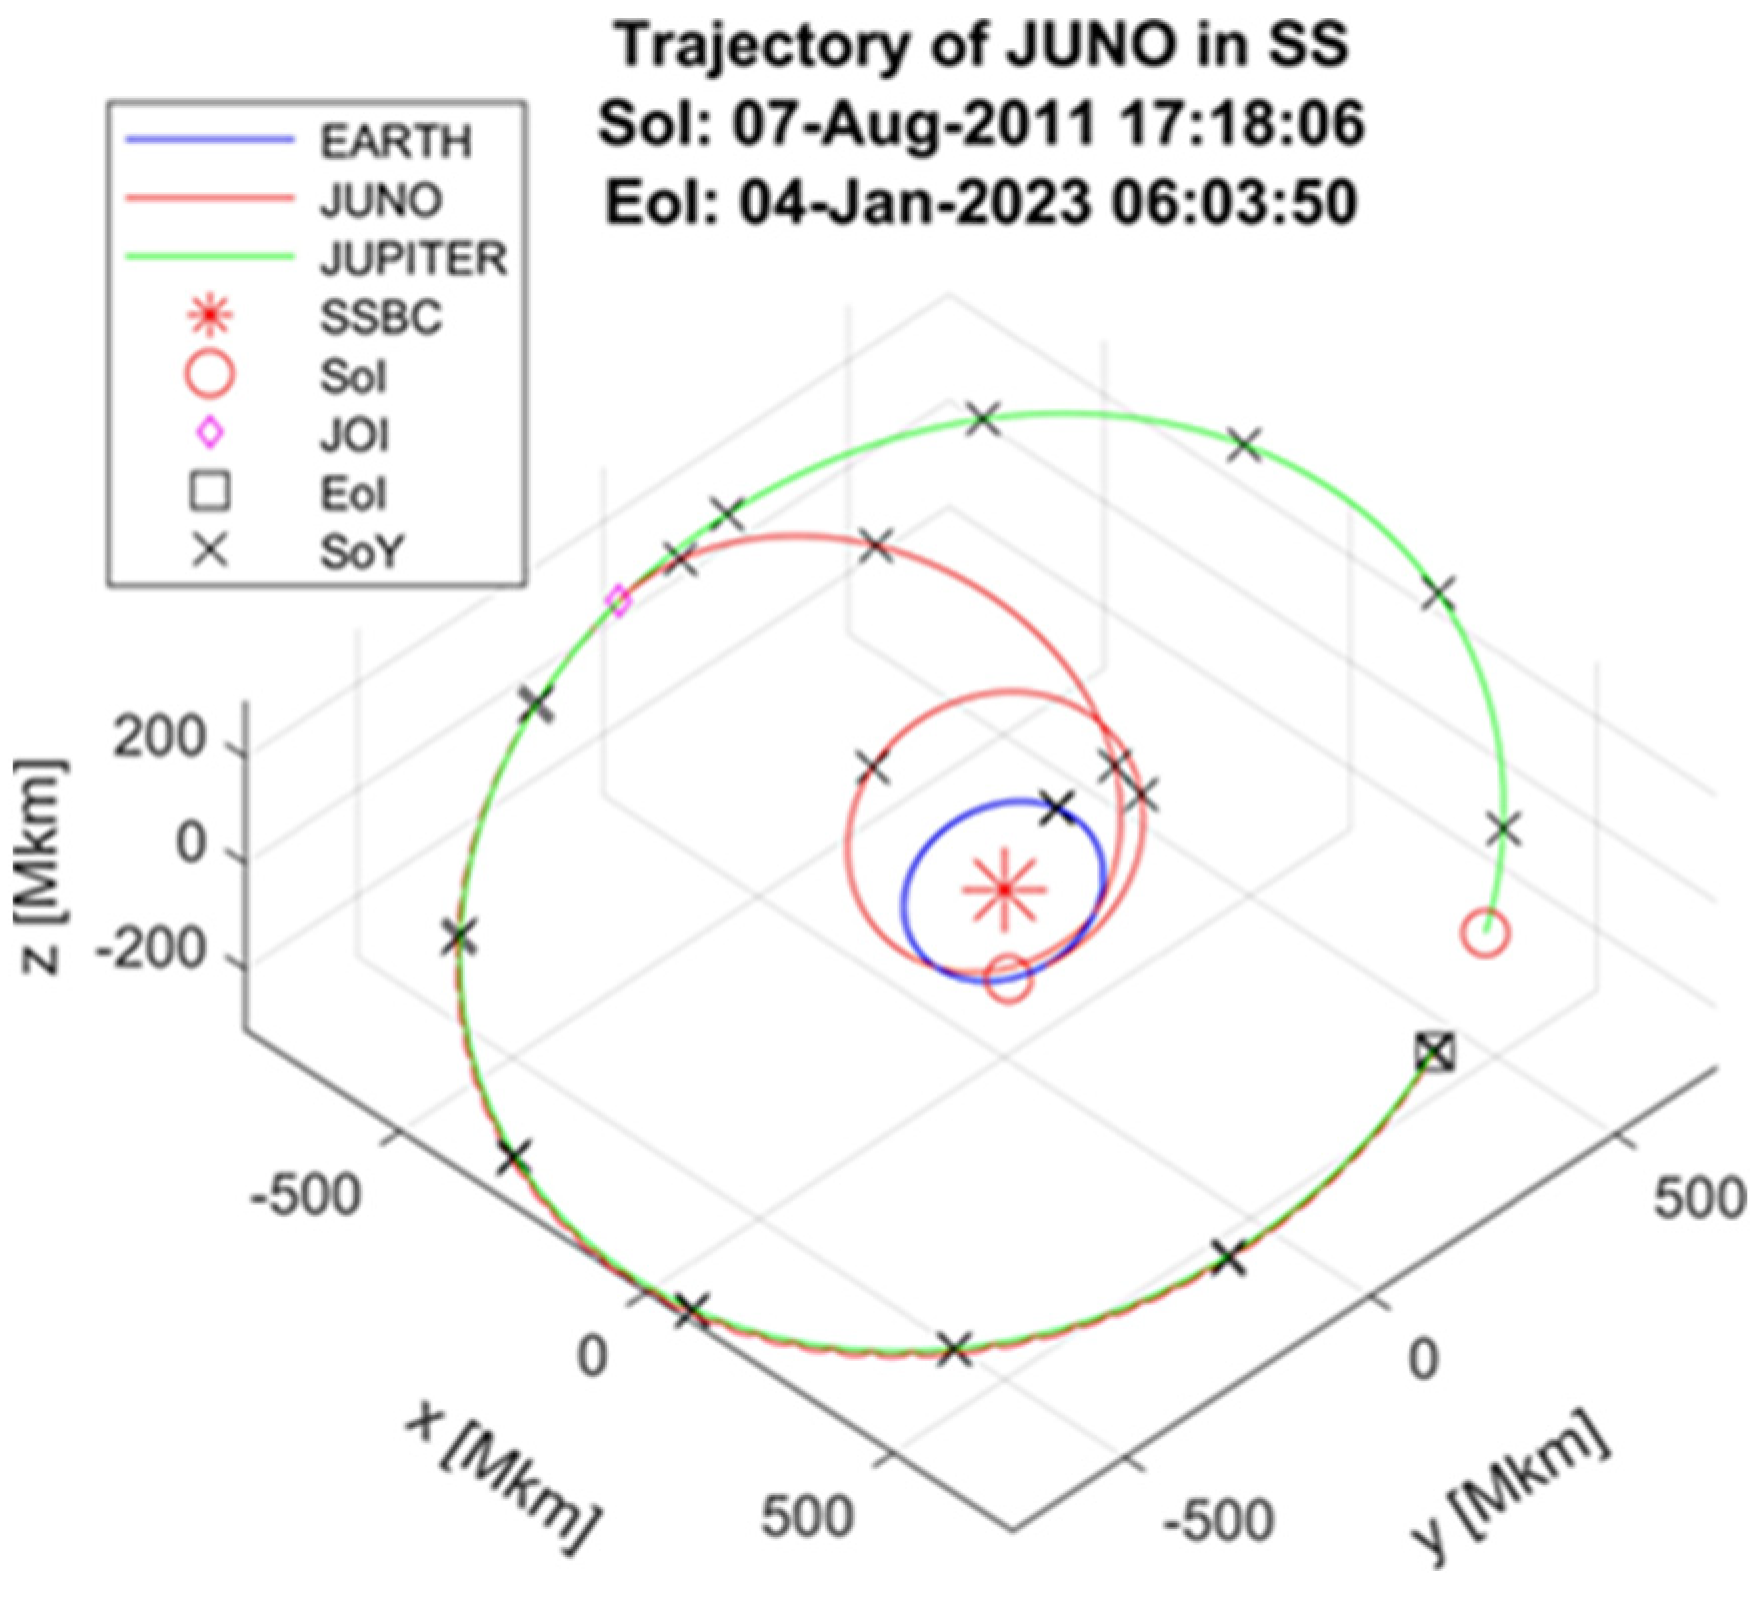
Figure 1. Illustration of the Juno spacecraft’s trajectory around the solar system barycenter (SSBC) between August 2011 (SoI—Start of Interval), through Jupiter orbit insertion (JOI: July 2016), and January 2023 (EoI—End of Interval).
Futureinternet 17 00125 g001
Figure 2. Representation of the Juno spacecraft’s trajectory around JOI between SOI: 30 June 2016 and EOI 5 July 2016.
Futureinternet 17 00125 g002
Figure 3. Trajectory of Juno in the last 1/4th (L4TH) time interval.
Futureinternet 17 00125 g003
Figure 4. Boxplot of the position component (for the time interval between 7 August 2011 and 4 January 2023).
Futureinternet 17 00125 g004
Figure 5. Boxplot of the velocity component (for the time interval between 7 August 2011 and 4 January 2023).
Futureinternet 17 00125 g005
Figure 6. Boxplot of the acceleration component (for the time interval between 7 August 2011 and 4 January 2023).
Futureinternet 17 00125 g006
Figure 7. Boxplot of the jerk component (for the time interval between 7 August 2011 and 4 January 2023).
Futureinternet 17 00125 g007
Figure 8. Boxplot of the snap component (for the time interval 7 August 2011 until 4 January 2023).
Futureinternet 17 00125 g008
Figure 9. The absolute value of a (first row), j (second row) and s (third row) of Operation Phase 1 (column 1), Operation Phase 2 (column 2) and Operation Phase 3 (column 3).
Futureinternet 17 00125 g009
Figure 10. Hilbert transform of the acceleration in OP1.
Futureinternet 17 00125 g010
Figure 11. Hilbert transform of the acceleration in OP2.
Futureinternet 17 00125 g011
Figure 12. Hilbert transform of the acceleration in OP3.
Futureinternet 17 00125 g012
Figure 13. Hilbert transform of the acceleration in OP3, jerk.
Futureinternet 17 00125 g013
Figure 14. Hilbert transform of the acceleration in OP3, snap.
Futureinternet 17 00125 g014
Figure 15. State space of Juno in OP1 (v, a, j): top view.
Futureinternet 17 00125 g015
Figure 16. State space of Juno in OP1 (v, a, j): perspective view.
Futureinternet 17 00125 g016
Figure 17. State space of Juno in OP2: (v, a, j).
Futureinternet 17 00125 g017
Figure 18. State space of Juno in OP2: (a, j, s).
Futureinternet 17 00125 g018
Figure 19. State space of Juno in OP3: (v, a, j).
Futureinternet 17 00125 g019
Figure 20. State space of Juno in OP3: (a, j, s).
Futureinternet 17 00125 g020
Figure 21. Dependence in time of the state space of Juno ( r ^ , v ^ , a ^ , j ^ , s ^ ): OP1: (left); OP2 (middle); and OP3 (right).
Futureinternet 17 00125 g021
Figure 22. Properties of the hourly status vectors in OP3, downsampled by 20: dependence of the no. of DBSCAN clusters vs. normalized radius.
Futureinternet 17 00125 g022
Figure 23. Properties of the hourly status vectors in OP3, downsampled by 20: mean no. of DBSCAN core points vs. normalized radius.
Futureinternet 17 00125 g023
Figure 24. Properties of the hourly status vectors in OP3, downsampled by 20: DBSCAN cluster elements.
Futureinternet 17 00125 g024
Figure 25. Properties of the hourly status vectors in OP3, downsampled by 20: cardinality of the DBSCAN clusters for 100 runs.
Futureinternet 17 00125 g025
Figure 26. Dependence of the number of clusters on the maximum radius parameter: OPTICS algorithm for OP3 downsampled by 20.
Futureinternet 17 00125 g026
Table 1. Activity phases of the Juno mission (TBD time zone).
Activity NameStart DateEnd Date
Pre-Launch2 August 20115 August 2011
Launch5 August 20118 August 2011
Inner Cruise 18 August 201110 October 2011
Inner Cruise 210 October 201128 May 2013
Inner Cruise 328 May 20135 November 2013
Earth Flyby (short event)9 October 20139 October 2013
Quiet Cruise5 November 20135 January 2016
Jupiter Approach5 January 201630 June 2016
Jupiter Orbit Insertion (JOI)1 July 20165 July 2016
Capture Orbits5 July 201619 October 2016
Period Reduction Maneuver19 October 201620 October 2016
Orbits 1–220 October 20169 November 2016
Science Orbits9 November 201611 October 2017
Deorbit11 October 201616 October 2017
Extended Mission1 August 202130 September 2025
Table 2. Phases of the Juno orbit relative to SSBC (TDB time zone).
Operation PhaseOP1OP2OP3
Acceleration (a)Relative to SSBC for a, j and s in
every operation phase (OP1:3)
Jerk (j)
Snap (s)
Event A 1
J 1
S 1
A 2
J 2
S 2
A 3
J 3
S 3
EE condition C o n d 1 ( A 1 , J 1 , S 1 ) C o n d 2 ( A 2 , J 2 , S 2 ) C o n d 3 ( A 3 , J 3 , S 3 )
Reference systemSolar system
Table 3. Logical conditions of the Juno orbit modification in each operation phase.
Operation PhaseOP1OP2OP3
Start of OP7 August 2021 17:18:061 July 2016 00:00:015 July 2016 03:55:00
End of OP1 July 2016 00:00:005 July 2016 03:54:004 January 2023 06:03:51
Event
condition
A 11 :   H S a > 800
A 12 :   f a > 10 4   H z
J 1 :  
S 1 :  
A 2 :   H S a > 4500
J 2 :  
S 2 :  
A 31 :  
J 3 :  
S 31 : H S s > 15,000
S 32 :   f s > 2 · 10 3 Hz
EE condition C o n d 1 = A 11   ·   A 12 C o n d 2 = A 2 C o n d 3 = S 31   ·   S 32
Table 4. Extreme events (EE) of the Juno orbit (TDB time zone).
Operation PhaseExtreme Event Dates
OP1
(No. of EE = 9)
2012 01 21T02:19:59; 2012 02 05T01:24:59; 2012 09 19T23:18:59
2012 09 19T23:20:59; 2013 03 11T14:19:59; 2014 03 23T10:23:59
2014 03 23T10:25:59; 2014 11 15T12:06:00; 2014 11 15T12:08:00
OP2
(No. of EE = 2)
2016 07 01T00:00:59 (JOI Start); 2016 07 05T03:53:59 (JOI End)
OP3
(No. of EE = 12)
2016 07 13T18:02:00; 2016 10 25T17:59:00; 2017 02 22T16:59:59
2017 02 22T17:43:59; 2018 01 09T15:59:59; 2018 03 01T17:01:59
2019 08 16T03:26:00; 2019 10 14T21:46:00; 2019 10 14T21:51:00
2019 10 14T21:52:00; 2019 12 31T23:57:00; 2020 05 04T11:59:59
Table 5. Accuracy of the outlier identification with the DBSCAN and OPTICS algorithms.
Accuracy of EE Detection/Operation PhaseOP1OP2OP3
 DBSCAN98.8%98.2%97.4%
 OPTICS99.3%99.1%98.9%
Disclaimer/Publisher’s Note: The statements, opinions and data contained in all publications are solely those of the individual author(s) and contributor(s) and not of MDPI and/or the editor(s). MDPI and/or the editor(s) disclaim responsibility for any injury to people or property resulting from any ideas, methods, instructions or products referred to in the content.