
Big-Delay Estimation for Speech Separation in Assisted Living Environments


Abstract
:1. Introduction
2. Mixing Model
3. The Elevatogram for Large Delay Estimation
4. TF Masking
4.1. Elevato-AdRess: Separation via Frequency–Azimuth Plane
| Algorithm 1 Elevato-AdRess algorithm |
4.2. Elevato-DUET
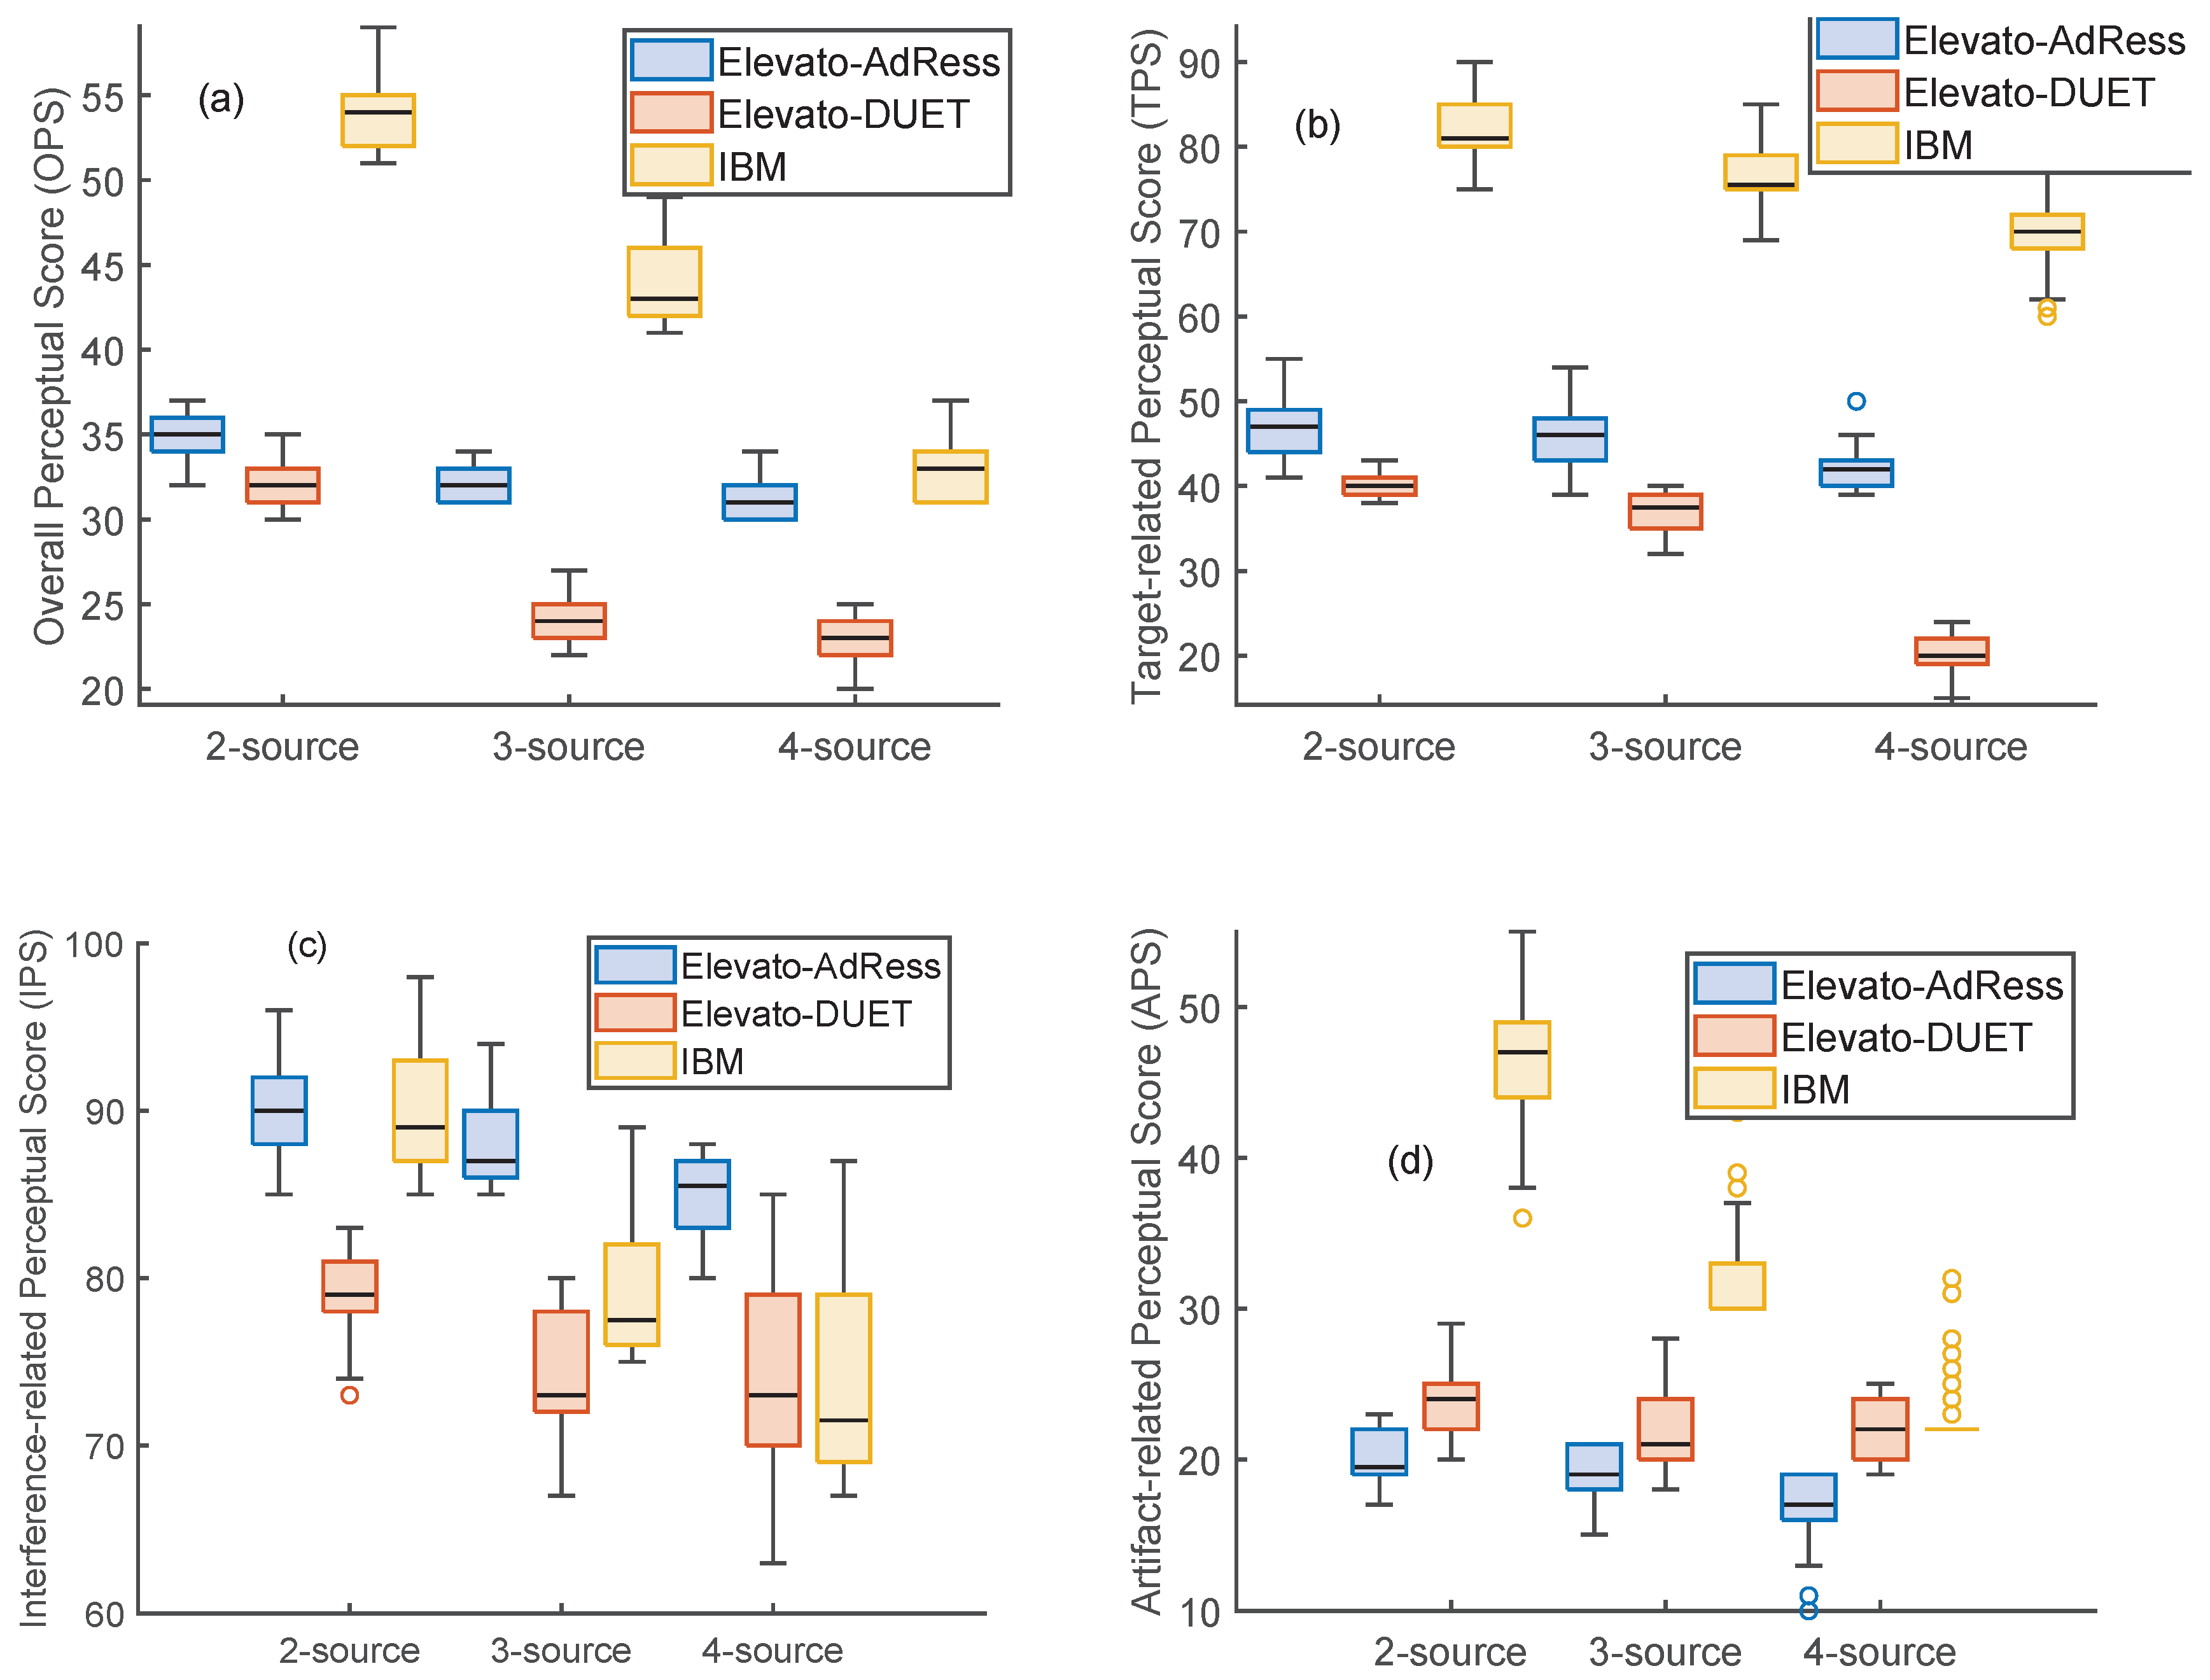
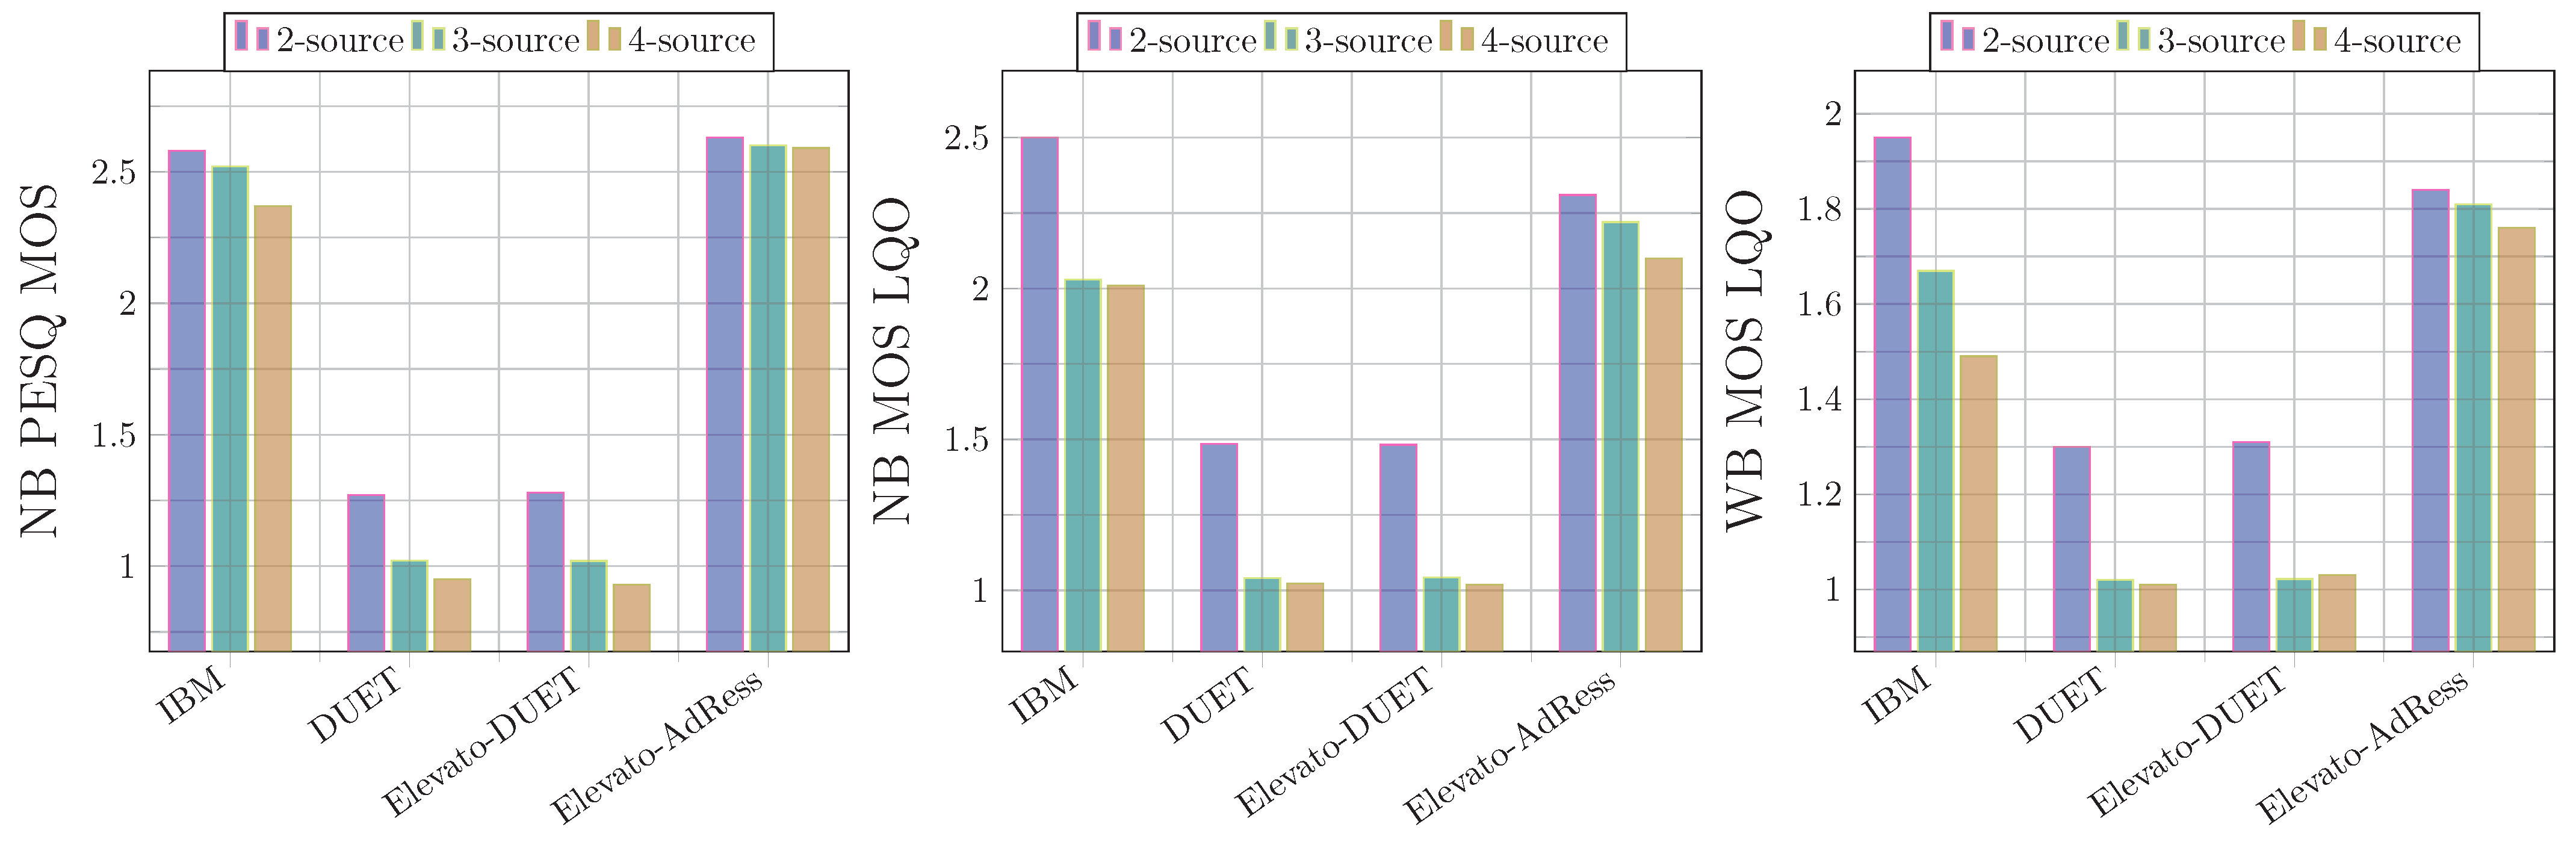
5. Results
| Algorithm 2 Elevato-DUET algorithm |
6. Discussion and Future Work
7. Conclusions
Author Contributions
Funding
Data Availability Statement
Conflicts of Interest
Appendix A. Hough Transform as a Log-Likelihood
References
- Cano, E.; Lukashevich, H. Selective Hearing: A Machine Listening Perspective. In Proceedings of the 2019 IEEE 21st International Workshop on Multimedia Signal Processing (MMSP), Kuala Lumpur, Malaysia, 27–29 September 2019; pp. 1–6. [Google Scholar]
- Chhetri, S.; Joshi, M.S.; Mahamuni, C.V.; Sangeetha, R.N.; Roy, T. Speech Enhancement: A Survey of Approaches and Applications. In Proceedings of the 2023 2nd International Conference on Edge Computing and Applications (ICECAA), Namakkal, India, 19–21 July 2023; pp. 848–856. [Google Scholar]
- Loizou, P.C. Speech Enhancement: Theory and Practice; CRC Press: Boca Raton, FL, USA, 2007. [Google Scholar]
- Bagchi, S.; de Fréin, R. Elevato-CDR: Speech Enhancement in Large Delay and Reverberant Assisted Living Scenarios. In Proceedings of the 2024 9th International Conference on Frontiers of Signal Processing (ICFSP), Paris, France, 12–14 September 2024; pp. 153–157. [Google Scholar] [CrossRef]
- de Fréin, R. Tiled time delay estimation in mobile cloud computing environments. In Proceedings of the IEEE ISSPIT, Bilbao, Spain, 18–20 December 2017; pp. 282–287. [Google Scholar]
- Prätzlich, T.; Bittner, R.M.; Liutkus, A.; Müller, M. Kernel additive modeling for interference reduction in multi-channel music recordings. In Proceedings of the 2015 IEEE International Conference on Acoustics, Speech and Signal Processing (ICASSP), South Brisbane, Australia, 19–24 April 2015; pp. 584–588. [Google Scholar]
- Cano, E.; Nowak, J.; Grollmisch, S. Exploring sound source separation for acoustic condition monitoring in industrial scenarios. In Proceedings of the 2017 25th European Signal Processing Conference (EUSIPCO), Kos, Greece, 28 August–2 September 2017; pp. 2264–2268. [Google Scholar]
- Bagchi, S.; de Fréin, R. Evaluating large delay estimation techniques for assisted living environments. Electron. Lett. 2022, 58, 846–849. [Google Scholar] [CrossRef]
- Bagchi, S.; de Fréin, R. Anechoic Demixing under Phase Wraparound Conditions in Assisted Living Environments. In Proceedings of the 2024 35th Irish Signals and Systems Conference (ISSC), Belfast, UK, 13–14 June 2024; pp. 01–06. [Google Scholar]
- Corey, R.M.; Singer, A.C. Adaptive binaural filtering for a multiple-talker listening system using remote and on-ear microphones. In Proceedings of the 2021 IEEE Workshop on Applications of Signal Processing to Audio and Acoustics (WASPAA), New Paltz, NY, USA, 17–20 October 2021; pp. 1–5. [Google Scholar]
- Sathyapriyan, V.; Pedersen, M.S.; Brookes, M.; Østergaard, J.; Naylor, P.A.; Jensen, J. Speech Enhancement in Hearing Aids Using Target Speech Presence Estimation Based on a Delayed Remote Microphone Signal. In Proceedings of the ICASSP 2024—2024 IEEE International Conference on Acoustics, Speech and Signal Processing (ICASSP), Seoul, Republic of Korea, 14–19 April 2024; pp. 1006–1010. [Google Scholar]
- Zhu, J.; Wang, D.; Zhao, Y. Design of smart home environment based on wireless sensor system and artificial speech recognition. Meas. Sens. 2024, 33, 101090. [Google Scholar] [CrossRef]
- Chumuang, N.; Ganokratanaa, T.; Pramkeaw, P.; Ketcham, M.; Chomchaiya, S.; Yimyam, W. Voice-activated assistance for the elderly: Integrating speech recognition and iot. In Proceedings of the 2024 IEEE International Conference on Consumer Electronics (ICCE), Las Vegas, NV, USA, 6–8 January 2024; pp. 1–4. [Google Scholar]
- Supriya, N.; Surya, S.; Kiran, K. Voice Controlled Smart Home for Disabled. In Proceedings of the 2024 International Conference on Intelligent and Innovative Technologies in Computing, Electrical and Electronics (IITCEE), Bangalore, India, 24–25 January 2024; pp. 1–4. [Google Scholar]
- Latif, S.; Qadir, J.; Qayyum, A.; Usama, M.; Younis, S. Speech technology for healthcare: Opportunities, challenges, and state of the art. IEEE Rev. Biomed. Eng. 2020, 14, 342–356. [Google Scholar] [CrossRef]
- Deepa, P.; Khilar, R. Speech technology in healthcare. Meas. Sens. 2022, 24, 100565. [Google Scholar] [CrossRef]
- Gullapalli, A.S.; Mittal, V.K. Early detection of Parkinson’s disease through speech features and machine learning: A review. In ICT with Intelligent Applications: Proceedings of ICTIS 2021; Springer: Singapore, 2021; Volume 1, pp. 203–212. [Google Scholar]
- Das, N.; Chakraborty, S.; Chaki, J.; Padhy, N.; Dey, N. Fundamentals, present and future perspectives of speech enhancement. Int. J. Speech Technol. 2021, 24, 883–901. [Google Scholar] [CrossRef]
- Yu, D.; Deng, L. Automatic Speech Recognition; Springer: Berlin/Heidelberg, Germany, 2016; Volume 1. [Google Scholar]
- Wang, D. Time-frequency masking for speech separation and its potential for hearing aid design. Trends Amplif. 2008, 12, 332–353. [Google Scholar] [CrossRef]
- Esra, J.S.; Sukhi, Y. Speech Separation Methodology for Hearing Aid. Comput. Syst. Sci. Eng. 2023, 44, 1659–1678. [Google Scholar] [CrossRef]
- Wang, D. Deep learning reinvents the hearing aid. IEEE Spectr. 2017, 54, 32–37. [Google Scholar] [CrossRef]
- Mecklenburger, J.; Groth, T. Wireless technologies and hearing aid connectivity. In Hearing Aids; Springer: Cham, Switzerland, 2016; pp. 131–149. [Google Scholar]
- Mangharam, R.; Rowe, A.; Rajkumar, R.; Suzuki, R. Voice over sensor networks. In Proceedings of the 2006 27th IEEE International Real-Time Systems Symposium (RTSS’06), Rio de Janeiro, Brazil, 5–8 December 2006; pp. 291–302. [Google Scholar]
- Mouhassine, N.; Moughit, M.; Laassiri, F. Improving the quality of service of voice over IP in wireless sensor networks by centralizing handover management and authentication using the SDN controller. In Proceedings of the 2019 Third International Conference on Intelligent Computing in Data Sciences (ICDS), Marrakech, Morocco, 28–30 October 2019; pp. 1–6. [Google Scholar]
- Yang, C. Design of smart home control system based on wireless voice sensor. J. Sens. 2021, 2021, 8254478. [Google Scholar] [CrossRef]
- Mathur, R.; Dubey, T.K. Security-Focused Mathematical Model for Voice Over Wireless Sensor Network. In Intelligent Computing Techniques for Smart Energy Systems: Proceedings of ICTSES 2021; Springer: Berlin/Heidelberg, Germany, 2022; pp. 681–688. [Google Scholar]
- Brendel, A.; Kellermann, W. Distributed source localization in acoustic sensor networks using the coherent-to-diffuse power ratio. IEEE J. Sel. Top. Signal Process. 2019, 13, 61–75. [Google Scholar] [CrossRef]
- Ferrer, M.; de Diego, M.; Piñero, G.; Gonzalez, A. Affine projection algorithm over acoustic sensor networks for active noise control. IEEE/ACM Trans. Audio Speech Lang. Process. 2020, 29, 448–461. [Google Scholar] [CrossRef]
- Richard, G.; Smaragdis, P.; Gannot, S.; Naylor, P.A.; Makino, S.; Kellermann, W.; Sugiyama, A. Audio signal processing in the 21st century: The important outcomes of the past 25 years. IEEE Signal Process. Mag. 2023, 40, 12–26. [Google Scholar] [CrossRef]
- Hu, D.; Si, Q.; Liu, R.; Bao, F. Distributed sensor selection for speech enhancement with acoustic sensor networks. IEEE/ACM Trans. Audio Speech Lang. Process. 2023, 31, 985–999. [Google Scholar] [CrossRef]
- Kim, J.S.; Kim, C.H. A review of assistive listening device and digital wireless technology for hearing instruments. Korean J. Audiol. 2014, 18, 105. [Google Scholar] [CrossRef]
- Zallio, M.; Ohashi, T. The evolution of assistive technology: A literature review of technology developments and applications. Hum. Factors Access. Assist. Technol. 2022, 37, 85. [Google Scholar]
- Kellermann, W.; Martin, R.; Ono, N. Signal processing and machine learning for speech and audio in acoustic sensor networks. EURASIP J. Audio Speech Music Process. 2023, 2023, 54. [Google Scholar] [CrossRef]
- Plazak, J.; Kersten-Oertel, M. A Survey on the Affordances of “Hearables”. Inventions 2018, 3, 48. [Google Scholar] [CrossRef]
- Bertrand, A. Applications and trends in wireless acoustic sensor networks: A signal processing perspective. In Proceedings of the 2011 18th IEEE Symposium on Communications and Vehicular Technology in the Benelux (SCVT), Ghent, Belgium, 22–23 November 2011; pp. 1–6. [Google Scholar]
- Wagener, K.C.; Vormann, M.; Latzel, M.; Mülder, H.E. Effect of hearing aid directionality and remote microphone on speech intelligibility in complex listening situations. Trends Hear. 2018, 22, 2331216518804945. [Google Scholar] [CrossRef]
- Courtois, G.A. Spatial Hearing Rendering in Wireless Microphone Systems for Binaural Hearing Aids; Technical Report; EPFL: Lausanne, Switzerland, 2016. [Google Scholar]
- Stone, M.A.; Lough, M.; Wilbraham, K.; Whiston, H.; Dillon, H. Toward a Real-World Technical Test Battery for Remote Microphone Systems Used with Hearing Prostheses. Trends Hear. 2023, 27, 23312165231182518. [Google Scholar] [CrossRef]
- Szurley, J.; Bertrand, A.; Van Dijk, B.; Moonen, M. Binaural noise cue preservation in a binaural noise reduction system with a remote microphone signal. IEEE/ACM Trans. Audio Speech Lang. Process. 2016, 24, 952–966. [Google Scholar] [CrossRef]
- Corey, R.M.; Singer, A.C. Immersive Enhancement and Removal of Loudspeaker Sound Using Wireless Assistive Listening Systems and Binaural Hearing Devices. In Proceedings of the ICASSP 2023-2023 IEEE International Conference on Acoustics, Speech and Signal Processing (ICASSP), Rhodes Island, Greece, 4–10 June 2023; pp. 1–2. [Google Scholar]
- Kumatani, K.; McDonough, J.; Raj, B. Microphone array processing for distant speech recognition: From close-talking microphones to far-field sensors. IEEE Signal Process. Mag. 2012, 29, 127–140. [Google Scholar] [CrossRef]
- Cobos, M.; Antonacci, F.; Alexandridis, A.; Mouchtaris, A.; Lee, B. A survey of sound source localization methods in wireless acoustic sensor networks. Wirel. Commun. Mob. Comput. 2017, 2017, 3956282. [Google Scholar] [CrossRef]
- Pertilä, P.; Fagerlund, E.; Huttunen, A.; Myllylä, V. Online own voice detection for a multi-channel multi-sensor in-ear device. IEEE Sens. J. 2021, 21, 27686–27697. [Google Scholar] [CrossRef]
- Pertilä, P. Online blind speech separation using multiple acoustic speaker tracking and time–frequency masking. Comput. Speech Lang. 2013, 27, 683–702. [Google Scholar] [CrossRef]
- Xu, A.; Choudhury, R.R. Learning to separate voices by spatial regions. arXiv 2022, arXiv:2207.04203. [Google Scholar]
- Moore, B.C. An Introduction to the Psychology of Hearing; Brill: Leiden, The Netherlands, 2012. [Google Scholar]
- de Fréin, R.; Rickard, S.T. The Synchronized Short-Time-Fourier-Transform: Properties and Definitions for Multichannel Source Separation. IEEE Trans. Signal Process. 2011, 59, 91–103. [Google Scholar] [CrossRef]
- Duong, N.Q.; Vincent, E.; Gribonval, R. Under-determined reverberant audio source separation using a full-rank spatial covariance model. IEEE Trans. Audio Speech Lang. Process. 2010, 18, 1830–1840. [Google Scholar] [CrossRef]
- Araki, S.; Mukai, R.; Makino, S.; Nishikawa, T.; Saruwatari, H. The fundamental limitation of frequency domain blind source separation for convolutive mixtures of speech. IEEE Trans. Speech Audio Process. 2003, 11, 109–116. [Google Scholar] [CrossRef]
- Sawada, H.; Araki, S.; Mukai, R.; Makino, S. Grouping separated frequency components by estimating propagation model parameters in frequency-domain blind source separation. IEEE Trans. Audio Speech Lang. Process. 2007, 15, 1592–1604. [Google Scholar] [CrossRef]
- Gannot, S.; Cohen, I. Adaptive beamforming and postfiltering. In Springer Handbook of Speech Processing; Springer: Berlin/Heidelberg, Germany, 2008; pp. 945–978. [Google Scholar]
- Gannot, S.; Vincent, E.; Markovich-Golan, S.; Ozerov, A. A consolidated perspective on multimicrophone speech enhancement and source separation. IEEE/ACM Trans. Audio Speech Lang. Process. 2017, 25, 692–730. [Google Scholar] [CrossRef]
- Yang, J.; Guo, Y.; Yang, Z.; Xie, S. Under-determined convolutive blind source separation combining density-based clustering and sparse reconstruction in time-frequency domain. IEEE Trans. Circuits Syst. I Regul. Pap. 2019, 66, 3015–3027. [Google Scholar] [CrossRef]
- Knapp, C.; Carter, G. The generalized correlation method for estimation of time delay. IEEE Trans. Acoust. Speech Signal Process. 1976, 24, 320–327. [Google Scholar] [CrossRef]
- Grinstein, E.; Tengan, E.; Çakmak, B.; Dietzen, T.; Nunes, L.; van Waterschoot, T.; Brookes, M.; Naylor, P.A. Steered Response Power for Sound Source Localization: A tutorial review. EURASIP J. Audio Speech Music Process. 2024, 2024, 59. [Google Scholar] [CrossRef]
- Belouchrani, A.; Amin, M.G. Time-frequency MUSIC. IEEE Signal Process. Lett. 1999, 6, 109–110. [Google Scholar] [CrossRef]
- Bu, S.; Zhao, T.; Zhao, Y. TDOA Estimation of Speech Source in Noisy Reverberant Environments. In Proceedings of the 2022 IEEE Spoken Language Technology Workshop (SLT), Doha, Qatar, 9–12 January 2023; pp. 1059–1066. [Google Scholar]
- Cobos, M.; Antonacci, F.; Comanducci, L.; Sarti, A. Frequency-sliding generalized cross-correlation: A sub-band time delay estimation approach. IEEE/ACM Trans. Audio Speech Lang. Process. 2020, 28, 1270–1281. [Google Scholar] [CrossRef]
- Nesta, F.; Svaizer, P.; Omologo, M. Cumulative state coherence transform for a robust two-channel multiple source localization. In Proceedings of the Independent Component Analysis and Signal Separation: 8th International Conference, ICA 2009, Paraty, Brazil, 15–18 March 2009; pp. 290–297. [Google Scholar]
- Blandin, C.; Ozerov, A.; Vincent, E. Multi-source TDOA estimation in reverberant audio using angular spectra and clustering. Signal Process. 2012, 92, 1950–1960. [Google Scholar] [CrossRef]
- Chaudhari, A.; Dhonde, S. A review on speech enhancement techniques. In Proceedings of the 2015 International Conference on Pervasive Computing (ICPC), Pune, India, 8–10 January 2015; pp. 1–3. [Google Scholar]
- Kumatani, K.; Raj, B.; Singh, R.; McDonough, J. Microphone array post-filter based on spatially-correlated noise measurements for distant speech recognition. In Proceedings of the Interspeech 2012, Portland, OR, USA, 9–13 September 2012; pp. 298–301. [Google Scholar] [CrossRef]
- Rickard, S. The DUET blind source separation algorithm. In Blind Speech Separation; Springer: Berlin/Heidelberg, Germany, 2007; pp. 217–241. [Google Scholar]
- Barry, D.; Lawlor, B.; Coyle, E. Sound Source Separation: Azimuth Discrimination and Resynthesis. In Proceedings of the 7th International Conference on Digital Audio Effects, DAFX 04, Montréal, QC, Canada, 5–8 October 2004. [Google Scholar]
- Boldt, J. Binary Masking & Speech Intelligibility. Ph.D. Thesis, Aalborg University, Aalborg, Denmark, 2010. Available online: https://vbn.aau.dk/en/publications/binary-masking-amp-speech-intelligibility (accessed on 18 February 2025).
- Yilmaz, O.; Rickard, S. Blind separation of speech mixtures via time-frequency masking. IEEE Trans. Signal Process. 2004, 52, 1830–1847. [Google Scholar] [CrossRef]
- Rickard, S. Sparse sources are separated sources. In Proceedings of the 2006 14th European Signal Processing Conference, Florence, Italy, 4–8 September 2006; pp. 1–5. [Google Scholar]
- Rickard, S.; Yilmaz, O. On the approximate W-disjoint orthogonality of speech. In Proceedings of the 2002 IEEE International Conference on Acoustics, Speech, and Signal Processing, Orlando, FL, USA, 13–17 May 2002; Volume 1, p. I-529. [Google Scholar]
- Rafii, Z.; Liutkus, A.; Stöter, F.R.; Mimilakis, S.I.; FitzGerald, D.; Pardo, B. An overview of lead and accompaniment separation in music. IEEE/ACM Trans. Audio Speech Lang. Process. 2018, 26, 1307–1335. [Google Scholar] [CrossRef]
- de Fréin, R.; Rickard, S.T. Power-Weighted Divergences for Relative Attenuation and Delay Estimation. IEEE Sig. Proc. Let. 2016, 23, 1612–1616. [Google Scholar] [CrossRef]
- Oppenheim, A.V. Discrete-Time Signal Processing; Pearson Education India: Delhi, India, 1999. [Google Scholar]
- Mandel, M.I. Binaural Model-Based Source Separation and Localization; Columbia University: New York, NY, USA, 2010. [Google Scholar]
- Ban, Y.; Alameda-Pineda, X.; Evers, C.; Horaud, R. Tracking multiple audio sources with the von mises distribution and variational em. IEEE Signal Process. Lett. 2019, 26, 798–802. [Google Scholar] [CrossRef]
- Mandel, M.I.; Weiss, R.J.; Ellis, D.P. Model-based expectation-maximization source separation and localization. IEEE Trans. Audio Speech Lang. Process. 2009, 18, 382–394. [Google Scholar] [CrossRef]
- Duda, R.O.; Hart, P.E. Use of the Hough transformation to detect lines and curves in pictures. Comm. ACM 1972, 15, 11–15. [Google Scholar] [CrossRef]
- Roy, R.H., III; Kailath, T. ESPRIT-Estimation of Signal Parameters via Rotational Invariance Techniques. Opt. Eng. 1990, 29, 296–313. [Google Scholar]
- Abrard, F.; Deville, Y. A time–frequency blind signal separation method applicable to underdetermined mixtures of dependent sources. Signal Process. 2005, 85, 1389–1403. [Google Scholar] [CrossRef]
- Arberet, S.; Gribonval, R.; Bimbot, F. A robust method to count and locate audio sources in a stereophonic linear instantaneous mixture. In Proceedings of the International Conference on Independent Component Analysis and Signal Separation, Charleston, SC, USA, 5–8 March 2006; pp. 536–543. [Google Scholar]
- Melia, T.; Rickard, S.; Fearon, C. Histogram-based Blind Source Separation of more sources than sensors using a DUET-ESPRIT technique. In Proceedings of the 13th EUSIPCO, New Paltz, NY, USA, 16–19 October 2005; pp. 1–4. [Google Scholar]
- Hyvarinen, A. Fast and robust fixed-point algorithms for independent component analysis. IEEE Tran. Neural Netw. 1999, 10, 626–634. [Google Scholar] [CrossRef]
- Zibulevsky, M.; Pearlmutter, B.A. Blind Source Separation by Sparse Decomposition in a Signal Dictionary. Neural Comput. 2001, 13, 863–882. [Google Scholar] [CrossRef] [PubMed]
- Bagchi, S.; de Fréin, R. Extending Instantaneous De-mixing Algorithms to Anechoic Mixtures. In Proceedings of the 2021 32nd Irish Signals and Systems Conference (ISSC), Athlone, Ireland, 10–11 June 2021; pp. 1–6. [Google Scholar]
- de Fréin, R. Reformulating the binary masking approach of adress as soft masking. Electronics 2020, 9, 1373. [Google Scholar] [CrossRef]
- de Fréin, R.; Rickard, S.T. Learning speech features in the presence of noise: Sparse convolutive robust non-negative matrix factorization. In Proceedings of the 2009 16th International Conference on Digital Signal Processing, Santorini, Greece, 5–7 July 2009; pp. 1–6. [Google Scholar] [CrossRef]
- Bagchi, S.; de Fréin, R. Soft-Mask De-Mixing for Anechoic Mixtures. In Proceedings of the 2022 33rd Irish Signals and Systems Conference (ISSC), Cork, Ireland, 9–10 June 2022; pp. 1–6. [Google Scholar]
- Izumi, Y.; Ono, N.; Sagayama, S. Sparseness-based 2ch BSS using the EM algorithm in reverberant environment. In Proceedings of the 2007 IEEE Workshop on Applications of Signal Processing to Audio and Acoustics, New Paltz, NY, USA, 21–24 October 2007; pp. 147–150. [Google Scholar]
- Cano, E.; FitzGerald, D.; Liutkus, A.; Plumbley, M.D.; Stöter, F.R. Musical source separation: An introduction. IEEE Signal Process. Mag. 2018, 36, 31–40. [Google Scholar] [CrossRef]
- Barry, D. Real-Time Sound Source Separation for Music Applications. Ph.D. Thesis, Technological University Dublin, Dublin, Ireland, 2019. [Google Scholar]
- Chun, C.; Jeon, K.M.; Choi, W. Configuration-invariant sound localization technique using azimuth-frequency representation and convolutional neural networks. Sensors 2020, 20, 3768. [Google Scholar] [CrossRef]
- Giorgio, P. the bivariate mixture space: A compact spectral representation of bivariate signals. J. Audio Eng. Soc. 2023, 71, 481–491. [Google Scholar]
- Abesser, J.; Lukashevich, H.; Holly, S.; Körber, Y.; Ruch, R. Device, Method and Computer Program for Acoustic Monitoring of a Monitoring Area. U.S. Patent 11,557,279, 17 January 2023. [Google Scholar]
- Kumatani, K.; Arakawa, T.; Yamamoto, K.; McDonough, J.; Raj, B.; Singh, R.; Tashev, I. Microphone array processing for distant speech recognition: Towards real-world deployment. In Proceedings of the 2012 Asia Pacific Signal and Information Processing Association Annual Summit and Conference, Hollywood, CA, USA, 3–6 December 2012; pp. 1–10. [Google Scholar]
- de Fréin, R. Remedying Sound Source Separation via Azimuth Discrimination and Re-synthesis. In Proceedings of the 31st Irish Signals and Systems Conference (ISSC), Letterkenny, Ireland, 11–12 June 2020; pp. 1–6. [Google Scholar] [CrossRef]
- de Fréin, R.; Rickard, S.T.; Pearlmutter, B.A. Constructing Time-Frequency Dictionaries for Source Separation via Time-Frequency Masking and Source Localisation. In Proceedings of the Independent Component Analysis and Signal Separation; Adali, T., Jutten, C., Romano, J.M.T., Barros, A.K., Eds.; Springer: Berlin/Heidelberg, Germany, 2009; pp. 573–580. [Google Scholar]
- Reju, V.G.; Koh, S.N.; Soon, Y. Underdetermined convolutive blind source separation via time–frequency masking. IEEE Trans. Audio Speech Lang. Process. 2009, 18, 101–116. [Google Scholar] [CrossRef]
- Zhang, H.; Hua, G.; Yu, L.; Cai, Y.; Bi, G. Underdetermined blind separation of overlapped speech mixtures in time-frequency domain with estimated number of sources. Speech Commun. 2017, 89, 1–16. [Google Scholar] [CrossRef]
- He, Y.; Wang, H.; Chen, Q.; So, R.H. Harvesting partially-disjoint time-frequency information for improving degenerate unmixing estimation technique. In Proceedings of the ICASSP 2022-2022 IEEE International Conference on Acoustics, Speech and Signal Processing (ICASSP), Singapore, 23–27 May 2022; pp. 506–510. [Google Scholar]
- Lu, J.; Qian, W.; Yin, Q.; Xu, K.; Li, S. An Improved Underdetermined Blind Source Separation Method for Insufficiently Sparse Sources. Circuits Syst. Signal Process. 2023, 42, 7615–7639. [Google Scholar] [CrossRef]
- Xiangru, B.; Zhang, G.; Xie, Y.; Zhang, Q. Method and System for Voice Separation Based on Degenerate Unmixing Estimation Technique. U.S. Patent 11,783,848, 10 October 2023. [Google Scholar]
- Garofolo, J.S.; Lamel, L.F.; Fisher, W.M.; Fiscus, J.G.; Pallett, D.S.; Dahlgren, N.L.; Zue, V. Timit Acoustic Phonetic Continuous Speech Corpus; Linguistic Data Consortium: Philadelphia, PA, USA, 1993. [Google Scholar]
- Vincent, E.; Gribonval, R.; Févotte, C. Performance measurement in blind audio source separation. IEEE Trans. Audio Speech Lang. Process. 2006, 14, 1462–1469. [Google Scholar] [CrossRef]
- Emiya, V.; Vincent, E.; Harlander, N.; Hohmann, V. Subjective and objective quality assessment of audio source separation. IEEE Trans. Audio Speech Lang. Process. 2011, 19, 2046–2057. [Google Scholar] [CrossRef]
- Rix, A.W.; Beerends, J.G.; Hollier, M.P.; Hekstra, A.P. Perceptual evaluation of speech quality (PESQ)—A new method for speech quality assessment of telephone networks and codecs. In Proceedings of the 2001 IEEE International Conference on Acoustics, Speech, and Signal Processing, Salt Lake City, UT, USA, 7–11 May 2001; Volume 2, pp. 749–752. [Google Scholar]
- Wang, D. On ideal binary mask as the computational goal of auditory scene analysis. In Speech Separation by Humans and Machines; Springer: New York, NY, USA, 2005; pp. 181–197. [Google Scholar]
- Hummersone, C.; Mason, R.; Brookes, T. Ideal Binary Mask Ratio: A Novel Metric for Assessing Binary-Mask-Based Sound Source Separation Algorithms. IEEE Trans. Audio Speech Lang. Process. 2011, 19, 2039–2045. [Google Scholar] [CrossRef]
- Ward, D.; Wierstorf, H.; Mason, R.D.; Grais, E.M.; Plumbley, M.D. BSS Eval or PEASS? Predicting the perception of singing-voice separation. In Proceedings of the 2018 IEEE International Conference on Acoustics, Speech and Signal Processing (ICASSP), Calgary, AB, Canada, 15–20 April 2018; pp. 596–600. [Google Scholar]
- Kim, G.; Loizou, P.C. Why do speech-enhancement algorithms not improve speech intelligibility? In Proceedings of the 2010 IEEE International Conference on Acoustics, Speech and Signal Processing (ICASSP), Dallas, TX, USA, 14–19 March 2010; pp. 4738–4741. [Google Scholar]
- Loizou, P.C.; Kim, G. Reasons why current speech-enhancement algorithms do not improve speech intelligibility and suggested solutions. IEEE Trans. Audio Speech Lang. Process. 2010, 19, 47–56. [Google Scholar] [CrossRef]


Disclaimer/Publisher’s Note: The statements, opinions and data contained in all publications are solely those of the individual author(s) and contributor(s) and not of MDPI and/or the editor(s). MDPI and/or the editor(s) disclaim responsibility for any injury to people or property resulting from any ideas, methods, instructions or products referred to in the content. |
© 2025 by the authors. Licensee MDPI, Basel, Switzerland. This article is an open access article distributed under the terms and conditions of the Creative Commons Attribution (CC BY) license (https://creativecommons.org/licenses/by/4.0/).
Share and Cite
Bagchi, S.; de Fréin, R. Big-Delay Estimation for Speech Separation in Assisted Living Environments. Future Internet 2025, 17, 184. https://doi.org/10.3390/fi17040184
Bagchi S, de Fréin R. Big-Delay Estimation for Speech Separation in Assisted Living Environments. Future Internet. 2025; 17(4):184. https://doi.org/10.3390/fi17040184
Chicago/Turabian StyleBagchi, Swarnadeep, and Ruairí de Fréin. 2025. "Big-Delay Estimation for Speech Separation in Assisted Living Environments" Future Internet 17, no. 4: 184. https://doi.org/10.3390/fi17040184
APA StyleBagchi, S., & de Fréin, R. (2025). Big-Delay Estimation for Speech Separation in Assisted Living Environments. Future Internet, 17(4), 184. https://doi.org/10.3390/fi17040184