1. Introduction
In the past few years, collaborative mapping projects, with the main goal of collecting and distributing freely available geodata, have attracted significant attention from academia, leading towards their integration into research projects in a semantic and meaningful way. There are a variety of projects available on the Internet on which mostly volunteers share their expertise and information.
One of the most well-known examples of a User-Generated Content (UGC; [
1]) online portal is the free online-encyclopedia Wikipedia. Other projects focus on the collection of a diverse type of data and information specifically containing geographic objects and their corresponding information. Due to the voluntary approach to data collection efforts for this particular type of information, it was initially termed Volunteered Geographic Information (VGI) [
2]. In 2007, early questions were raised about “the phenomenon of VGI, and the use of VGI in doing science” [
3], especially in the area of Geographic Information Science (GIScience). Thus, UGC or VGI have developed into popular interdisciplinary research topics in recent years. Most VGI analyses focus on the OpenStreetMap (OSM) project, which provides a plethora of research questions due to its data diversity. An increasing number of studies in the past investigated data quality indicators, the motivation and activity spectrum of the community that share the information or applications that were developed based on the collected information found in OSM. Although different factors have been analyzed in these prior articles which will be discussed in more detail in the second section of this paper, the analyses usually show a similar pattern: The larger the population in the predefined, analyzed area, the stronger the data quality of the collaboratively collected information in OSM gets. To the best of the authors’ knowledge, only minor studies on other countries not located in Europe have been carried out and reported. More importantly, no comparative investigation on OSM data for different selected world regions has been conducted.
The second major factor for collaborative projects such as OSM, after a well designed project infrastructure, is the worldwide community. The volunteers build the foundation of the project and guarantee the detailed data contributions and temporal accuracy of the data, thus it is important to investigate the different worldwide collaboration efforts. The main objective of this paper is to determine similarities and differences in the pattern of VGI data contributions and user activity spectrums for different worldwide urban areas. We hypothesize that different factors such as contributor concentration, population density and socio-economic parameters such as income can influence the data contributions to OSM. The analysis is conducted for 12 world regions representing at least one urban area for each continent.
The remainder of the paper is organized as follows: The following section gives a brief overview of the OSM project and prior OSM research. The next section introduces the study areas and applied data preparation steps. The third section presents the results conducted for the selected urban areas between 2005 and 2012. The last two chapters summarize and discuss the achieved outcomes and provide an outlook on potential future research.
2. Volunteered Geographic Information: The OpenStreetMap Project
The OSM project is one of the most popular and well-known VGI platforms on the Internet. The main goal of the project since its initiation in 2004 is to create a freely available database of geographic features [
4]. Contributions and edits to OSM can be made by any internet user that is registered to the project. This open approach to data contribution allowed the project to gradually attract new members and grow rapidly in the past few years to more than one million registered members at the time of writing [
5]. Aside from the aforementioned registration to the project to be able to make edits to the map, the volunteers are commonly equipped with GPS enabled devices that allow the collection of new information in the field. Others prefer to trace new data from aerial imagery from their home computer. The imagery information is provided by a variety of sources and allows the active users to trace data even for areas that are not close to the editor’s location. In addition to digitized features, attribute information about the created objects can be simultaneously added to the database. For a certain number of countries, contributions to the project were achieved through large data imports from commercial or governmental data sources whose licenses are compatible to the OSM license. Some examples can be found in the United States, the Netherlands and Austria, where partial or complete data representations of the road networks were enabled through this approach. For France, building information and the CORINE (Coordination of Information on the Environment), land cover information were imported to OSM in 2009. There are no strict limitations, rules or standards to the type of information which should be contributed to the OSM project. Merely a de facto standard, represented by the “Map-Features”, helps to guide the contributors with their work [
6]. This guide describes the most common elements and objects and their corresponding attributes that can be found in the OSM project. The map features are mostly attributed with a key and value combination also referred to as “tags”. The collected real world information in the database is represented by three data types. Nodes, which represent any point feature, Ways which represent lines such as roads and areas such as buildings, and Relations which contain information about how Nodes and Ways are related to each other.
In recent years, the OSM project, data, and contributors have been the center of attention for many research disciplines. In 2009, early outcomes showed a density of OSM data in Germany with potential applicability for 3D location based services [
7]. The results also showed some first indications of a correlation between improved data quality in areas with a higher population density. Similar results were conducted for London and entire England in 2008–2009, highlighting the decrease in data quality when moving away from bigger cities and that: “more affluent areas and urban locations are better covered than deprived or rural locations” [
8,
9]. In 2010, findings for Germany resembled the pattern of urban locations found in England [
10]: “If coverage is needed only in the densely populated urban areas of Germany, OpenStreetMap may already be an interesting and very cost-efficient-alternative”. A similar statement was made for England [
11]: “Most accurate tiles are located in major urban areas such as London, Liverpool, Manchester or Birmingham”. A different analysis for Germany [
12] stated that: “At the national level, the quality of OSM is highest regarding relative object completeness” and “quality differs locally, and even in a single town the different aspects of quality may vary”. A study conducted for France showed a heterogeneous OSM data pattern, which “is particularly explained by the coexistence of different data sources, processes of capture, and contributors’ profiles, highlighting the importance of following accepted and well-defined specifications” [
13]. Additionally, the analysis revealed that the more volunteers contributed within an area, the more recent the objects were, i.e. providing a better temporal quality of OSM itself. Similar to all prior findings, an analysis for Ireland showed that the data completeness in OSM loosely correlates with the population density [
14]. However, contradicting results to the pattern found in Europe could be determined for the US. In this particular case urban areas only showed similar data completeness between OSM and commercial providers in Florida, while rural areas were more complete in OSM [
15]. This difference was primarily based on the TIGER/Line data import in OSM for the US and not due to active data contributions [
15].
The heterogeneous pattern of the OSM project is not limited to data completeness and accuracy factors. The community and its active contributors show a similar distribution. At the beginning of 2012, about 75% of all members who made at least one change to the database were located in Europe, while the rest was distributed over the world [
16]. Especially some countries with higher population values such as USA, China and India show relatively small OSM project communities. Although the project was initiated in the UK, the most active community of the project in recent years can be found in Germany [
16]. The latest results showed that about 25% of all active OSM members are located in Germany. Thus, it is not surprising that the road network completeness shows good results, sometimes exceeding commercial providers for this particular area [
17]. Solely attribute information such as road names, speed limits and turn restrictions are missing for parts of the German dataset [
12,
17].
Aside from road network parameters, which are the main focus of most conducted analyses, a few other publications also confirm OSM data to be suitable for 3D city models in urban areas [
18,
19]. In summary, almost all prior studies show that urban areas provide better data completeness in OSM than rural areas [
20,
21], which is sometimes also referred to as “urban bias in VGI” [
22]. However, each individual case study needs to be analyzed for its particular purpose [
22,
23]. Chances are that: “When one moves away from large urban centers the major issue for quality becomes one of coverage—in many rural areas there is little or no OSM coverage at all” [
24].
While most studies analyze the quantity and quality of the collaboratively collected information in OSM, others focus on the motivational factors of the volunteers that contribute to VGI projects [
25,
26,
27]. Possible motivational factors might be the unique ethos, or that geospatial information should be freely available to everyone. For others, learning new technologies, self-expression, relaxation and recreation or just pure fun can play a major role [
28]. Three independent surveys in 2009 [
28], 2010 [
29] and 2011 [
30] gave more insight on demographic aspects of the OSM project. The majority of the contributors to the project, about 97%, were males. Two out of the three surveys [
28,
30] showed that on average 65% of the respondents were between 20 and 40, and about 23% between 40 and 50 years old. Furthermore, about 56% had a high-school or higher education degree. About 50% of the respondents in one survey considered their current profession as computer science related [
30] and another survey showed that about 50% had some sort of GIS background [
28], highlighting that “the OSM community does not constitute with GIS amateurs as is speculated in VGI” [
28].
Community-based projects, websites and portals such as OSM are oftentimes affected by so-called “participation inequality”. A 90-9-1 rule can usually be applied to most of these projects [
31]. This rule highlights that about 90% of the members of community-based projects are usually only consuming the collaboratively collected information, while 9% occasionally contributes to the project and only 1% demonstrate a very active pattern. This rule can be applied to projects such as Wikipedia [
32,
33] and has also been tested for the OSM project. In 2007, about 28% of the 120,000 members of the project actively contributed any data [
28]. In 2011, about 38% of the 500,000 members made at least one change to the dataset [
16]. Additionally, only 3% of all members actively contributed to the project each month. However, considering values from prior years the recent number of active contributors is not increasing in the same pattern as the total number of registered members. At the end of 2012, of the almost 1 million registered OSM members on average only 18,000 members, less than 2% actively contributed to the project each month [
34].
The increasing popularity of OSM also comes with caveats such as cases of vandalism, similar to developments seen in Wikipedia. An analysis carried out in 2012 revealed that for a timeframe of one week at least one case of vandalism could be detected in the OSM database each day [
35]. It needs to be noted though that these cases of vandalism can also be accidently created by new or inexperienced members and are not always intentional.
3. Selected Urban Areas and Data Sources
Several definitions from different sources help to distinguish urban or agglomerated areas from rural areas, which is a crucial point for the analysis presented in this article. Demographia defines urban areas as: “A continuously built up land mass of urban development that is within a labor market (
i.e., metropolitan area or metropolitan region), without regard for administrative boundaries (
i.e., municipality, city or commune)” [
36]. The identification of these areas is usually based on maps and satellite images that estimate the continuous urbanized area [
36]. It is also important to distinguish between urban areas and metropolitan areas in which: “A metropolitan area is an urban area plus the satellite cities around the urban area and the agricultural land in between.” Since these factors could potentially influence the results of the analysis conducted, it was decided to use urban areas instead of metropolitan areas to avoid forests, agricultural and other uninhabited areas in the selected regions.
A variety of online sources allow Internet users to retrieve freely available urban area information. However, oftentimes sources show inconsistencies in their provided information due to different geographical definitions of urban areas [
37]. Since none of the available sources, such as Natural Earth Data or CORINE, provided the information needed for a comprehensive comparison of worldwide urban areas, it was decided to trace the urban area boundaries based on Bing satellite imagery. The center of each polygon was primarily based on the location of the city name feature in the standard OSM map. The urban area sizes that were implemented during the polygon generation and their corresponding population information were retrieved from Demographia [
36].
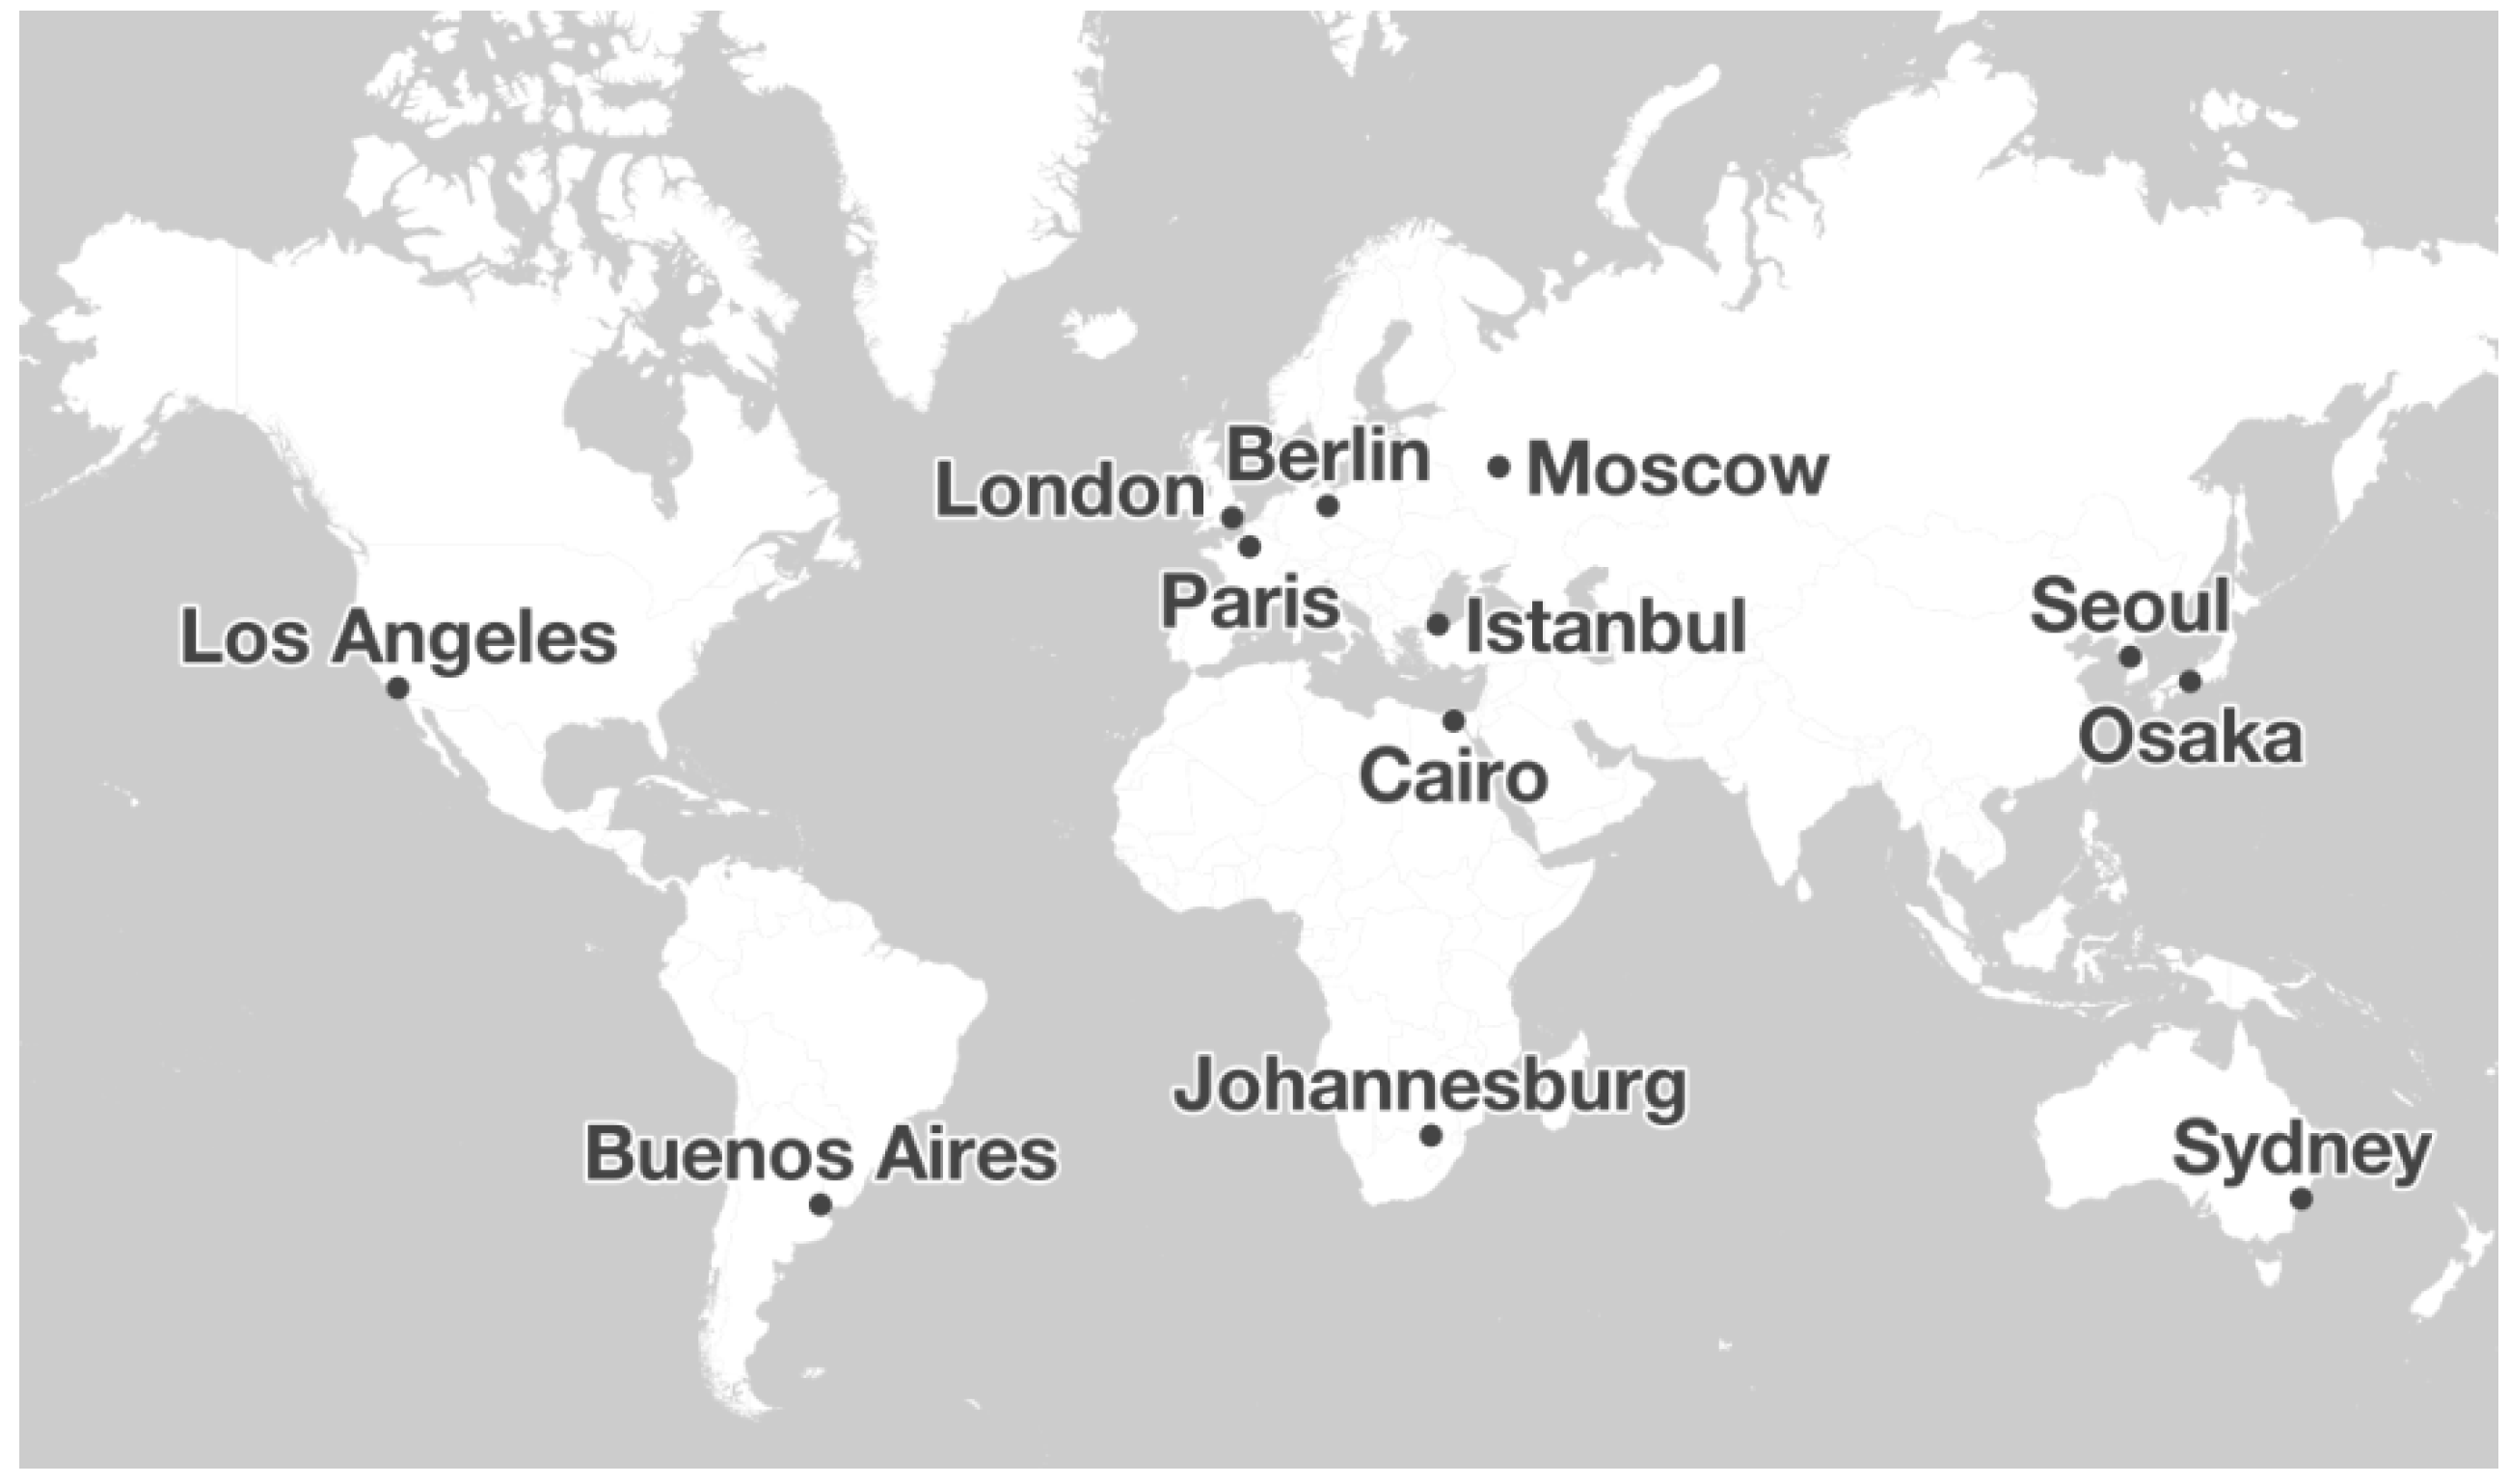
Figure 1 shows a world map highlighting the selected regions for which urban area polygons were generated.
During the urban area selection for the analysis it was decided to choose at least one large, well-known urban area (city) for each continent to provide world wide information. In total, 12 urban areas and their related area extent, absolute and population density information were chosen as shown in
Table 1.
Figure 1.
Overview of the selected urban areas.
Figure 1.
Overview of the selected urban areas.
Table 1.
Selected urban areas. Source: Demographia [
35].
Table 1.
Selected urban areas. Source: Demographia [35].
| Country | City | Population in 2011 | Area (km2) | Density (/km2) |
|---|
| Germany | Berlin | 3,453,000 | 984 | 3,509 |
| Argentina | Buenos Aires | 13,639,000 | 2,642 | 5,162 |
| Egypt | Cairo | 14,718,000 | 1,658 | 8,877 |
| Turkey | Istanbul | 13,576,000 | 1,399 | 9,704 |
| South Africa | Johannesburg | 7,618,000 | 2,525 | 3,017 |
| United Kingdom | London | 8,586,000 | 1,623 | 5,290 |
| United States | Los Angeles | 14,900,000 | 6,299 | 2,365 |
| Russia | Moscow | 15,512,000 | 4,403 | 3,523 |
| Japan | Osaka-Kobe-Kyoto | 17,011,000 | 3,212 | 5,296 |
| France | Paris | 10,755,000 | 2,845 | 3,780 |
| South Korea | Seoul-Incheon | 22,547,000 | 2,163 | 10,424 |
| Australia | Sydney | 3,785,000 | 1,788 | 2,117 |
After the areas of interest were defined, generated and included all desired information for analysis, an OSM history dump file was retrieved from the OSM project [
38]. This particular file includes the entire history (versions) of all geodata that is included in the worldwide OSM database until October 19, 2012. Doing so enabled us to analyze the potential development of the datasets for each urban area for the past few years by clipping the information from the worldwide dataset and applying Java based tools that were specifically developed for this research project.
4. Results
A number of different analyses were conducted to provide detailed information on the development of OSM data, number of contributors and member activities in the selected urban areas in relation to population and other socio-economic factors such as income. The main goal was to identify significant differences or similarities between the selected urban areas to approve or reject findings from prior research, which solely focused on European cities and selected areas in the US.
4.1. Contributor Numbers and Activity Spectrums
One of the most important factors of projects such as OSM that rely on volunteered data contributions is the activity of the community in the project. The active members do not only contribute new data but also keep existing data up to date or improve it over time. It was shown that an increasing number of contributors within an area also improve the positional accuracy of the geodata, one of many geodata quality assessment criteria [
11].
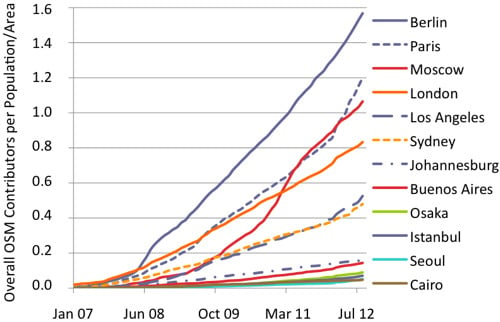
Figure 2 shows the development of the OSM community for each urban area from January 2007 to September 2012. The absolute number of OSM members has been normalized by the population density in each urban area to reduce the impact of the size of the city area on the results. The urban area names appear next to
Figure 2 in descending order based on the values retrieved from the datasets.
Figure 2.
Number of OpenStreetMap (OSM) Contributors per Population/Area-ratio (Jan. 2007–Sept. 2012).
Figure 2.
Number of OpenStreetMap (OSM) Contributors per Population/Area-ratio (Jan. 2007–Sept. 2012).
The diagram shows that Berlin, Paris, Moscow and London have higher values in comparison to other urban areas that were tested when considering the relation between the number of OSM members and the total population density. Generally, there are three groups that can be distinguished. The four aforementioned cities fall into a group with the highest values, while Los Angeles and Sydney create the second group with average values. The third and last group inherits all other urban areas
i.e., Johannesburg, Buenos Aires, Osaka, Istanbul, Seoul und Cairo with values smaller than 0.20. The statistical analysis showed, however, that there is no correlation between the number of contributors and the population density in the tested areas (Spearman’s rho R
S value of −0.140).
Figure 2 also shows the significantly different increase in member numbers for the different areas within the past four years. The urban areas showing the smallest values for current active contributors to the project also reveal the least impressive increase over time.
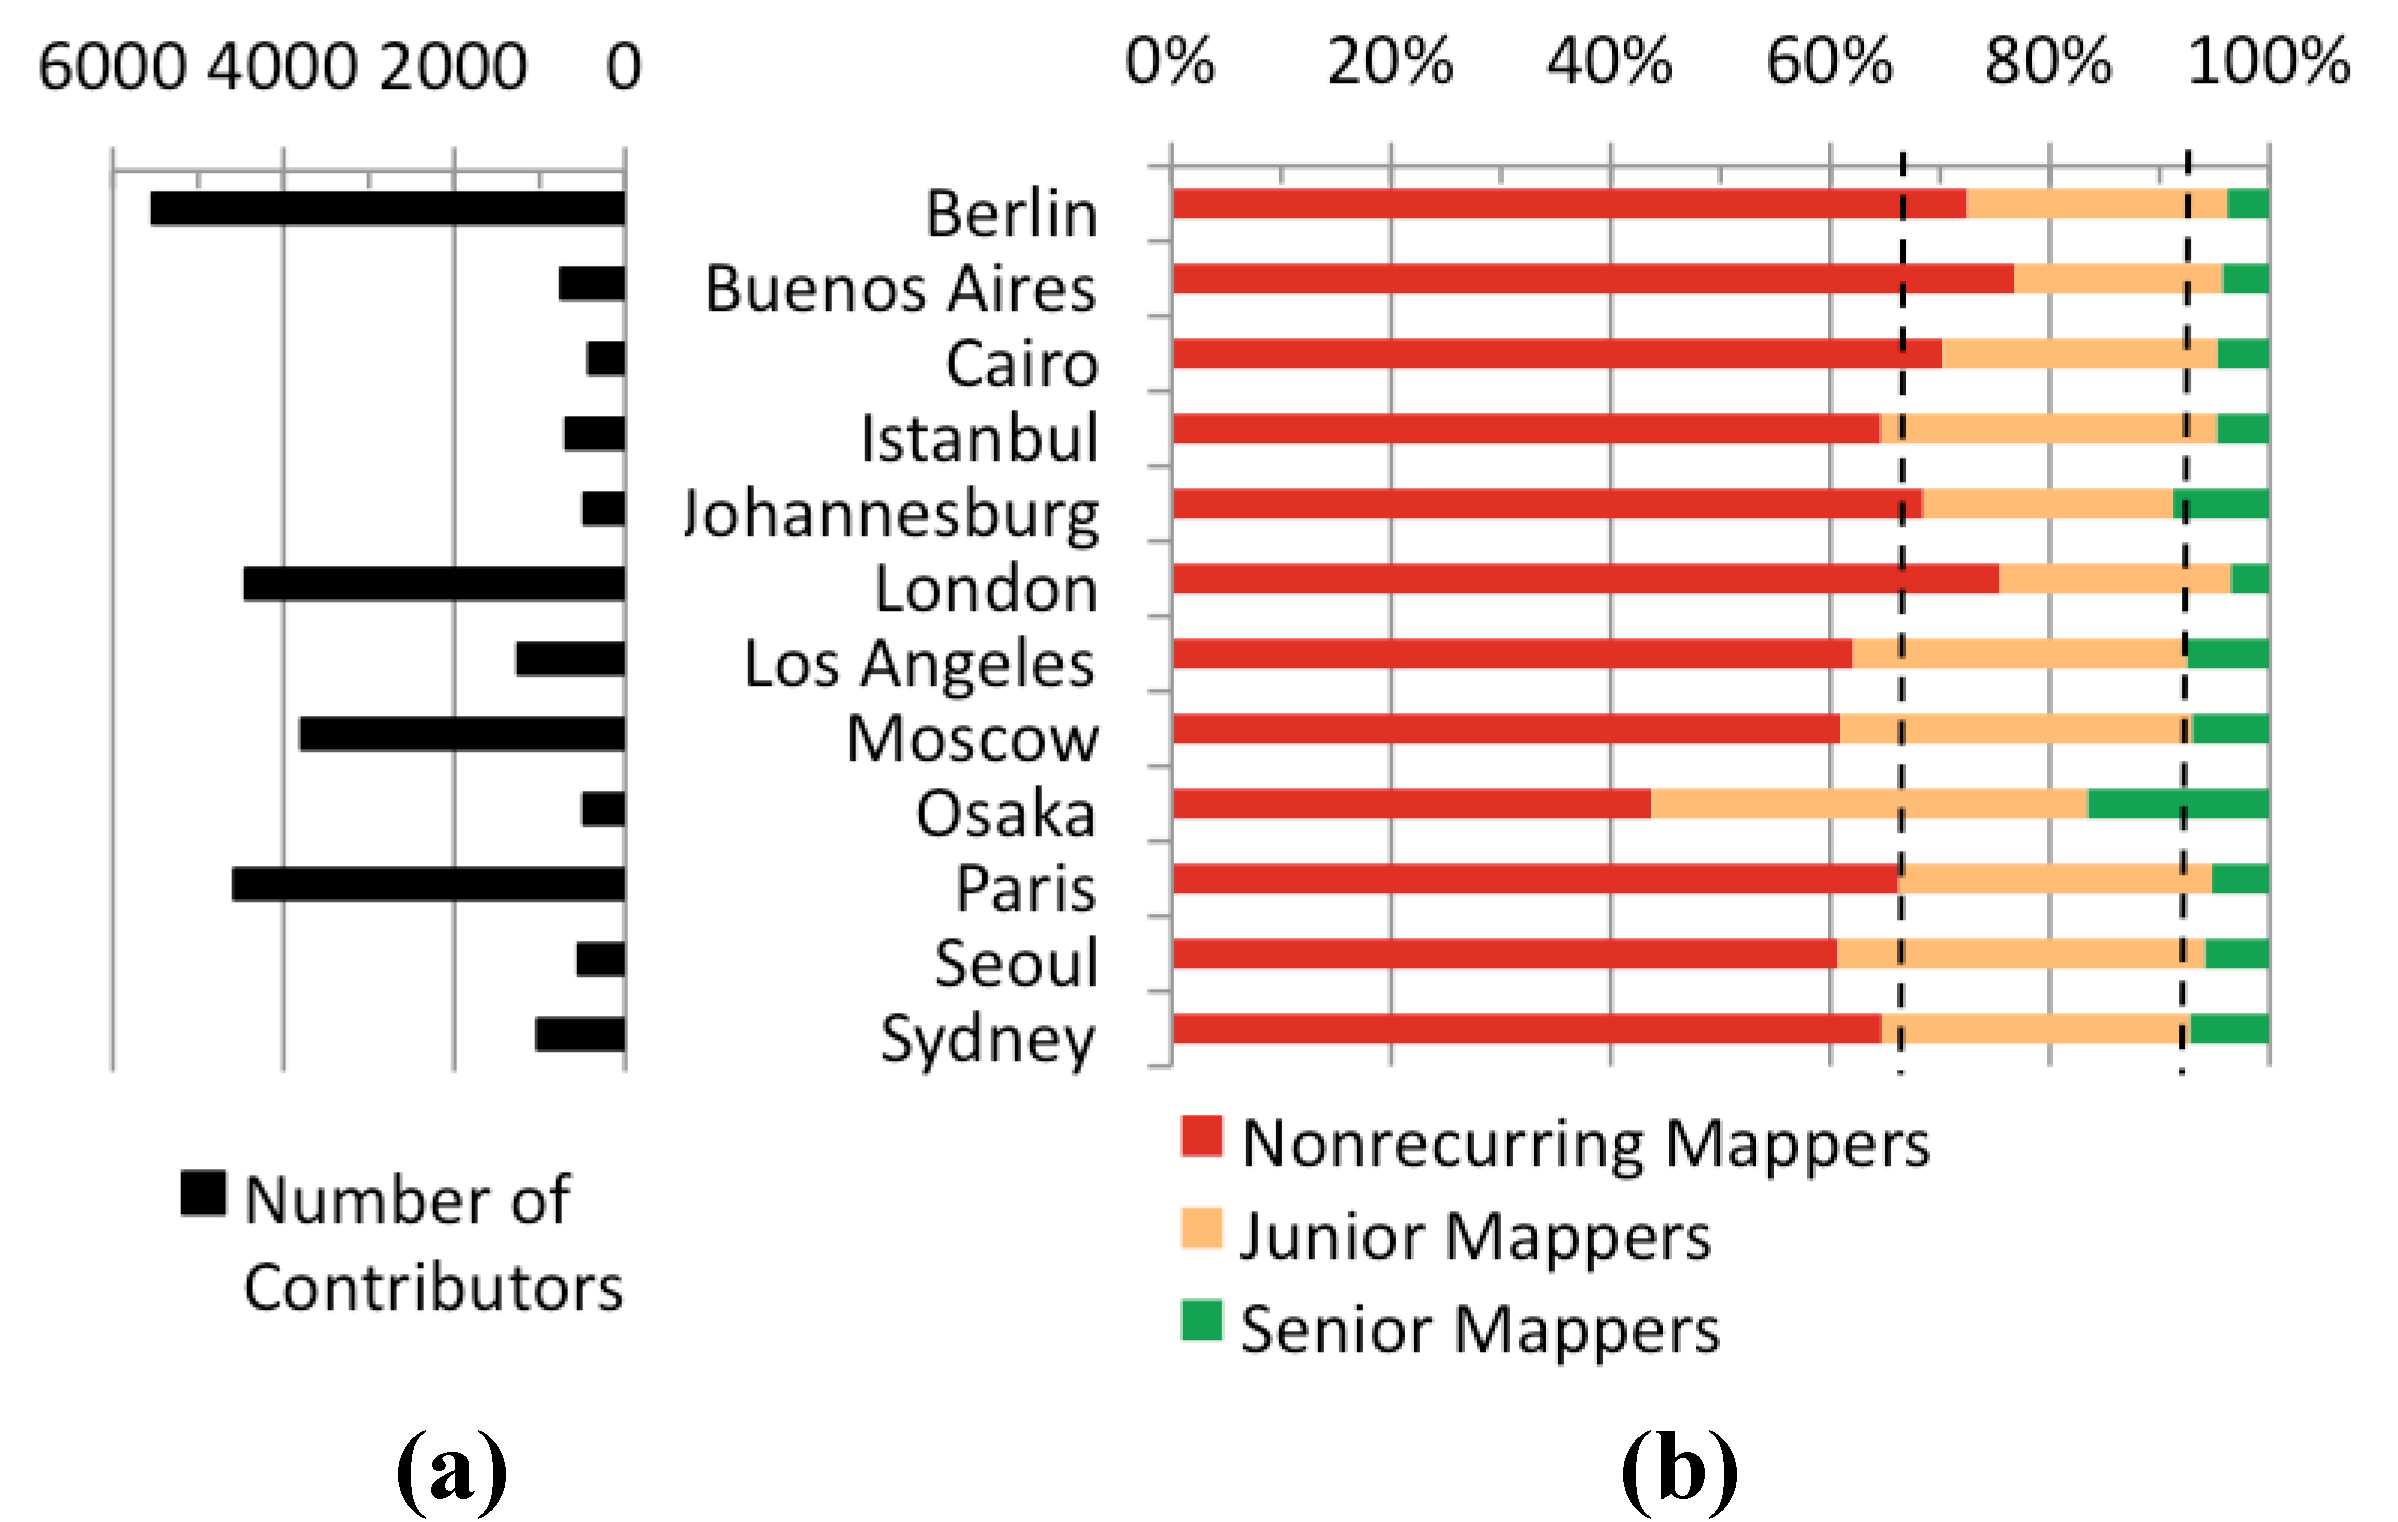
Although the total number of OSM members in an area might give some prior impression about the potential data contributions that could occur in an area, it does not take the actual activity spectrum of the members into consideration. A smaller group of very active data contributors could achieve similar results in data collaboration efforts as a large group of mappers with very limited contributions. Thus, the following analysis divided the registered members for each urban area into different mapper groups as introduced in a prior publication [
16]. Different thresholds, based on the number of Nodes an OSM member created, helped to distinguish the different mapper groups. If a mapper created less than ten nodes she/he falls into the “Nonrecurring Mapper” group, less than 1000 Nodes identify “Junior Mappers” and more than 1000 Nodes identify mappers that are part of the “Senior Mapper” group.
Figure 3a shows how many members have actively contributed to the project by making at least one edit (creation, modification or deletion) to an object, while
Figure 3b shows the distribution of the members based on the aforementioned classification schema.
Figure 3.
(a) Number of contributors; and (b) Distribution of mapper groups per urban area (Sept. 2012).
Figure 3.
(a) Number of contributors; and (b) Distribution of mapper groups per urban area (Sept. 2012).
The results presented in
Figure 3a, representing the absolute numbers of OSM contributors, show a similar pattern as the relative values shown in
Figure 2, with larger values for all European cities and Moscow. Seoul, Istanbul, and Cairo, the three urban areas with the highest population density values of all tested areas, do not show similarly high values for the number of contributors, indicating that population density is not a major factor for data contributor numbers in OSM. The vertical dashed lines in
Figure 3b represent the average values for each corresponding mapper group for all areas. This additional information helps to prove that almost all urban areas, with the exception of Osaka, show similar distributions for the individual mapper groups. Only 6.6% (with a standard deviation of 3.5%) of all contributors in an urban area added a large amount of information with more than 1000 Nodes (“Senior Mapper”), while 65.5% of the mappers fall into the “Nonrecurring Mapper” category (standard deviation of 8.7%).The rest belongs to the “Junior Mapper” group with an average of 27.9% and a standard deviation of 5.9%. Due to the small number of members in Osaka and possibly data imports, the results gathered for this particular case do not match the general pattern of all other tested urban areas and can be considered as an outlier.
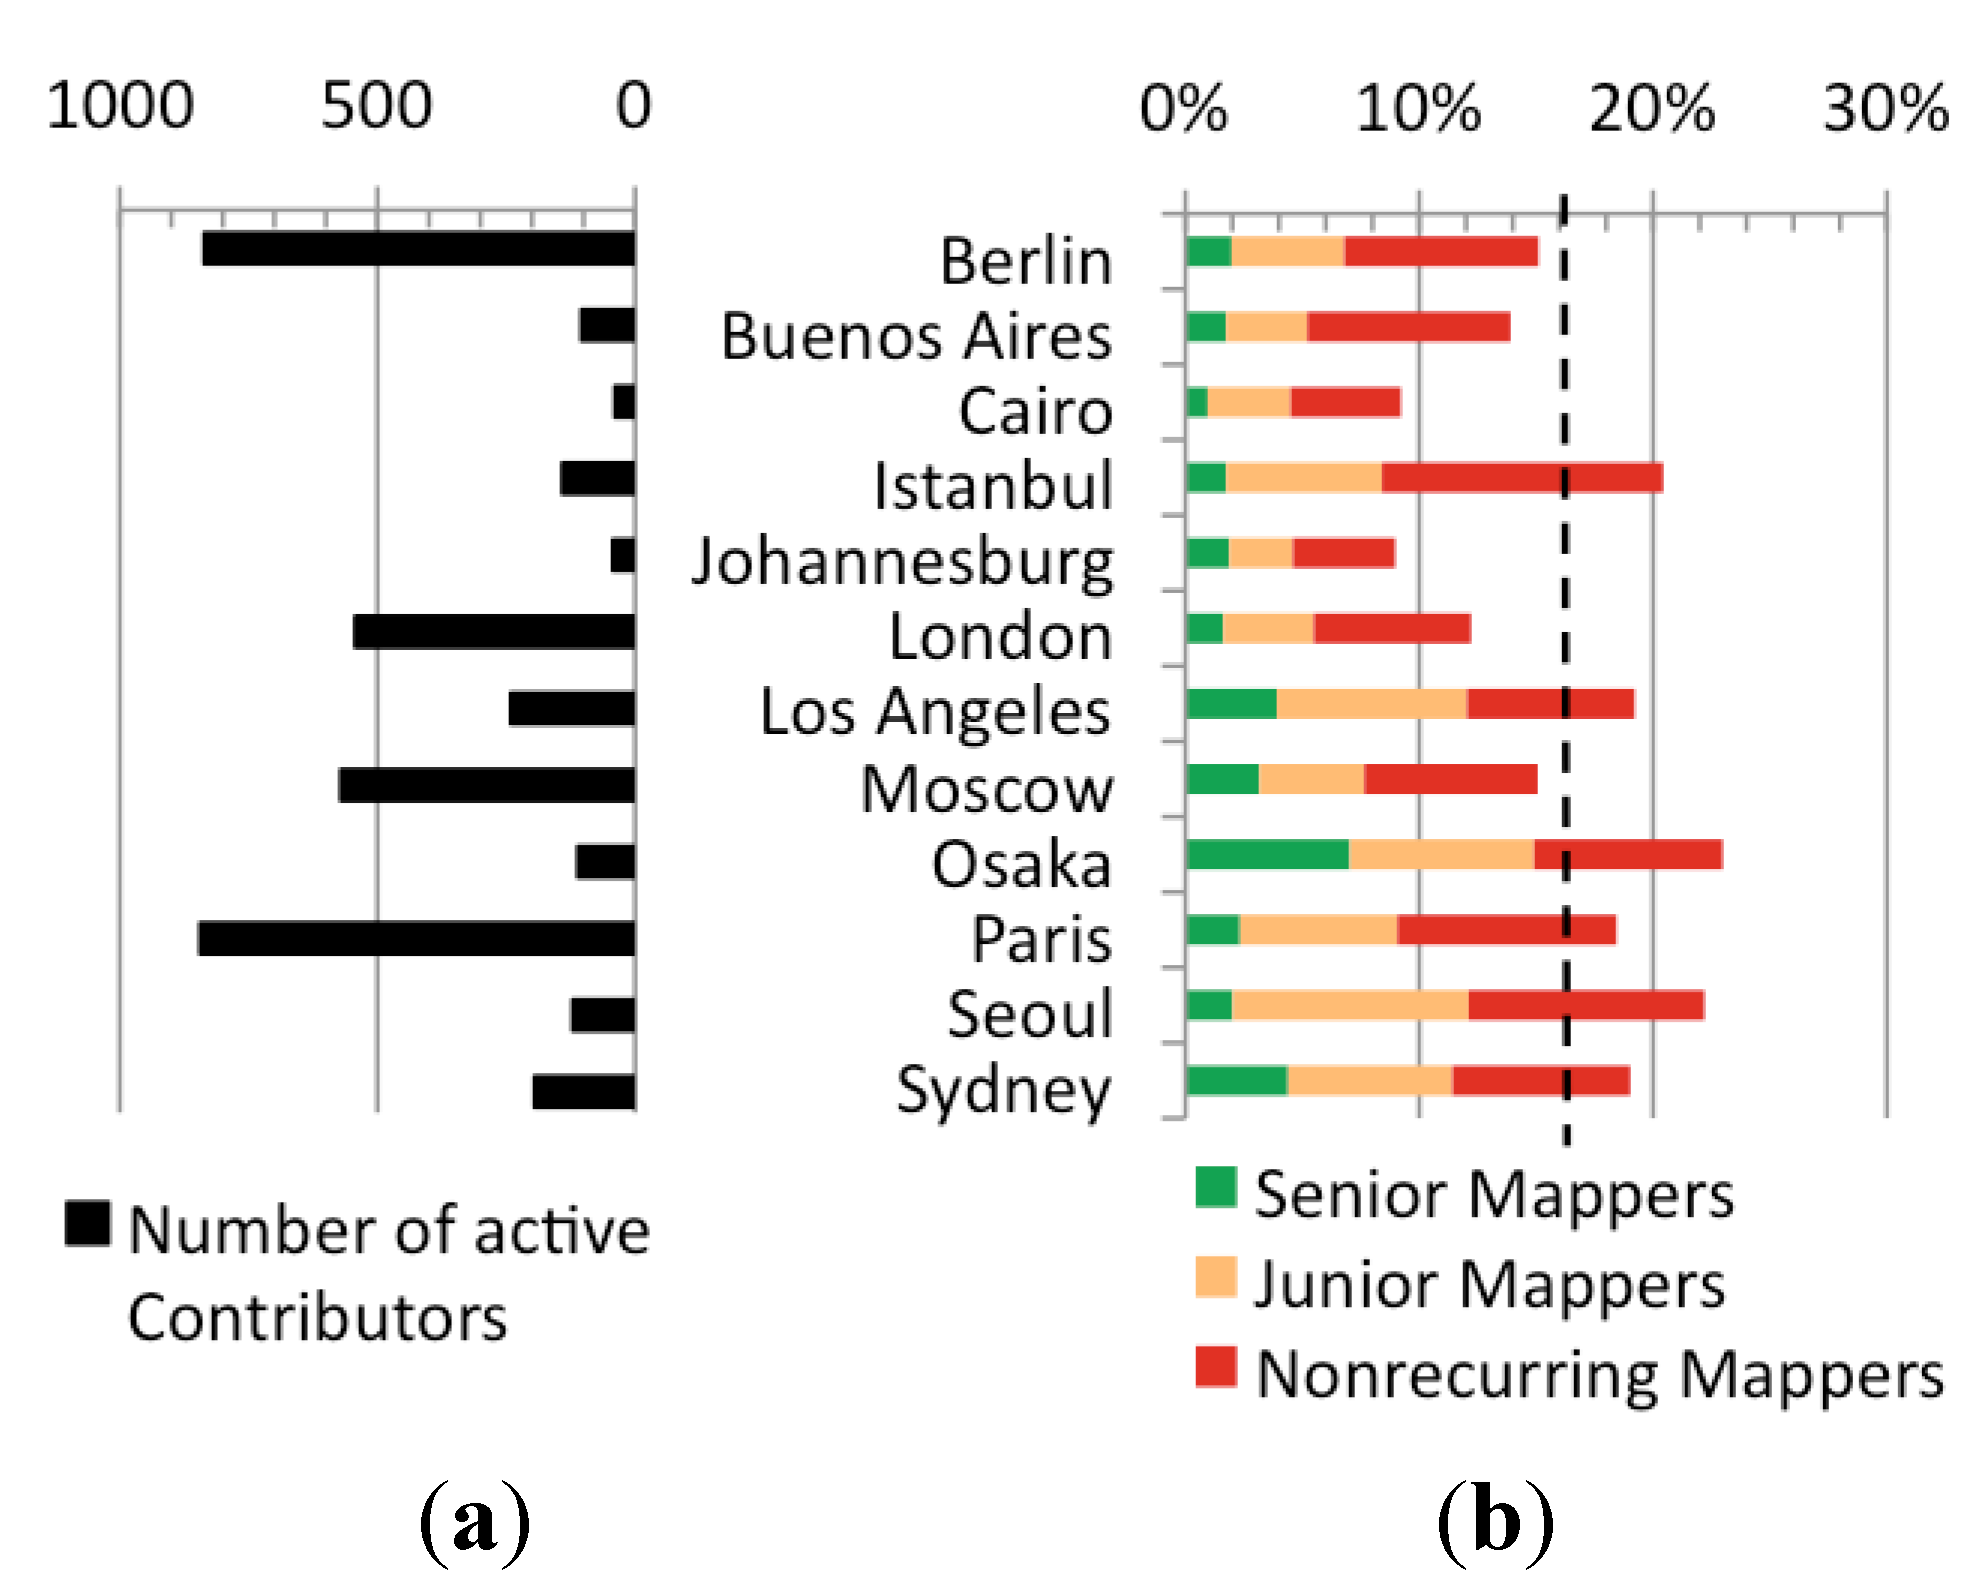
Next to the general contributions that a member makes to the project, it is also important to investigate the active time frame of a member. Prior research has shown that the contributors that fall into the different mapper categories also collect information for different time frames [
16]. While for the Wikipedia project prior research revealed that active contributors usually edit at least one article per month, in this analysis the time frame was expanded to three months to retrieve more meaningful results about the number of active contributors in each tested area.
Figure 4a gives an overview of the number of members that have been active between August and October 2012 by creating at least one Node in the selected urban areas.
Figure 4.
(a) Number of active contributors; and (b) Percentage of mapper group contributions per urban area (Aug.–Oct. 2012).
Figure 4.
(a) Number of active contributors; and (b) Percentage of mapper group contributions per urban area (Aug.–Oct. 2012).
Figure 4b shows the percentage of the total contributors in each area for the designated timeframe, again divided into the different mapper groups. On average about 16% of the total number of members that created at least one Node in the tested urban areas, have been active between August and October 2012.
Figure 4b also shows that the amount of contributors that are part of the “Senior Mapper Group” is very low with an average value of less than 3%.
4.2. Dataset Quantity
A first impression about the quality of the OSM dataset can be gathered by investigating the quantity of the collected information in the designated areas.
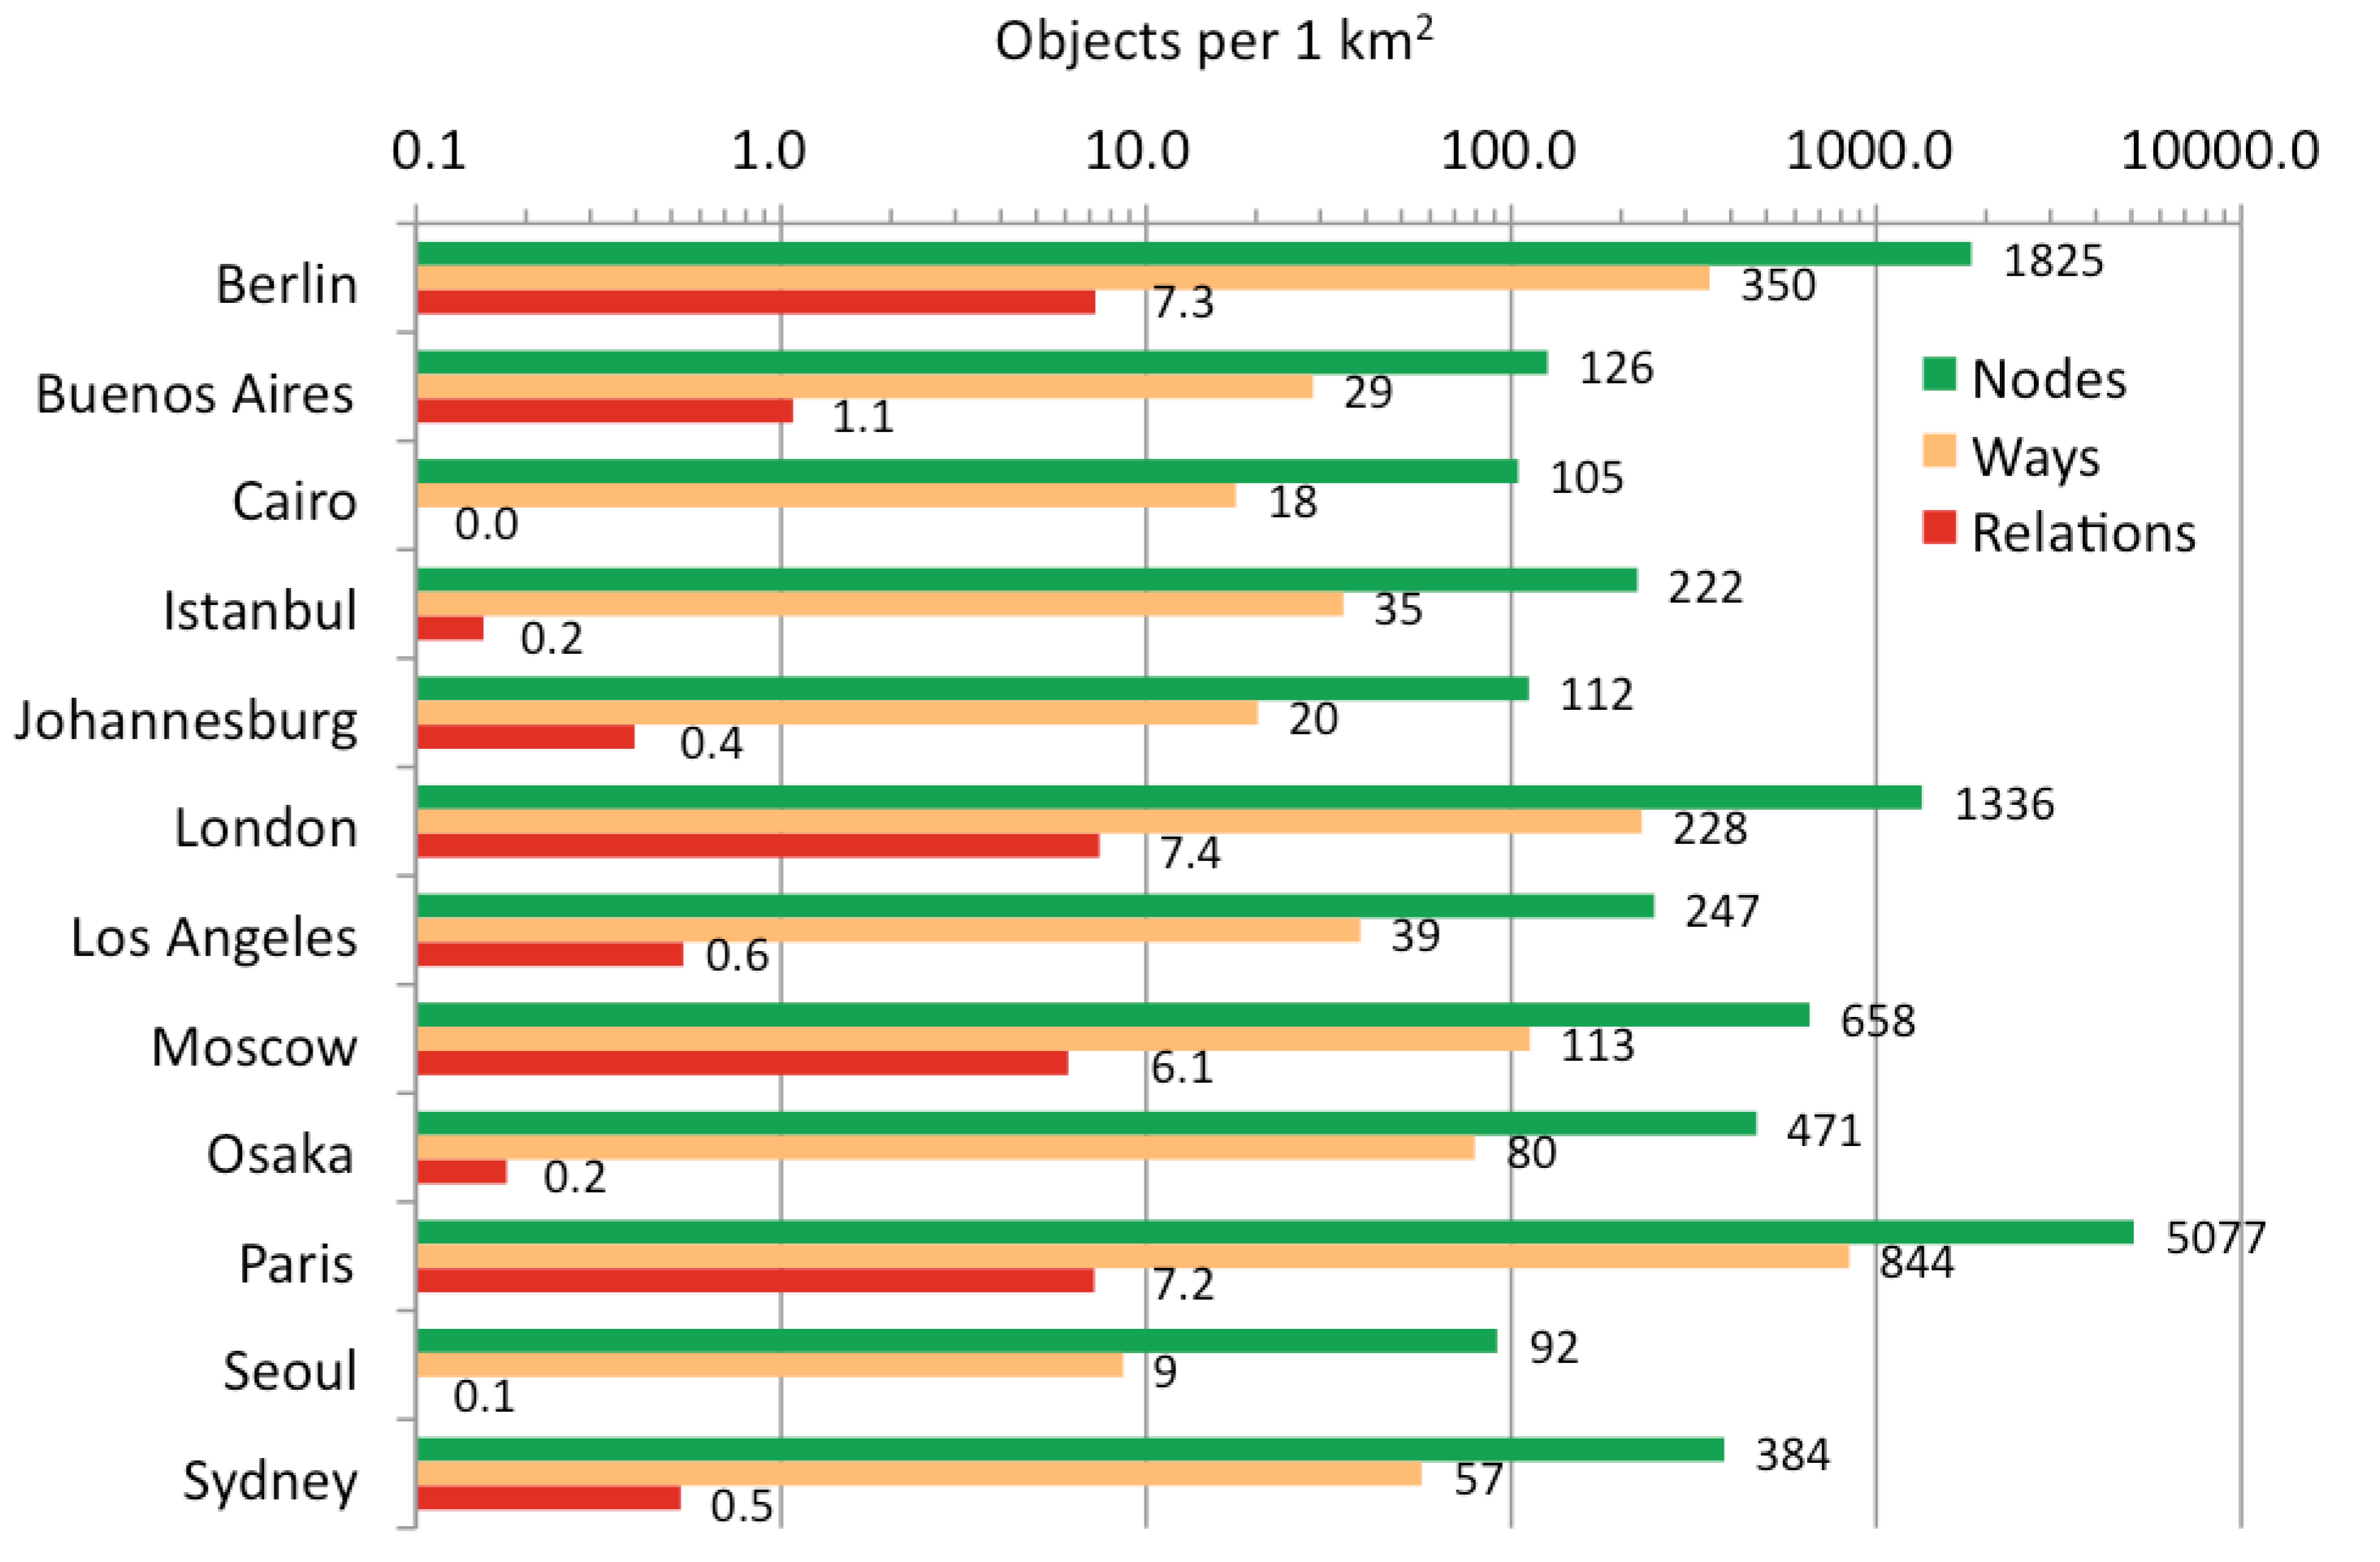
Figure 5 shows the total number of Nodes, Ways and Relations collected in each urban area per km
2. The results show that Paris has the highest contributed object density, which is partially based on a large data import of cadastral building information and not necessarily only based on active contributions. However, for Osaka different data imports were applied to the OSM dataset as well but did not show the same results as in Paris when considering the object density. Especially the concentration of Relation information, which is added via a more complex process and is usually conducted by experienced contributors, separates the more advanced cities such as Berlin, London, Moscow and Paris from less complete cities such as Cairo, Istanbul and Seoul.
Figure 5.
Density of nodes, ways & relations per km2 (Oct. 2012).
Figure 5.
Density of nodes, ways & relations per km2 (Oct. 2012).
Figure 5 also supports prior findings about the strong concentration of OSM data in European urban areas in comparison to other continents, in which Istanbul is the only exception for a European urban area with lower data density and Moscow an exception for a non-European urban area with strong data collection efforts. Overall the number of collected OSM objects in the tested areas correlates with the number of contributors per area. For Nodes and Ways the results showed a R
S value of 0.6783 and for Relations one of 0.720.
4.3. Temporal Dataset Quality
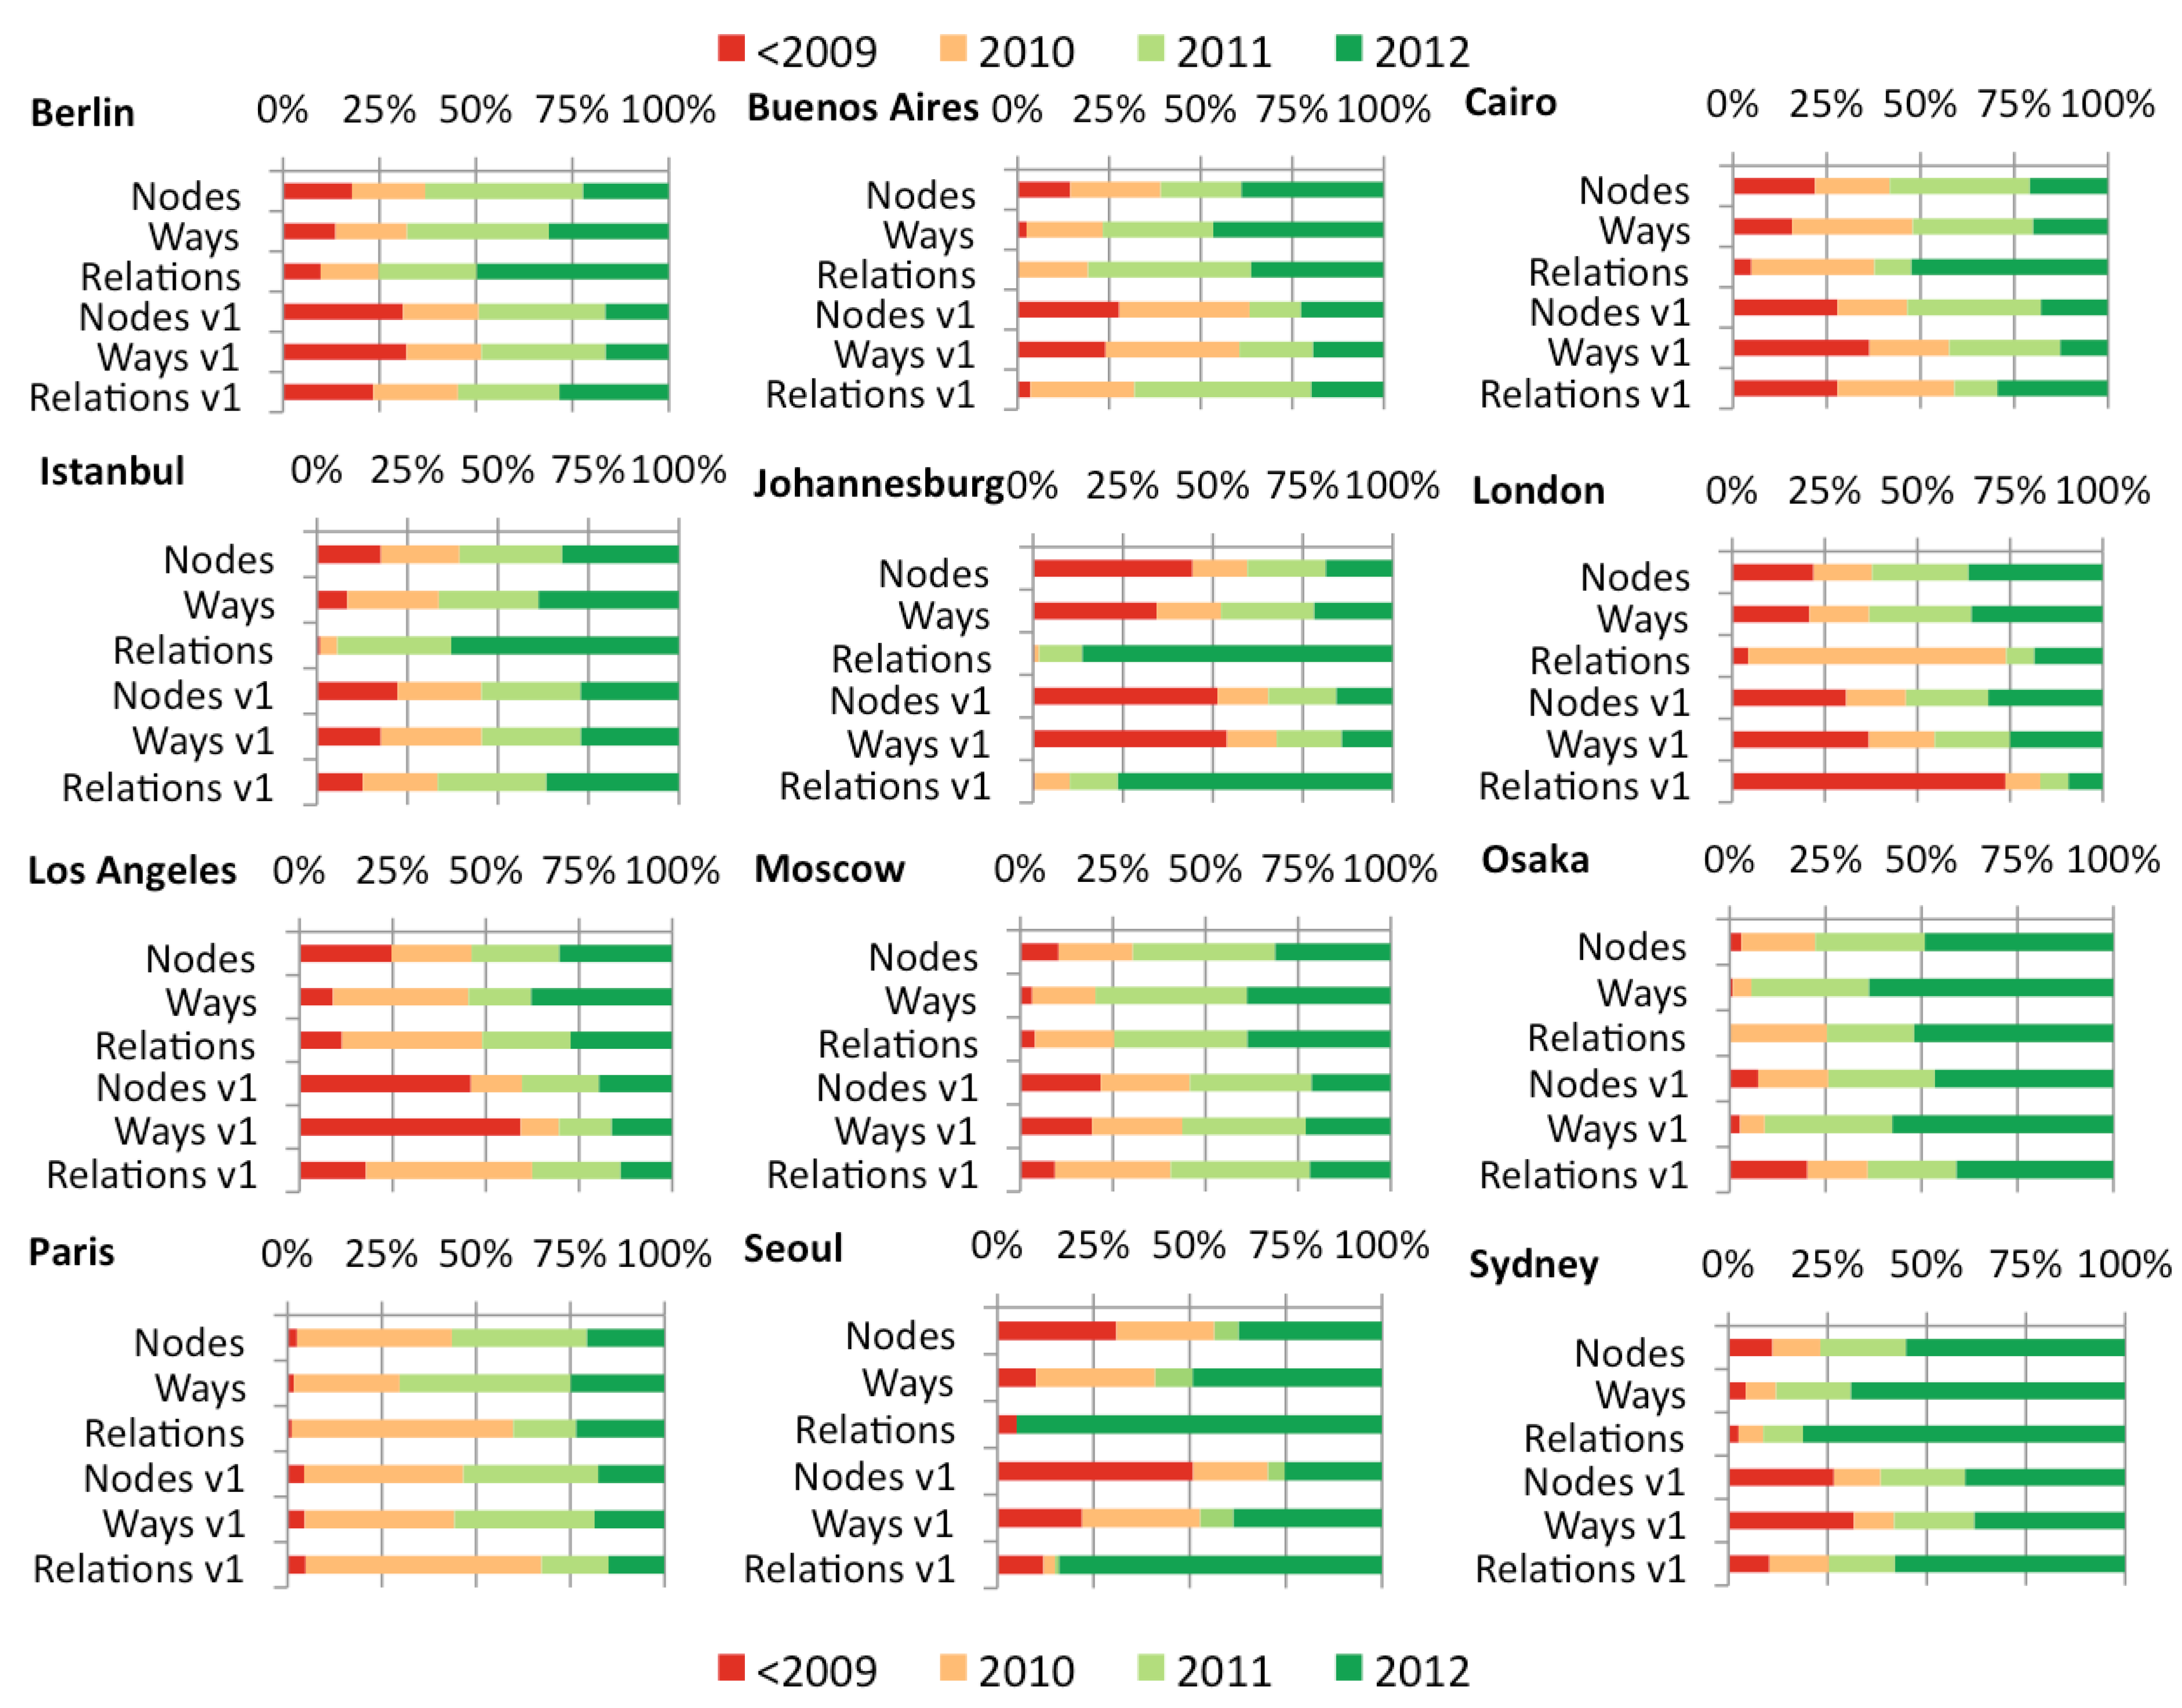
The timeliness of the collected information plays a major role in the quality assessment of a geodataset such as OSM. Each object in the OSM database is related to a unique timestamp, which represents the time at which the object was edited the last time. Additionally each edited object has a version-number indicating how many times the object has been changed since its first creation. By utilizing this information and combining it with the OSM history dump file, it is possible to determine when an object has been created and when and how often it has been edited.
Figure 6 shows the collected temporal accuracy information for all 12 analyzed areas based on the OSM history dump file dated 19 October 2012. The first three Nodes, Ways, and Relations bars of each diagram represent the distribution of the currency of the objects based on the timestamp information of the entire dataset. The larger the dark green area of the bar, the more up-to-date is the particular dataset. The first three bars are followed by a second set of Nodes v1, Ways v1 and Relations v1 bars for each tested area. The information provided in these bars shows when an object,
i.e., the first version of the object, was created. Therefore, it is possible to determine for how long and how much data has been contributed to each area over the past few years. The comparison of the three upper and three lower bars provide detailed information if a dataset has been updated by the OSM community. If the bars show a similar pattern to each other e.g. Nodes and Nodes v1, it would indicate that the data has not been updated since its creation.
Figure 6.
Distribution of currency and data versions per urban area (Oct. 2012).
Figure 6.
Distribution of currency and data versions per urban area (Oct. 2012).
The comparison of the diagrams for Berlin shows that the currency information is similar to the objects labeled as first version. Moscow, Paris and Buenos Aires show similar patterns. The aforementioned data imports for France are also represented in the diagrams for Paris, with a strong concentration of data contributions in 2010. For London, the results revealed that the majority of Relations were created before or in 2009, yet the timestamp of most Relations is dated within 2010. The strong increase in Relations in the dataset in 2009 can again be attributed to a data import. However, the diagram also shows that after the import the community has been updating the information in 2010, thus most Relations show a 2010 timestamp. Sydney proves to be one of the most up-to-date datasets in OSM. One possible reason for this pattern could be the OSM license change in 2012. Due to the license change, all data that was contributed by members that explicitly did not agree with the new license was deleted from the database, including all data that was imported from sources whose license was no longer compatible with the new OSM license. After the deletion of the data it was partially recollected by the local members that agreed to the new license. Cairo, Johannesburg, Seoul and Los Angeles show less up-to-date datasets in comparison to the other analyzed areas. The temporal OSM dataset quality is better in areas with a stronger community activity. The correlation between the number of contributors in an area and the number of newly created objects in 2012 proof to be high for Nodes (RS 0.755), Ways (RS 0.720) and Relations (RS 0.832). With regards to the contributions by the individual mapper groups the numbers showed that on average 94.6% of all Nodes, 92.8% of all Ways and 84.8% of all Relations were collected by Senior Mappers.
4.4. Local and External Mappers
Although OSM is based on collaborative data collection efforts by volunteers, companies such as Yahoo Imagery (until 2011) and Microsoft Bing [
39] have been supporting the project by providing their satellite imagery to the project’s members to trace information directly from the images. This also allowed members to collect information for areas that they maybe never physically visited or where no local knowledge is available. The OSM project does not provide any direct information about the home location of the members. However, prior research has introduced different methods on how to determine an activity spectrum or area of a member [
16]. One of the introduced processes has been applied to determine the location of a member for the selected urban areas. The process is collecting information from all changesets provided by OSM for each member. Changesets are rectangle shaped polygons that surround the area in which a designated member has been making changes to the dataset. By utilizing the center points of all changesets that were created for a single member it is possible to create a final polygon which represents the main activity area of a mapper [
16]. Based on the newly created polygons a distance between the polygon and the designated urban area can be measured. The measured distance gives clues whether the data contributor is a local or external mapper. For classification purposes the differences were divided into three groups representing a distance of less than 100 km, more than 100 km and less than 1000 km and more than 1000 km. A distance of less than 100 km to the corresponding urban area would indicate a local mapper and a distance larger than 1000 km would represent an external mapper.
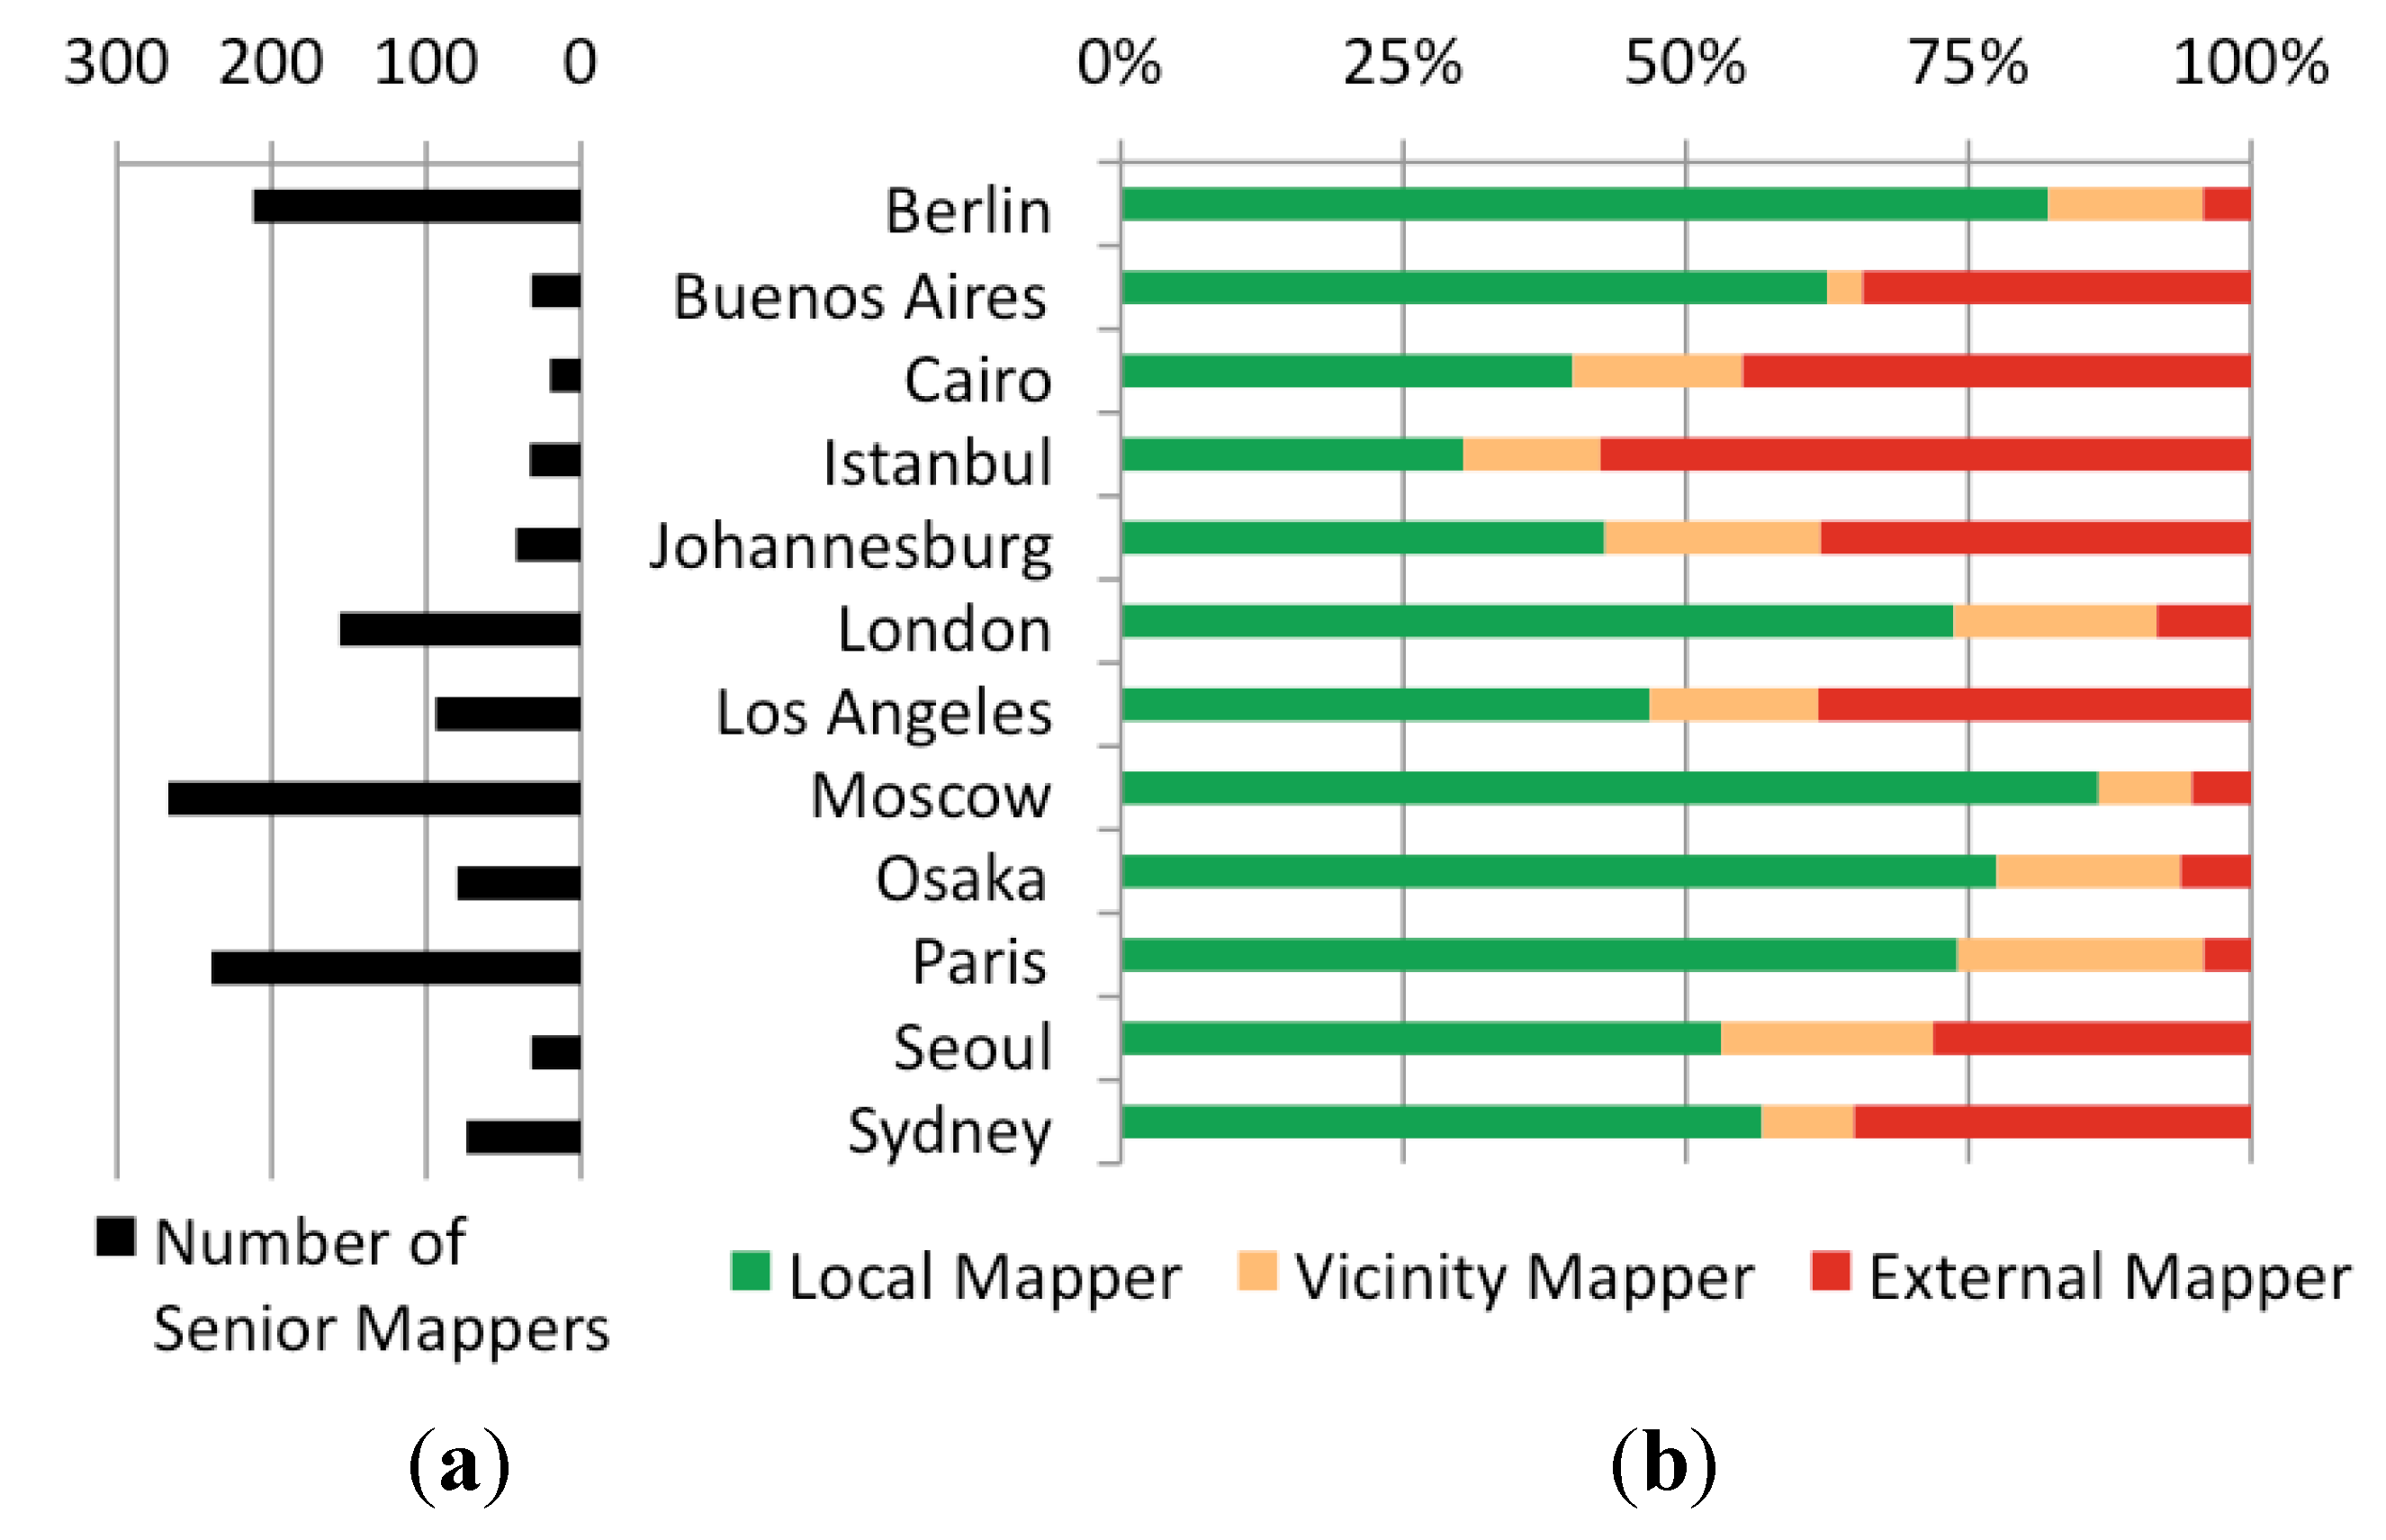
Figure 7 shows the distribution of local and external mappers for all tested areas. The distribution of the contributors represented in the figure is based on the Senior Mapper group. Similar results were retrieved when conducting an analysis with the Junior and Nonrecurring Mapper groups.
Figure 7.
(a) Number of senior mappers per urban area; and (b) Distribution of senior local or external mappers per urban area (Oct. 2012).
Figure 7.
(a) Number of senior mappers per urban area; and (b) Distribution of senior local or external mappers per urban area (Oct. 2012).
Figure 7 clearly shows that not all urban areas merely rely on local mappers. Areas with higher member numbers generally show smaller contributions by external mappers. The statistical analysis, however, does not show any correlation between the two variables for the selected areas (R
S −0.16). Cairo, Istanbul, Johannesburg and Los Angeles revealed some surprising results. Although Los Angeles has a higher number of members in OSM than Johannesburg, both urban areas show similar patterns when considering external mapper activities. The largest external mapper contributions were found for Cairo (almost 50%) and Istanbul (more than 50%), indicating that the main activity area of these mappers is more than 1000 km away from these particular urban areas. Reasons for these patterns could be the increased Internet accessibility in other countries or the popularity of these particular areas for tourism, which attracts more external mappers. However, this statement is only based on speculation.
4.5. Average Contributions by Active OSM Members
The analyses presented thus far focused on the estimation of the absolute number of OSM members and the determination of active members in each urban area. Another important factor that needs to be considered is the quantity in which an active member contributes to the project. In the following analysis only active members that are part of the aforementioned Senior Mapper group and that did not participate in any data imports for the urban areas have been investigated. The main goal was to retrieve detailed information about the average number of active days a Senior Mapper spends on data contributions to the project and how many objects on average were created in this timeframe in each urban area. The analysis was conducted for the three months prior to the creation date of the history dump file, October 19, 2012.
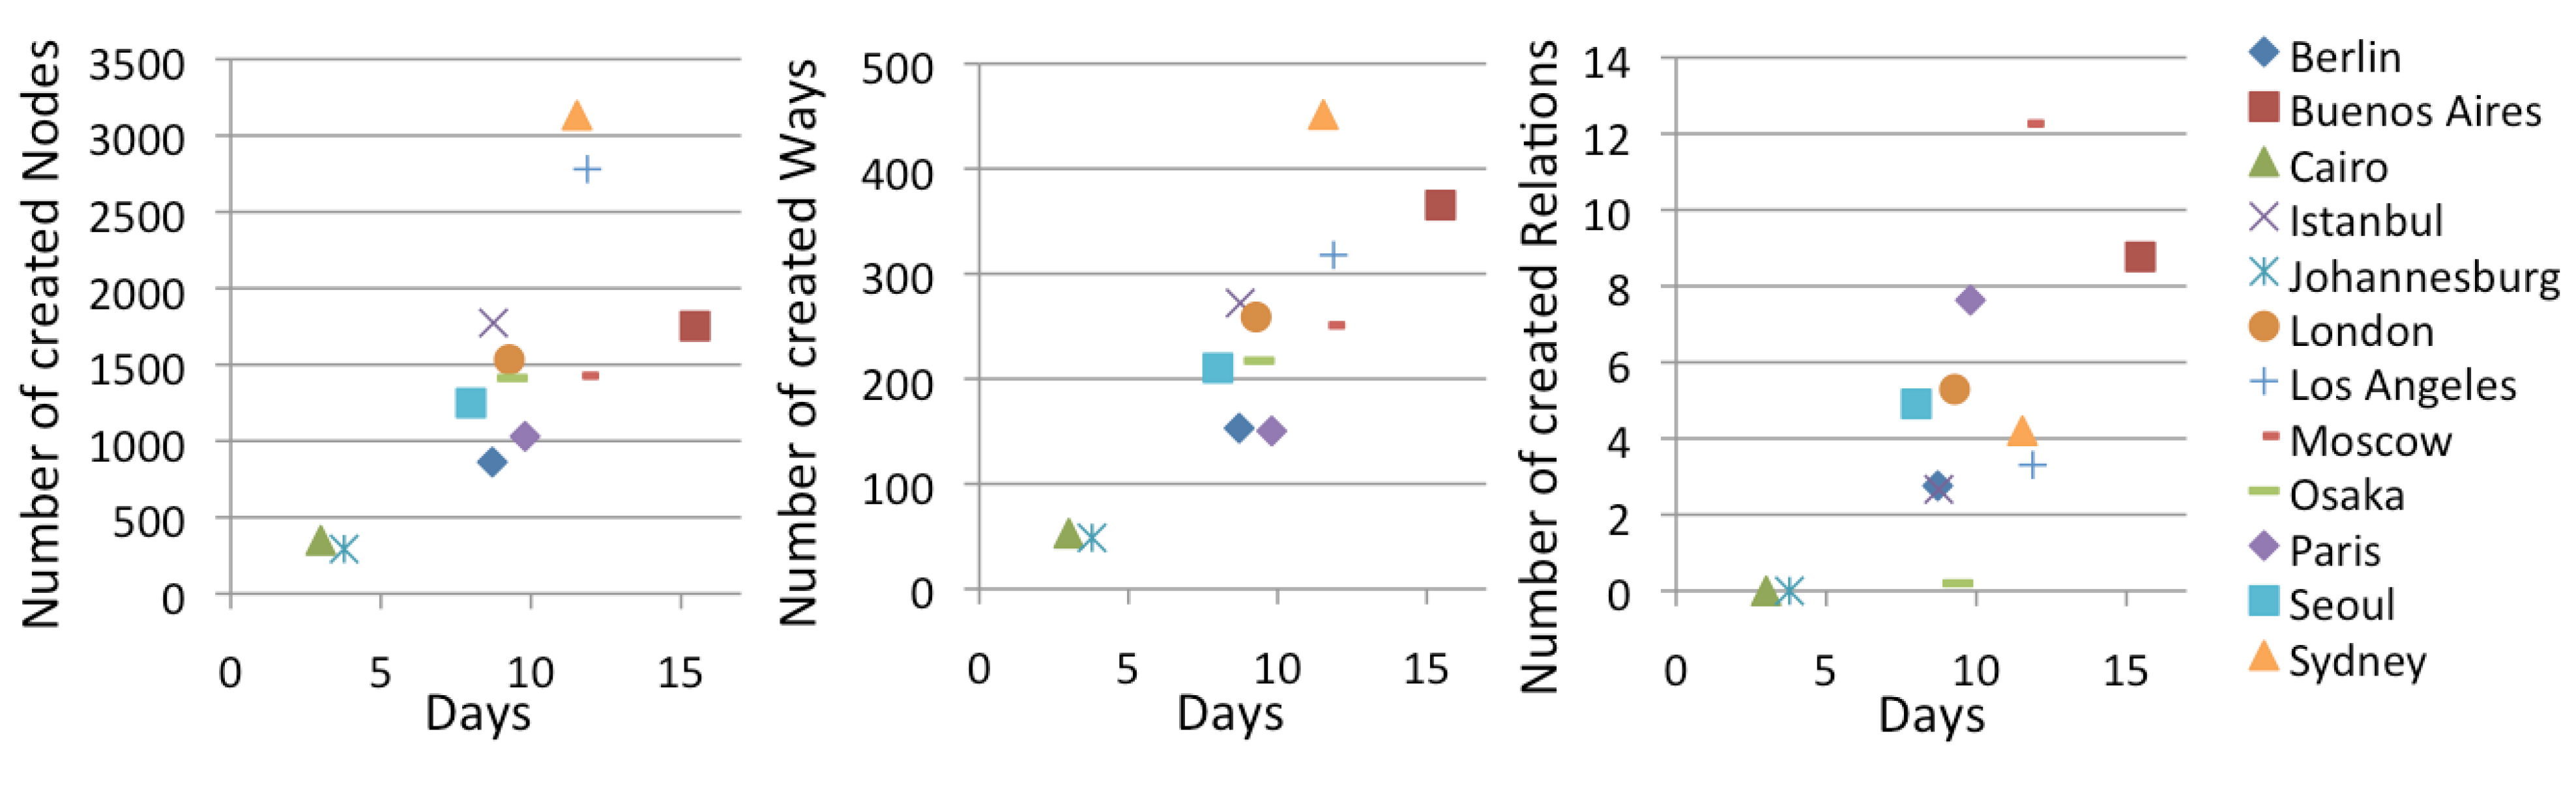
Figure 8 shows the average number of active days of all Senior Mappers and the number of Nodes, Ways and Relations created in this time frame for all tested areas.
Figure 8.
Average Senior Mapper Activity Timeframe and Contributions per Urban Area (Aug.–Oct. 2012).
Figure 8.
Average Senior Mapper Activity Timeframe and Contributions per Urban Area (Aug.–Oct. 2012).
Although the absolute number of members for each tested urban area varies, the distribution of the different mapper groups proved to be alike. A similar result was revealed for the average contribution values and active days of the Senior Mappers. The total average values of all urban areas combined showed that a Senior Mapper is active for about 9 to 10 days and creates around 1466 Nodes, 229 Ways and 4 Relations (
Table 2). Additionally,
Figure 8 shows that particularly areas with very small communities can generate positive and negative outliers in this analysis such as Cairo and Buenos Aires. Similar to the result gathered during the temporal dataset quality analysis, Sydney appears to take an outlier role due to the same cause
i.e., OSM license change. The stronger Nodes and Ways contributions can be accredited to remapping efforts by the OSM community.
Table 2.
Activity timeframe and contributions of a senior mapper (Aug.–Oct. 2012).
Table 2.
Activity timeframe and contributions of a senior mapper (Aug.–Oct. 2012).
| Parameter | Min | Max | Mean value | Standard deviation |
|---|
| Active days | 3 | 15.5 | 9.3 | 3.4 |
| Nodes | 292.8 | 3133.0 | 1466.2 | 848.3 |
| Ways | 48.7 | 451.5 | 229.1 | 118.8 |
| Relations | 0.0 | 12.3 | 4.3 | 3.8 |
4.6. Impact of Socio-Economic Factors
GPS-enabled devices, Smartphones and computers with internet access have become omnipresent in many countries worldwide. The existence of these devices in each country does not automatically imply however that all citizens have access to them or have the financial resources to purchase them.
Figure 3 has shown that the OSM community of an urban area does not necessarily relate to the population density. Thus, one question that remains is if other socio-economic factors, such as income, have an impact on the development of an internet community for portals such as OSM. The Gross National Income (GNI) is defined by the World Bank [
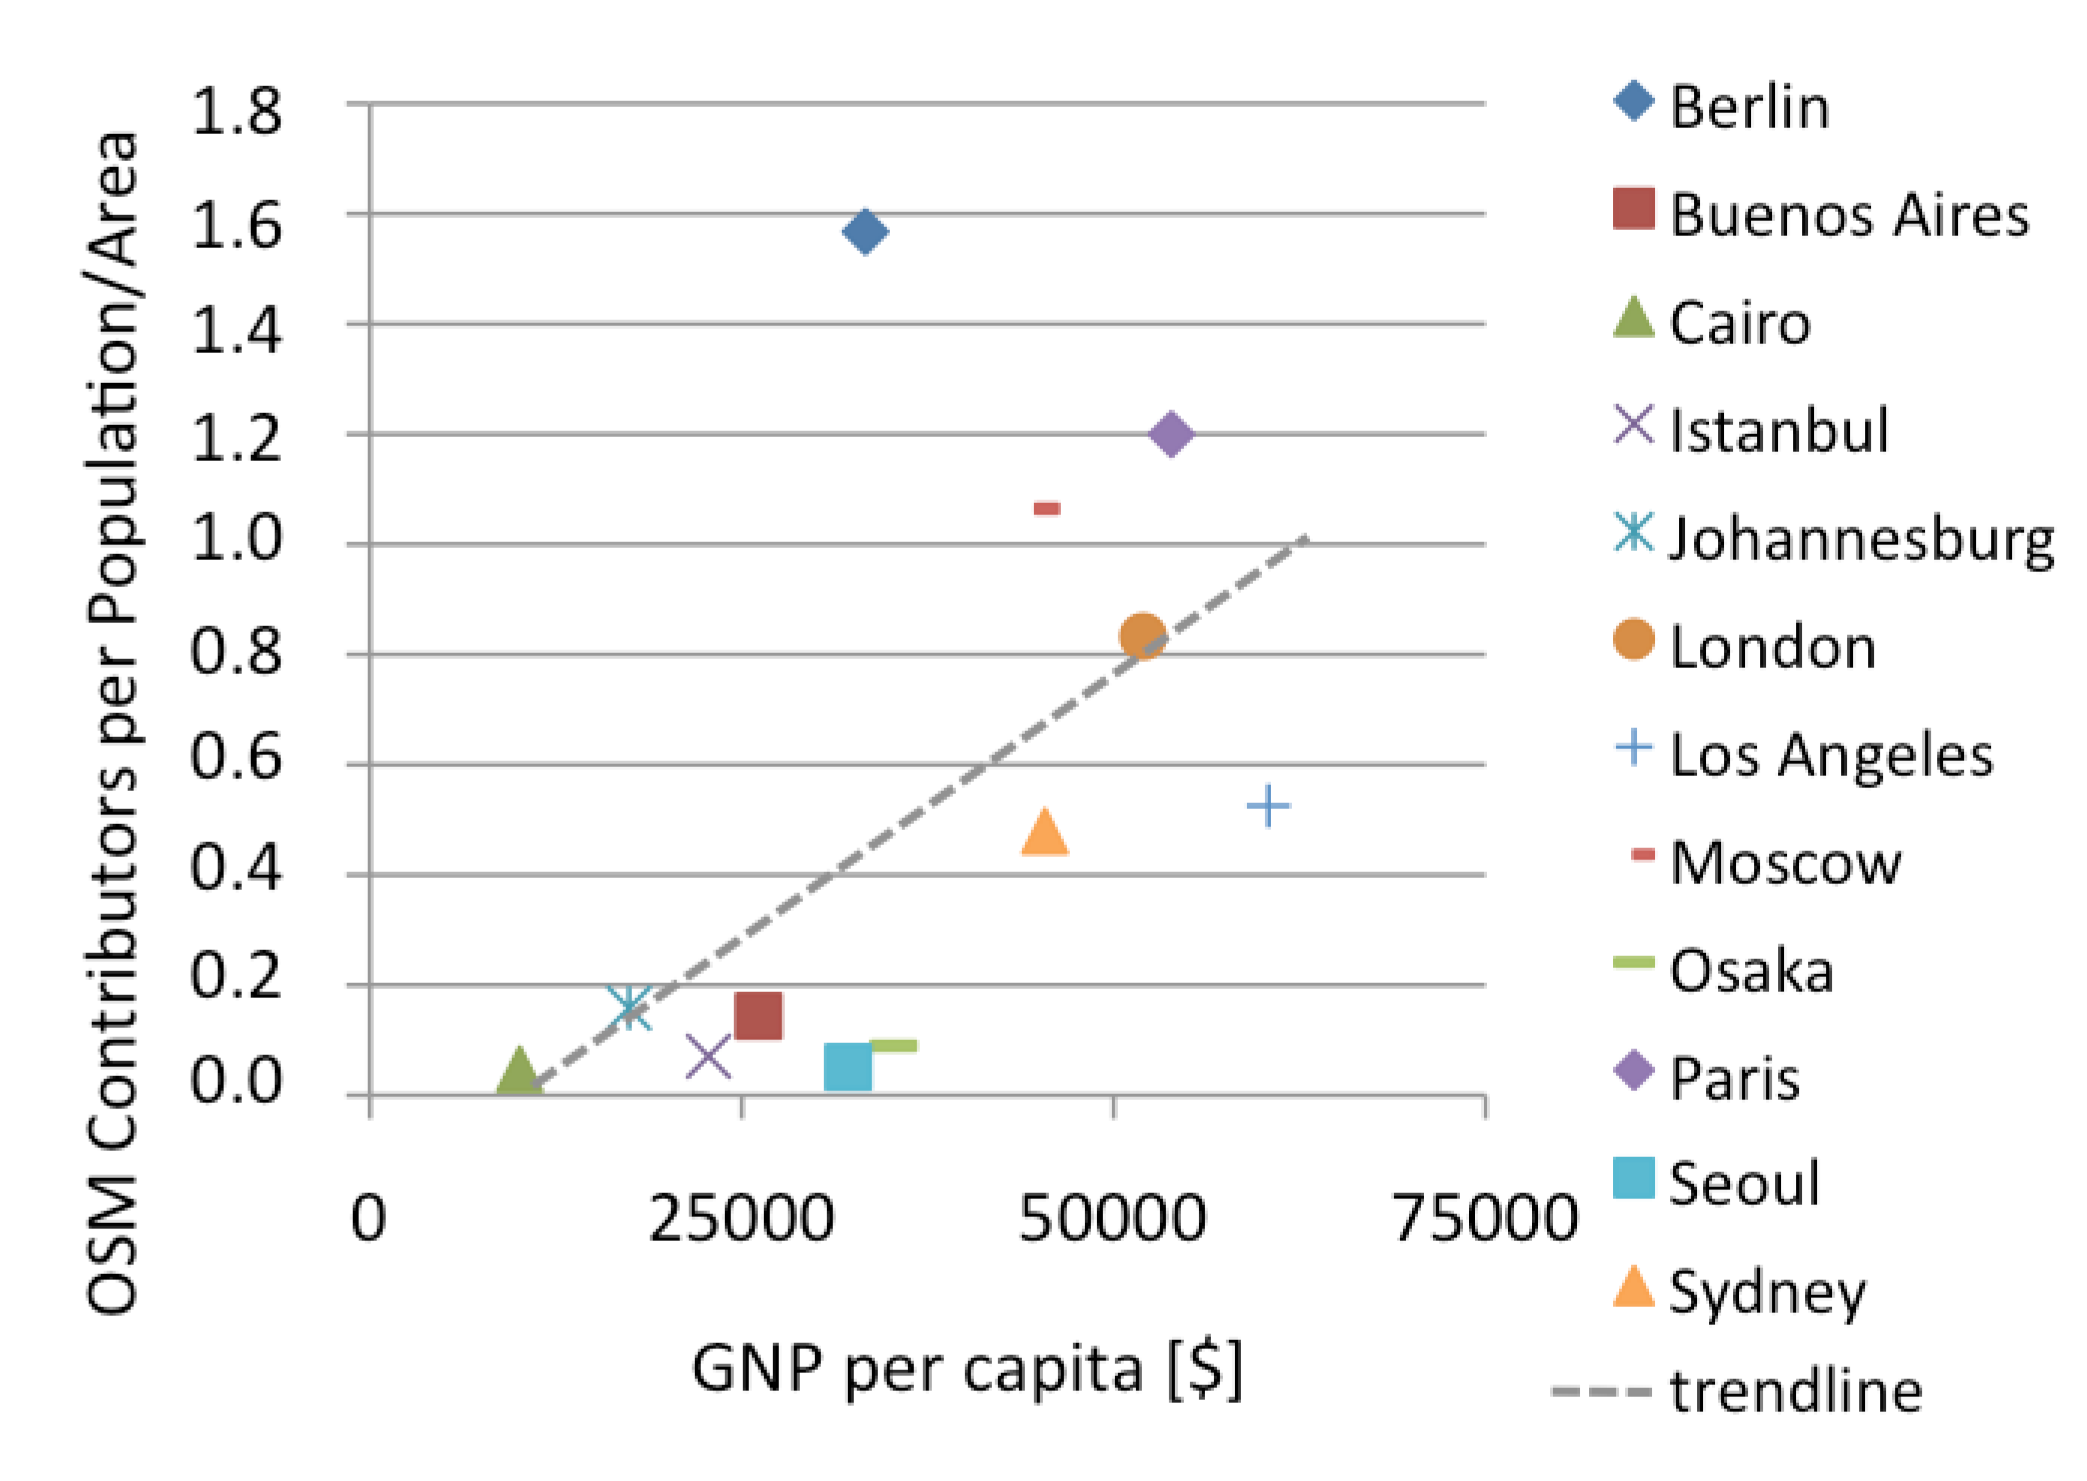
40] as: “The value of all final goods and services produced in a country in one year (gross domestic product) plus income that residents have received from abroad, minus income claimed by nonresidents.” The corresponding GNI per capita is defined as: “A country’s gross national product (GNP) divided by its population.” For the following analysis it is important to apply the GNP value, which represents each individual urban area and not the entire country. The values for 2012 utilized in this analysis are provided by The Brookings Institution [
41].
Figure 9 show the results gathered for the tested urban areas when comparing the OSM contributor density with the GNP per capita.
Figure 9.
Contributor density (Oct. 2012) and GNP per capita (2012).
Figure 9.
Contributor density (Oct. 2012) and GNP per capita (2012).
The statistical analysis of the results shown in
Figure 9 revealed a distinct correlation between the number of members in OSM and the GNP with an R
S value of 0.664. Furthermore, a number of outliers such as Berlin with a slightly lower GNP but larger OSM community could be determined. The opposite situation can be seen for Los Angeles and Sydney; both countries have a higher GNP in comparison to other tested areas but only show small OSM communities. Usually, it would be expected that these cities would show a higher concentration of OSM members based on their GNP values, if income is considered as an influential factor. However, the outliers identified in this analysis also showed that other factors next to population density or income must have an influence on the development of an OSM community in the selected areas.
5. Conclusions and Future Work
The analyses presented in this article provided detailed information about the concentration of OSM geodata and its contributors for 12 selected worldwide urban areas. The main objective of the article was to determine similarities or significant differences between the selected areas regarding their data growth and collection efforts by the OSM community. The results showed that the urban areas provide significantly different data concentrations in OSM, which can be caused by data imports for selected areas or large differences between community contributions. The results also highlighted the differences between European and other world regions in OSM. Especially the number of OSM members can differ largely in this case. With the exception of Istanbul, all tested European areas show higher OSM member concentrations than other areas with high population density values such as Cairo or Seoul. Moscow proved to be a positive example outside of Europe with a large OSM community.
When splitting the OSM contributors into different groups, based on their number of edits made to the map data, all tested areas show similar patterns. About 7% of the data contributors are very active “Senior Mappers” while 28% fall into the Junior Mapper category with fewer contributions. The largest group of data collectors is represented by the “Nonrecurring Mappers” with 66%. The determination of the active time frames of the members showed that about 16% of all OSM contributors in each area have been active within three months by making at least one edit to the map. However, only 3% of the members can be considered as very active “Senior Mappers”. The data also revealed that the absolute number of active OSM members has no impact on the activity spectrum of the volunteers. The most active “Senior Mappers” created on average about 90% of the data in the urban areas and worked on about 9 of the tested 90 days and created almost 1500 Nodes, 230 Ways and 4 Relations total. The temporal data quality proved to be highly influenced by the size of the community in each urban area, which confirms similar findings for France [
13]. Smaller communities do not guarantee continuing data collection or correction efforts and thus make the datasets outdated.
Further results were gathered by analyzing and comparing local to external data contributors. Especially urban areas with lower OSM community member numbers show large (sometimes more than 50%) external member data contributions. Especially Cairo, Istanbul, Johannesburg and Los Angeles rely on these non-local members. In general, this pattern contradicts in certain aspects the main idea behind VGI projects as defined by Goodchild [
42] in which “local volunteers” should be the main source of information. However, Neis & Zipf [
16] already proved that more than 50% of the worldwide “Senior Mappers” of the OSM project contribute data to two or more countries and do not limit their efforts to local areas. Due to the fact that the population density did not provide enough evidence of impacting OSM member numbers, other socio-economic factors were taken into consideration. It was hypothesized that income might be a major influential factor. The analysis showed that urban areas with higher income values such as Sydney, Los Angeles, Seoul and Osaka could potentially inherit larger OSM communities than currently available but still show a correlation between income and OSM contributor ratio. Berlin has a slightly lower average income in comparison to other tested areas and a relatively high member density, but can be considered as an exceptional case. Overall the conducted analyses do not completely confirm prior results gathered for England where “more affluent areas and urban locations are better covered than deprived or rural locations” [
9]. However, a more comprehensive investigation with additional urban areas, which increases the sample size, could improve the findings of our analysis and statistical results presented.
Questions remain about potential other reasons that would explain why urban areas such as Los Angeles or Seoul only show small OSM communities and not similar success as in Europe. Possibly differences in Internet access, culture, mentality, personal interests or acquaintance to the project due to language barriers could play a role. Others would argue that countries with freely available datasets, e.g., provided by the government such as the TIGER/Line datasets in the US, are slowing down data contribution efforts in OSM. Other influential indicators could most likely only be determined by conducting an extensive survey.
The assessment of the quality of the data collected by external OSM members in comparison to local members was not part of this study. However, it was clearly shown that large data contributions have been made in selected areas by members that maybe never collected data locally in person and lack the “local expertise” [
42] that are making VGI projects unique. Based on these findings, investigations planned for the future will reveal some answers to questions such as: Do external or remote members provide a better, equal or worse data quality when contributing to the project? A similar approach to the one chosen during the analysis of Wikipedia and “The Roles of Local and Global Contribution Inequality” [
43] could provide some meaningful insights. Geometric differences such as inconsistencies in positional accuracy will most likely be limited due to the high resolution images that the mappers can utilize when tracing data for OSM, as long as they are not outdated. However, a metadata analysis including street names, street types or turn restrictions could introduce some of the caveats of remote data contributions in OSM.


