Abstract
Hybrid electric vehicles (HEVs) and plug-in hybrid electric vehicles (PHEVs) are evolving rapidly since the introduction of Toyota Prius into the market in 1997. As the world needs more fuel-efficient vehicles to mitigate climate change, the role of HEVs and PHEVs are becoming ever more important. While fuel economies of HEVs and PHEVs are superior to those of internal combustion engine (ICE) powered vehicles, they are partially powered by batteries and therefore they resemble characteristics of battery electric vehicles (BEVs) such as dependence of fuel economy on ambient temperatures. It is also important to understand how different extent of hybridization (a.k.a., hybridization ratio) affects fuel economy under various driving conditions. In addition, it is of interest to understand how HEVs and PHEVs compare with BEVs at a similar vehicle weight. This study investigated the relationship between vehicle mass and vehicle performance parameters, mainly fuel economy and driving range of PHEVs focused on 2018 and 2019 model years using the test data available from fuel economy website of the US Environmental Protection Agency (EPA). Previous studies relied on modeling to understand mass impact on fuel economy for HEV as there were not enough number of HEVs in the market to draw a trendline at the time. The study also investigated the effect of ambient temperature for HEVs and PHEVs and kinetic energy recovery of the regenerative braking using the vehicle testing data for model year 2013 and 2015 from Idaho National Lab (INL). The current study assesses current state-of-art for PHEVs. It also provides analysis of experimental results for validation of vehicle dynamic and other models for PHEVs and HEVs.
1. Introduction
In efforts to reduce air pollution and emissions of greenhouse gases, many countries promote sales and development of zero emissions vehicles (ZEVs), such as battery electric vehicles (BEVs) and fuel cell electric vehicles (FCEVs). The German Parliament passed a resolution to ban sales of internal combustion engine vehicles (ICEVs) by 2030 [1]. Nine countries and a dozen cities have announced that they will ban sales of ICEVs between 2025 and 2050 [2]. However, most of these bans do not include sales of hybrid electric vehicles (HEVs) and plug-in hybrid electric vehicles (PHEVs), which include ICEs as a power source.
While fleet conversion has already started from ICEVs to ZEVs globally, it may take decades for customers to choose ZEVs as a cost effective and convenient choice. Batteries need to further improve; cost should come down and infrastructure should be in place for the fleet turn-over globally. In the interim period, thermal efficiency of ICEs is expected to further improve and HEVs and PHEVs are expected to play a significant role.
HEVs were first introduced into the market in 1997 by Toyota with Prius. Toyota introduced a plug-in version of Prius in 2012. Since then, many HEVs and PHEVs have been introduced into the market by various auto manufacturers. PHEVs are becoming more popular than HEVs due to their ability to run on electricity with increased battery capacity. CARANDDriverTM, an automotive magazine, reported that there were 22 PHEV models available for 2019 MY (model year) in North America [3]. The Fuel Economy website reports 62 types of HEVs and 132 types of PHEVs for 2019 MY, with more detailed model classification.
Fuel economies of HEVs and PHEVs exceed those in corporate average fuel economy (CAFE) standards. There is currently no separate fuel economy standards for electric or hybrid electric vehicles, as pointed out in the previous study by Jung et al. [4].
An and Santani [5] investigated mass impact on fuel economy by comparing HEVs with their counterpart conventional vehicles (CVs), namely gasoline engine powered light duty vehicles. Using experimentally determined fuel economy data of many CVs and a few HEVs, they reported “vertical leap effect”, which describes significant fuel economy gain due to hybridization compared to CVs. On the other hand, they had to rely on modeling to understand mass impact on fuel economy for HEV as there were not enough number of HEVs in the market to draw a trendline at the time. Pagerit et al. [6] investigated sensitivity of vehicle mass to fuel economy for several vehicle platforms and advanced powertrain technologies including HEVs and CVs. Using powertrain systems analysis toolkit (PSAT), vehicle-modeling software, they found CVs and parallel HEVs are the most sensitive to the change of vehicle mass for fuel economy. They showed more regenerative braking can lead to less sensitivity of fuel economy to vehicle mass. Wohlecker et al. [7] studied sensitivity of vehicle mass to FCVs, CVs and HEVs by literature survey and modeling. They concluded that CVs are more mass sensitive than HEVs and FCEVs with powertrain resizing. They reported powertrain resizing has less effect on fuel economy of HEVs compared to that of CVs. Brooker et al. [8] studied vehicle weight loss impact for CVs, HEVs, PHEVs and BEVs using a vehicle powertrain model. They reported that cost reductions associated with vehicle mass reduction were greatest for PHEVs and BEVs while the cost of a powertrain for CVs and HEVs were still lower compared to other advanced powertrains. They remarked when a $125/kWh target is met for batteries, the lightweight cost benefit of BEVs and PHEVs may diminish compared to CVs. Regardless, it is important to continue research making EVs lighter. EVs are generally much heavier than their counterpart ICEVs; heavier vehicles are known to generate more brake wear particulate matter, which is of concern [9].
PHEVs are much more energy efficient than CVs and currently have cost benefits over BEVs and FCEVs. As such, it is a type of vehicle that may play an important role in coming years. The current study aims to investigate and analyze relationships between vehicle mass and vehicle performance parameters mainly fuel economy and driving range of PHEVs focused on 2018 and 2019 MY in North America. Much progress has been made in manufacturing PHEVs in the past decade. Earlier analyses included far fewer vehicles due to their unavailability in the market. Therefore, it is advantageous to renew our understanding on vehicle mass relationship with fuel economy for PHEVs, which are more available in the market for analysis. In addition, the current study aims to investigate dependence of fuel economy on ambient temperature for HEVs and PHEVs. While the effects of ambient temperature on fuel economy is relatively well known for BEVs, there is a lack of information for HEVs and PHEVs.
2. Vehicle Data Collection
For driving range per full charge and fuel economy investigation, a total of 65 models of commercially available light duty vehicles in the U.S. from 15 auto manufacturers with model years ranging from 2018 to 2019 were obtained from www.fueleconomy.gov (Table 1). Some missing information such as vehicle curb weight and battery capacity were obtained from the manufacturer’s website. For the effect of ambient temperature on fuel economy and kinetic energy recovery by regenerative braking, eight models of light duty vehicles by five auto manufacturers with model year 2013 and 2015 were obtained from Idaho National Lab Advanced Vehicle Testing activity data (Table 2).

Table 1.
Vehicle data for fuel economy and driving range analysis.
Table 2.
List of vehicles used for the effect of ambient temperature on fuel economy and kinetic energy recovery by regenerative braking.
3. Results
3.1. Trend of Driving Range for Plug-In Hybrid Electric Vehicles (PHEVs) in Charge-Depleting (CD) Mode
While users may expect PHEVs drive just like BEVs in CD mode using solely a battery power without running an engine, it is not the case. There are two different CD modes, namely blended and non-blended CD mode. During the blended CD mode, engine power is used when power is lacking. On the other hand, during the non-blended CD mode, solely a battery power is used. Auto manufacturers typically choose either CD mode based on their pros and cons. In other words, a specific PHEV may drive either blended or non-blended CD mode but not both.
The Environmental Protection Agency (EPA) label for a blended PHEV (e.g., Toyota Prius Prime) shows “Elec + Gas” and in the range bar for the CD mode, it shows “All Elec 0–25 mi” because depending on conditions, the vehicle could travel 25 miles on all electric or it could use the engine for the entire CD mode in a blended mode of operation. A blended PHEV may or may not use gasoline during EPA testing and the estimates will reflect how it performed in the EPA test cycles. The Chevrolet Volt, by comparison, is considered by the EPA to be a non-blended PHEV, which is why only “electricity” is shown for the CD mode and the estimated range simply states, “53 miles electricity”. For the analyses conducted in the current study, separate trends were not found between blended and non-blended CD mode and therefore these two modes were not distinguished in the graphs except a few in Supplemental Information.
This study performed a similar analysis as Jung et al. [4] comparing the driving range of PHEVs in CD mode with vehicle weight normalized battery capacity to understand how the driving ranges of PHEVs compare with those of BEVs at similar weight normalized battery capacity. The driving ranges of PHEVs in CD mode shown in Figure 1 were obtained following EPA test procedure. EPA testing follows SAE Recommended Practice J1711, which is essentially the same single-cycle test procedure as used for electric vehicles. The driving range is determined over successive highway cycles. Figure 1 shows that the slope, 4872 (miles/(kWh/kg)), of PHEVs is very close to the slope, 5002 (miles/(kWh/kg)), of BEVs for short driving range (<150 miles) per full charge by Jung et al. [4] while the y-intercept is a little smaller for PHEVs. Note due to the heavier weight of the PHEVs per battery capacity compared to BEVs, the data for PHEVs extend further to the left in Figure 1 compared to the red dash line which represents the data for BEVs. It is also noteworthy that driving ranges of PHEVs in CD mode was ~10 miles less compared to BEVs with the same vehicle weight normalized battery capacity. The 2018 and 2019 BMW i3 had the longest driving range in CD mode with impressively large vehicle weight normalized battery capacity compared to other PHEVs.
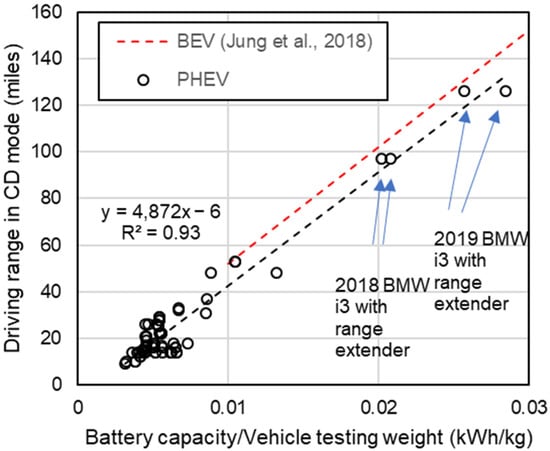
Figure 1.
Trend of US Environmental Protection Agency (EPA) driving range (miles) per charge vs battery capacity/vehicle testing weight (kWh/kg) in charge-depleting (CD) mode.
3.2. Trend of Fuel Economy
EPA city and highway fuel economy data in MPGe unit were plotted against vehicle weight. Highway fuel economy of 2018 and 2019 PHEVs ranged from 46.4 MPGe to 121.2 MPGe with average of 76.2 ± 20.6 MPGe in CD mode and it ranged from 22.9 MPGe to 51.6 MPGe with average of 32.4 ± 8.3 MPGe in charge-sustaining (CS) mode. Figure 2a shows highway fuel economy depends on vehicle weight more in CD mode than CS mode. There was no distinguishable separate trend between non-blended CD mode and blended CD mode as shown in Figure 2b. Note BEVs from Jung et al. [4] showed much less weight dependency for fuel economy compared to CD mode for PHEVs. Further study is needed to understand lower fuel economy of PHEVs in CD mode compared to BEVs.
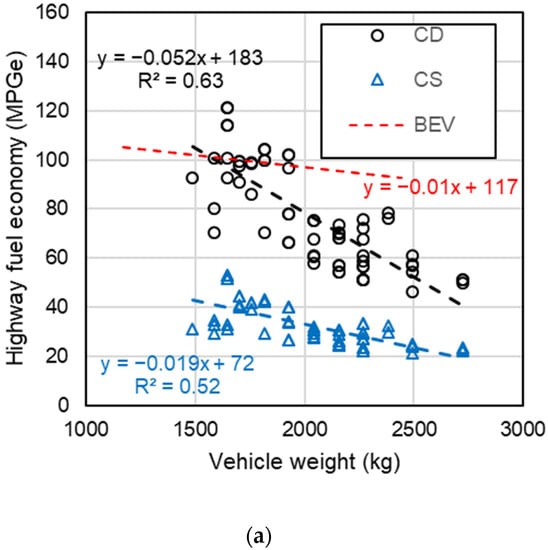
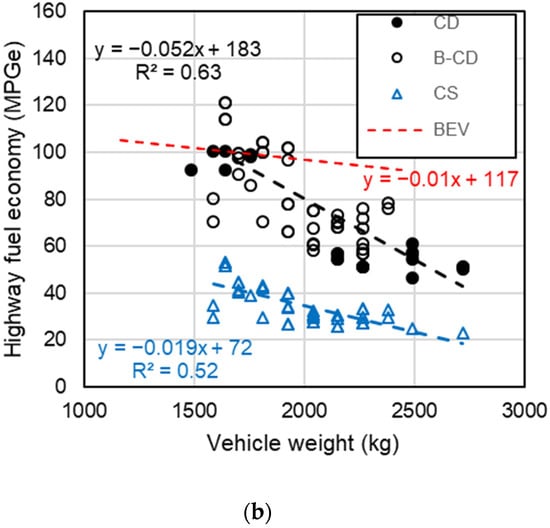
Figure 2.
Trend of EPA highway fuel economy (MPGe) with vehicle curb weight (kg). (a) Black represents plug-in hybrid electric vehicles (PHEVs) in CD mode, blue represents PHEV in charge-sustaining (CS) mode and red represents BEV. (b) Empty black mark represents blended CD mode, solid black mark represents non-blended CD mode, blue represents PHEV in CS mode and red represents BEV.
The highway fuel economy of PHEVs in CS mode depended less on vehicle weight compared to that of PHEVs in CD mode. Weight dependency of highway fuel economy for PHEVs in CS mode was similar to that of BEVs but the fuel economy in CS mode was less than 50% than that of BEVs at the same vehicle weight.
The city driving condition includes more frequent acceleration and deceleration than the highway driving condition. City fuel economy of 2018 and 2019 PHEV ranged from MPGe 37.9 to 145.1 MPGe with average of 77.6 ± 28.5 MPGe in CD mode and it ranged from 19.9 MPGe to 52.9 MPGe with average of 30.4 ± 10.2 MPGe in CS mode. Fuel economy depended on vehicle weight more during the city driving condition compared to the highway driving condition for both BEVs and PHEVs as shown in Figure 3. Overall, regardless of different vehicle weight dependency, fuel economy ranked in the order of BEV, PHEV in CD mode and PHEV in CS mode at a given vehicle weight for both city and highway driving conditions.
Figure 3.
Trend of EPA city (MPGe) fuel economy with vehicle curb weight (kg). Black represents PHEV in CD mode; blue represents PHEV in CS mode and red represents BEV.
A unique relationship was found between city and highway fuel economies of PHEVs as shown in Figure 4. The slopes for city fuel economy against highway fuel economy were nearly one. It was 0.95 in CS mode and 1 in CD mode. This is somewhat different from 1.48 of non-Tesla BEVs obtained by Jung et al. [4]. The ratio for conventional vehicles is expected to be much less than 1. The ratio of near 1 suggests PHEVs operate at the same efficiency regardless of driving conditions, which is one of key features of PHEVs.
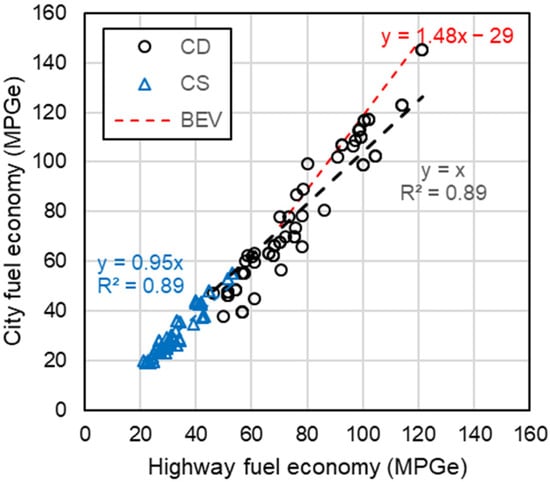
Figure 4.
Correlation between EPA city mileage and EPA highway mileage for light duty PHEVs.
Kasseris and Heywood [10] defined hybridization ratio as:
where Pmax represents max power by each power source. They predicted fuel economy is not affected by HR for combined fuel consumption (0.45 × highway fuel consumption + 0.55 × city fuel consumption). On the other hand, they predicted fuel consumption over more aggressive cycle, US06, may decrease as HR increases. There is no literature which proves or disproves their prediction under specific conditions and assumptions to author’s knowledge. To keep the consistency with other figures in the paper, correlation was obtained between fuel economy (which is inverse of fuel consumption) and 1/HR in Figure 5. A weak correlation was found between fuel economy and 1/HR for both city and highway driving conditions. This suggests the more hybridized, the better the fuel economy is. Interestingly fuel economy increased as HR increased for both highway and city driving conditions. The effect of HR was more than what Kasseris and Heywood [10] have predicted. It is expected that stronger correlation and steeper slope may be found between fuel economy and 1/HR for more aggressive cycle such as US06.
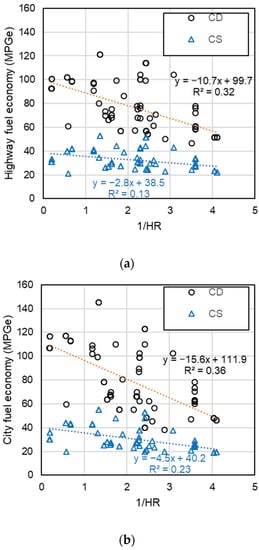
Figure 5.
Correlation between hybridization ratio and fuel economy.
3.3. The effect of Ambient Temperature and Solar Load on Fuel Economy
While it is well-known that driving range and fuel economy of BEVs reduce significantly under hot and cold weather conditions due to the use of Air Conditioner (AC) in the summer and lowered battery capacity in the winter [4], the effect of weather conditions on the performance of HEVs and PHEVs are not well reported in the literature. Idaho National Lab (INL) determined PHEV and HEV fuel economy under different weather conditions such as summer driving conditions at 95 °F with solar load (850 W/m2) and AC on and winter driving at 20 °F over UDDS (urban driving dynamometer schedule) cycle on chassis dynamometer in an environmentally-controlled chamber. These data were further analyzed in the current study. Fuel economy data over UDDS cycle were normalized against that of a normal temperature of 72 °F with no AC on in Figure 6. It should be noted for the test under blended CD mode, most of energy comes from the battery and the ICE supplements power when it is lacking. On average, fuel economy reduced by 25%, 22 ± 8%, 22 ± 9% for the summer driving condition for blended CD mode with warm start, CS mode with warm start and CS mode with cold start, respectively. Note the uncertainty of the average value for blended CD mode was not determined due to the small number of samples. These reductions of 22% to 25% in fuel economy for HEV and PHEV during the summer condition is in the very similar range to 19% reduction in fuel economy for BEVs in the same condition reported by Jung et al. [4]. The reduction in fuel economy in the summer driving condition is mainly due to the operation of mobile air conditioner (MAC) system. These reductions of 22% to 25% in fuel economy under UDDS falls between 13% (under on-road) and 35% (SC03 cycle without solar load) reduction reported by Li et al. [11] for PHEV when their data are extrapolated for 95 °F (See their Figure 5).
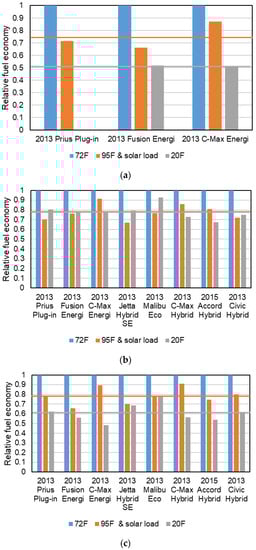
Figure 6.
Effect of ambient conditions on PHEV and HEV fuel economy. Orange and gray lines represent average values for MPGe at 95 °F with solar load (850 W/m2) and 20 °F respectively. The fuel economy was over urban driving dynamometer schedule (UDDS) cycle at (a) blended CD mode with warm start (b) CS mode with warm start (c) CS mode with cold start.
Fuel economy of HEV and PHEV reduced by 49%, 22 ± 7%, 39 ± 9% for the winter driving condition for blended CD mode with warm start, CS mode with warm start and CS mode with cold start, respectively. Jung et al. [4] reported 47% reduction in fuel economy for BEV during the winter driving condition. It is noteworthy HEVs and PHEVs showed reduction in fuel economy for winter driving condition to the same extent as BEVs for blended CD mode and CS mode with cold start. Much less reduction of 22% for CS mode with warm start condition suggests importance and need of thermal management for lithium ion batteries of HEVs and PHEVs. Note all vehicles analyzed in the current study had lithium ion batteries. Reduction in fuel economy for CS mode with cold start correlated with battery capacity and vehicle weight normalized battery capacity with R2 = 0.35 and 0.33, respectively (graphs are not shown).
ICEVs experience 12% reduction in fuel economy at 20 °F compared to that at 77 °F [12] due to multiple reasons such as increased friction, increased auxiliary power consumption, longer warm-up time, increased drag and increased rolling resistance at lower tire pressure. HEVs and PHEVs showed bigger decrease in fuel economy under cold weather compared to ICEVs and the reduction in fuel economy of HEVs and PHEVs were compared to that of BEVs for blended CD mode.
3.4. Energy Recovery by Regenerative Braking
Gao et al. [13] showed that ICEVs consume almost half of the traction power in braking power over EPA75 urban driving cycle. Regenerative braking is one of the key technologies that make EVs (including HEVs, PHEVs and BEVs) more efficient than their counterpart ICEVs. INL tested regenerative braking system of HEVs and HEVs under two conditions. 60–0 mph is the normal braking test which includes skid stops with ABS in operation if the vehicle is so equipped. 60–10 mph is a coast down braking relying on the rolling and regenerative braking resistance of the vehicle. 60–10 mph braking had much weaker deceleration with longer braking distance compared to the 60–0 mph braking condition. These two extreme cases showed lower and upper boundaries of the energy recovery for regenerative braking. Kinetic energy recovery percentage was obtained using the following equations:
where Ppeak is the peak power measured during braking and ER is total DC energy recovered into the battery. Continuous power recovery was not measured during the 60–0 mph test and therefore KER for 60–0 mph is the maximum possible energy while KER for 60–10 mph is the actual measured value.
KER for 60–0 mph were 7%, 8% and 8% for CD mode at 50% SOC, CD mode at 100% SOC and CS mode, respectively as shown in Figure 7. On the other hand, KER for 60–10 mph were 58% and 50% for CD mode and CS mode, respectively. Helmbrecht et al. [14] analyzed driving behavioral patterns of the EV drivers. They reported a development from stronger accelerating and decelerating within the first experiences with electric vehicles to calmer driving after 5 months of experience was noticeable in acceleration and braking maneuvers. The current results show aggressive braking results in much less recovery of vehicle kinetic energy by the regenerative braking system than mild braking. The results show that eco-driving [15] can save energy for PHEVs, HEVs and BEVs as well and how to drive matters to all types of vehicles. Aggressive braking gives little chance to the regenerative braking system to recover vehicle’s kinetic energy.
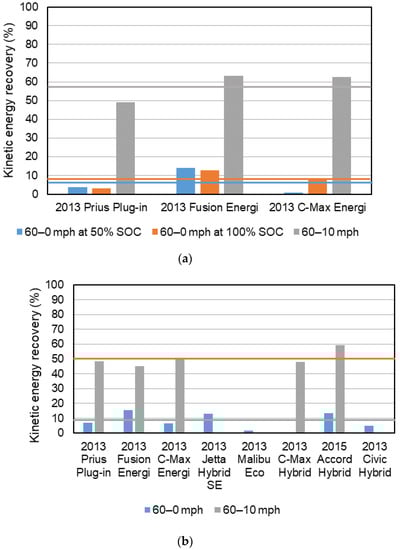
Figure 7.
Kinetic energy recovery during regenerative braking during (a) CD mode (b) CS mode. Note 60–10 mph braking conditions were under coasting in drive condition on dry surface. Test run data were cut off when the vehicle reached 10 mph.
4. Conclusions
PHEVs and HEVs are new types vehicles with increased importance to mitigate climate change. There are several papers which predicted characteristics of PHEVs and HEVS by modeling but there is a lack of experimental analysis to validate the models. The current study investigated driving range and fuel economy of PHEVs and HEVs with focus on the effects of vehicle weight, hybridization ratio and ambient temperature.
Driving ranges of PHEVs in CD mode were proportional to the weight normalized battery capacity similar to BEVs. PHEVs showed ~10 miles less driving range compared to the BEV at the same weight normalized battery capacity. Interestingly and expectedly PHEVs showed very similar trends in fuel economy between city and highway driving conditions. This confirms superior fuel economy of PHEVs against ICEVs (internal combustion engine vehicle) over the city driving condition. Hybridization ratio showed a weak correlation with fuel economy. Fuel economy of PHEVs and HEVs reduced by 22% to 49% depending on weather conditions (summer vs winter) and driving mode (CS vs CD mode). Kinetic energy recovery of regenerative braking ranged 7–8% and 50–58% for the 60–0 mph and 60–10 mph brake test, respectively. Aggressive driving reduces fuel economy for HEVs and PHEVs similar to ICEVs.
Funding
This research received no external funding.
Acknowledgments
Jiaqi Li, a Graduate Preparation Program (GPP) student at University of California, Riverside (UCR) contributed to collecting fuel economy data. The author is grateful to Oak Ridge National Lab (ORNL) and Idaho National Lab (INL) scientists for answering technical questions regarding EPA fuel economy test procedure and INL dataset, respectively.
Conflicts of Interest
The authors declare no conflict of interest.
References
- Zukowski, D. No Combustion-Engine Cars Sold in Germany after 2030, Parliament Says. 2016. Available online: https://www.ecowatch.com/germany-bans-combustion-engine-cars-2037788435.html (accessed on 15 August 2019).
- Coren, M.J. Nine Countries Say They’ll Ban Internal Combustion Engines. So far, It’s Just Words. 2018. Available online: https://qz.com/1341155/nine-countries-say-they-will-ban-internal-combustion-engines-none-have-a-law-to-do-so/ (accessed on 15 August 2019).
- Siler, S.; Stoklosa, A. Every Plug-in-Hybrid Vehicle Available in America Today. 2018. Available online: https://www.caranddriver.com/features/g15377500/plug-in-hybrid-car-suv-vehicles/ (accessed on 15 August 2019).
- Jung, H.; Silva, R.; Han, M. Scaling Trends of Electric Vehicle Performance: Driving Range, Fuel Economy, Peak Power Output, and Temperature Effect. World Electr. Veh. J. 2018, 9, 46. [Google Scholar] [CrossRef]
- An, F.; Santini, D.J. Mass impacts on fuel economies of conventional vs. hybrid electric vehicles. SAE Trans. 2004, 113, 258–276. [Google Scholar]
- Pagerit, S.; Sharer, P.; Rousseau, A. Fuel Economy Sensitivity to Vehicle Mass for Advanced Vehicle Powertrains; SAE Technical Paper; SAE International: Warrendale, PA, USA, 2006. [Google Scholar]
- Wohlecker, R.; Johannaber, M.; Espig, M. Determination of Weight Elasticity of Fuel Economy for Ice, Hybrid and Fuel Cell Vehicles; SAE Technical Paper; SAE International: Warrendale, PA, USA, 2007. [Google Scholar]
- Brooker, A.D.; Ward, J.; Wang, L. Light Weighting Impacts on Fuel Economy, Cost, and Component Losses; SAE Technical Paper; SAE International: Warrendale, PA, USA, 2013. [Google Scholar]
- Timmers, V.R.; Achten, P.A. Non-exhaust PM Emissions from electric vehicles. Atmos. Environ. 2016, 134, 10–17. [Google Scholar] [CrossRef]
- Kasseris, E.; Heywood, J. Comparative analysis of automotive powertrain choices for the next 25 years. SAE Trans. 2007, 116, 16–19. [Google Scholar]
- Li, C.; Brewer, E.; Pham, L.; Jung, H. Reducing Mobile Air Conditioner (MAC) Power Consumption Using Active Cabin-Air-Recirculation in a Plug-In Hybrid Electric Vehicle (PHEV). World Electr. Veh. J. 2018, 9, 51. [Google Scholar] [CrossRef]
- Fuel Economy. Fuel Economy in Cold Weather. Available online: https://www.fueleconomy.gov/feg/coldweather.shtml (accessed on 15 January 2020).
- Gao, Y.; Chen, L.; Ehsani, M. Investigation of the Effectiveness of Regenerative Braking for EV and HEV. SAE Trans. 1999, 3184–3190. [Google Scholar] [CrossRef]
- Helmbrecht, M.; Olaverri-Monreal, C.; Bengler, K.; Vilimek, R.; Keinath, A. How electric vehicles affect driving behavioral patterns. IEEE Intell. Transp. Syst. Mag. 2014, 6, 22–32. [Google Scholar] [CrossRef]
- Barth, M.; Boriboonsomsin, K. Energy and emissions impacts of a freeway-based dynamic eco-driving system. Transp. Res. Part D Transp. Environ. 2009, 14, 400–410. [Google Scholar] [CrossRef]


© 2020 by the author. Licensee MDPI, Basel, Switzerland. This article is an open access article distributed under the terms and conditions of the Creative Commons Attribution (CC BY) license (http://creativecommons.org/licenses/by/4.0/).