Article

Research on Multi-Period Hydrogen Refueling Station Location Model in Jiading District

1
Clean Energy Automotive Engineering Center, Tongji University, Shanghai 201804, China
2
School of Automotive Studies, Tongji University, Shanghai 201804, China
*
Author to whom correspondence should be addressed.
World Electr. Veh. J. 2021, 12(3), 146; https://doi.org/10.3390/wevj12030146
Submission received: 1 August 2021 / Revised: 25 August 2021 / Accepted: 3 September 2021 / Published: 6 September 2021

Abstract

:
The construction of hydrogen refueling stations is an important part of the promotion of fuel cell vehicles. In this paper, a multi-period hydrogen refueling station location model is presented that can be applied to the planning and construction of hydrogen infrastructures. Based on the hydrogen demand of fuel cell passenger cars and commercial vehicles, the model calculates the hydrogen demand of each zone by a weighting method according to population, economic level and education level. Then, the hydrogen demand of each period is calculated using the generalized Bass diffusion model. Finally, the set covering model is improved to determine the locations of the stations. The new model is applied to the scientific planning of hydrogen refueling stations in Jiading District, Shanghai; the construction location and sequence of hydrogen refueling stations in each period are given, and the growth trend of hydrogen demand and the promoting effect of hydrogen refueling stations are analyzed. The model adopted in this model is then compared with the other two kinds of node-based hydrogen refueling station location models that have previously been proposed.

1. Introduction

1.1. Background

The increasingly serious problem of global warming has made people aware of the importance of the promotion of new sources of energy. As a clean, efficient, and safe energy, hydrogen is regarded as the most promising clean energy source in the 21st century. Hydrogen fuel-cell vehicles (HFCVs) are one of the main ways that have been suggested for hydrogen energy applications.
Hydrogen infrastructure construction is a crucial step in the development and promotion of HFCVs. In China, great attention has been paid in recent years to the construction of hydrogen refueling stations. By the end of 2020, 118 hydrogen refueling stations had been built in China [1]. In addition, according to the Energy-saving and New Energy Vehicle Technology Roadmap 2.0, by 2025, China plans to build 1000 hydrogen refueling stations [2], and the number of HFCVs will reach 100,000. The large-scale application of hydrogen energy could be achieved by 2030 to 2035; the number of hydrogen refueling stations is estimated to go up to 5000, and the number of HFCVs could reach about 1 million.
However, the cost of building a hydrogen refueling station is quite high. According to the data, the cost of setting up a hydrogen refueling station in China can be more than USD 1 million. Therefore, it is impossible to build as many hydrogen refueling stations as there are petrol stations in the early stages to achieve high availability coverage. Therefore, choosing the correct locations for building hydrogen refueling stations to meet the requirements of users and better promote the development of HFCVs has become a problem. This reveals the significance and major contribution of this paper.

1.2. Literature Review

At this point in time, many scholars have studied hydrogen refueling station location models. In terms of a station location optimization model, these are mainly divided into two types: a node-based model and a flow-based model [3]. In the literature of Itaoka Kenshi et al. [4] and Kuby et al. [5], according to survey results, the refueling behavior of drivers in node-based and flow-based models were summarized. The node-based model is more in line with the fueling habits of traditional gasoline vehicle owners, and surveys of natural gas vehicle drivers show that they are more cautious about refueling and willing to take detours when faced with sparse stations, which is more in line with the flow-based model. In node-based models, hydrogen demand is located on nodes in the network, and the models can be divided into three types [6]—a set covering model [7], a p-median model [8], and a p-center model [9], among which the former two types are more commonly used in analyses of the hydrogen refueling station location problem. The most famous application is the STREET model [10] developed by the University of California in the Advanced Power and Energy Program, which combines the node-based model with GIS, and it has been applied as a means to locate hydrogen refueling stations in California, United States. In the flow-based model, hydrogen demand lies on a particular path in the network, as first proposed by M.J. Hodgson et al. [11]. Michael Kuby et al. [12] introduced the factor of limited driving range and proposed the Flow Refueling Location Model (FRLM), applying it to the location optimization of hydrogen refueling stations. Later, on this basis, other scholars introduced such factors as hydrogen demand uncertainty [13], the filling capacity of the station [14], and flow deviation [12], etc., and carried out location optimization of hydrogen refueling stations by comprehensively considering multiple factors [15,16]. The node-based model and the flow-based model each have their own advantages; which one to choose depends on the actual application scenario. When the number of stations is small, the results of a flow-based model may be more accurate. However, the data for a flow-based model is more difficult to obtain.
To describe the study area on the map, the transport demand model can be used. The first step is to divide the area into zones and then, analytical methods, such as the geographical and temporal weighted regression (GTWR) method [17], are applied to model spatiotemporal heterogeneity. Xinxin Zhang et al. [18] divided the study area of Xiamen City into grid cells, designated the appropriate grid cell size, and then used GTWR to study the spatiotemporal influence of the urban environment on taxi ridership. Elsewhere, Xiaolei Ma et al. [19] divided the target area into traffic analysis zones (TAZs) by means of administrative divisions and also used GTWR to explore the spatiotemporal influences of the built environment on public transport demand. In addition, Ricardo Ewert et al. [20] used a road network model consisting of links and nodes derived from OpenStreetMap and presented a synthetic model for waste collection demand. Lennart Adenaw et al. [21] also used this method to establish their network and proposed a novel agent-based simulation framework for urban electromobility.
Hydrogen demand is an important input factor for station location optimization. However, the current number of HFCVs is still relatively small, so it is necessary to estimate the potential HFCV market. In terms of the spatial distribution of hydrogen demand, the penetration rate of the HFCV market is affected by many socioeconomic factors, such as population, education, income, gender, age, vehicle ownership, urban environment, etc., and the spatial distribution of hydrogen demand can be estimated by weighting different factors. M. Melendez et al. [22] in the USA, Amy R. Campbell et al. [23] in Birmingham, UK, Sylvia Y. He et al. [24] and Rongheng Lin et al. [25] in Beijing, China, all used this method to estimate the hydrogen demand of HFCVs in different regions. When determining the weight of each element, commonly used methods include ranking by Delphi method [24], cluster analysis [23], multiple regression analysis [4], etc. In addition to the spatial distribution, predicting the growth of hydrogen demand over time is also an important aspect for consideration. The most commonly used method is the generalized Bass diffusion model, combined with the system dynamics. Michael H. Shoemaker et al. [26] verified the validity of the model by using the sales data of alternative fuel vehicles from 1995 to 2011. Sang Yongpark et al. [27] and Yushan Li et al. [28] used this model to forecast the HFCV market in South Korea and China. Patrick E. Maier et al. [29] analyzed the relationship between the HFCV market and hydrogen infrastructure through this model. C. Funez Guerra et al. [30] improved the processing of the elements of hydrogen refueling stations in the previous model to make the prediction results more accurate. David R. Keith et al. [31] further explored the technical connection among various vehicles and the influence of technological progress and proposed a more comprehensive model. The combination of the spatial distribution of hydrogen demand and the station location optimization model or the growth of hydrogen demand over time and the station location optimization model has been studied by many scholars. However, few studies combine all three elements at the same time, and this research gap is what this article aims to address.
In this paper, the first part is an introduction, explaining the background research, and previous articles are reviewed. The second part introduces the multi-period hydrogen refueling station location model. In this part, the assumptions, three sub-models, and the algorithm that has been used are described. The third part is a case study, listing the data used, and the results gained, as well as a discussion of their implications. The final part comprises our concluding remarks.

2. Multi-Period Hydrogen Refueling Station Location Model

2.1. Introduction of a Multi-Period Hydrogen Refueling Station Location Model

The multi-period hydrogen refueling station location model consists of three parts. Firstly, the source of hydrogen demand is divided into commercial vehicles and passenger cars, according to practical application scenarios, and the spatial distribution of their hydrogen demand is calculated in various ways. Secondly, the variation of hydrogen demand over time is predicted, and the promoting effect of hydrogen refueling stations on the HFCV market is considered; thus, the construction of hydrogen refueling stations in multi-periods is incorporated into the model. Finally, in terms of station location optimization, an improved set covering model is established, based on the set covering model and p-median model.

2.1.1. The Division of the Study Area

To describe the study area, Jiading District in Shanghai, China, the method used in the transport demand model has been adopted. The study area is a continuous two-dimensional area on the map, so it is important to divide it into zones of transport demand to identify specific features in different zones. The most common method is to first divide the area by administrative region. Information on population and socioeconomic level in a particular administrative region is relatively easy to obtain since the government has collected the relevant statistics. Sometimes, the zones, when divided by administrative regions, are still too large and need to be subdivided. At this point, several adjacent communities with similar socioeconomic levels can be divided into a zone, and these zones can be bounded by roads, rivers, etc. The zone of transport demand is also a two-dimensional area, but it is one that is much smaller and contains similar socioeconomic levels, so it can be treated as a whole. The distance between the zones is defined as the length of the shortest road connecting the centroids of zones. The zone of transport demand is assigned attributes such as population, economic level, and education level, and these attributes would influence the hydrogen demand in the zone.

2.1.2. Assumptions of the Model

This model makes various assumptions, as follows:
  • People prefer to refuel near home or near their work;
  • The distance between a station and a zone is the distance between the zone where the station is and the area of interest;
  • The capacity of the hydrogen refueling stations is not limited;
  • In the case of commercial vehicles, they refuel only at the start and end of the trip;
  • When using a fuel cell vehicle, the user gets the same mileage as when using a gasoline vehicle.
The first three assumptions are the general assumptions of a node-based hydrogen refueling station location model, to which type the location optimization model used in this model belongs. For commercial vehicles, the hydrogen demand of buses is the main transport type considered, and a bus is unlikely to make a refueling stop, so the fourth assumption is also reasonable. The fifth assumption is used to estimate the hydrogen demands of vehicles.

2.2. Spatial Distribution of Hydrogen Demand

2.2.1. Passenger Cars

To calculate the spatial distribution of the hydrogen demand of passenger cars, we can solve this by evaluating several socioeconomic factors. The number of passenger HFCVs in a region can be influenced by many factors, and according to previous research, it is closely related to certain socioeconomic factors such as the population’s economic level, education level and car ownership, so we can estimate the HFCV number in a region based on these factors. Of course, different factors have different effects, so we use a weighting method to represent different levels of effects for different factors.
Considering that different factors have different units, a normalization process can be adopted, as shown in Equation (1):
R i k = r i k r k m i n r k m a x r k m i n
where i is the index of the zone in the district; k is the index of socio-economic factors; R i k is the normalized value of the factor k at zone i and r i k is the original value; r k m i n and r k m a x represent the minimum and maximum values of factor k in all regions, respectively. The relative hydrogen demand of passenger cars at zone i, R i c a r , can be calculated by the method of weighting social and economic factors, as shown in Equation (2):
R i c a r = n i · k g k · R i k
where n i is the population of zone i, g k is the weight of factor k. As an emerging technology, people are not familiar with fuel cell vehicles, so the weight of each element can be determined by a ranking Delphi method, according to the opinions of different experts. Therefore, the number of passenger cars at zone i, m i c a r , can be calculated with Equation (3):
m i c a r = R i c a r · m c a r i R i c a r
where m c a r is the sum of the number of passenger cars in all zones. Finally, the hydrogen demand of passenger cars in zone i, h i c a r can be calculated by combining the average daily driving distance of passenger cars, d c a r , and hydrogen consumption per unit distance e c a r , as shown in Equation (4):
h i c a r = m i c a r · d c a r · e c a r

2.2.2. Commercial Vehicles

In this model, buses are considered to be the main commercial vehicle in question, and their distribution is relatively concentrated. The hydrogen demand of buses at zone i, h i b u s , can be estimated using Equation (5):
h i b u s = n i b u s · d b u s · e b u s · m b u s
where n i b u s is the number of bus routes at zone i; d b u s is the driving distance of the bus route; e b u s is the hydrogen consumption per unit distance of buses, and m b u s is the proportion of fuel cell buses.

2.3. The Variation of Hydrogen Demand over Time

As a new product, the development of HFCVs cannot be predicted by existing sales data. The Bass diffusion model is a commonly used model to estimate the market share of new products. It was first proposed by Bass in 1969 to predict the sales of consumer durables such as refrigerators and televisions. Bass diffusion model divides product users into two categories—innovative users and imitators. Innovative users are those who are not easily influenced by other consumers, and they are mainly influenced by the performance of the product itself. In the early stages of product development, they are the main user group. With the accumulation of users, more and more imitators will join under the influence of existing users. Therefore, this group of users is related to the number of existing users. Finally, the market share of the product will stabilize. In addition to these two types of users, external factors, such as infrastructure, should also not be ignored. Therefore, Bass et al. introduced the external factor function on the basis of the Bass diffusion model, and constructed the generalized Bass diffusion model (GBDM) [32], the general form of which is shown in Equation (6):
f ( t ) = ( q + p · F ( t ) m ) · ( m F ( t ) ) · x ( t )
where t is the index of the time period; f(t) is the number of newly added users in period t; q is the innovation factor, i.e., the influence of the product’s own attributes on its sales volume; p is the imitation factor, i.e., the influence of others’ use and recommendation on product sales; m is the final number of vehicles; F(t) is the integral of f(t), and represents the number of users accumulated up to the period t; x(t) is the influence of external factors on product sales in period t.
In this model, the convenience of hydrogen refueling stations is considered an external factor. In the models of Sang Yongpark et al. [27] and Yushan Li et al. [28], the convenience of hydrogen refueling stations can be calculated according to the number of stations, as shown in Equation (7):
x ( t ) = 1 + a · y ( t ) y ( t 1 ) y ( t 1 )
where y(t) is the number of hydrogen refueling stations in period t; and a is the influence coefficient of the number of hydrogen refueling stations.
Therefore, there are mainly four parameters to be determined in GBDM: the final number of vehicles m, the innovation factor q, the imitation factor p, and the influence coefficient of the number of hydrogen refueling stations, a. In addition, the above parameters may not be identical because of the differences between passenger cars and commercial vehicles. For fuel cell vehicles, due to the limited sales data, the parameters in GBDM are generally estimated through the sales data of similar alternative fuel vehicles, such as natural gas vehicles.

2.4. Station Location Optimization Model

The node-based location optimization model is adopted in this paper. In the node-based model found in previous research, the set covering model and p-median model are commonly used. The goal of the set covering model is to maximize the hydrogen demand, meeting the given driving time when given the number of stations, as shown in Equation (8):
m a x i h i · x i
where h i is the hydrogen demand at zone i, and it is equal to the sum of h i b u s and h i c a r ; x i is a 0–1 variable and is equal to 1 when the driving time from zone i to the nearest hydrogen refueling station is less than the given arrival time, otherwise it is 0.
The goal of the p-median model is to minimize average driving time, with hydrogen demand as a weight when given the number of hydrogen refueling stations, as shown in Equation (9):
m i n i h i · b i
where b i is the driving time from zone i to the nearest hydrogen refueling station.
The two models have their own priorities. The set covering model tends to locate the stations more evenly in space, while the p-median model tends to concentrate the stations in those areas with high hydrogen demand, especially when the hydrogen demand in some areas is much higher than that in other areas.
Based on the set covering model and the p-median model, we made some improvements and establish the improved set covering model, as shown in Equation (10):
m a x i h i · j w j · z j i
where j is the index of the given driving time from a zone to the station; w j is the weight of the given driving time j; z j i is a 0–1 variable, and it is equal to 1 when the driving time from zone i to the nearest station is less than the given driving time j, otherwise it is 0. In the improved set covering model, when determining whether a zone is covered or not, we can use multiple given times, rather than a single one as used in a set covering model, so it can reflect the impact of different refueling times. It can also avoid the phenomenon of an excessive concentration of stations because the selection of the given driving time is discrete.

2.5. Algorithm Procedure

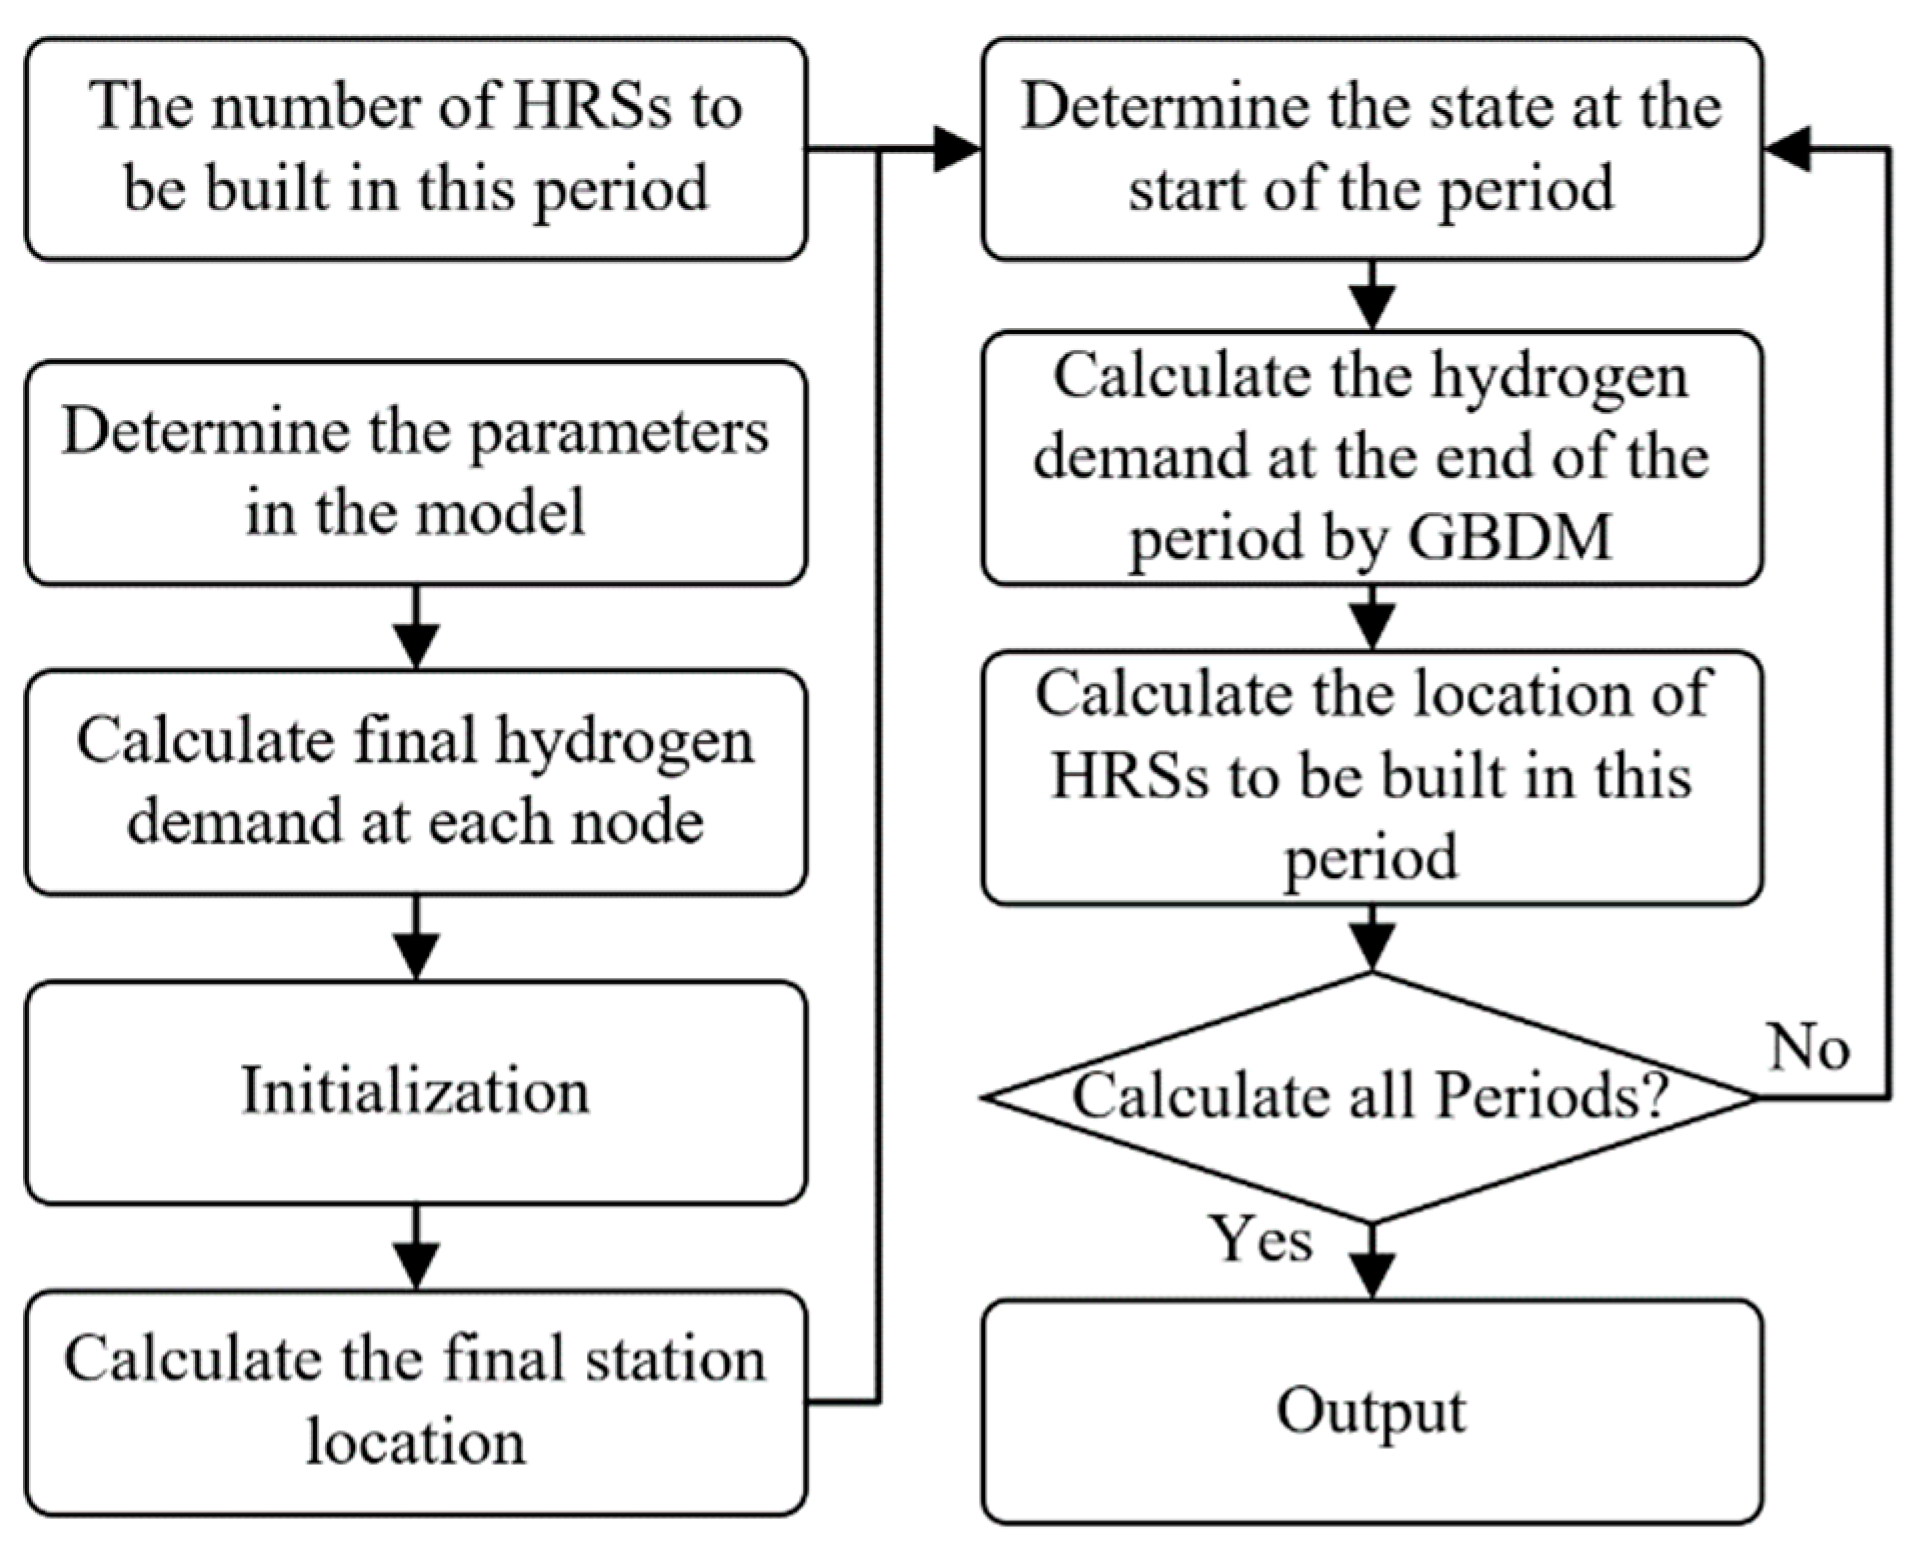
In terms of solving the improved set covering model, the greedy algorithm is adopted. When calculating the location of the newly added station, it traverses all the candidate zones that have not yet built a hydrogen refueling station, and calculates the increment of the objective function when the newly added station is located at this zone according to Equation (10), as shown in Equation (11):
O ( S ( t 1 ) + S n ( t ) + s ) = i h i · j w j · z j i S ( t 1 ) + S n ( t ) + s
where S ( t 1 ) is the set of zones where a station is constructed up to the period of t – 1; S n ( t ) is the set of zones where a station is constructed in period t; and s is the zone where the newly added station is constructed. The calculation O ( S ( t 1 ) + S n ( t ) + s ) gives the value of the objective function in Equation (10) if zone s is selected to build a new station. Likewise, z j i S ( t 1 ) + S n ( t ) + s represents the value of z j i if the zones in set S ( t 1 ) + S n ( t ) + s have already built stations. When different zones are chosen, the value of z j i will also change. Our target is to get the set of zones to make the objective function largest. Then the candidate zone with the largest objective function would be selected as the location of the new station and added to S n ( t ) , as shown in Equation (12):
S n ( t ) = S n ( t ) + s   w h e r e   m a x   O ( S ( t 1 ) + S n ( t ) + s )
In each period, there is a double loop to determine the location of the stations, until the number of stations established at this stage reaches the given number that would be built in period t and, finally, we can obtain the set of stations in period t by Equation (13):
S ( t ) = S ( t 1 ) + S n ( t )
The process is shown in Figure 1.
The calculation procedure of the whole model is shown in Figure 2.
Step 1: Determine the parameters in the model, including the weight of each socioeconomic factor in the spatial distribution of hydrogen demand (these can be obtained through a questionnaire-based survey or from previous research), the value of m, p, q, and a for different vehicles in GBDM, as shown in Equations (6) and (7) (these can be obtained through sales data for similar new energy vehicles, such as natural gas vehicles) and the value of the given driving time in the improved set covering model as well as the corresponding weight (these can be estimated by referring to the survey on how long drivers would spend in refueling).
Step 2: Calculate the final hydrogen demand at each zone. Hydrogen demand for passenger cars is calculated by weighting socio-economic factors, as shown from Equation (1) to Equation (4), while this factor regarding commercial vehicles is calculated by information on bus routes, as shown in Equation (5).
Step 3: Initialization, that is, to determine the initial state, including the existing stations, the existing hydrogen demand, and the zones where hydrogen refueling stations cannot be built.
Step 4: Calculate the final set of station locations through the greedy algorithm, as shown in Figure 1; they are also set as candidate zones when calculating the station locations in each period.
Step 5: Determine the state at the beginning of the period, such as the hydrogen demand at each zone F i ( t + 1 ) , the set of stations that have already been built S(t), and the external function x i ( t ) . In addition, the number of stations to be built in this period will also be added to the model.
Step 6: According to the state determined in Step 5, calculate the hydrogen demand of passenger cars and commercial vehicles in each zone at the end of this period by GBDM, as shown in Equation (6), as well as the hydrogen demand at the beginning of the next period in Step 5. By making a formula change, the calculation can also be achieved in the following form:
F i ( t + 1 ) = F i ( t ) + t t + 1 ( q + p · F i ( u ) m ) · ( m F i ( u ) ) · x i ( t ) d u
where u is a time between t and t + 1.
Step 7: According to the hydrogen demand calculated in Step 6 and the input number of stations to build in this period, calculate the location of the newly added stations in this period by the greedy algorithm shown in Figure 1. The candidate zones in this step are the set of locations calculated in step 4.
Step 8: Calculate the state and the location of stations in each period through iteration.

3. Case Study

3.1. Data and Calculation Results

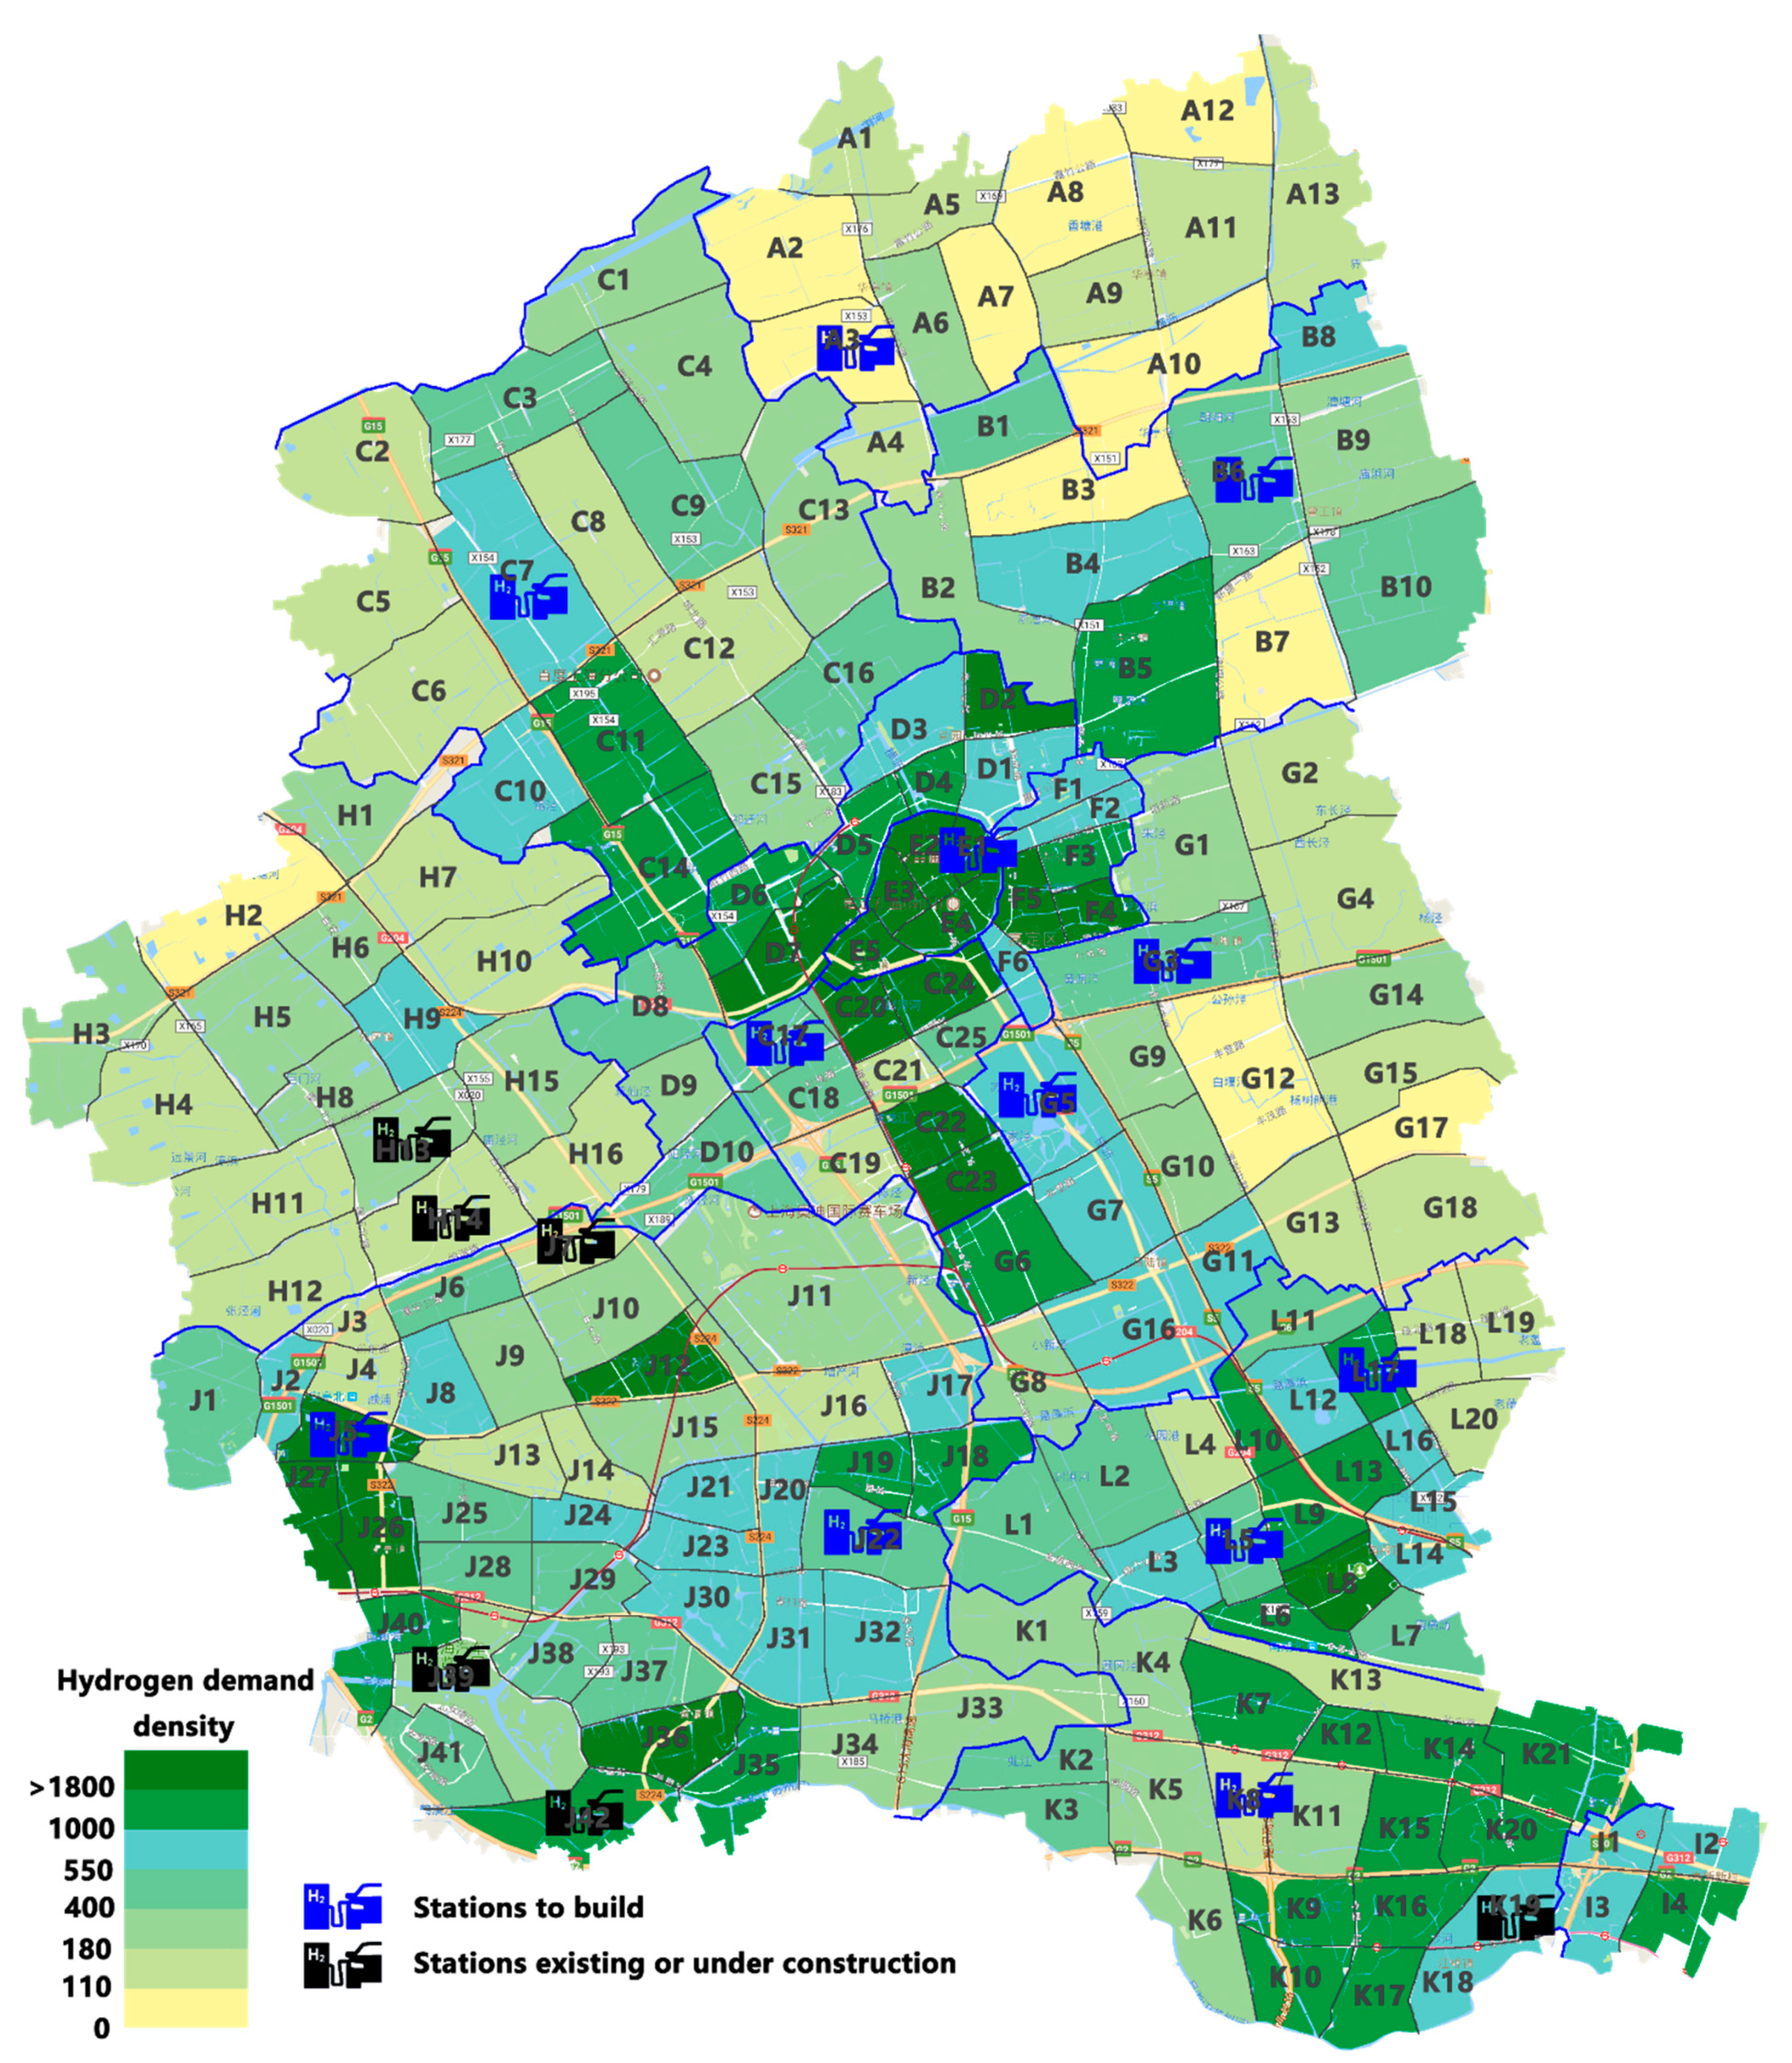
This paper takes the Jiading District of Shanghai as an example of a region suitable for locating hydrogen refueling stations. First of all, Jiading District was divided into zones of transport demand. The results are shown in Figure 3. Zones with the same letters belong to the same town. The distance between adjacent zones can be obtained through the Baidu Map, and the road speed limit is set as 60 km/h.
According to the planning in the Energy-saving and New Energy Vehicle Technology Roadmap 2.0, and the hydrogen industry policy in the Jiading District, it is estimated that the final number of fuel cell passenger vehicles in the Jiading District will be 400,000, that the average daily driving distance of passenger vehicles is 100 km, and that the hydrogen consumption of each car will be 0.7 kg/100 km. In terms of commercial vehicles, fuel cell buses will account for 50% of all buses at the final stage. The given driving times in the improved set covering model are set as 3 min, 5 min, and 8 min, and the corresponding weights are 1, 4, and 1.
In terms of the spatial distribution of hydrogen demand, the factors of education and income were selected in this paper, and then the result was weighted according to population. The population, income, and education of each town and street in Jiading District could be searched on http://www.jiading.gov.cn/ (accessed on 15 February 2021), and the information on bus routes could be searched on http://www.jd-bus.com/Web/Index.aspx (accessed on 15 February 2021). According to the research results of Sylvia Y. He et al. [24], the weight of the income factor is 0.58, and the weight of the education factor is 0.42. The equations used in the calculation process are as shown, from Equation (1) to Equation (5). The final hydrogen demand density at each zone is shown in Figure 3.
In terms of parameters in the generalized Bass diffusion model, according to the research results of Sang Yongpark et al. [27], Yushan Li et al. [28], Michael H. Shoemaker et al. [26], and Livia Moraes Marques Benvenutti et al. [33], the values of each parameter are shown in Table 1.
Currently, 6 hydrogen refueling stations have been built or are under construction in Jiading District, respectively located at H13, H14, J7, J39, J42, K19. When calculating the final locations of hydrogen refueling stations, it is assumed that hydrogen refueling stations can be built at all the zones. According to the hydrogen energy industry planning of Shanghai and Jiading Districts, a total of 18 stations are planned to be built in Jiading District by 2025. The locations of 12 additional hydrogen refueling stations have been determined in this paper. The locations of hydrogen refueling stations at the final stage are shown in Figure 3.
One year is taken as a period in this paper. It is assumed that 3 hydrogen refueling stations will be built every year before 2025, and the construction of hydrogen refueling stations after 2025 will not be included in the plan. Finally, the construction locations of hydrogen refueling stations in each period have been shown in Table 2.

3.2. Discussions

3.2.1. Hydrogen Demand Growth Trends and the Impact of Hydrogen Refueling Stations

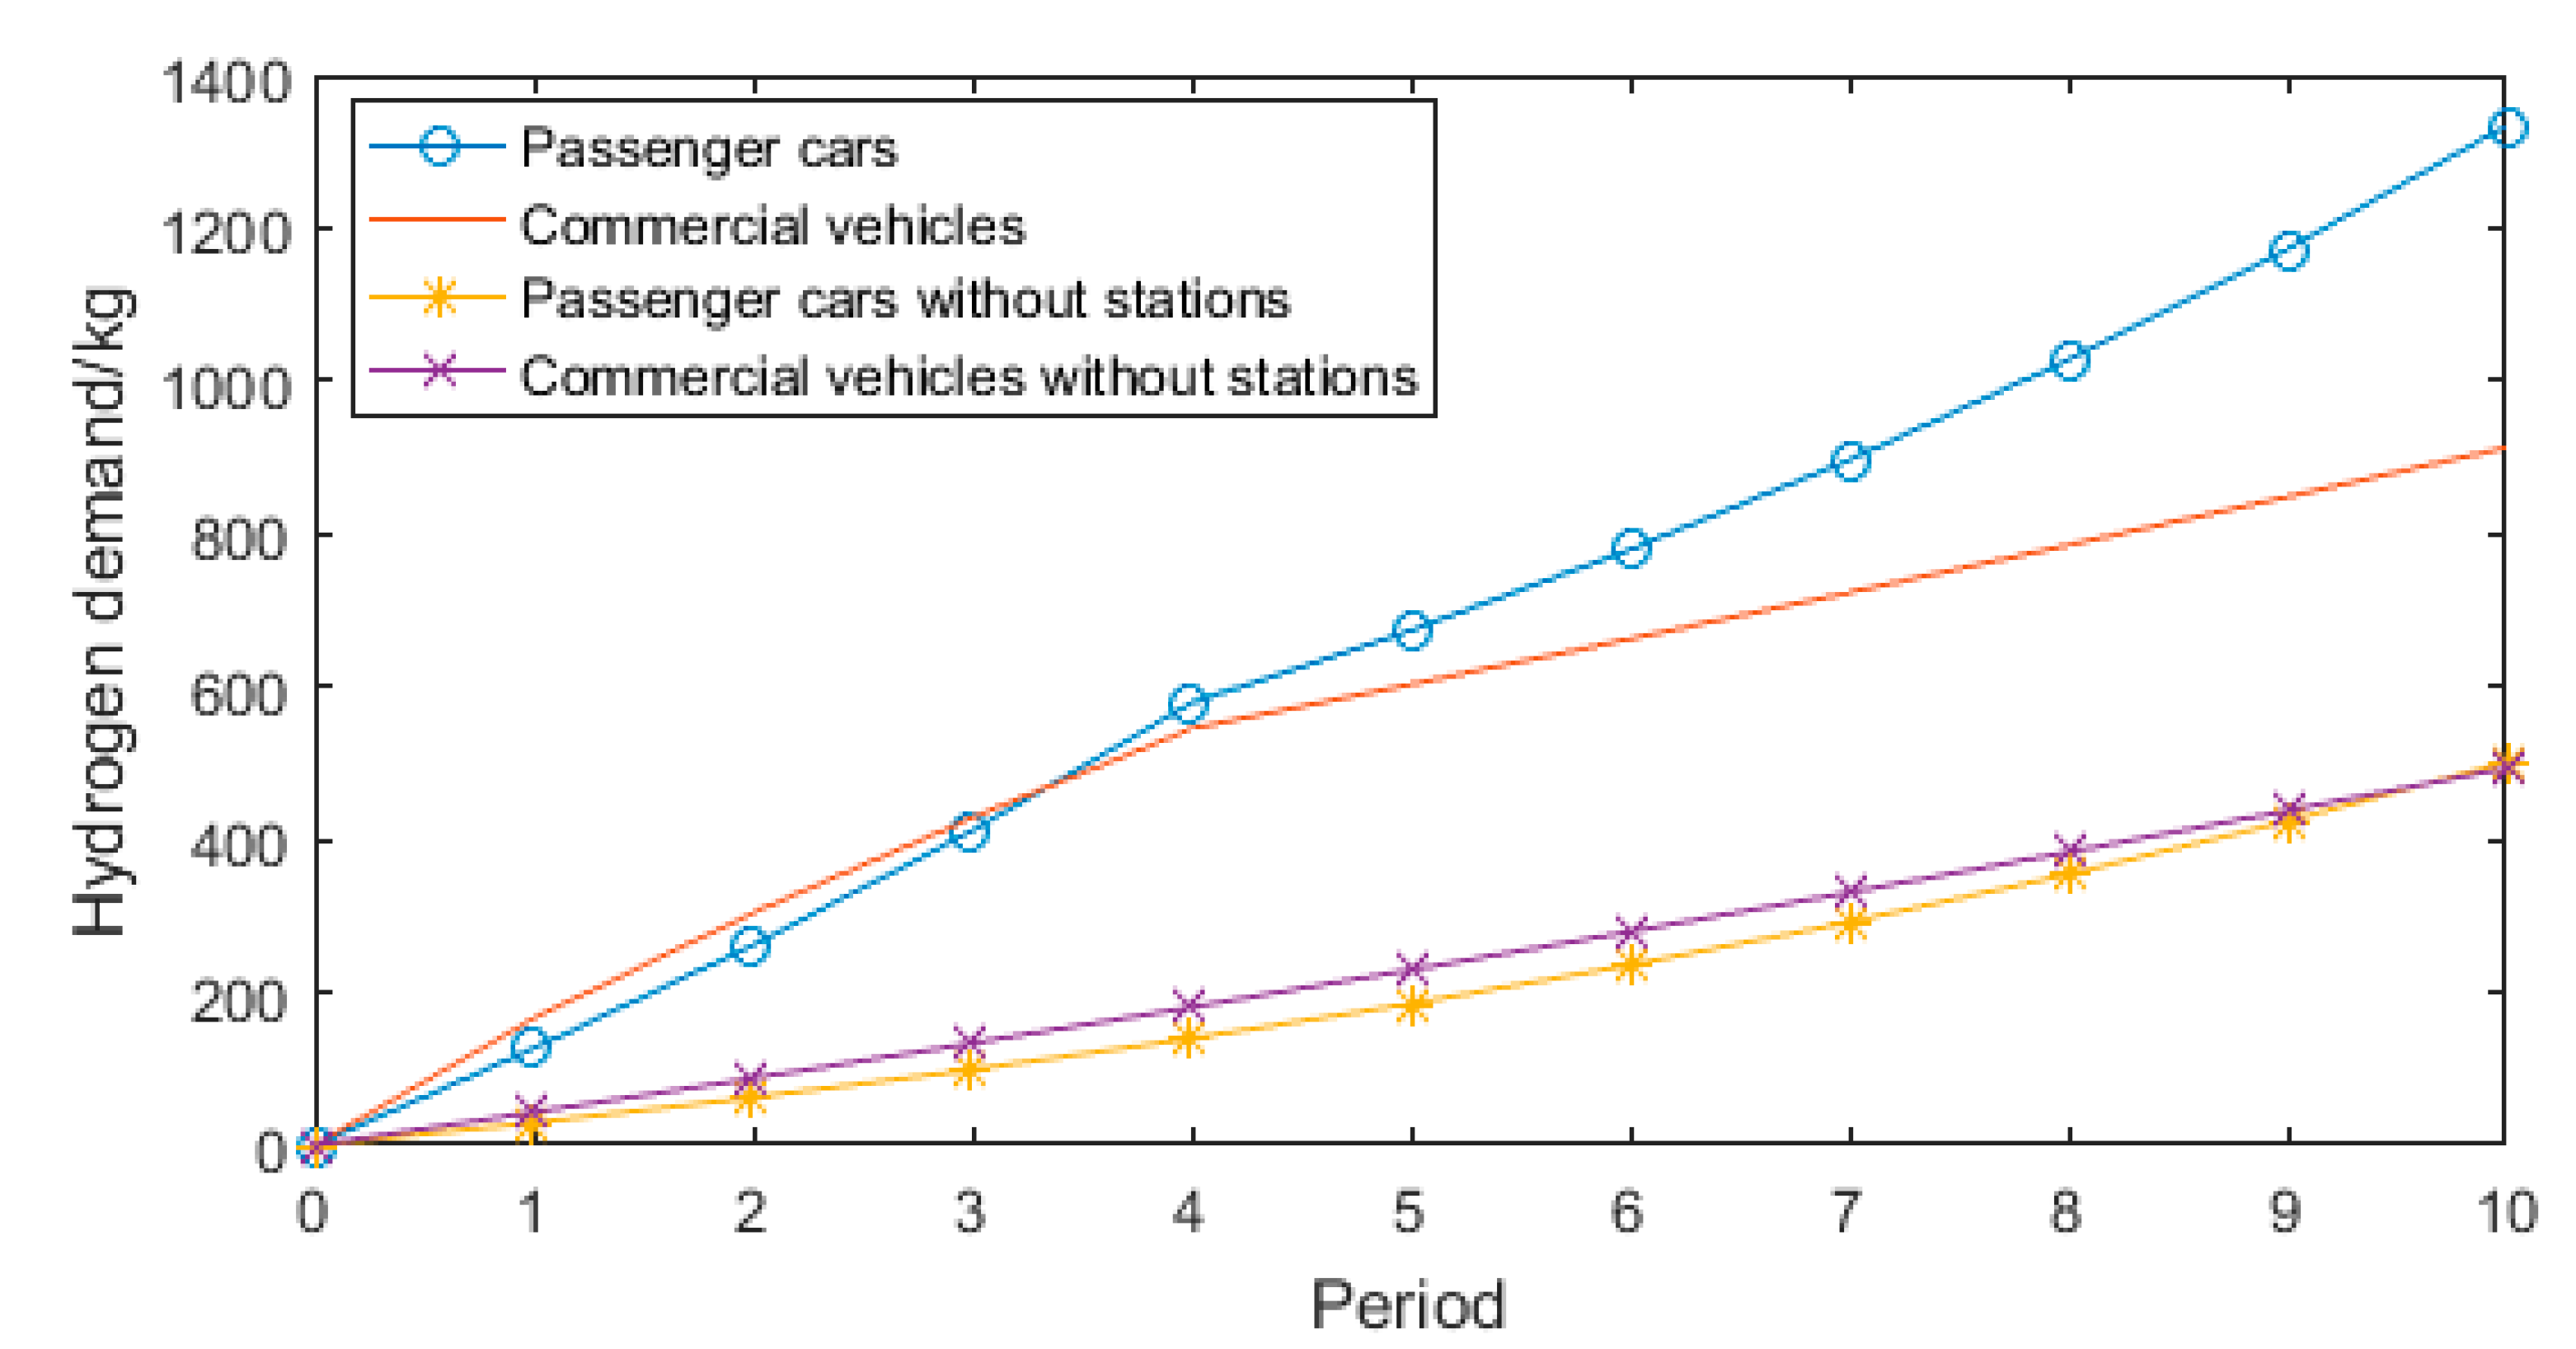
Figure 4 describes the changing trend of hydrogen demand for commercial vehicles and passenger cars. It can be seen that, in the early stages of producing hydrogen vehicles, commercial vehicles developed faster than passenger cars. Through the comparison of the innovation coefficient and imitation coefficient of the two types of vehicle, it can be seen that the innovation coefficient of commercial vehicles is obviously larger than that of passenger cars, indicating that people are more cautious about the choice of their own vehicle in the field of passenger cars, and prefer to choose the cars that have been most widely bought. In the initial location of hydrogen refueling stations, candidate zones near the bus routes, such as E1, G5, and L5, were also selected first. The top 11 zones with the most hydrogen demand for buses and hydrogen refueling stations nearby in Period 1 are shown in Table 3.
In addition, compared with the results without taking into account new stations, it is also evident that the construction of stations has a positive effect on hydrogen demand, especially in terms of passenger cars. As can be seen in Figure 4, after the initial periods of rapid growth, there was a significant slowdown in Period 5, mainly because there were no stations built after that. On the whole, the calculation results of hydrogen demand in each period in this paper are relatively small, mainly for two reasons. Firstly, it is assumed that no hydrogen refueling station will be built after Period 5; secondly, the influence of external factors, such as policies, has not been taken into account. Further work needs to be conducted that includes these two parts in the model.
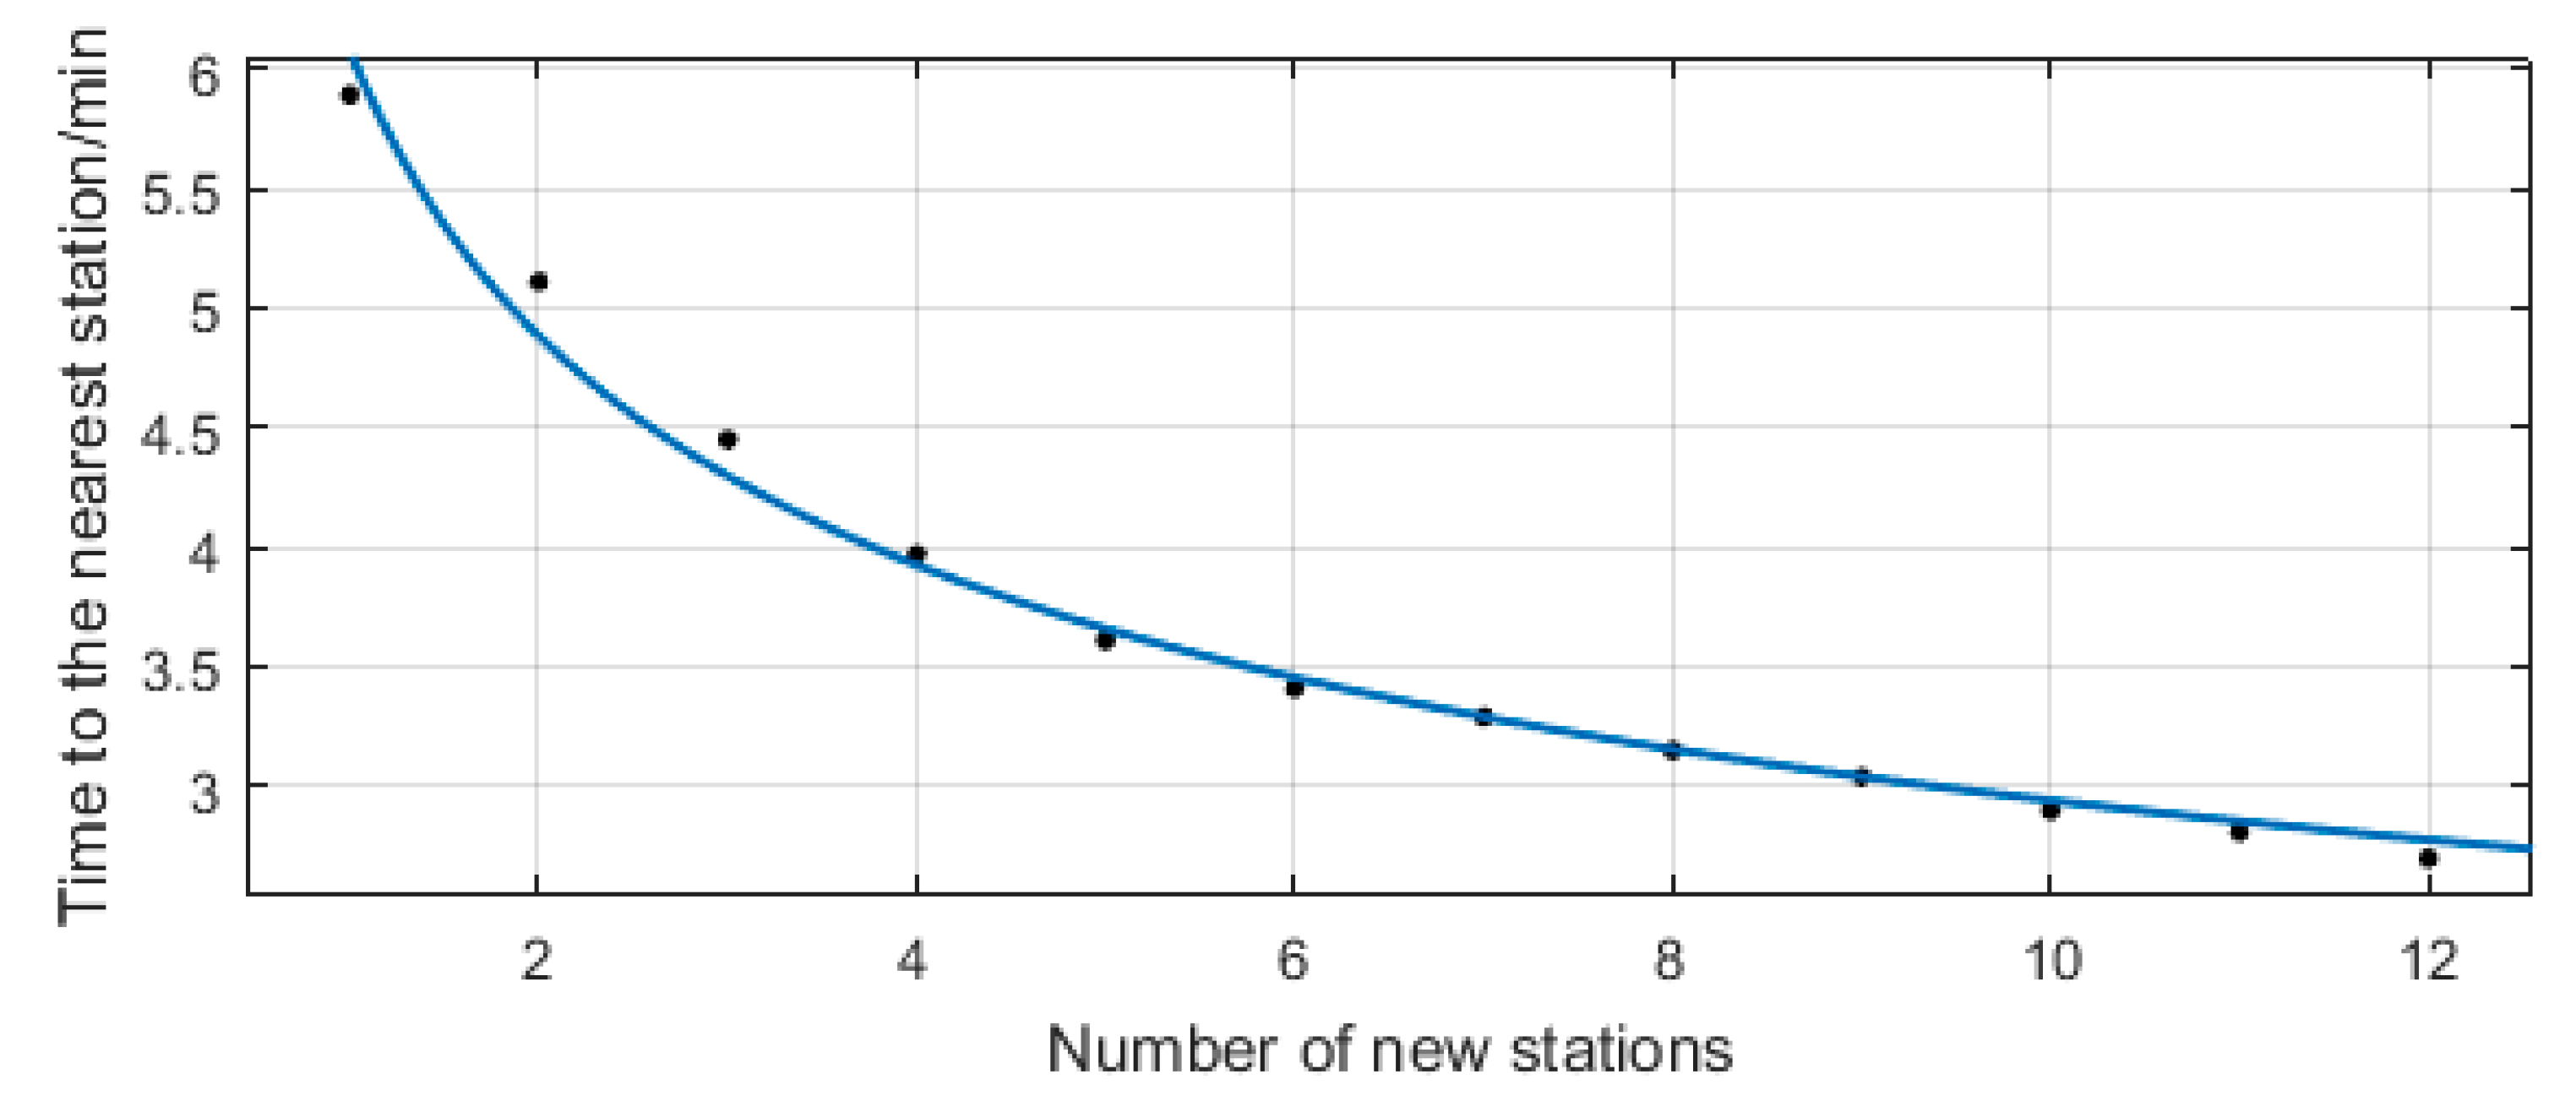
According to the research results of Rongheng Lin et al. [25], in a particular region, the relationship between the average driving time (or distance) with demand as a weighting agent, and the number of newly added hydrogen refueling stations can be expressed using the calculations from Equation (15):
T = u · y v
where T is the driving time to the nearest hydrogen refueling station; y is the number of newly added stations; u and v are two coefficients that are related to the transportation network and the distribution of hydrogen demand in the region. In general, the value of v is between 0.3 and 0.5. Using the hydrogen demand distribution and transportation network, the relationship between the average driving time and the number of new hydrogen refueling stations in Jiading District can be calculated. The fitting curve is shown in Figure 5, and the fitting calculation has been given earlier in Equation (16):
T = 6.074 · y 0.3149
That is, v is equal to 0.3149, within the range of 0.3–0.5 obtained in the previous literature. In addition, in terms of the error of fitting results, SSE = 0.1248 and R2 = 0.9885, which also indicate that the fitting result is accurate enough.

3.2.2. Comparison of Three Station Location Optimization Models

In this paper, the set covering model has been improved. Here, the set covering model, the improved set covering model, and the p-median model are compared. Figure 6 shows the station location of the set covering model and the p-median model when the given driving time is 5 min in the set covering model. Table 4 shows the comparison of specific factors of the three models in Period 10.
It can be seen that the set covering model is more inclined to cover more zones in geographical space, and the distribution of hydrogen refueling stations is more uniform in that space, which makes the space-weighted average driving time and the maximum driving time of this model the shortest of the three models. However, the set covering model treats all zones covered equally, which may give some zones with high hydrogen demand a relatively long driving time, such as the new hydrogen refueling station in Zone K5. Therefore, the demand-weighted average driving time of the set covering model is the longest. The goal of the p-median model is to minimize the average driving time, with hydrogen demand as weight, so the model is optimal in this term. However, the p-median model tends to locate stations at zones with high hydrogen demand, in order to reduce the driving time at these zones. When the driving time of these zones is short enough, such optimization is unnecessary. Instead, it may ignore the zones with low hydrogen demand, resulting in a biased spatial distribution of stations. For example, there are no hydrogen refueling stations in the north and east of Jiading District when using the p-median model. Therefore, the space-weighted average driving time of the p-median model is the largest. The improved set covering model proposed in this paper improves the disadvantages of the above two models so that the model can not only take into account some zones with large areas but low hydrogen demand but also give those zones with high hydrogen demand a relatively short driving time.
The above comparison results show that compared with the set covering model and p-median model used by previous scholars, the improved set covering model established in this paper can take into account the advantages of both models. Besides, flow-based models are also commonly used in the literature for station location optimization. However, the acquisition of flow data is one of the difficulties in the application of such models, which is also the reason why this paper chooses the node-based model for station location optimization.
In addition to station location optimization, more and more attention is given to the determination of hydrogen demand in the hydrogen refueling station location model, because meeting the demand of users more efficiently is the goal of the hydrogen refueling station location model, so the estimation of hydrogen demand has a direct influence on the location selection of hydrogen refueling stations. Some scholars have considered the spatial distribution of hydrogen demand and station location optimization, such as Rongheng Lin et al. [20], while other scholars consider the growth of hydrogen demand with time and station location optimization, such as Yongpark et al. [22] and Yushan Li et al. [23]. In this paper, these three aspects are included in the model, and according to the actual situation, hydrogen demand is divided into passenger cars and commercial vehicles to build a more comprehensive model.

4. Conclusions

In this paper, a multi-period hydrogen refueling station location model is proposed, including the modeling of the spatial distribution of hydrogen demand, the modeling of variation of hydrogen demand over time, and the modeling of station location optimization. In addition, there are differences in modeling methods and data according to the differences between passenger cars and commercial vehicles. In terms of the spatial distribution of passenger cars, the weighted method of various socioeconomic factors is adopted. In this step, those factors with different units are normalized. In terms of commercial vehicles, buses are the main consideration, and the hydrogen demand is directly on the network of bus routes. In the modeling of the variation of hydrogen demand over time, the generalized Buss diffusion model has been adopted, and the number of hydrogen refueling stations is taken as the external function. In regard to the station location optimization model, the set covering model is improved, and the greedy algorithm is used to solve problems. Finally, taking the Jiading District of Shanghai as an example, the growing trend of passenger cars and commercial vehicles, and the locations of hydrogen refueling stations in each period, are calculated. Through the analysis of the results, it can also be seen that the construction of hydrogen refueling stations plays a major role in the early stage of the promotion of HFCVs. The results of the three location optimization models are compared, to illustrate the effectiveness of the improved set covering model in this paper.
Further research can be carried out from the following perspectives. The classification of hydrogen demand can be more carefully assessed and, in the generalized Bass diffusion model, in addition to the factor of hydrogen refueling stations, other external factors, such as government policies and the prices of HFCVs and hydrogen, can also be considered, which may make the prediction of hydrogen demand more accurate. In terms of the algorithm, the greedy strategy is an approximate algorithm. Although it has high efficiency, the calculation results may not be accurate enough. Thus, the algorithm can be optimized to make the calculation results more reliable.

Author Contributions

Conceptualization, Q.Z., H.L., W.Z. and C.Z.; investigation, Q.Z.; resources, H.L., W.Z.; writing—original draft preparation, Q.Z.; writing—review and editing, Q.Z. and H.L.; visualization, Q.Z.; supervision, H.L.; project administration, H.L. and C.Z.; funding acquisition, H.L., W.Z. and C.Z. All authors have read and agreed to the published version of the manuscript.

Funding

This research was funded by the Key Applied Research Projects of Science and Technology Commission of Shanghai, grant number 18DZ1201900.

Conflicts of Interest

The authors declare no conflict of interest.

References

  1. Orange Group. Available online: https://baijiahao.baidu.com/s?id=1688103749623276518&wfr=spider&for=pc (accessed on 1 June 2021).
  2. China Society of Automotive Engineers. Available online: https://wenku.baidu.com/view/413d2b8469d97f192279168884868762caaebb85.html (accessed on 29 October 2020).
  3. Honma, Y.; Kuby, M. Node-based vs. path-based location models for urban hydrogen refueling stations: Comparing convenience and coverage abilities. Int. J. Hydrogen Energy 2019, 44, 15246–15261. [Google Scholar] [CrossRef]
  4. Itaoka, K.; Kimura, S.; Hirose, K. Methodology Development to Locate Hydrogen Stations for the Initial Deployment Stage. E3S Web Conf. 2019, 83, 01014. [Google Scholar] [CrossRef]
  5. Kuby, M. The opposite of ubiquitous: How early adopters of fast-filling alt-fuel vehicles adapt to the sparsity of stations. J. Transp. Geogr. 2019, 75, 46–57. [Google Scholar] [CrossRef]
  6. Lin, R.-H.; Ye, Z.-Z.; Wu, B.-D. A review of hydrogen station location models. Int. J. Hydrogen Energy 2020, 45, 20176–20183. [Google Scholar] [CrossRef]
  7. Stephens-Romero, S.D.; Brown, T.M.; Kang, J.E.; Recker, W.W.; Samuelsen, G.S. Systematic planning to optimize investments in hydrogen infrastructure deployment. Int. J. Hydrogen Energy 2010, 35, 4652–4667. [Google Scholar] [CrossRef] [Green Version]
  8. Nicholas, M.A.; Handy, S.L.; Sperling, D. Using geographic information systems to evaluate siting and networks of hydrogen stations. J. Transp. Res. Board 2004, 1880, 126–134. [Google Scholar] [CrossRef]
  9. Lin, C.-C.; Lin, C.-C. The p-center flow-refueling facility location problem. Transp. Res. Part B Methodol. 2018, 118, 124–142. [Google Scholar] [CrossRef]
  10. Advanced Power and Energy Program University of California, Irvine. Available online: https://ww2.energy.ca.gov/2015publications/CEC-600-2015-005/CEC-600-2015-005.pdf (accessed on 10 February 2021).
  11. Hodgson, M.J. A Flow-Capturing Location-Allocation Model. Geogr. Anal. 1990, 22, 270–279. [Google Scholar] [CrossRef]
  12. Kuby, M.; Lim, S. The flow-refueling location problem for alternative-fuel vehicles. Socio-Econ. Plan. Sci. 2004, 39, 125–145. [Google Scholar] [CrossRef]
  13. Miralinaghi, M.; Lou, Y.; Keskin, B.B.; Yu-Ting, H.; Ramin, S. Refueling station location problem with traffic deviation considering route choice and demand uncertainty. Int. J. Hydrogen Energy 2017, 42, 3335–3351. [Google Scholar] [CrossRef]
  14. Upchurch, C.; Kuby, M.; Lim, S. A Model for Location of Capacitated Alternative-Fuel Stations. Geogr. Anal. 2009, 41, 127–148. [Google Scholar] [CrossRef]
  15. Hosseini, M.; MirHassani, S.A.; Hooshmand, F. Deviation-flow refueling location problem with capacitated facilities: Model and algorithm. Transp. Res. Part D-Transp. Environ. 2017, 54, 269–281. [Google Scholar] [CrossRef]
  16. Cheng, Y.; Wang, L. A location model for capacitated alternative-fuel stations with uncertain traffic flows. Comput. Ind. Eng. 2020, 145, 106486. [Google Scholar] [CrossRef]
  17. Fotheringham, A.S.; Crespo, R.; Yao, J. Geographical and temporal weighted regression (GTWR). Geogr. Anal. 2015, 47, 431–452. [Google Scholar] [CrossRef] [Green Version]
  18. Zhang, X.; Huang, B.; Zhu, S. Spatiotemporal Influence of Urban Environment on Taxi Ridership Using Geographically and Temporally Weighted Regression. ISPRS Int. J. Geo-Inf. 2019, 8, 23. [Google Scholar] [CrossRef] [Green Version]
  19. Ma, X.; Zhang, J.; Ding, C.; Wang, Y. A geographically and temporally weighted regression model to explore the spatiotemporal influence of built environment on transit ridership. Comput. Environ. Urban Syst. 2018, 70, 113–124. [Google Scholar] [CrossRef]
  20. Ewert, R.; Grahle, A.; Martins-Turner, K.; Syré, A.M.; Nagel, K.; Göhlich, D. Electrification of Urban Waste Collection: Introducing a Simulation-Based Methodology for Technical Feasibility, Impact and Cost Analysis. World Electr. Veh. J. 2021, 12, 122. [Google Scholar] [CrossRef]
  21. Adenaw, L.; Lienkamp, M. Multi-Criteria, Co-Evolutionary Charging Behavior: An Agent-Based Simulation of Urban Electromobility. World Electr. Veh. J. 2021, 12, 18. [Google Scholar] [CrossRef]
  22. Melendez, M.; Milbrandt, A. Available online: https://www.nrel.gov/docs/fy08osti/42224.pdf (accessed on 10 February 2021).
  23. Campbell, A.R.; Ryley, T.; Thring, R. Identifying the early adopters of alternative fuel vehicles: A case study of Birmingham, United Kingdom. Transp. Res. Part A Policy Pract. 2012, 46, 1318–1327. [Google Scholar] [CrossRef] [Green Version]
  24. He, S.Y.; Kuo, Y.-H.; Wu, D. Incorporating institutional and spatial factors in the selection of the optimal locations of public electric vehicle charging facilities: A case study of Beijing, China. Transp. Res. Part C Emerg. Technol. 2016, 67, 131–148. [Google Scholar] [CrossRef]
  25. Lin, R.; Ye, Z.; Guo, Z.; Wu, B.D. Hydrogen station location optimization based on multiple data sources. Int. J. Hydrogen Energy 2020, 45, 10270–10279. [Google Scholar] [CrossRef]
  26. Shoemaker, M.H. Available online: https://scholarship.claremont.edu/cgi/viewcontent.cgi?referer=https://cn.bing.com/&httpsredir=1&article=1405&context=cmc_theses (accessed on 23 April 2012).
  27. Park, S.Y.; Kim, J.W.; Lee, D.H. Development of a market penetration forecasting model for Hydrogen Fuel Cell Vehicles considering infrastructure and cost reduction effects. Energy Policy 2011, 39, 3307–3315. [Google Scholar] [CrossRef]
  28. Li, Y.; Cui, F.; Li, L. An integrated optimization model for the location of hydrogen refueling stations. Int. J. Hydrogen Energy 2018, 43, 19636–19649. [Google Scholar] [CrossRef]
  29. Meyer, P.E.; Winebrake, J.J. Modeling technology diffusion of complementary goods: The case of hydrogen vehicles and refueling infrastructure. Technovation 2009, 29, 77–91. [Google Scholar] [CrossRef]
  30. Guerra, C.F.; García-Ródenas, R.; Sánchez-Herrera, E.A.; Rayo, D.V.; Clemente-Jul, C. Modeling of the behavior of alternative fuel vehicle buyers. A model for the location of alternative refueling stations. Int. J. Hydrogen Energy 2016, 41, 19312–19319. [Google Scholar] [CrossRef] [Green Version]
  31. Keith, D.R.; Struben, J.J.R.; Naumov, S. The diffusion of alternative fuel vehicles: A generalized model and future research Agenda. J. Simul. 2020, 14, 260–277. [Google Scholar] [CrossRef]
  32. Bass, F.M.; Krishnan, T.V.; Jain, D.C. Why the Bass Model Fits Without Decision Variables. Mark. Sci. 1994, 13, 203–223. [Google Scholar] [CrossRef]
  33. Marques Benvenutti, L.M.; Ribeiro, A.B.; Uriona, M. Long term diffusion dynamics of alternative fuel vehicles in Brazil. J. Clean. Prod. 2017, 164, 1571–1585. [Google Scholar] [CrossRef]
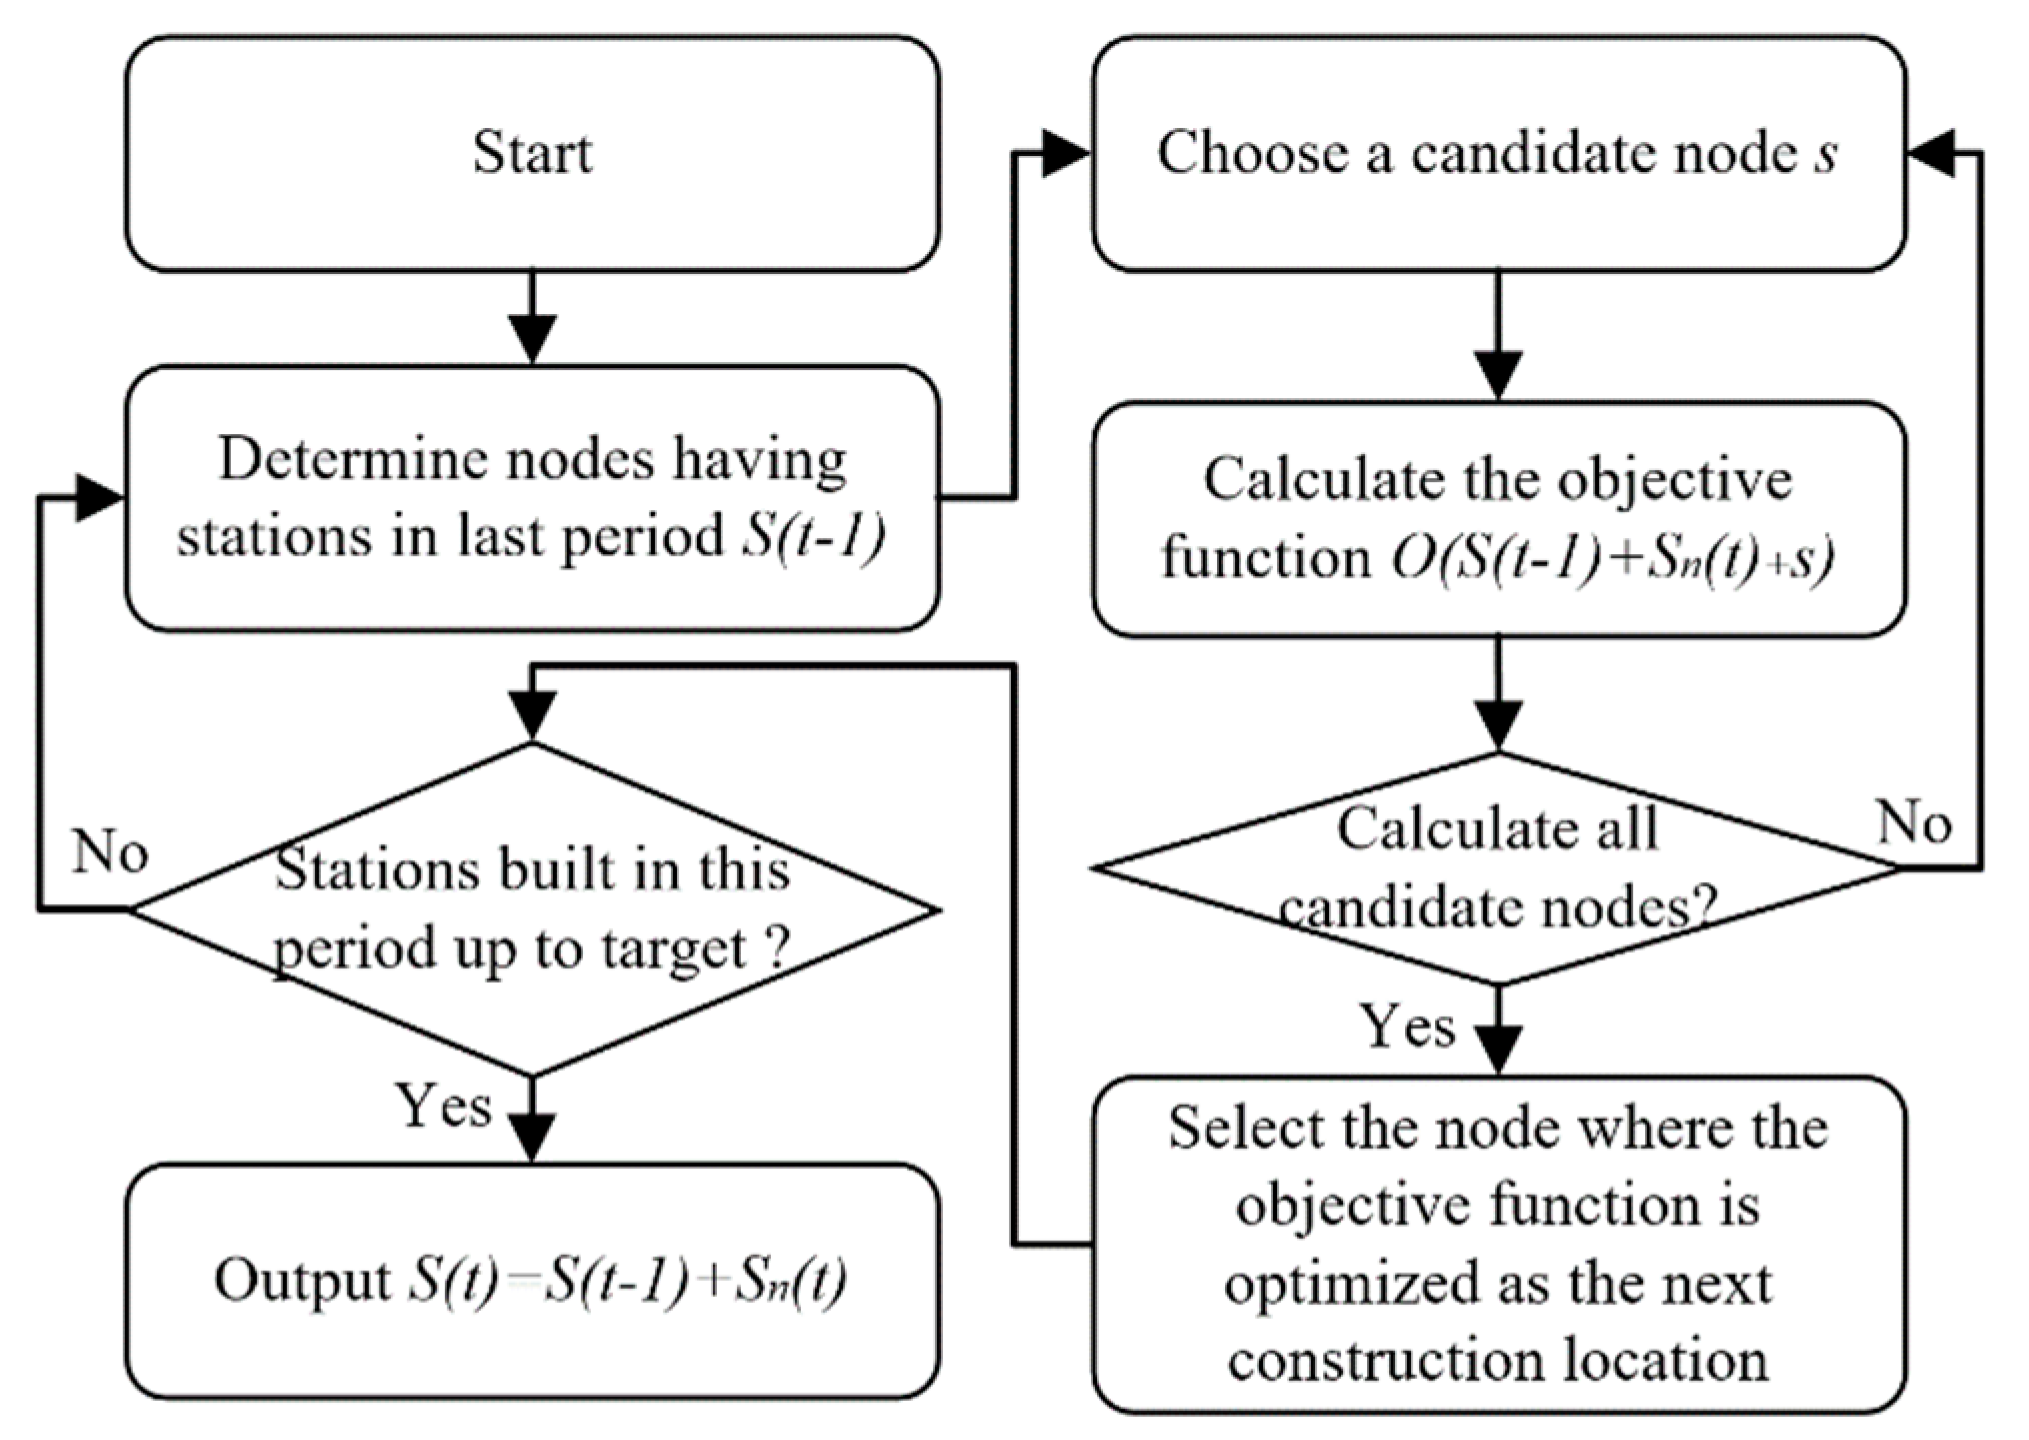
Figure 1. The procedure of calculating the location of stations in each period by a greedy algorithm.
Wevj 12 00146 g001
Figure 2. The calculation procedure of the whole model.
Wevj 12 00146 g002
Figure 3. Zones of Jiading District, final hydrogen demand density, and locations of hydrogen refueling stations (unit: kg/km2).
Wevj 12 00146 g003
Figure 4. Trends in hydrogen demand at different periods.
Wevj 12 00146 g004
Figure 5. Relationship between average driving time and the number of new stations in Jiading District.
Wevj 12 00146 g005
Figure 6. Station locations: (a) set covering model; (b) p-median model (unit: kg/km2).
Wevj 12 00146 g006
Table 1. The value of the parameters in GBDM.
Parameterpqam
Passenger cars0.00010.10745.3853400,000
Commercial vehicles0.00780.03915.3853account for 50%
Table 2. Construction locations of hydrogen refueling stations in each period.
Period0 (Existing)1234
Locations of stationsH13, H14, J7, J39, J42, K19E1,, L5, G5C7, K8, B6C17, J22, J5G3, A3, L17
Table 3. The top 11 zones with the most hydrogen demand for buses and stations nearby, in Period 1.
ZoneFinal Hydrogen Demand for Buses (kg)Station Nearby
D7533.98E1
D5524.775E1
J26415.45J42
C24313.145G5
G6282.85G5
D2237.38E1
J36175.14J39
L14158.825L5
C22151.24G5
I1145.99K19
L8145.73L5
Table 4. Comparison of three station location optimization models.
ModelAverage Driving Time with Demand as Weight (min)Average Driving Time with Space as Weight (min)Maximum Driving Time (min)
Set covering model3.083.087.8
Improved set covering model2.783.168.6
p-median model2.463.569.4
Publisher’s Note: MDPI stays neutral with regard to jurisdictional claims in published maps and institutional affiliations.