Abstract
Research on manufacturing components for electric vehicles plays a vital role in their development. Furthermore, significant advancements in additive manufacturing processes have revolutionized the production of various parts. By establishing a system that enables the recovery, processing, and reuse of metal powders essential for additive manufacturing, we can achieve sustainable production of electric vehicles. This approach holds immense importance in terms of reducing manufacturing costs, expanding the market, and safeguarding the environment. In this study, we developed an additive manufacturing system for recycled metal powders, encompassing powder variety, properties, processing, manufacturing, component properties, and applications. This system was used to create a knowledge graph providing a convenient resource for researchers to understand the entire procedure from recycling to application. To improve the graph’s accuracy, we employed ChatGPT and BERT training. We also demonstrated the knowledge graph’s utility by processing recycled 316 L stainless steel powders and assessing their quality through image processing. This experiment serves as a practical example of recycling and analyzing powders using the established knowledge graph.
1. Introduction
Metal powder recycling has become an essential component of the circular economy, offering an innovative solution to conserving valuable resources while minimizing waste and environmental impacts. With the rising demand for metals due to rapid industrialization and technological advancements, there is a need for efficient and sustainable recycling methods [1]. Metal powder recycling, which encompasses the collection, sorting, and processing of waste metal powders, holds great potential for resource recovery and reuse across various industries [2].
The recycling process typically begins with collecting waste metal powders generated during manufacturing processes, such as additive manufacturing, metal injection molding, and powder metallurgy. These powders are then sorted by composition and properties using techniques like magnetic separation, air classification, and sieving. Once sorted, they undergo further processing, including decontamination, size reduction, and consolidation, to enable their reuse [3].
Recycled metal powders have found valuable applications in industries such as aerospace, automotive, and electronics, where they can replace primary resources in manufacturing components and products. By integrating recycled metal powders, these industries can significantly reduce their carbon footprint, material costs, and reliance on virgin materials, fostering a more sustainable and circular economy [4].
Current research on additive manufacturing of recycled metal powder primarily revolves around three aspects: metal powder recovery, recycled powder treatment, and mechanical properties of manufactured parts. However, a limitation exists as most studies focus on a limited set of metals and address only specific stages of the overall powder recovery, treatment, and reuse process. To address this, developing a comprehensive system encompassing the entire process for commonly used metal powders, from recovery to reuse, holds immense potential to enhance convenience and efficiency in the powder additive manufacturing industry. Such a system would promote sustainable manufacturing, environmental protection, and cost reduction. This paper aims to develop a comprehensive additive manufacturing system for recycled metal powder. Based on the system’s framework and the associated processes and parameters, future researchers can recycle metal powders and create additive components. These components can then be tested for performance and selected for suitable applications, as suggested by the system, ultimately contributing to more sustainable manufacturing practices.
Once the additive manufacturing system for recycled metal powder is established, a knowledge graph for this system is subsequently constructed. Knowledge graphs are potent tools that represent and organize information in a structured, interconnected manner [5]. They offer numerous benefits across various domains, such as search engines, artificial intelligence, and data analysis. Key advantages of knowledge graphs include:
(1) In-depth semantic understanding. Knowledge graphs enable a deeper comprehension of concepts and their relationships, facilitating the understanding of complex topics and delivering more accurate search results.
(2) Advanced search capabilities. By comprehending the relationships between entities, knowledge graphs enhance search engines’ contextual and intent-based relevancy.
(3) Data integration and interoperability. Knowledge graphs merge data from diverse sources, formats, and domains, simplifying the creation of a unified information view and promoting data sharing and collaboration.
(4) Refined AI and machine learning. Knowledge graphs contribute to context-aware AI models with improved natural language understanding and processing, making them more effective in tasks like recommendation systems, chatbots, and question-answering systems.
(5) Intuitive visualization and exploration. Knowledge graphs facilitate complex information visualization, allowing users to interact with data in more meaningful ways.
(6) Expedited decision-making. By offering a comprehensive information view, knowledge graphs enable organizations to make better-informed decisions swiftly.
(7) Personalized experiences. Knowledge graphs help understand user preferences and behaviors, leading to personalized experiences in applications like e-commerce, content recommendations, and targeted advertising.
(8) Scalability. Knowledge graphs can scale horizontally and vertically, integrating new data sources, entities, and relationships as they arise.
(9) Flexibility and adaptability. Knowledge graphs can easily adapt to data or requirement changes, making them versatile information management tools.
(10) Standardization and reusability. Knowledge graphs employ standardized ontologies and vocabularies, ensuring consistency and reusability across various applications and domains.
Researchers benefit greatly from the knowledge graph when working with metal powder recycling, processing, and reuse. Beyond the system and knowledge graph, the recycling process for 316 L stainless steel powders, guided by the knowledge graph method, is executed. Subsequently, image processing is employed to evaluate the process’s effectiveness. This serves as an appropriate example of recycled powder processing and analysis using the knowledge graph developed in this study. Finally, ChatGPT [6] and BERT training [7] are implemented to enhance the knowledge graph’s accuracy.
2. Additive Manufacturing System of Recycled Metal Powder
The additive manufacturing system of recycled metal powder encompasses metal powder variety and property, metal powder process, metal powder manufacturing, metal powder manufacturing component property, and metal powder applications.
2.1. Metal Powder Variety and Property
The commonly used alloys for additive manufacturing include Al alloy, Ni alloy, Cu alloy, Ti alloy, Fe alloy, and Mg alloy. The metal powder property includes sphericity, powder size distribution, modulus of elasticity, porosity, and purity.
2.2. Metal Powder Process
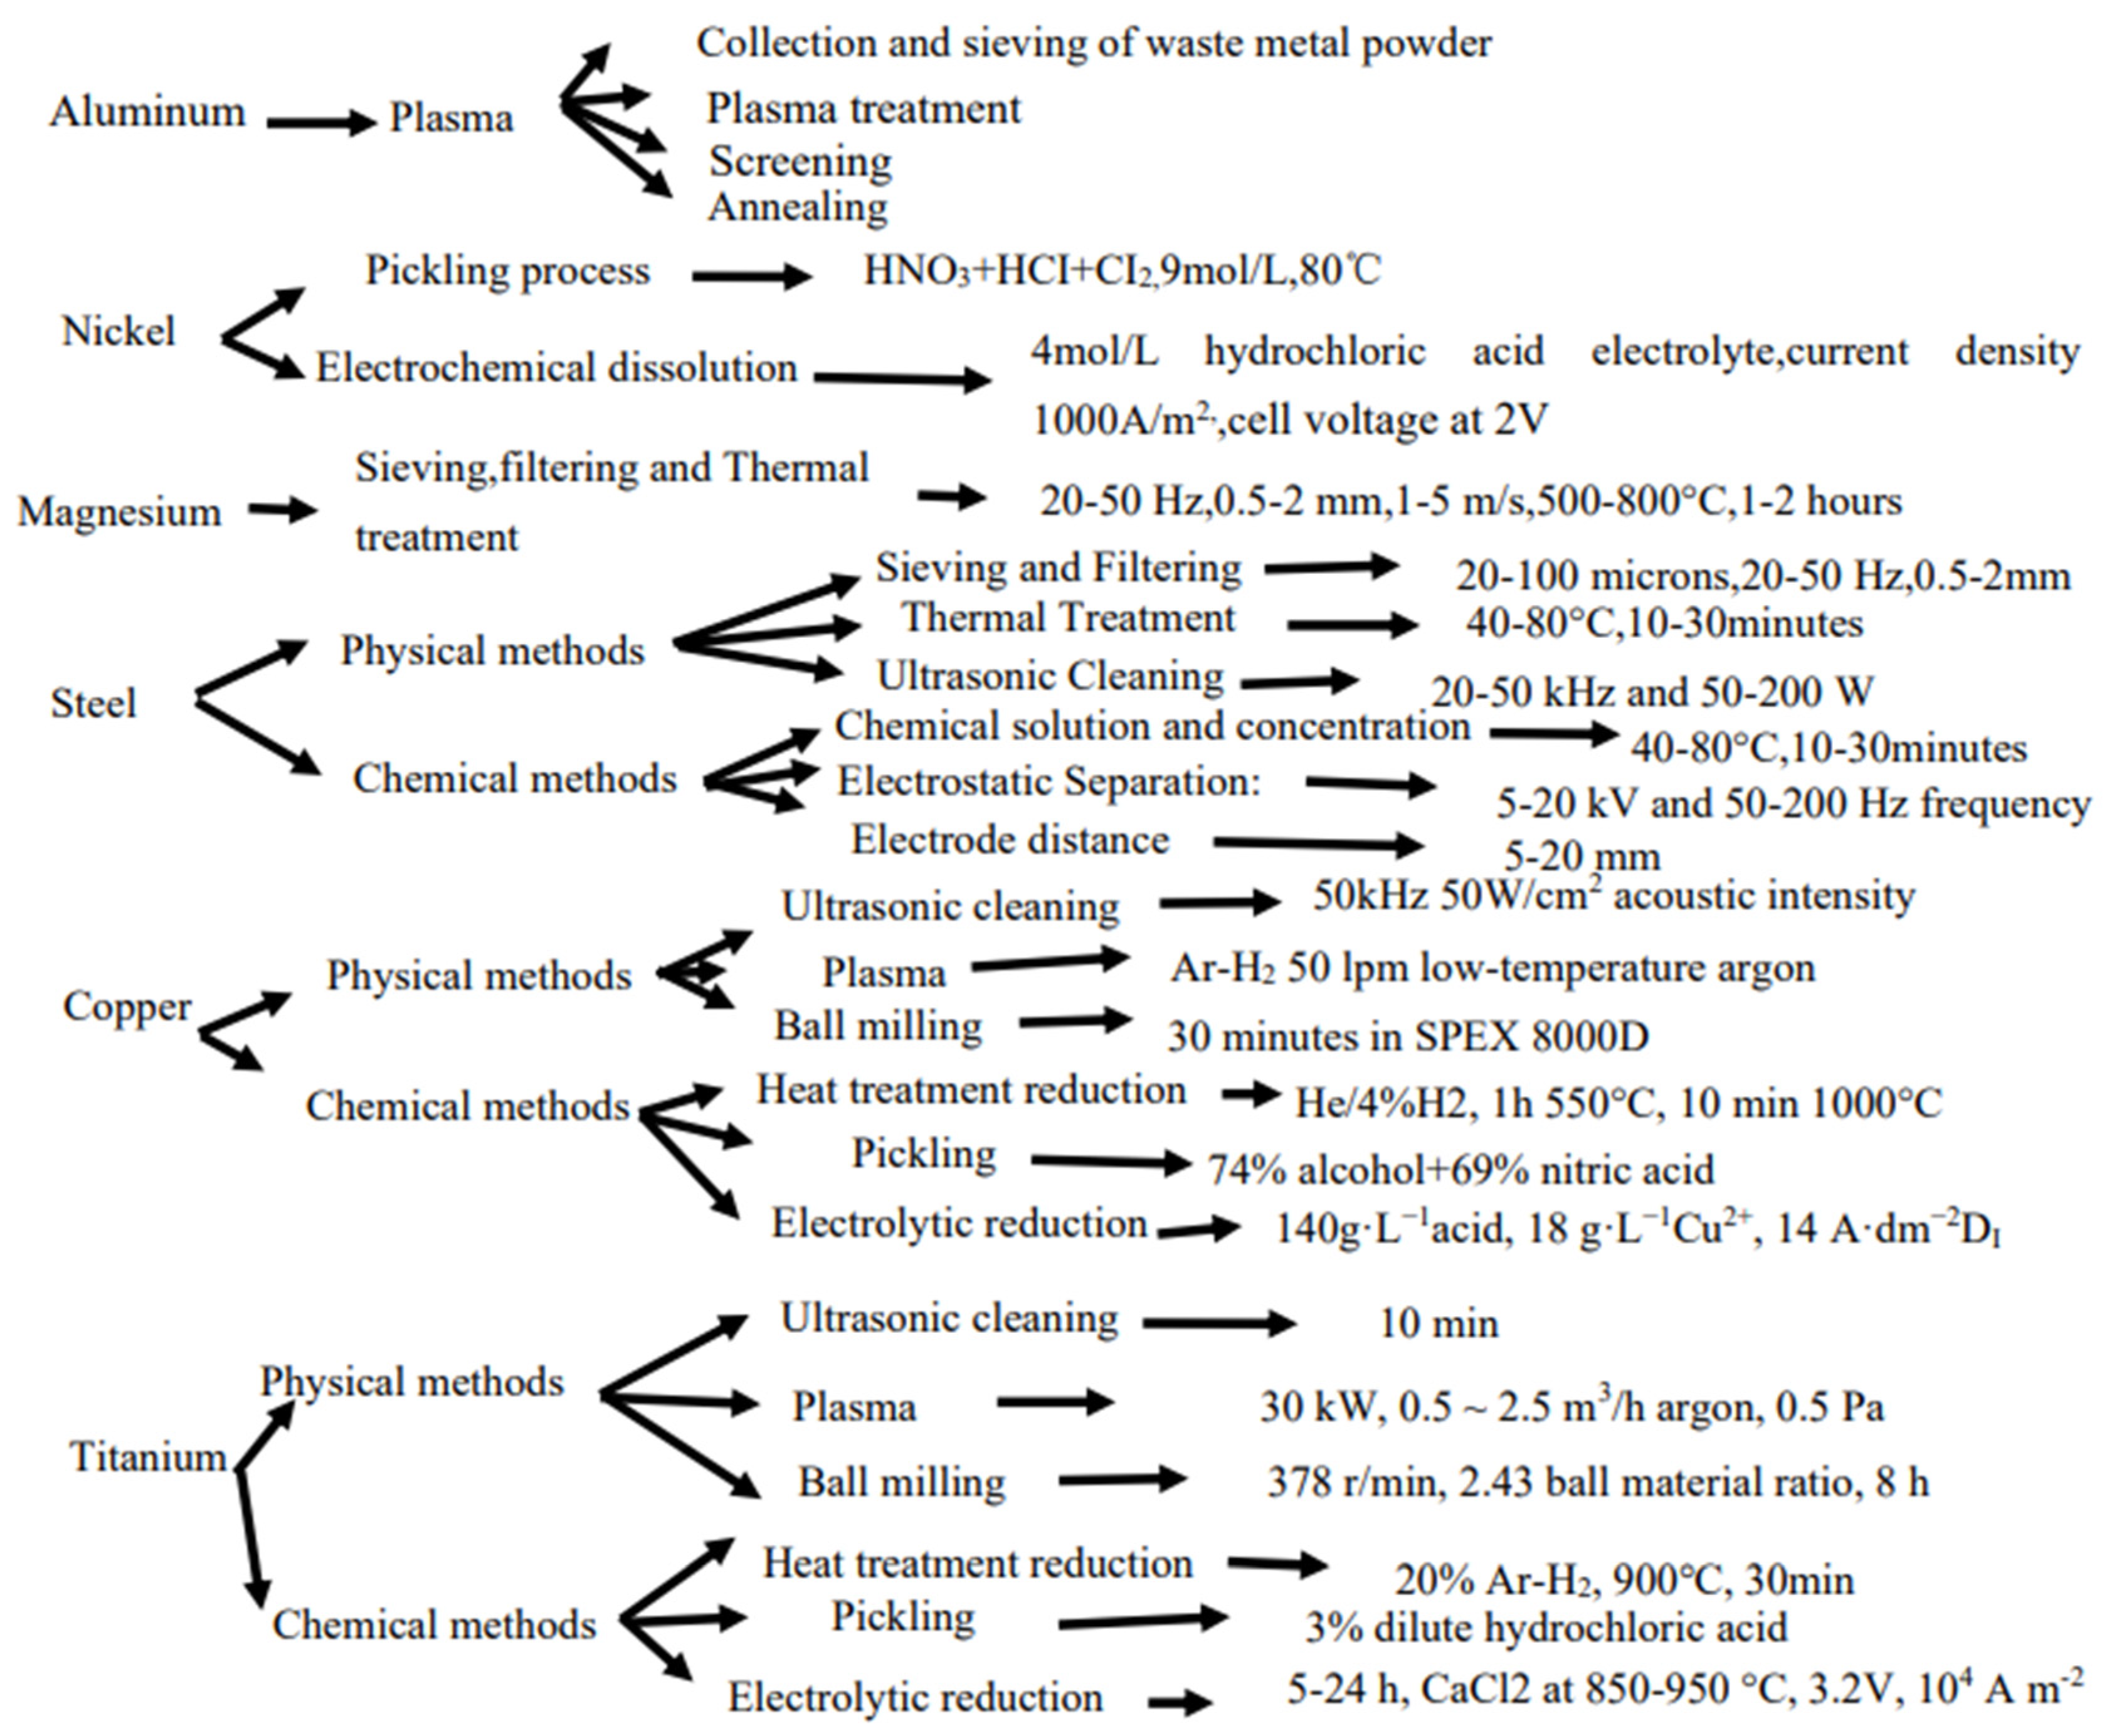
The methods and parameters of the metal powder process are presented in Figure 1 [8,9,10,11,12,13,14,15,16,17,18,19,20].
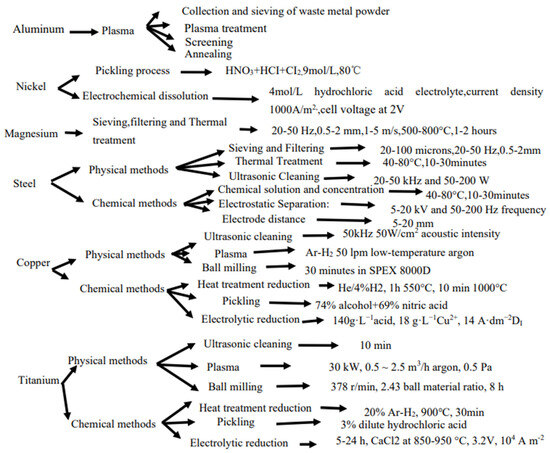
Figure 1.
Metal powder process.
2.3. Metal Powder Manufacturing
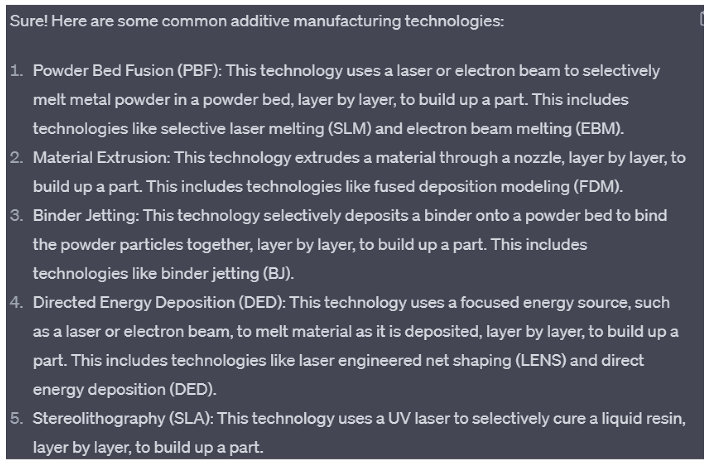
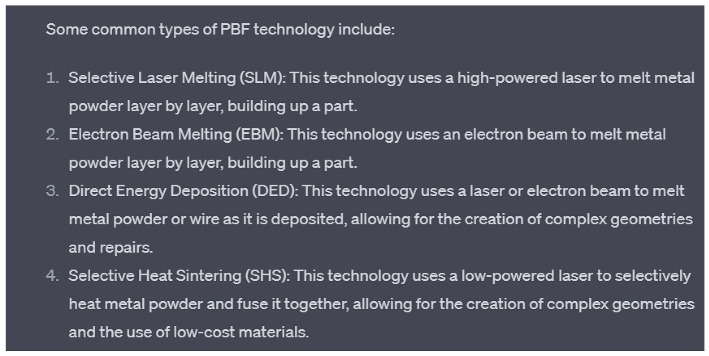
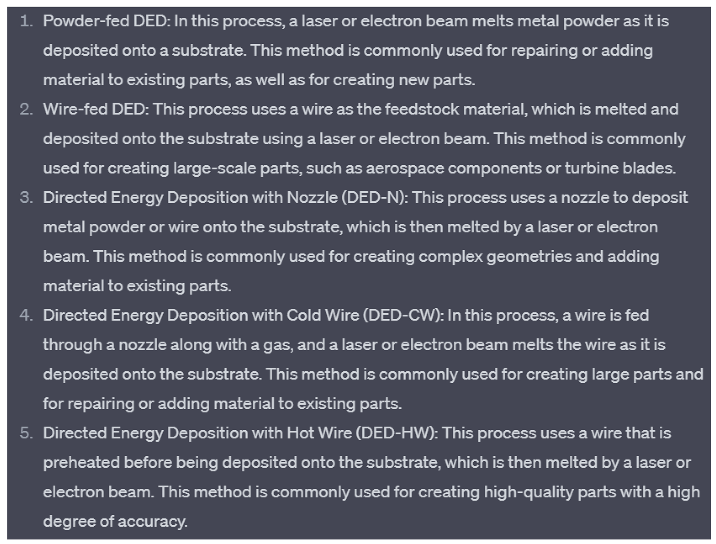
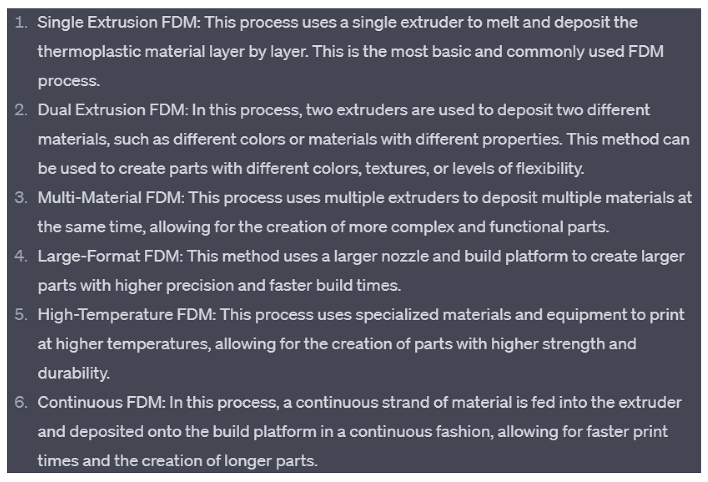
The processed powders can be used for manufacturing the products by the following AM technology, such as powder bed fusion, direct energy deposition, material extrusion, material jetting, sheet lamination [21,22,23,24,25].
2.4. Metal Powder Manufacturing Component Property
Several test methods assess additive manufactured components’ properties, including compression, tensile, fatigue, hardness, impact, microstructure analysis, three-point bending, creep, and dynamic mechanical analysis (DMA).
2.5. Metal Powder Applications in Vehicle Field
After printing from powders to additive products, the pre-treatment before use is an important step in ensuring the quality and functionality of the product. After that, manufactured products have a wide range of applications in the vehicle field, such as dashboards, vents, pipes, air spoilers, signs, brackets, housing and trunk covers, and more.
3. Knowledge Graph Building
3.1. Preliminary Establishment of Knowledge Graph
A knowledge graph (KG) is a structured semantic knowledge base used to describe concepts and their interrelationships in the physical world in symbolic form. Its basic constituent unit is the triplet of “entity-relationship-entity”, as well as the entity and its related attribute-value pairs [26]. Entities relate to each other through relations to form a network knowledge structure.
KGs can accurately describe complex knowledge in the domain through information extraction, data mining, speech matching, semantic computing, knowledge reasoning and other processes, and can describe the evolution process and development law of knowledge, to provide accurate, traceable, interpretable, and inferential knowledge data for research and decision making [27].
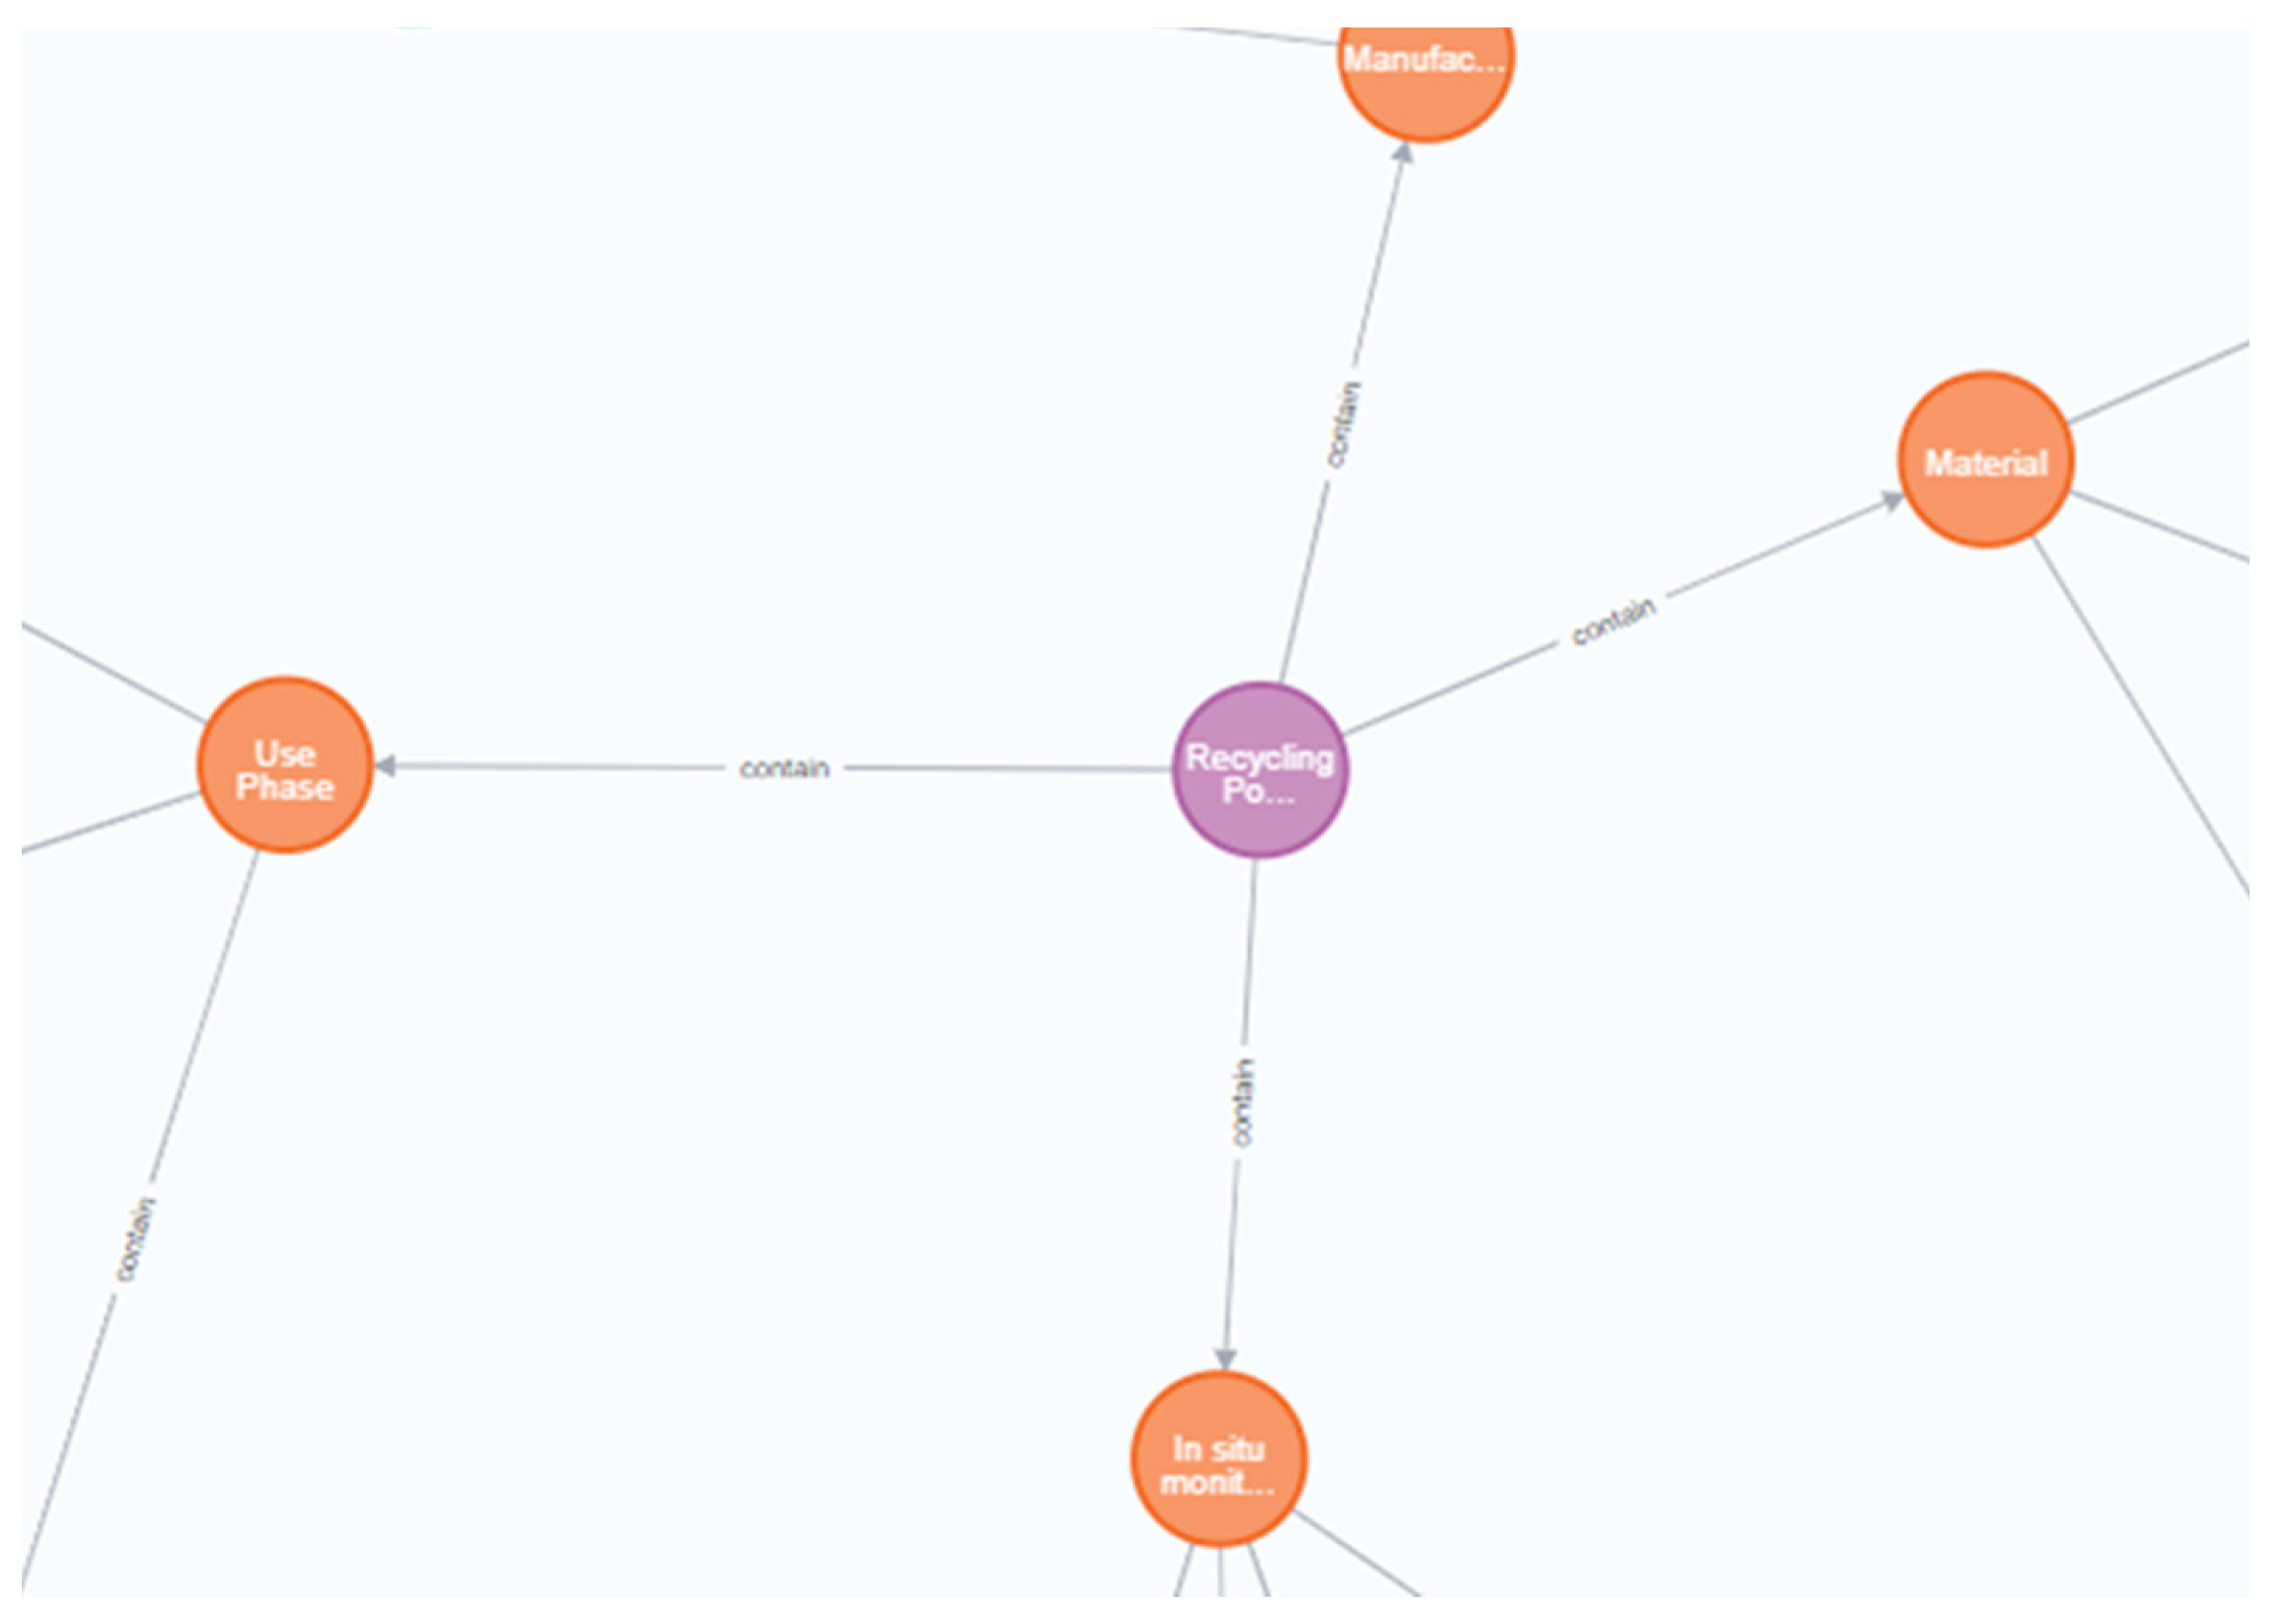
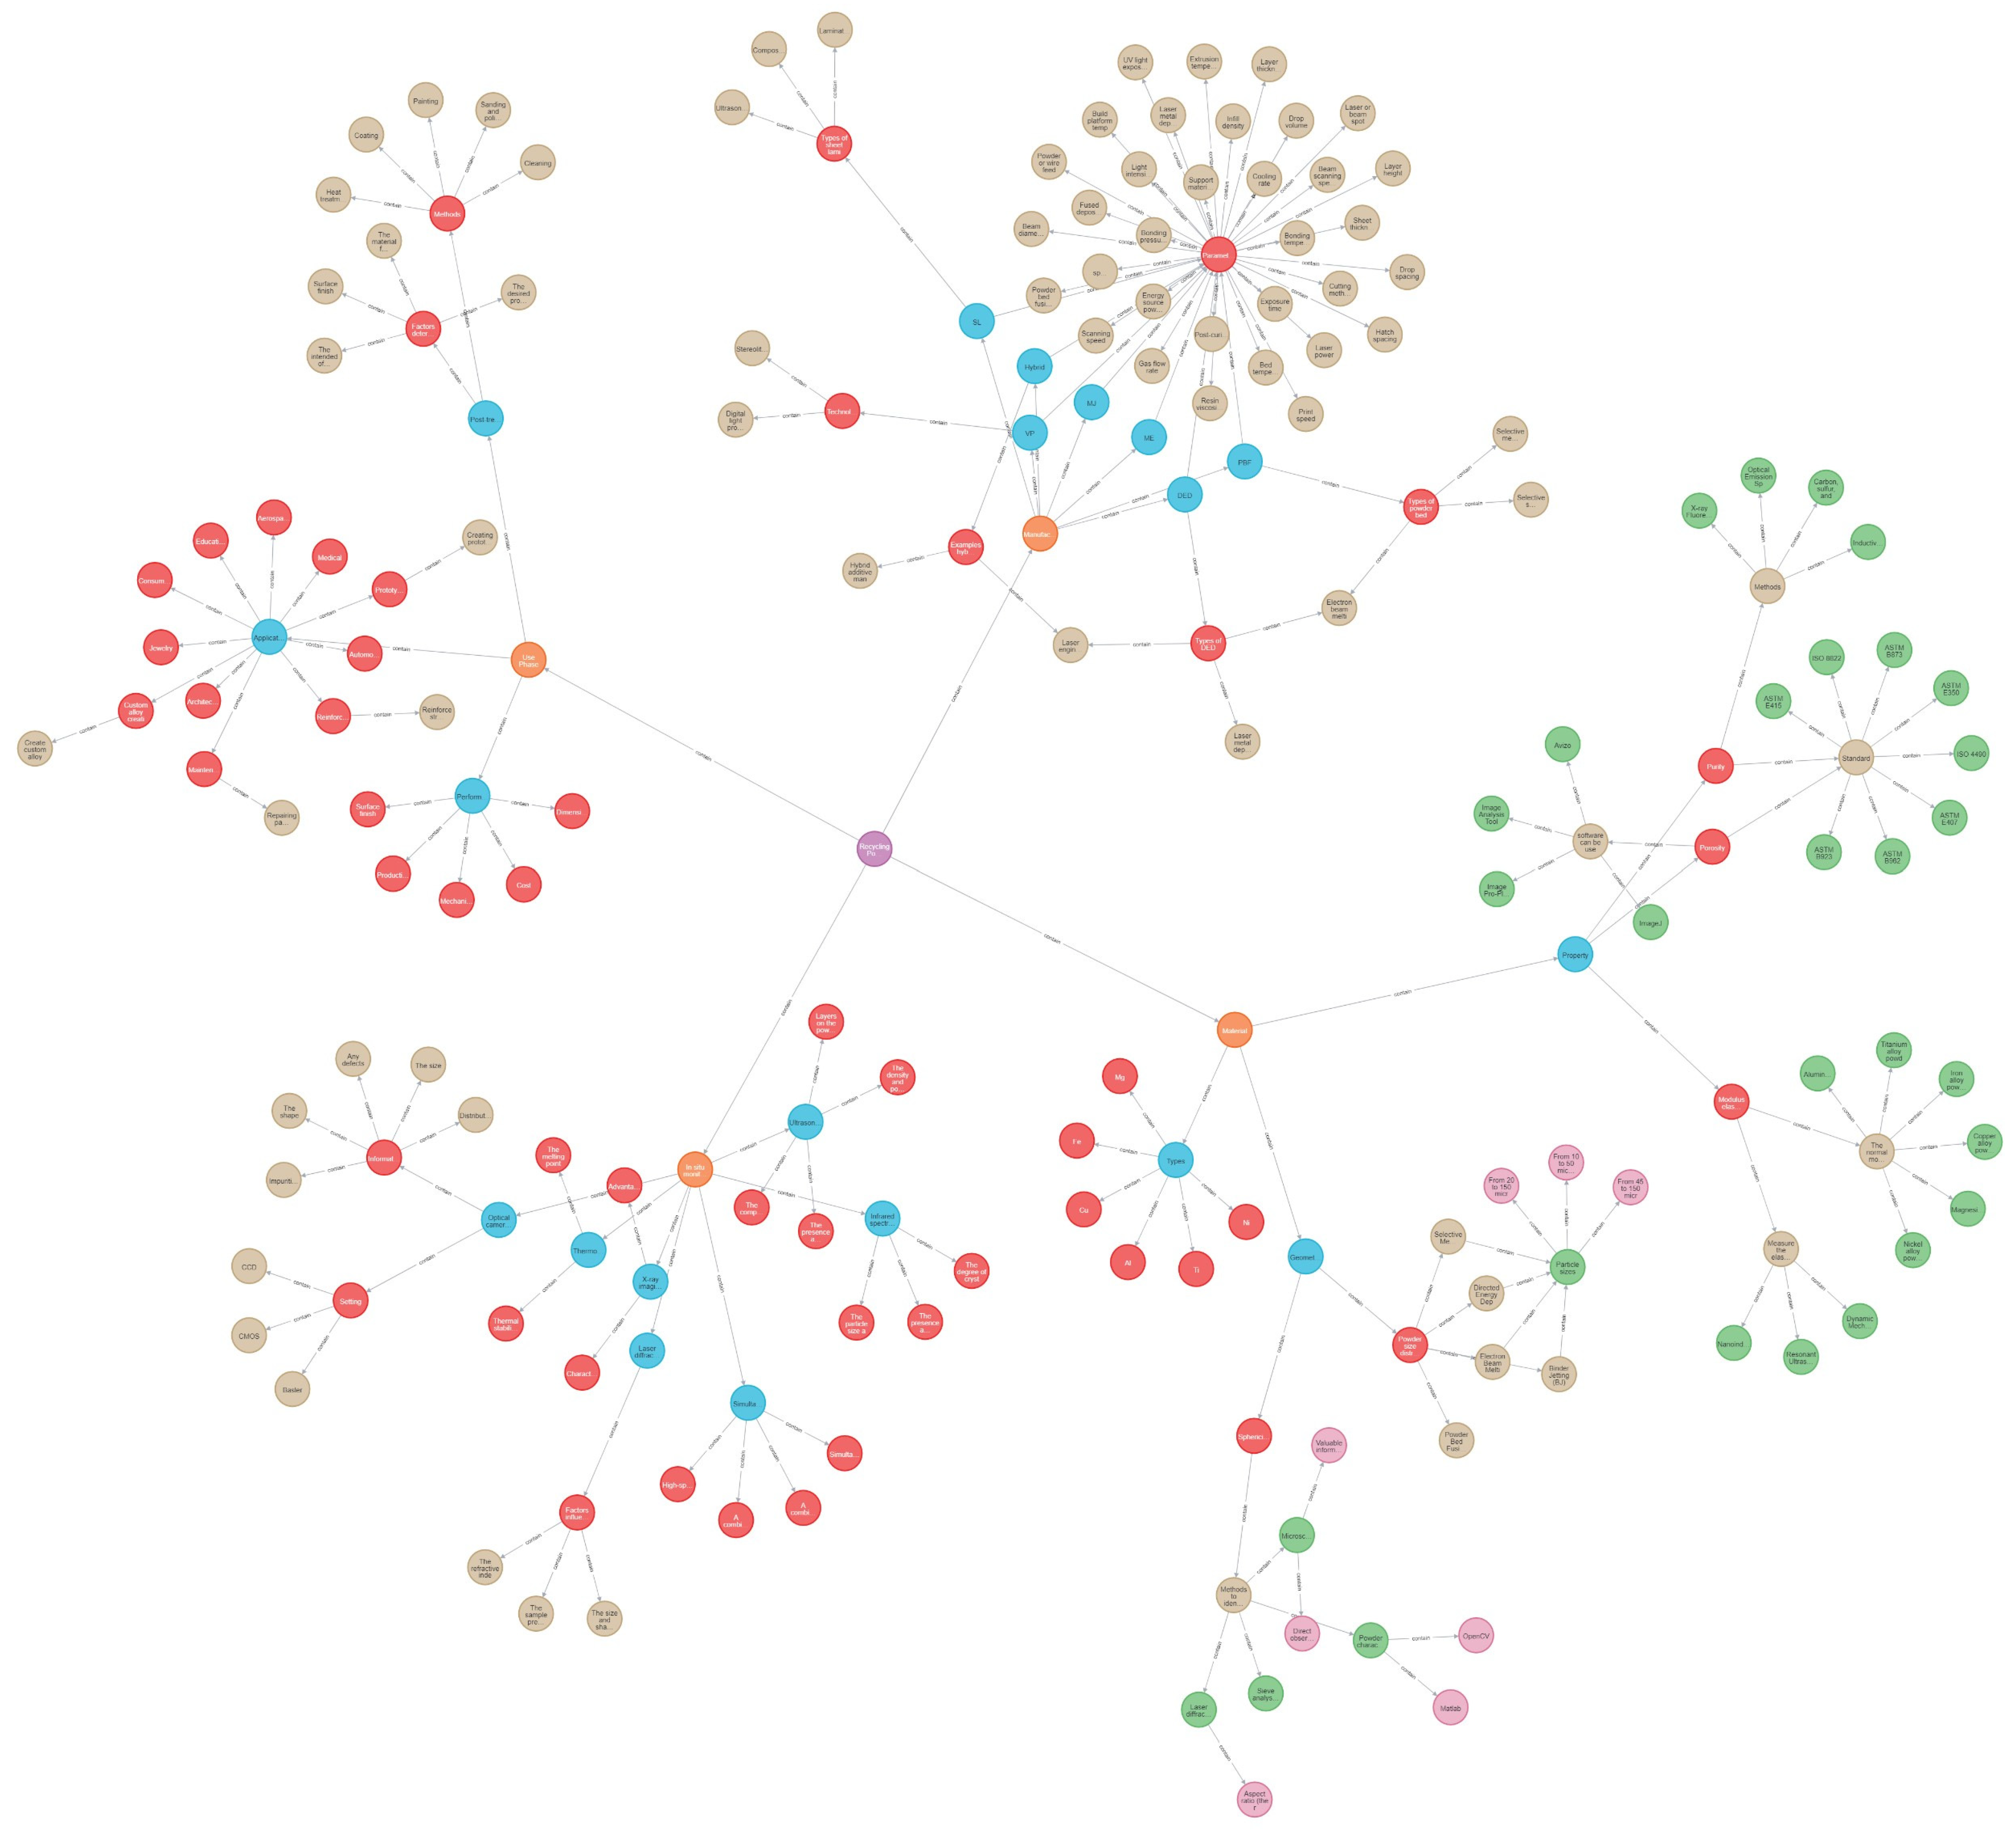
Neo4j is a graphical database based on Java. Neo4j provides a user-friendly web interface for configuration, write, query and other operations, and provides visual functions [28]. Neo4j has the following advantages: 1. It is very easy to represent connected data. 2. It is easier and faster to retrieve/traverse/navigate more connected data. 3. It represents semi-structured data very easily. 4. Neo4j CQL query language commands are in a humane readable format and very easy to learn. 5. It uses a simple and powerful data model. So, we will choose Neo4j to build our knowledge graph. Firstly, based on our project on smart manufacturing of additive manufacturing metal powder recycling, we take recycling metal powder as the first layer. According to the requirements of the project, this project can be divided into four parts: material, manufacturing processes, use phase (applications), and in situ monitoring, as shown in Figure 2.
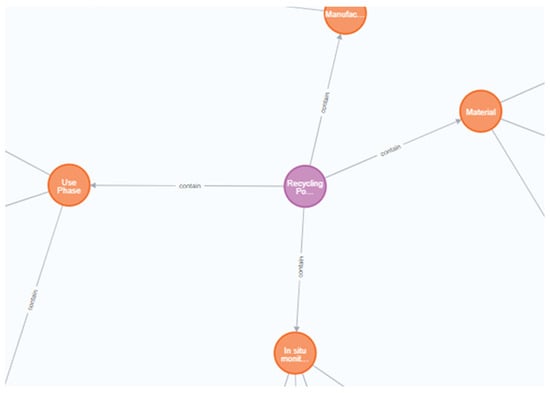
Figure 2.
Preliminary establishment of KG (Manufac…: Manufacturing, Recycling Po…: Recycling Point, In situ monit…: In situ monitor).
3.2. ChatGPT Training for Extending Knowledge Graph
The preliminary KG is based on the basic knowledge of the human brain and the information obtained by browsing and extracting the knowledge points in the paper. This approach has the following limitations:
It takes too much time for the relevant information to be extracted from many papers.
The information obtained is not necessarily comprehensive. A paper may only focus on one or several methods or parameters, so it is difficult to establish a compressive KG.
Access to academic papers is limited, so it is difficult to expand the KG further.
Because of these limitations, we need a new way to extend the knowledge graph. ChatGPT 4.0 and Google BERT are both powerful AI models, each with their own strengths and weaknesses. ChatGPT 4.0’s training data comes from a vast amount of language data on the internet, including news, Wikipedia, social media, and more. It uses deep learning technology, a transformer model architecture, has billions of parameters, and can handle natural language tasks like question and answer, conversation generation, text categorization, and more. ChatGPT 4.0 has the following advantages over other natural language processing models:
- More natural conversation generation.
- Better language understanding.
- Higher customizability.
Based on the above advantages, ChatGPT 4.0 was selected for knowledge enhancement of knowledge graph.
3.2.1. Validation of ChatGPT
Before using ChatGP4.0 to extend the knowledge graph, we needed to know if ChatGPT 4.0 has limitations on domain specific knowledge like aspect of additive manufacturing.
Therefore, we needed to compare the current knowledge graph with the answers obtained by ChatGPT 4.0 to test whether ChatGPT 4.0 has limitations on domain-specific knowledge. If ChatGPT 4.0 passed the tests, then we could use ChatGPT 4.0 to further expand the current knowledge graph.
Firstly, the method needs to be defined to determine whether ChatGPT passes validation. The relationship between the information in our current knowledge graph and the answers ChatGPT gave us are overlapping and they may have their own unique parts.
The number of messages unique to the KG is m, the number of messages unique to ChatGPT 4.0 is n, and the number of messages shared by the KG and ChatGPT 4.0 is p. The amount of information unique to ChatGPT 4.0 verified by reference to data and papers is q. The number of wrong answers given by ChatGPT4.0 is w. Then we used Pearson product moment correlation coefficient to measure the accuracy of ChatGPT 4.0.
If Corr(x, y) = −1 indicates that the two variables are completely negatively correlated.
If Corr(x, y) = 0 means there is no correlation between the two variables.
If Corr(x, y) = 1 indicates that the two variables are completely positively correlated.
The results to validate ChatGPT’s domain specific knowledge in additive manufacturing are shown in Table 1 below.

Table 1.
Verification process between current KG and ChatGPT.
3.2.2. ChatGPT Training
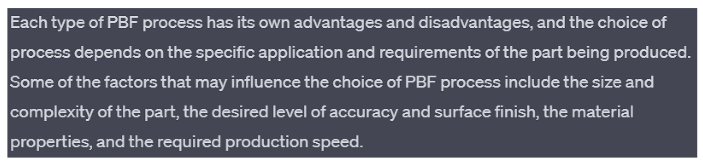
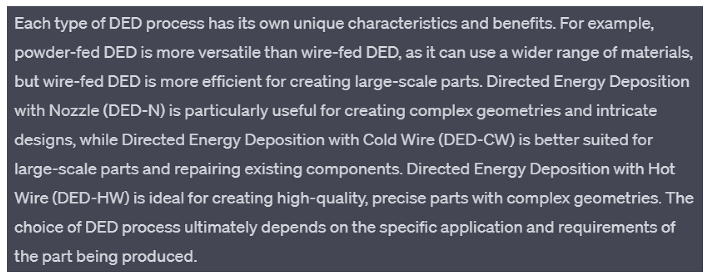
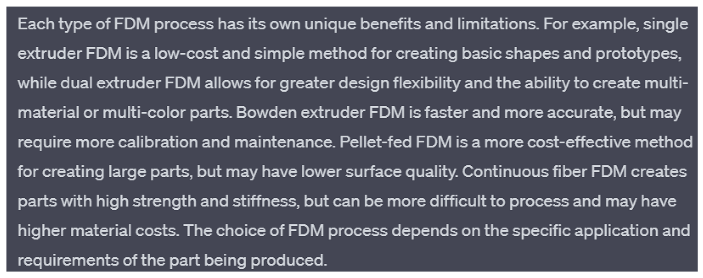
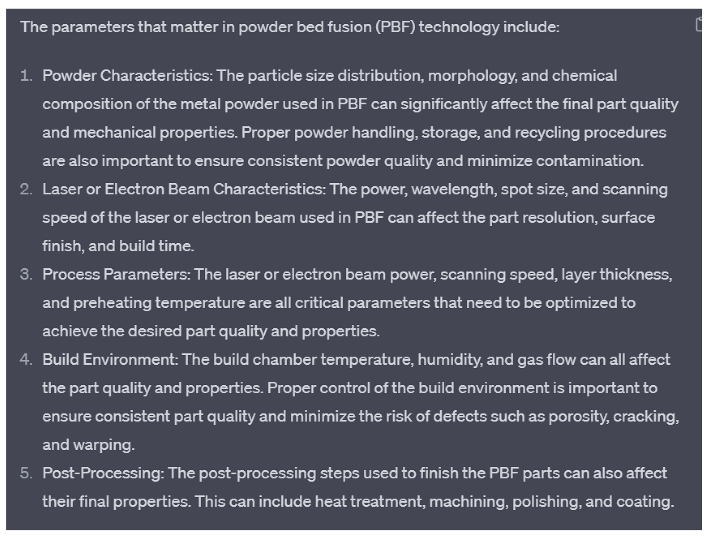
Comparing four layers knowledge graph established through literature review with the ChatGPT responses, we can see ChatGPT 4.0 is trustworthy. It not only has no limitations on domain specific knowledge like aspect of additive manufacturing but also gives very comprehensive and accurate answers. So, we can use ChatGPT for knowledge augmentation and to extend the knowledge graph. Table 2 shows how to use ChatGPT for extending the existing knowledge graph from four layers to eight layers.
Table 2.
The process of extending the knowledge graph.
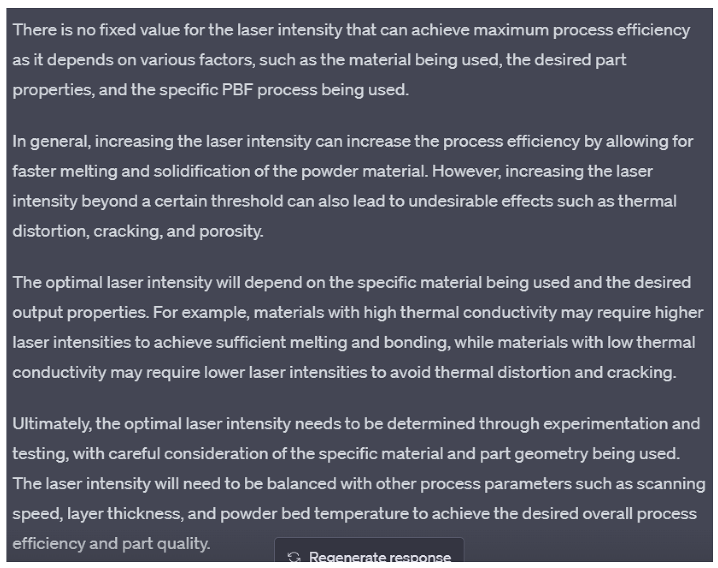
The example demonstrates the capability of ChatGPT in performing complex tasks related to AM process. It was found that ChatGPT provided remarkable accuracy, correctness, and organization in its responses and its approach to problem-solving offered valuable insights. For the specific technical issues of powder bed fusion and laser power setting, ChatGPT demonstrated its ability to provide hierarchical and logically organized responses while considering given information and constraints. Furthermore, ChatGPT can provide parameter settings (e.g., laser power, laser irradiation time) for different methods according to experimental conditions to improve process efficiency.
The final knowledge graph through ChatGPT training is shown in Figure 3.
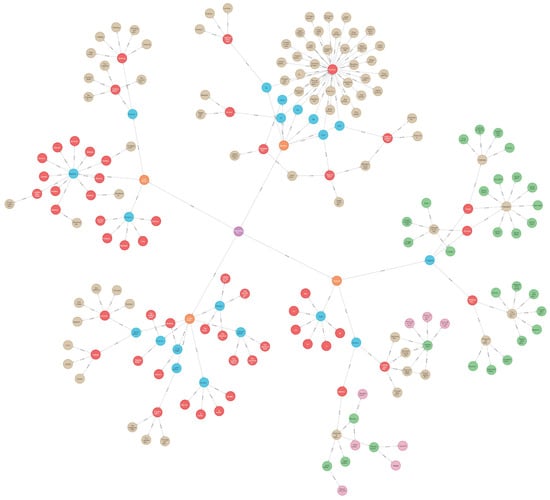
Figure 3.
Final knowledge graph through ChatGPT training (Support materi…: Support materials, Energy source pow…: Energy source power, Cutting meth…: Cutting method, Light intensi…: Light intensity, Bonding pressu…: Bonding pressure, Bonding tempe…: Bonding temperature, Sheet thickn…: Sheet thickness, Beam scanning spe…: Beam scanning spectrum).
4. BERT Training for Improving Accuracy of Knowledge Graph
4.1. A Pre-Trained Bert
The BERT model has achieved good results in the field of natural language processing, but it is mainly used to understand and represent texts. Due to the computational power, I used weights pre-trained by others.
The Test of Pre-Trained Bert
This is very limited and requires a lot of computational power and data sets to train and adjust parameters. For example, when I ask it simple questions, such as: In metal powder recycling, can you tell me ways for in situ monitoring? It would answer questions as if they were chatting.
4.2. KeyBERT
KeyBERT is a minimal and easy-to-use keyword extraction technique that leverages BERT embeddings to create keywords and keyphrases that are most like a document.
KeyBERT is a simple but powerful method for extracting keywords and keyphrases from a document. It uses BERT-embeddings and cosine similarity to find the sub-phrases in a document that are most like the document itself.
To use KeyBERT, first, BERT embeddings are extracted to get a document-level representation. Then, word embeddings are extracted for N-gram words and phrases. Finally, cosine similarity is used to find the words and phrases that are most like the document. These words and phrases can be identified as the keywords and keyphrases that best describe the entire document.
Although there are already many methods available for keyword generation, KeyBERT provides a quick and easy solution that can be used without much expertise in natural language processing. While there are more complex and sophisticated approaches that use BERT-embeddings, KeyBERT is a useful tool for those who need a basic method for extracting keywords and keyphrases from a document.
4.2.1. The Test of KeyBERT
KeyBERT is a minimal and easy-to-use keyword extraction technique that leverages BERT embeddings to create keywords and keyphrases that are most like a document, as illustrated in Figure 4.
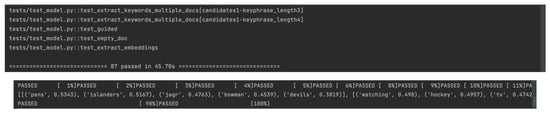
Figure 4.
The test of KeyBERT.
4.2.2. The Parameter of KeyBERT
To ensure diverse results, we selected the top 2 × n most similar words/phrases of the document. Then, we extracted all possible combinations of the top n words from these selections and selected the combination that had the least similarity to each other, based on cosine similarity.
Maximal Marginal Relevance:
To generate diverse keywords/keyphrases, we can use Maximal Marginal Relevance (MMR) based on cosine similarity. This method aims to maximize the similarity to the document while minimizing the similarity between selected keywords. This results in a list of keywords with high diversity.
4.3. BERT Text Classifier Processes Papers
Text summarization is the process of converting a long text to a summary. Let’s say we have a Wikipedia article, but we don’t want to read the full article—we just want an overview of the article. At this point, summary generation helps us get an overview of the text. Abstract tasks are classified into abstractive summarization and extractive summarization. In the abstract, the words or phrases contained in the target abstract are not in the original text, which usually need to be generated by text rewriting and other operations. Abstracted summary is formed by copying and reorganizing the most important content (usually sentences) in the document. So how to obtain and select important sentences in the document is the key to extract summary.
Traditional extraction summary methods include Lead-3 and TextRank. Traditional deep learning methods generally use LSTM or GRU model to judge and select important sentences. In this project, pre-training language model BERT is used to perform extraction summary.
4.3.1. The Test of KeyBERT
First, divide the paper into appropriate text fragments. You can divide it by paragraphs, sentences, or other appropriate units of text.
Secondly, each text fragment is classified using a trained BERT classifier.
4.3.2. The Parameter of KeyBERT
BERT continues to conduct the text summary tasks.
We know that BERT can get a per-tag representation, but here we don’t need a per-tag representation, but a per-sentence representation.
Because the abstracted summary only selects the important sentences. If we could get a representation of each sentence, we could feed the representation of the sentence into a classifier and have the classifier tell us whether the sentence is important or not.
So, the question is how do we get the representation of the sentence? Can we use the corresponding representation of the [CLS] tag as the representation of the sentence? Yes! But there’s a small problem. We only added the [CLS] tag at the beginning of the first sentence, but in the text summary task, we input multiple sentences into the BERT model, and we needed a representation of all the sentences.
Therefore, we modified the input data format and added a [CLS] tag to the beginning of each sentence so that we can get the representation of each sentence through this tag.
Suppose we have three sentences: sent one, sent two, and sent three. The first step, of course, is to divide the words and then add a [CLS] mark to the beginning of each sentence.
Sentence Coding Layer
Due to the MLM pre-training mechanism of the BERT model, its output vector is the vector of each token. Even though delimiters can distinguish between different sentences of input, having only two labels (sentence A or sentence B) is quite different from separating multiple sentences in an extract summary. Therefore, the input of the BERT model is modified as follows.
Insert the [CLS] tag before and after each sentence in the document, and the output vector after the [CLS] tag before each sentence is entered into the model, as the sentence vector representation of that sentence. For example, the document is “I love Nanjing. I like NLP. I study summaries.”, the input sequence is “[CLS] I love Nanjing. [CLS] I love NLP. [CLS] I study abstracts. (SEP)”.
We used segment embeddings to distinguish multiple sentences in the document and set the segment embeddings for odd and even sentences to and respectively.
Summary Judgment Layer
After obtaining the sentence vector of each sentence in the document from the sentence coding layer, three summary judgment layers were constructed to obtain the importance of each sentence under the document-level characteristics. For each sentence, the final predicted score was calculated, and the loss of the model was the binary cross entropy relative to the gold label.
The simple classifier only added a linear full connection layer to the BERT output and obtained the prediction score using a sigmoid function, as follows.
Add additional transformer layer after BERT output to further extract document-level features focused on summary tasks, as follows.
The sentences vector of the sentence, the PosEmb function is the function of adding position information to the sentence vector, the MHAtt function is the multi-head attention function, and is the number of layers in Transformer. Finally, there is still a full connection layer of sigmoid function, adding additional LSTM layers to BERT output to further extract document-level features focused on summary tasks.
BERTSUM with Classifier
We know that in the extract summary, we chose the important sentences. We already know how to obtain the representation of a sentence from the above. Now, we input these representations into a simple binary classifier to determine whether the input sentence could be included in the summary. This classifier layer is often referred to as the digest layer.
The classifier returns the probability that each sentence will be added to the summary.
For each sentence in the document, we received the sentence representation, and then enter it into the summary layer to get the probability that it can be added to the summary.
Obviously, only a Sigmoid classifier is needed to calculate this probability. By minimizing the binary loss between true probability and predicted probability, we can fine-tune both the pre-trained BERT model and the summary layer.
5. Effect Detection of Metal Powder Process
5.1. Object Detection Algorithm-yolov5
yolov5 (You Only Look Once version 5) is an object detection algorithm and an iteration of the original YOLO architecture [29]. It is a real-time object detection system designed for fast and accurate detection of multiple objects in images and videos. The yolo series has a very big advantage of small computation, and its original purpose of yolov5 network design was to build a small network with low requirements on the server, so that training and conclusions can be easily drawn. Although yolov5 is weak in accuracy, it is stronger than yolov4 in volume and processing speed. Based on the above considerations, the yolov5 framework is chosen.
5.2. Detection
5.2.1. Preparation for Detection
Dataset
The dataset is obtained through an experiment of recycled 316 L metal powder process including SEM photos of recycled 316 L steel powders and processed powders.
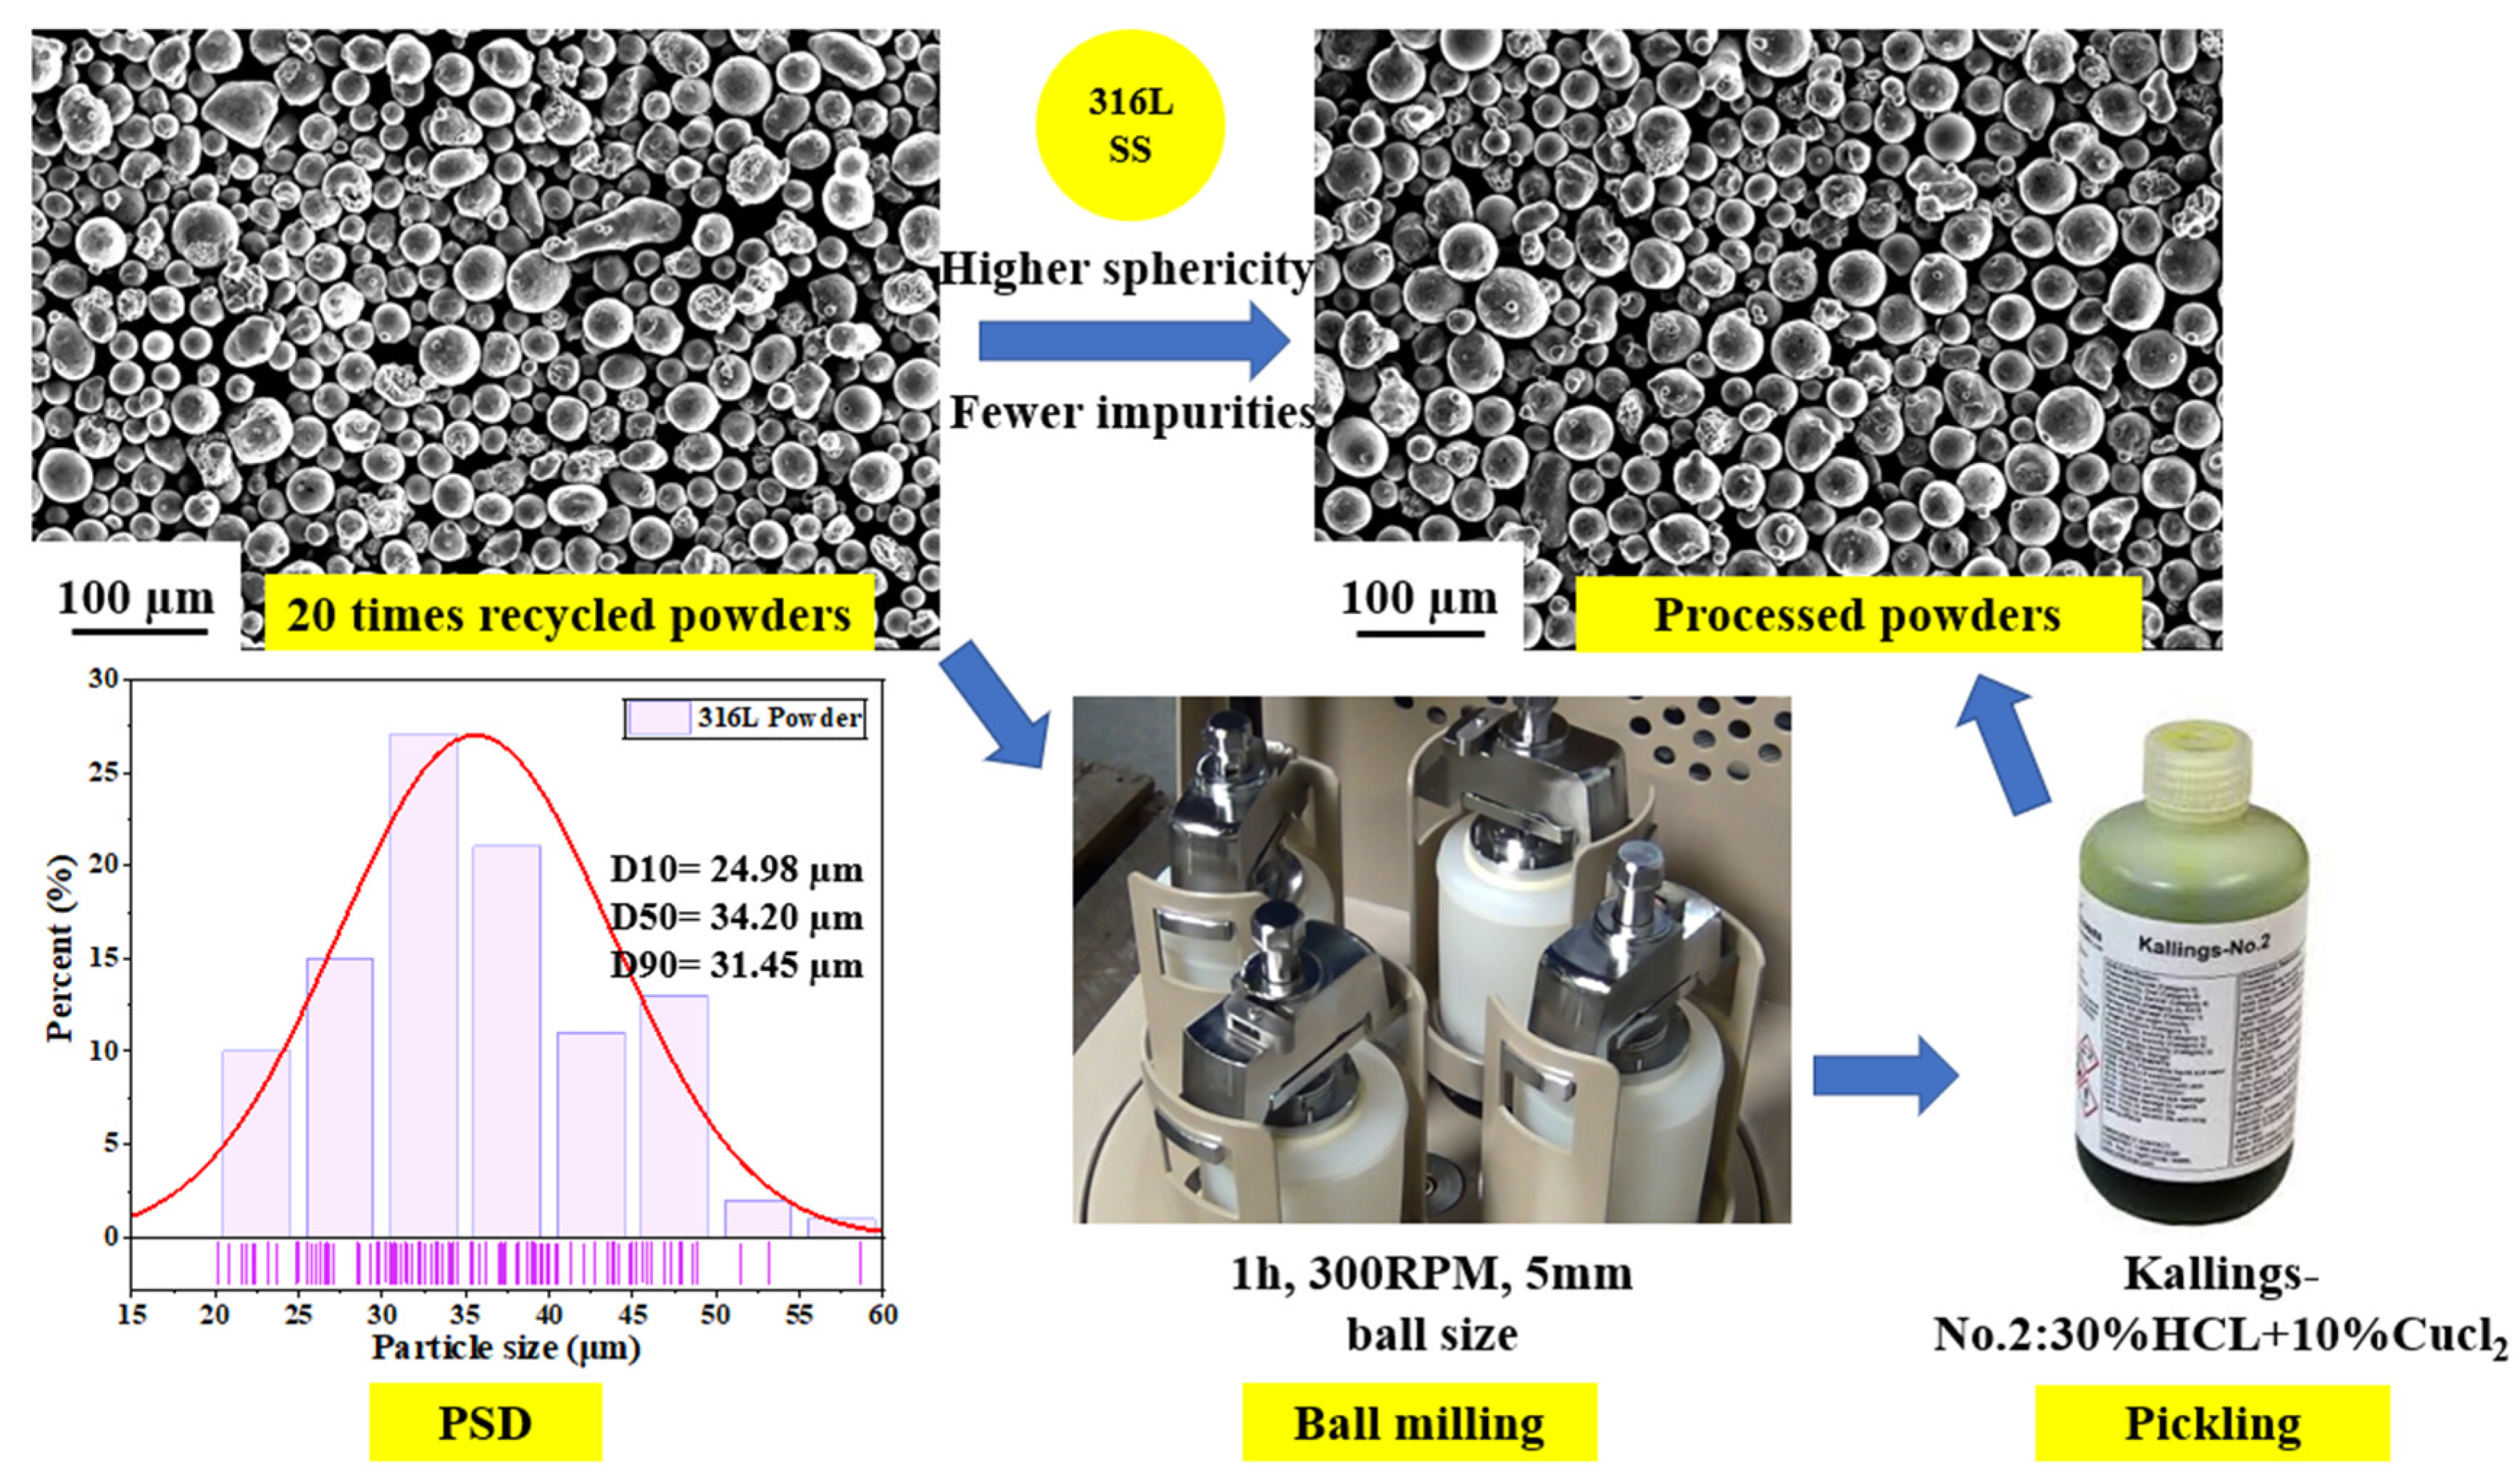
We conducted two step processes 20 times with recycled 316 L stainless steel powders, as shown in Figure 5. The first step was ball milling. Milling time was 1 h, rotation speed was 300 RPM, and the ball size was 5 mm. The second step process was pickling, and Kallings-No. 2 solution (30%HCL + 10%Cucl2) was selected. After the ball milling and pickling processes, the 316 L powders exhibited improved sphericity and reduced impurities.
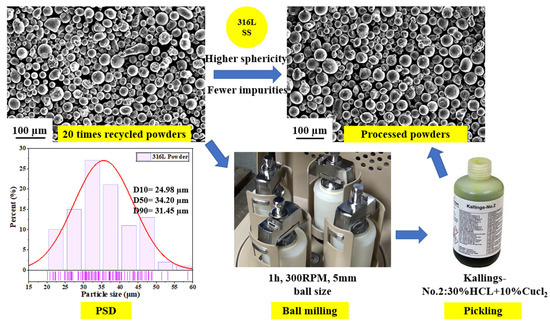
Figure 5.
Processes of 20 times recycled 316 L stainless steel powders.
Detection Environment
The hardware device used in the detection is a laptop with an NVIDIA GeForce RTX 3060 Laptop GPU. It uses an Nvidia 3060 graphics card with 16 gigabytes of total memory. I used a graphics card for network training and testing, and a CPU. The CPU is 12th Gen Intel(R) Core (TM) i7-12700H.
It has 14 cores and 20 threads, 2.30 GHz CPU frequency, 16gb memory, and 500 GB disk storage space. The system of the computer is Windows 11.
5.2.2. Data Processing
Characteristics of the Data Set
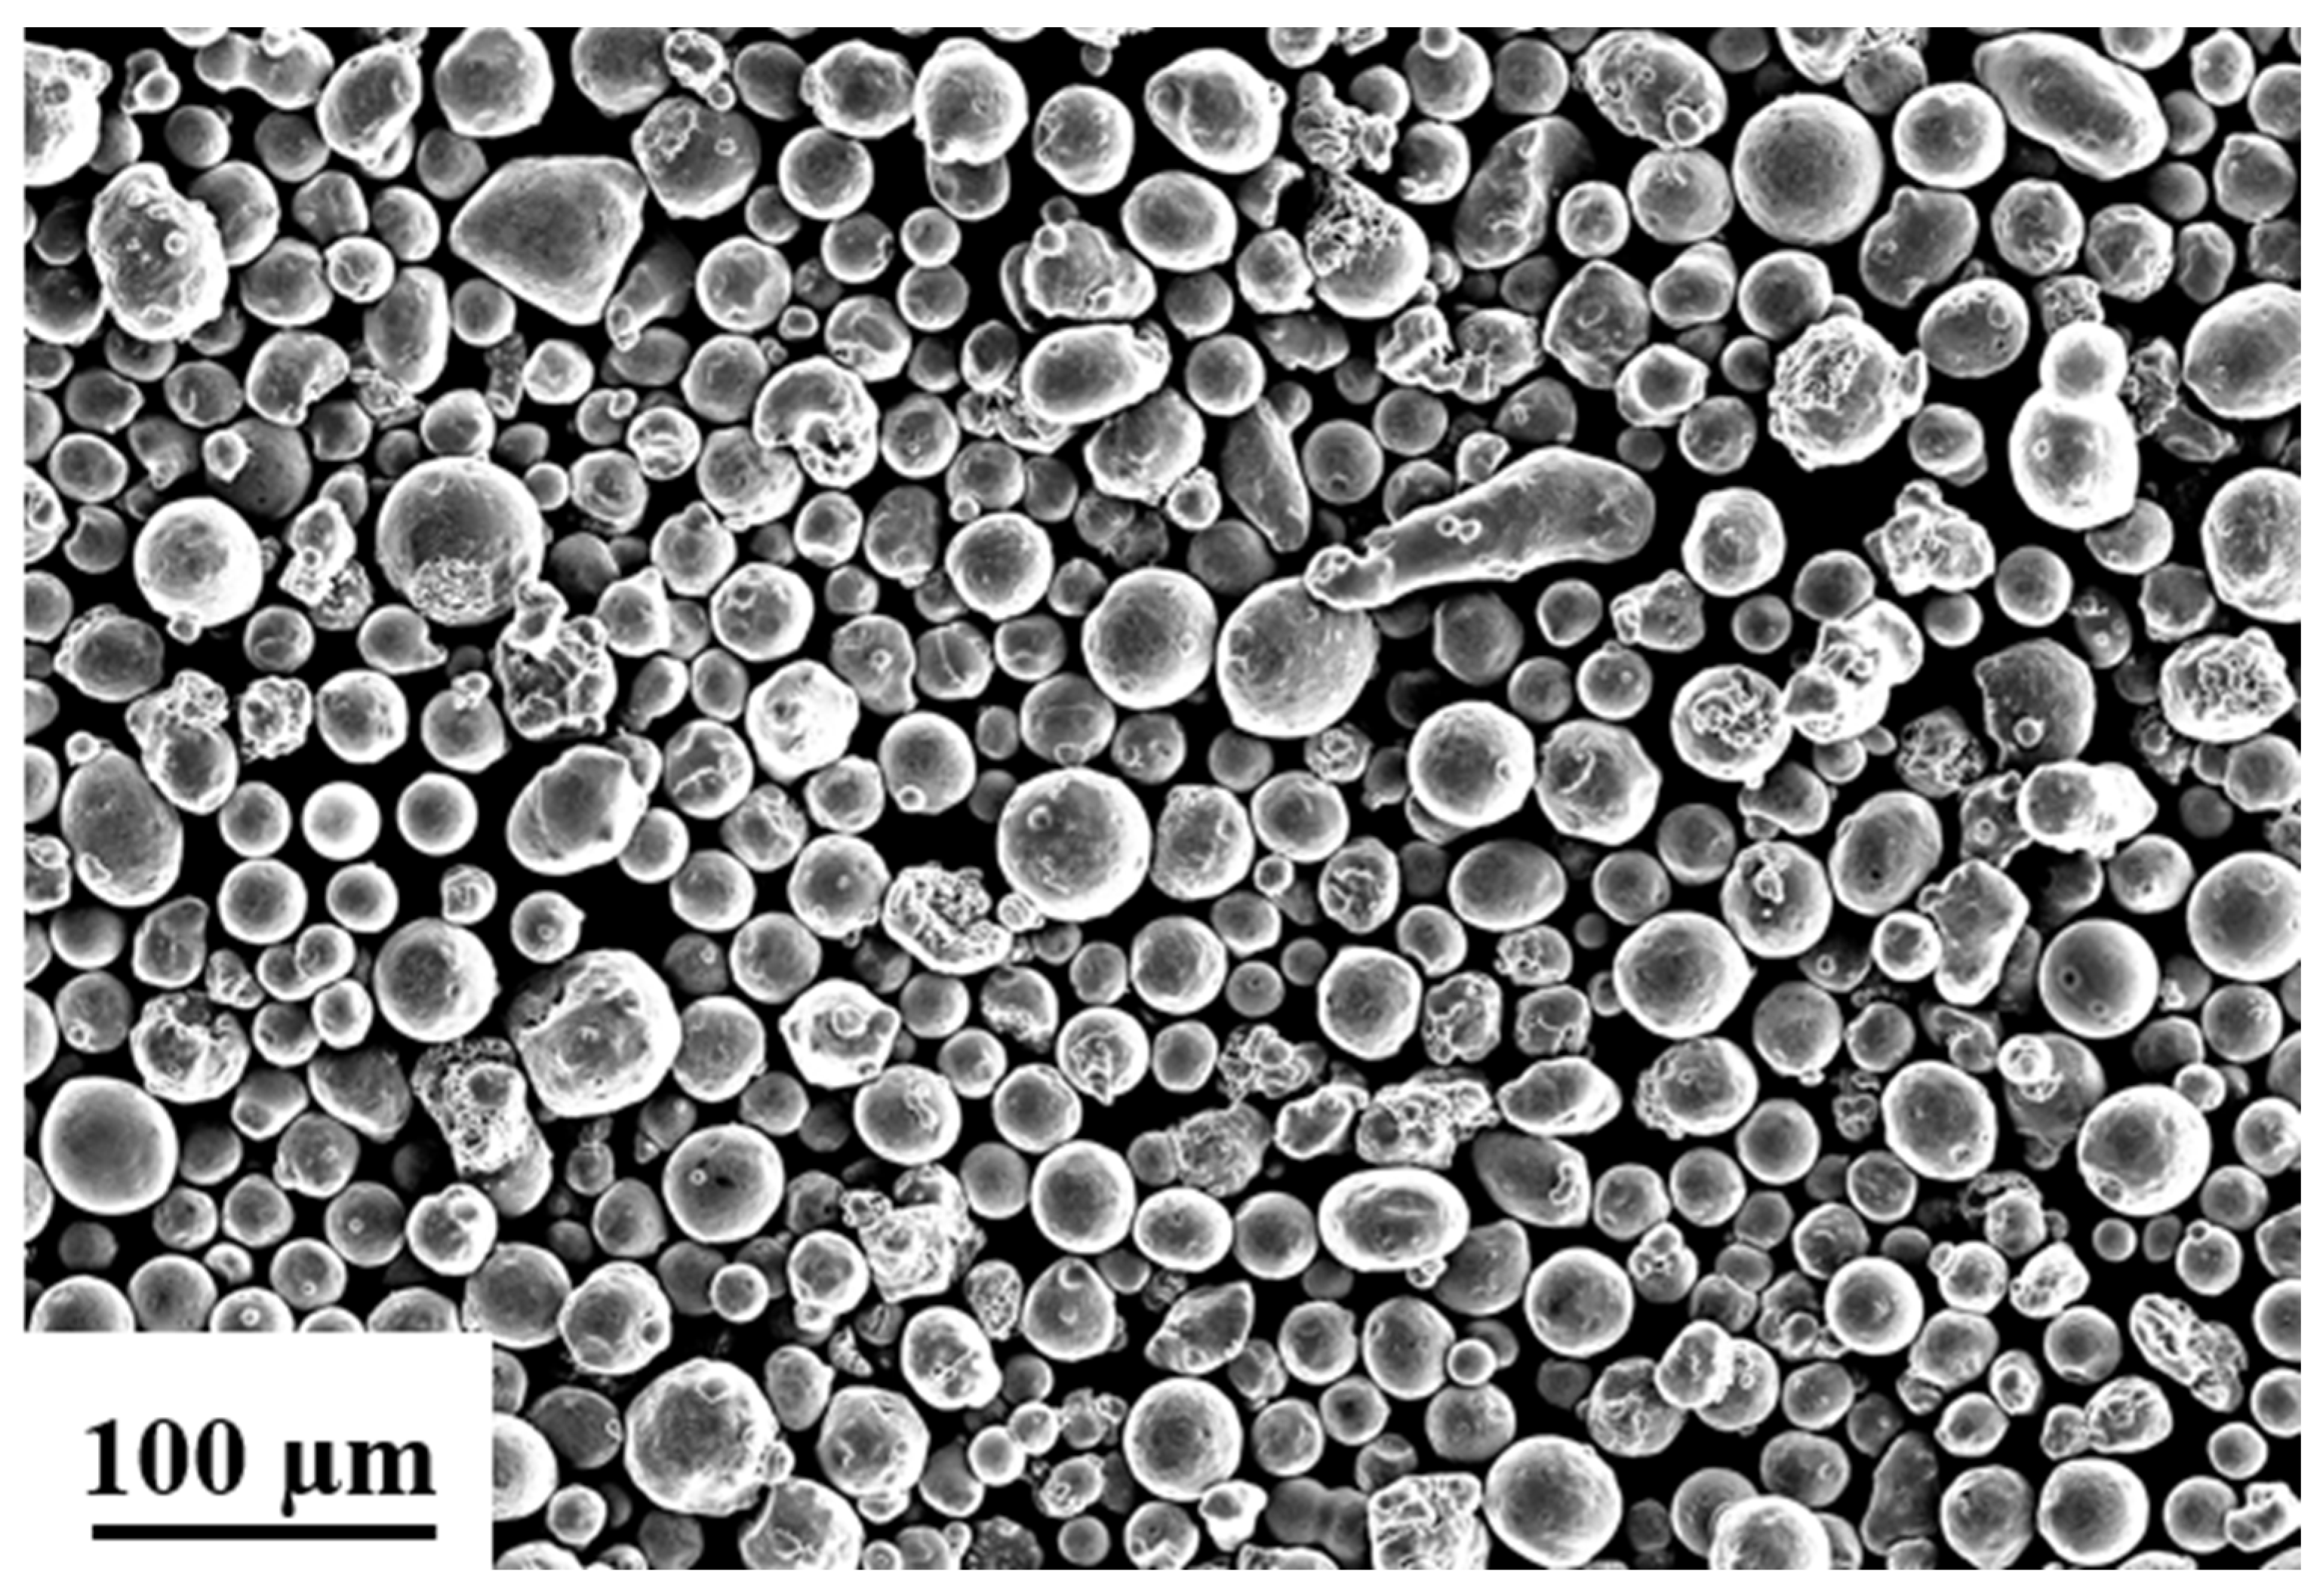
As we can see from Figure 6, the powder in SEM is very jumbled and overlapping. Some powders are very large, and some powders are very small and irregular. Not easy to detect.
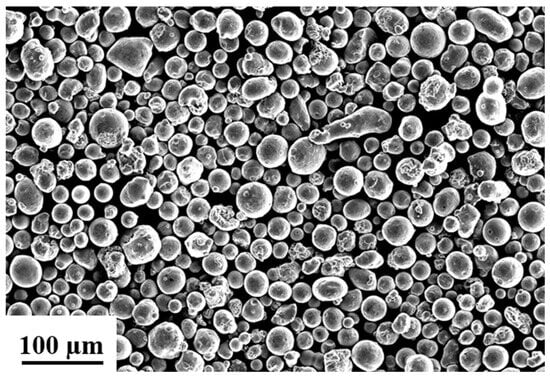
Figure 6.
Metal powder.
On the other hand, the data set is not enough because there are only a few pictures, which is not enough for deep learning training.
Extend Dataset
To address the issue of limited data sets, one can begin by capturing SEM images of individual metal powders, focusing on those with consistent sphericity to enhance the model’s ability to recognize this attribute. Gradually, the data set can be expanded by including images featuring two, three, and four spheres, allowing the model to identify multiple powders. Incorporating oval and irregular shapes for more comprehensive training results in a dataset comprising three categories: spherical, oval, and irregular. By collecting over a hundred samples for each shape, a total of approximately 500 images can be amassed.
It is important to avoid capturing images of numerous powders simultaneously to prevent potential overlapping or complexity, which could increase the model’s detection error rate. Instead, limiting the number of powder images in each sample helps to maintain accuracy and simplicity.
Transformation and Annotation of Dataset
Because the training of yolo series must use a specific txt format, the next step is to annotate the data set. Here I use labelimg, a software that labels the images one by one, and then converts the images into xml format, and then converts the code.
It was converted into the yolo series special txt format file here to complete the production and annotation of all data sets, so it can later be trained.
5.2.3. Detection Result and Discussion
Several different models are for training: yolov5n, yolov5n6, yolov5m, yolov5m6, yolov5l, yolov5l6, yolov5s, yolov5s6, yolov5x, yolov5x6. Here are their results.
Results of yolov5n and yolov5n6
100epoches were trained separately, and the results are shown in Table 3.
Table 3.
Training results.
yolov5n6’s improvement is quite large, almost ten percent, and relatively good.
Results of yolov5m and yolov5m6
100epoches were trained separately, and the results are shown in Table 4.
Table 4.
Second training results.
The improvement of yolov5m6 is not bad, reaching 96.9%, an increase of 6 percentage points.
Results of yolov5l and yolov5l6
100epoches were trained separately, and the results are shown in Table 5.
Table 5.
Third training results.
The accuracy of yolov5l6 is 96.2%, an improvement of 4 percentage points.
Results of yolov5s and yolov5s6
100epoches were trained separately, and the results are shown in Table 6.
Table 6.
Fourth training results.
The accuracy rate of yolov5s6 reached 94.4%, an increase of 2 percentage points. oval has the greatest improvement and the highest accuracy (97.1%)
Results of yolov5x and yolov5x6
100epoches were trained separately, and the results are shown in Table 7.
Table 7.
Fifth training results.
yolov5x6 achieved 97.8% accuracy, an improvement of 5 percentage points. oval has the greatest improvement and the highest accuracy, with 98.6%
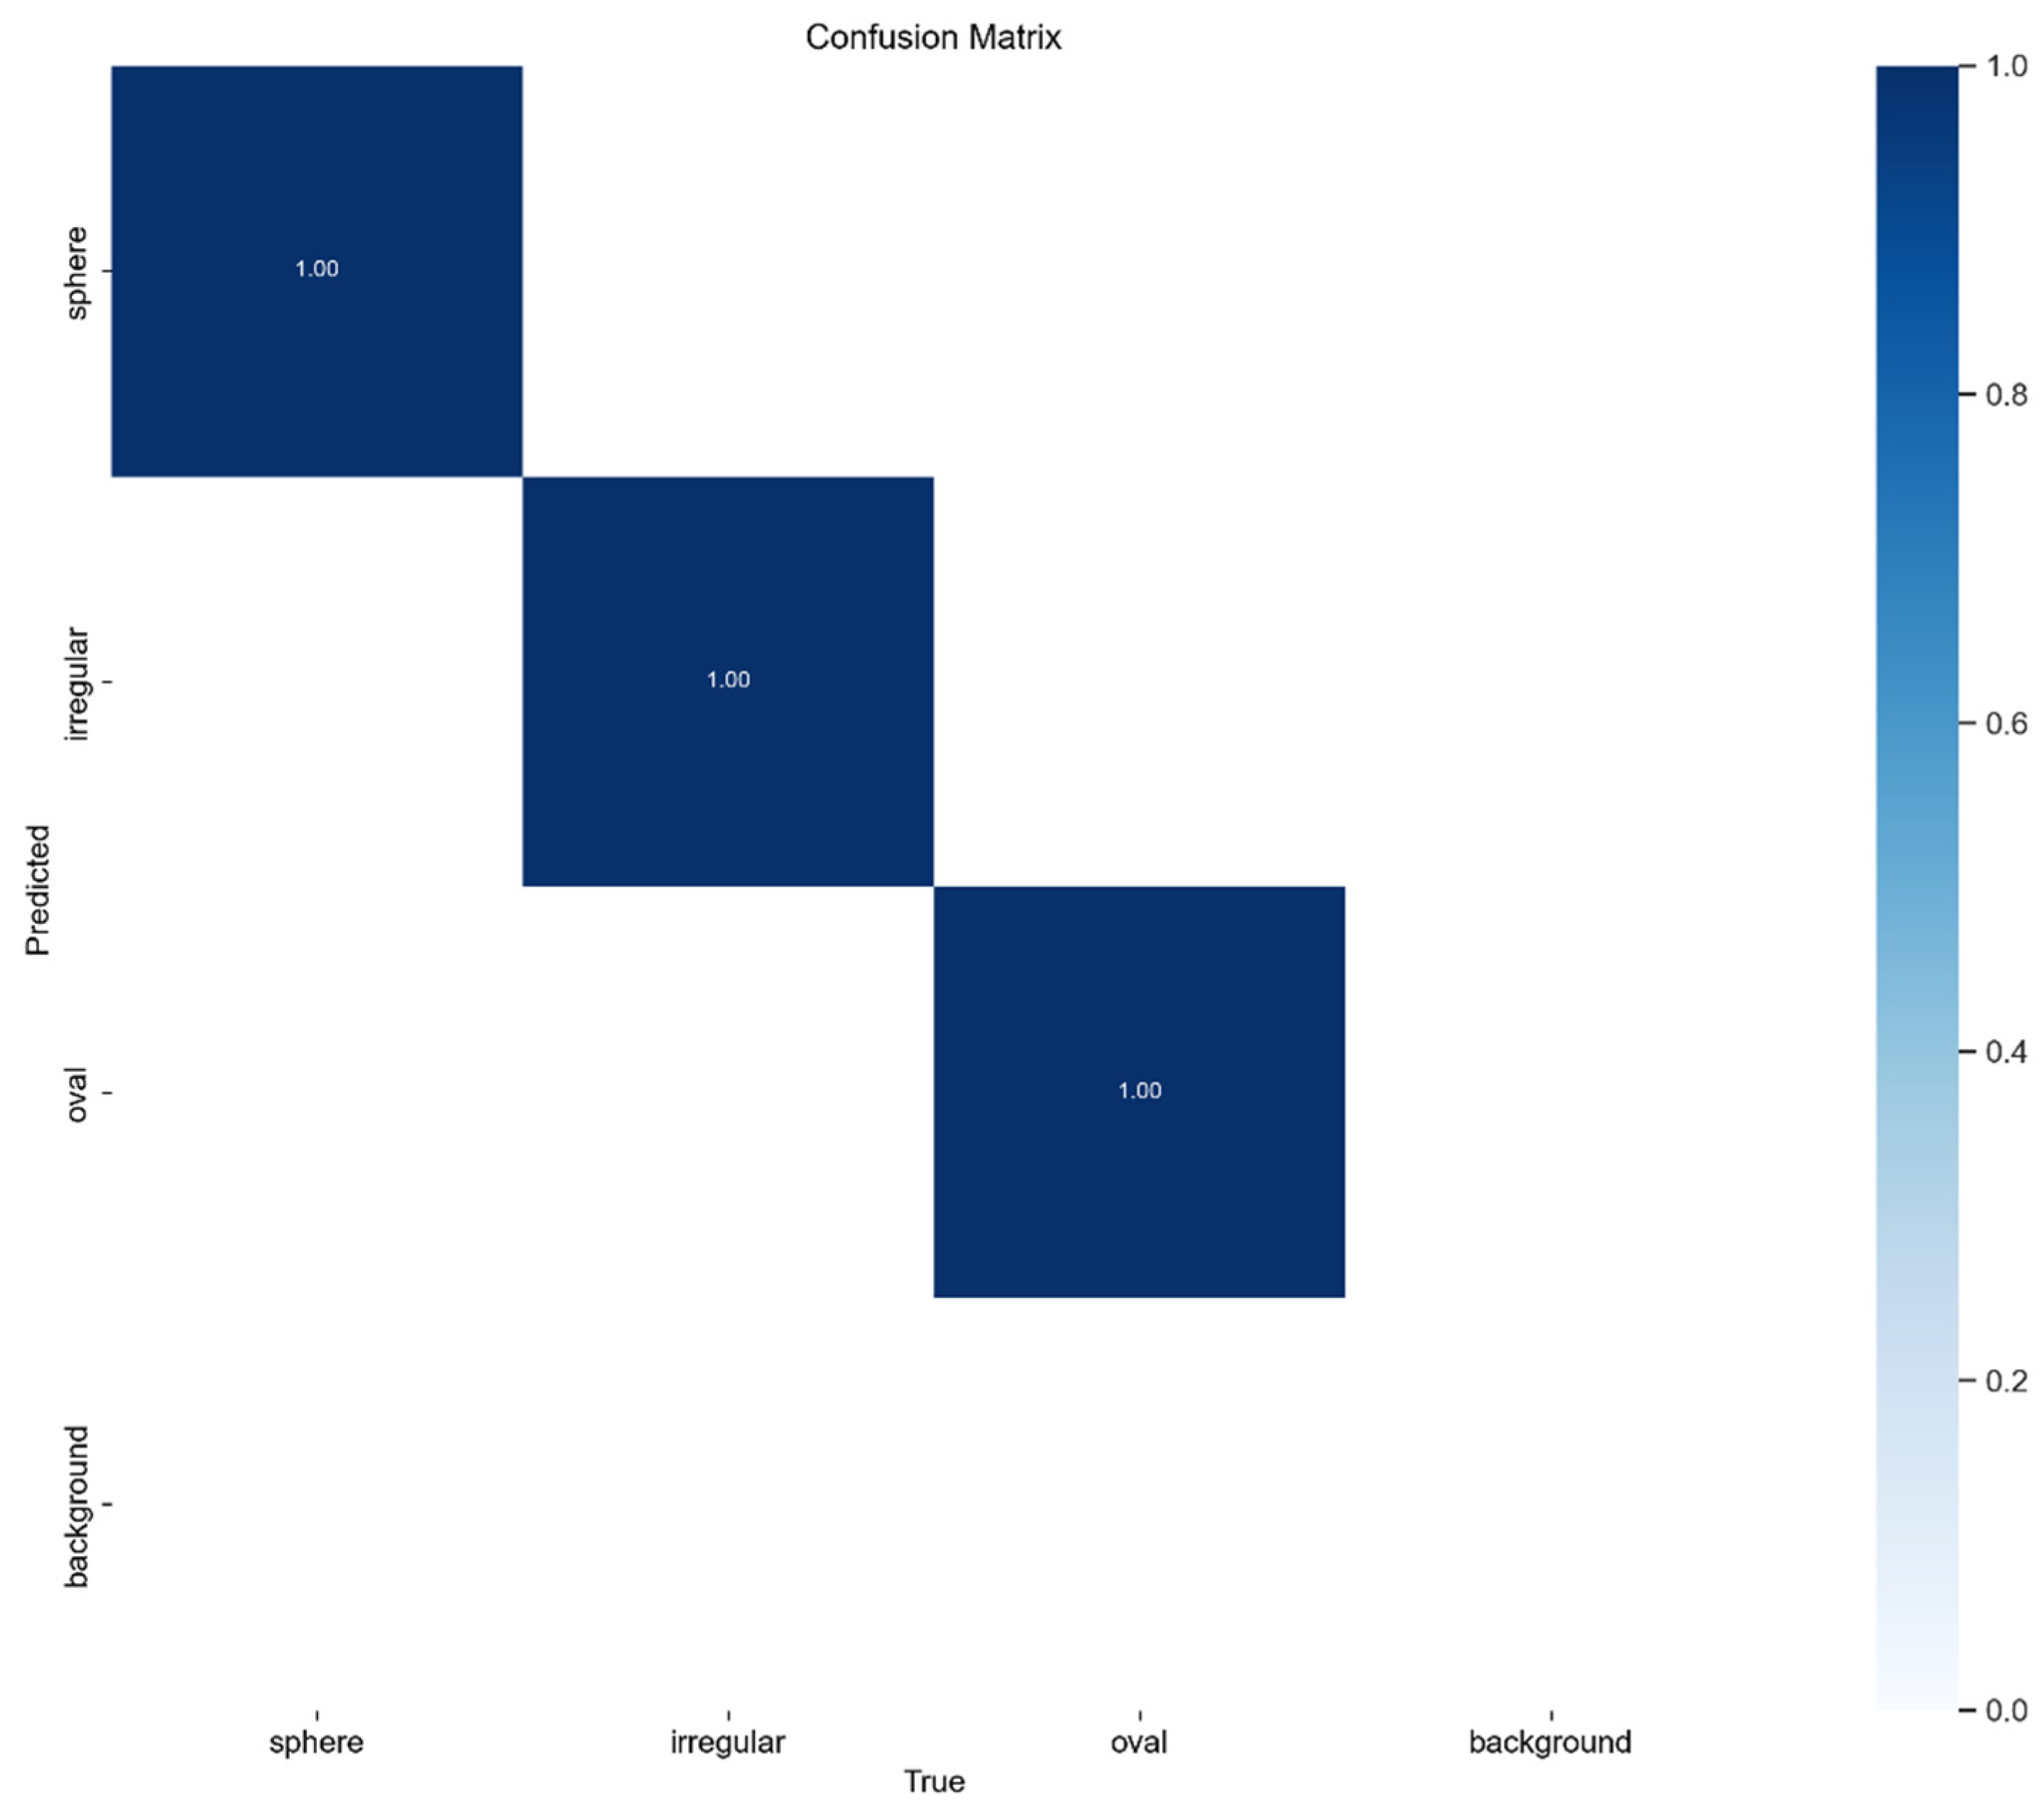
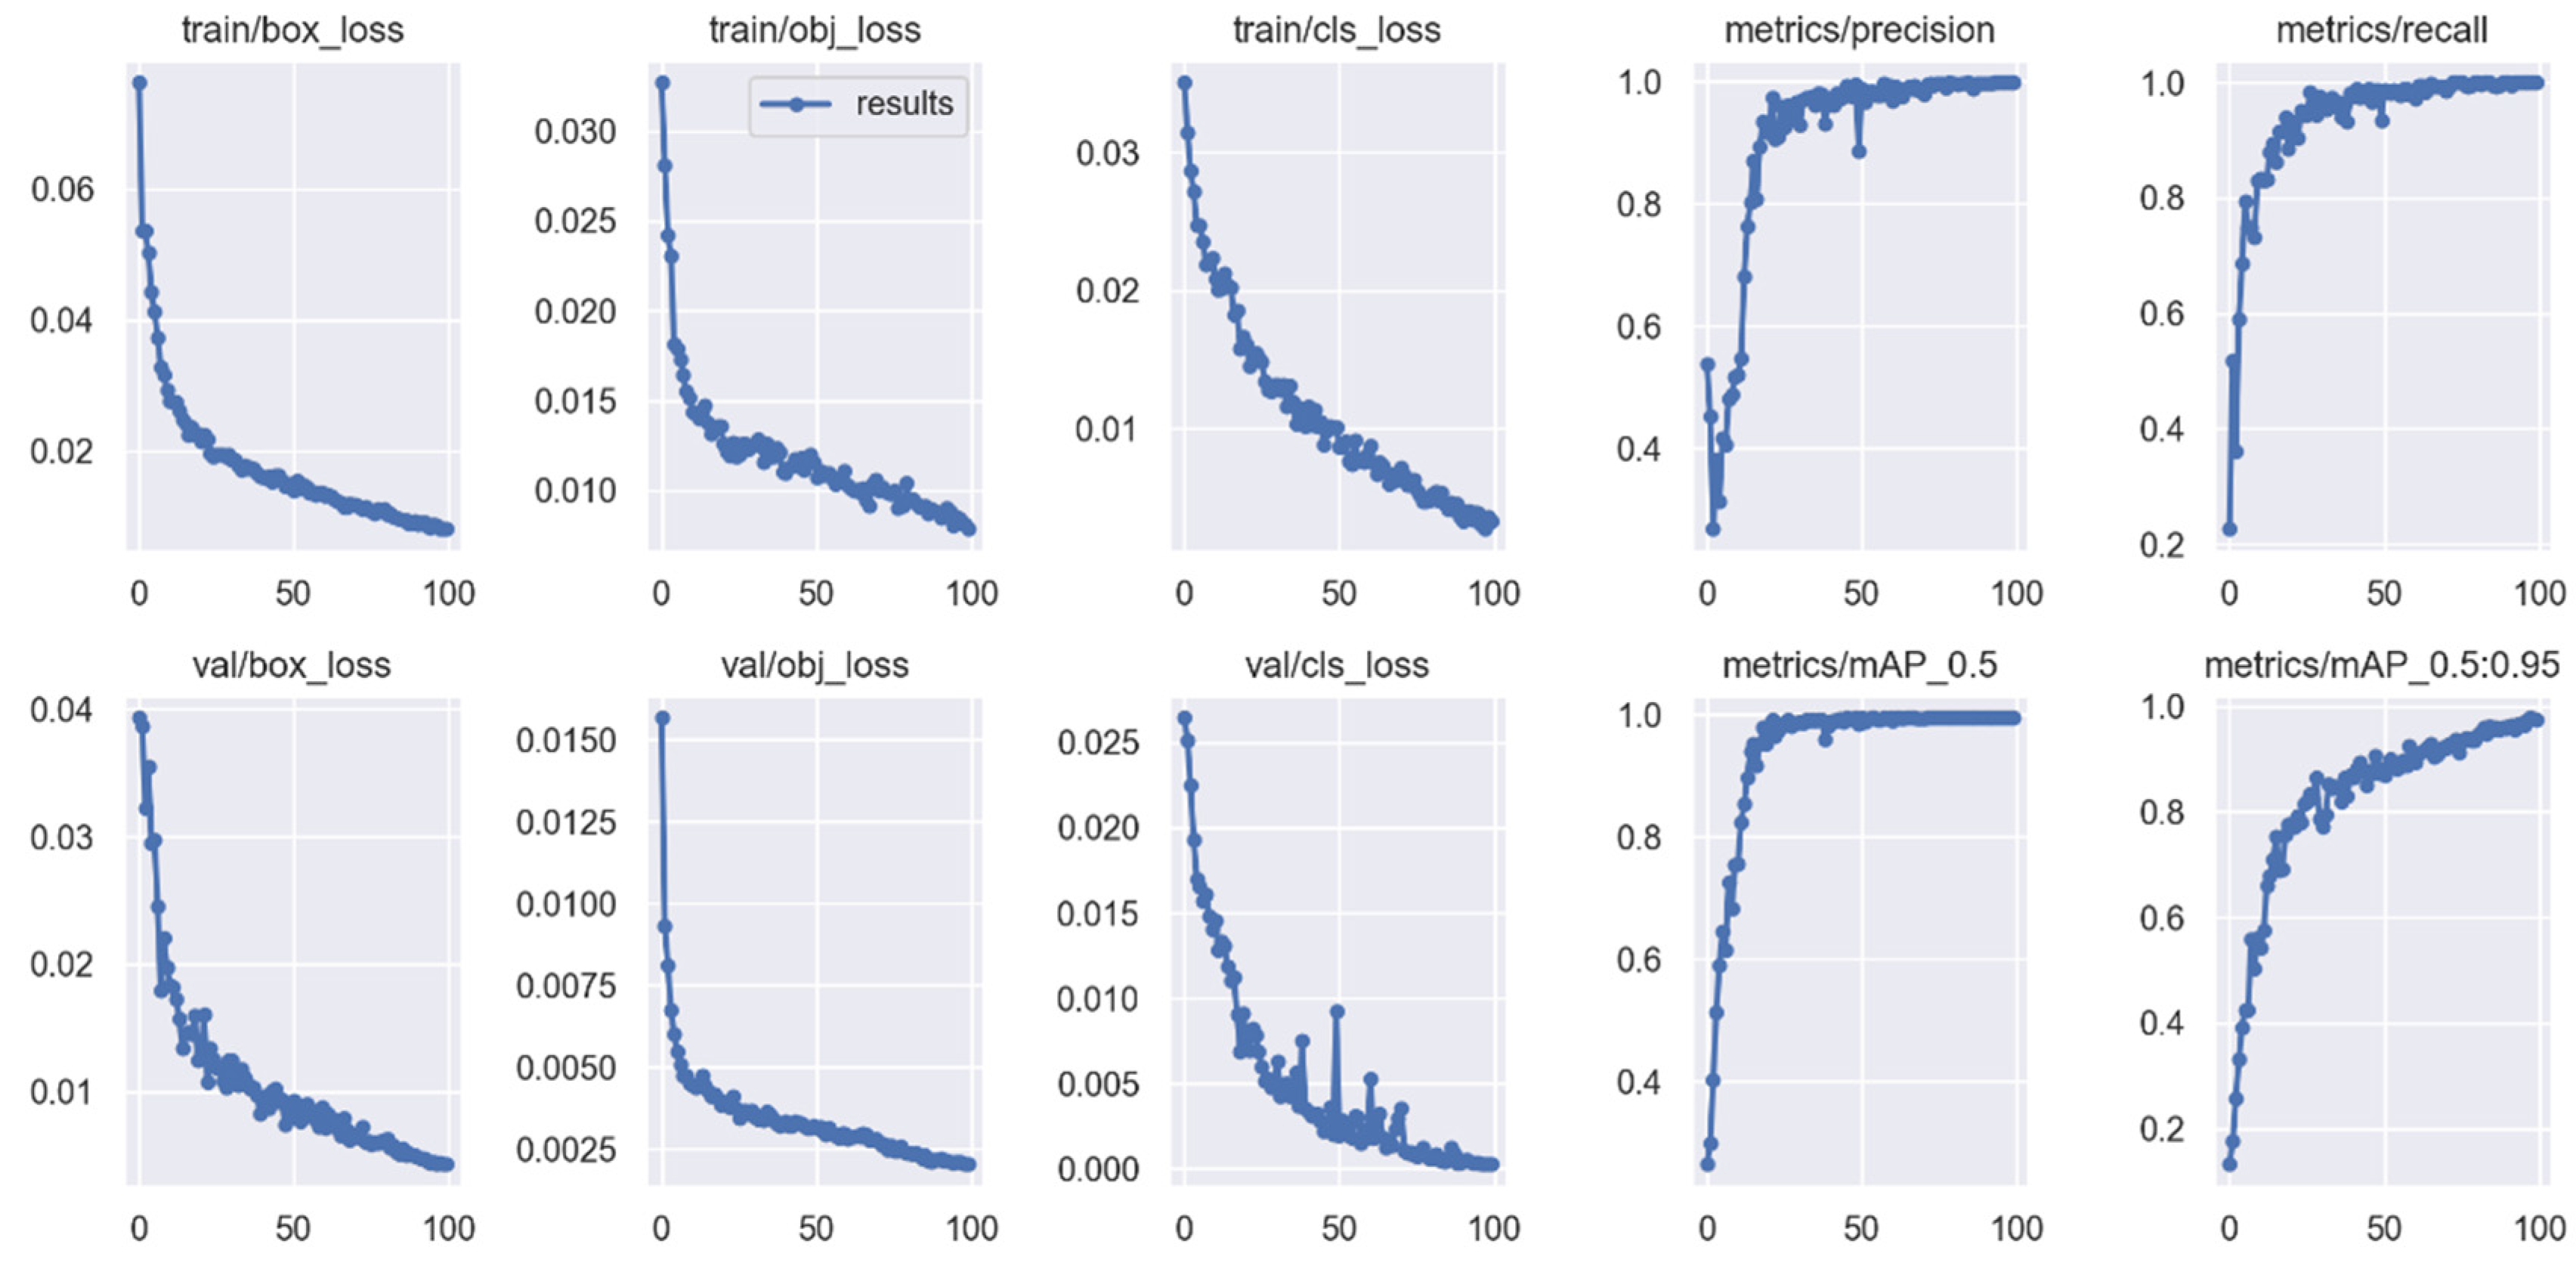
Figure 7 and Figure 8 are a graph of the confusion matrix and the training accuracy loss function. It can be seen in Figure 8 that the losses for train/box, train/obj, train/cls, val/box, val/obj, and val/cls show a significant initial decrease with increasing training iterations, eventually stabilizing. Remarkably, these losses approach 0 after 100 training sessions. Additionally, metrics such as precision, recall, and mAP progressively improve with the number of sessions, converging towards 1 at 100 sessions. These outcomes validate our choice of 100 training sessions as it led to high-accuracy training results.

Figure 7.
Confusion matrix.
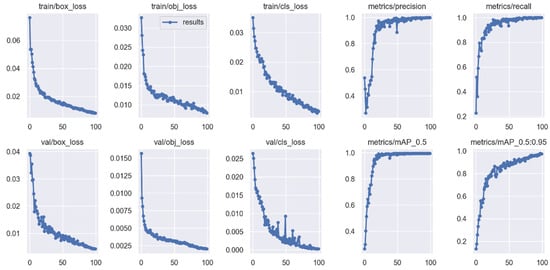
Figure 8.
Training accuracy and loss function.
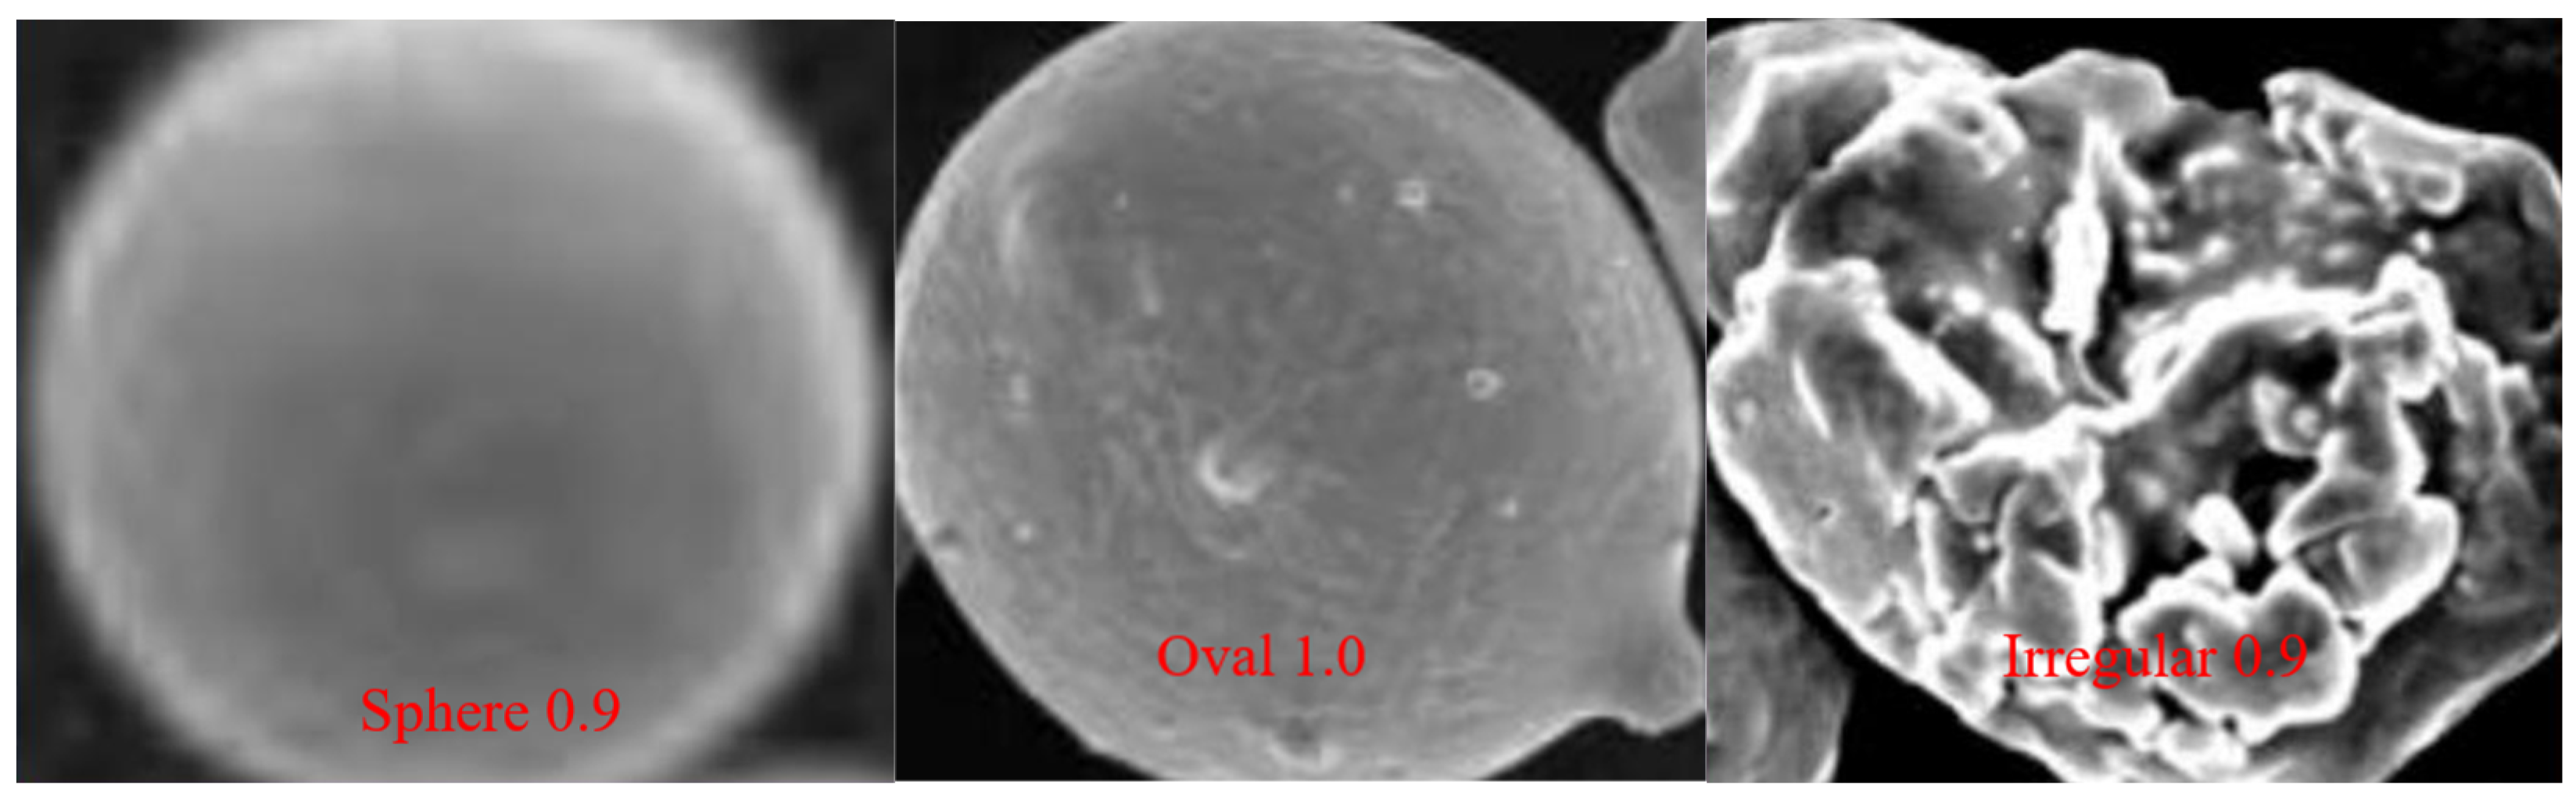
Figure 9 is the screenshot of the training results. Figure 9 demonstrates the favorable accuracy of the training results, enabling precise identification of sphere, oval, and irregular powders. This capability is valuable in evaluating the quality of the processed powder.
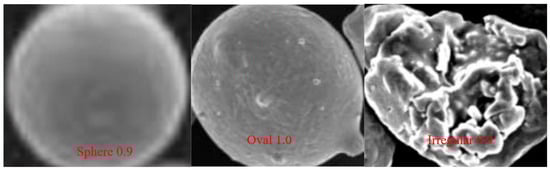
Figure 9.
training results.
Overall, the training got better with each layer of the network, and the sixth generation was generally 3 to 5 percent better than the first.
5.2.4. Detection of Model
yolov5x and yolov5x6 models with the highest accuracy for detection were selected, and the effect was very good, as shown in Figure 10.
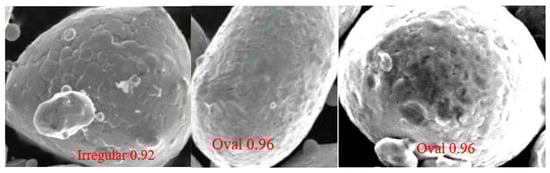
Figure 10.
Detection results.
5.3. Analysis of Detection Results
The yolov5 series models test the sphericity in SEM images of metal powder. Three distinct shapes, sphere, oval, and irregular have been examined, and impressive results have been obtained.
In the detection using the sixth-generation model of yolov5, the accuracy rate typically hovers around 93 or 94 percent, with 97 or 98 percent for some types exhibiting high accuracy, yielding exceptional results. Spherical and oval shapes, which have the highest number of samples and the best detection effect, generally achieve more than 93 percent accuracy. Irregular shapes are less accurate but still reach 90 percent accuracy.
When it comes to individual powder, the accuracy is remarkably high, attaining 98 percent. However, in the case of multiple powders, the accuracy is not as impressive, possibly due to insufficient training of the multiple powder datasets.
The sphericity detection effect is outstanding, as the three types of sphericities are well-distinguished, resulting in excellent outcomes.
After the sphericity detection effect was verified well, the detection method was carried out on pictures of recycled powders and processed powders, and the sphericity of the processed powders is better and looks well.
In Figure 11, some researchers utilized unprocessed, poor quality 316 L powders for manufacturing [30]. These powders exhibit surface impurities, low sphericity, and potential internal defects, leading to manufactured parts with compromised mechanical properties, increased cracking, and reduced service life and performance. In contrast, our processed powders result in products that meet industry standards.
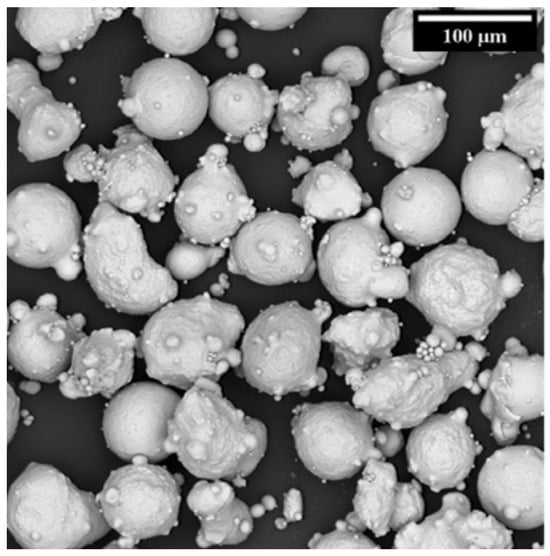
Figure 11.
Poor-quality 316 L powders without processing.
Directly discarding the powder can lead to environmental pollution, while producing new powder can be detrimental to the environment and increase costs. Our system, however, offers a satisfactory solution by enabling circular manufacturing. This approach not only safeguards the environment but also reduces overall costs, making it an effective and environmentally responsible solution.
6. Conclusions
In this study, we developed a vehicle additive manufacturing system utilizing recycled metal powders and constructed a related knowledge graph to promote sustainable manufacturing through recycling, processing, and reusing metal powders. This work holds significant value for future researchers aiming to understand the entire process, from metal powder recovery to its manufacturing and application. Additionally, we employed ChatGPT and BERT training to enhance the accuracy of the knowledge graph. To demonstrate the knowledge graph’s practicality, we applied its methods to the recycling process of 316 L stainless steel. Subsequent image processing revealed that the powders were effectively processed. This research significantly contributes to the achievement of sustainable manufacturing for electric vehicles, yielding cost reduction and promoting environmental friendliness. However, this study has certain limitations. While it includes commonly used recycled metal powders, it does not encompass newer, popular metals like high entropy alloys, shape memory alloys, and others. Additionally, the metal recovery and treatment methods employed in this study represent only commonly used approaches, potentially yielding less satisfactory results. To address these limitations, our future research endeavors will focus on two key aspects. Firstly, we aim to expand the scope of our study by incorporating relevant content related to the more popular metals used in recent years. This expansion will enhance the system’s applicability and relevance. Secondly, we will continue to explore and develop advanced metal recovery and treatment methods to significantly improve the quality of treated powders. By doing so, we can further optimize the established system, ensuring better performance and more robust outcomes for the additive manufacturing industry.
Author Contributions
Y.F.: investigation, methodology, writing—original draft preparation. M.C.: supervision, writing—review and editing. W.L.: methodology, validation. Z.Z.: data curation, investigation. X.L.: data curation, investigation. All authors have read and agreed to the published version of the manuscript.
Funding
This research was supported by the National Natural Science Foundation of China (No. 51575416), China Postdoctoral Science Foundation (2020M672429) and the Fundamental Research Funds for the Central Universities (WUT: 2021IVB009) for the support given to this research.
Institutional Review Board Statement
Not applicable.
Informed Consent Statement
Not applicable.
Data Availability Statement
The data that support the findings of this study are available on request from the corresponding author.
Conflicts of Interest
The authors declare no conflict of interest.
References
- Graedel, T.E.; Allwood, J.; Birat, J.P.; Buchert, M.; Hagelüken, C.; Reck, B.K.; Sibley, S.F.; Sonnemann, G. Recycling Rates of Metals: A Status Report; United Nations Environment Programme: Nairobi, Kenya, 2011. [Google Scholar]
- Rhamdhani, M.A.; Brooks, G.; Masood, S.; Corder, G.D. Metal recycling: Opportunities, limitations, infrastructure. Procedia CIRP 2015. [Google Scholar]
- Arrizubieta, J.I.; Ukar, O.; Ostolaza, M.; Mugica, A. Study of the environmental implications of using metal powder in additive manufacturing and its handling. Metals 2020, 10, 261. [Google Scholar] [CrossRef]
- Hossain, M.U.; Ng, S.T.; Antwi-Afari, P.; Amor, B. Circular economy and the construction industry: Existing trends, challenges and prospective framework for sustainable construction. Renew. Sustain. Energy Rev. 2020, 130, 109948. [Google Scholar] [CrossRef]
- Tiddi, I.; Schlobach, S. Knowledge graphs as tools for explainable machine learning: A survey. Artif. Intell. 2022, 302, 103627. [Google Scholar] [CrossRef]
- Hill-Yardin, E.L.; Hutchinson, M.R.; Laycock, R.; Spencer, S.J. A Chat (GPT) about the future of scientific publishing. Brain Behav. Immun. 2023, 110, 152–154. [Google Scholar] [CrossRef] [PubMed]
- Crivellari, A.; Resch, B.; Shi, Y. TraceBERT—A Feasibility Study on Reconstructing Spatial–Temporal Gaps from Incomplete Motion Trajectories via BERT Training Process on Discrete Location Sequences. Sensors 2022, 22, 1682. [Google Scholar] [CrossRef] [PubMed]
- Ding, J.; Ma, S.; Shen, S.; Xie, Z.; Zheng, S.; Zhang, Y. Research and industrialization progress of recovering alumina from fly ash: A concise review. Waste Manag. 2017, 60, 375–387. [Google Scholar] [CrossRef] [PubMed]
- Wei, M.S.; Huang, K.H. Recycling and reuse of industrial wastes in Taiwan. WasteManag. 2001, 21, 93–97. [Google Scholar] [CrossRef]
- Yagi, R.; Okabe, T.H. Recovery of nickel from nickel-based superalloy scraps by utilizing molten zinc. Metall. Mater. Trans. B 2017, 48, 335–345. [Google Scholar] [CrossRef]
- Grasso, M.; Colosimo, B.M. Process defects and in situ monitoring methods in metal powder bed fusion: A review. Meas. Sci. Technol. 2017, 28, 044005. [Google Scholar] [CrossRef]
- Sehhat, M.H.; Perez-Palomino, D.; Wiedemeier, C.; Cullom, T.; Newkirk, J.W. Characterization of Virgin, Re-used, and Oxygen-reduced Copper Powders processed by the Plasma Spheroidization Process. Adv. Powder Technol. 2023, 34, 103885. [Google Scholar] [CrossRef]
- Atwater, M.A.; Luckenbaugh, T.L.; Hornbuckle, B.C.; Darling, K.A. Advancing commercial feasibility of intraparticle expansion for solid state metal foams by the surface oxidation and room temperature ball milling of copper. J. Alloys Compd. 2017, 724, 258–266. [Google Scholar] [CrossRef]
- Collet, R.; Le Gallet, S.; Charlot, F.; Lay, S.; Chaix, J.; Bernard, F. Oxide reduction effects in SPS processing of Cu atomized powder containing oxide inclusions. Mater. Chem. Phys. 2016, 173, 498–507. [Google Scholar] [CrossRef]
- Speidel, A.; Gargalis, L.; Ye, J.; Matthews, M.J.; Spierings, A.; Hague, R.; Clare, A.T.; Murray, J.W. Chemical recovery of spent copper powder in laser powder bed fusion. Addit. Manuf. 2022, 52, 102711. [Google Scholar] [CrossRef]
- Wang, M.-Y.; Zhi, W.; Guo, Z.-C. Preparation of electrolytic copper powders with high current efficiency enhanced by super gravity field and its mechanism. Trans. Nonferrous Met. Soc. China 2010, 20, 1154–1160. [Google Scholar] [CrossRef]
- Zhou, X.; Wang, R.; Li, C.; Wang, X.; Wang, K.; Wang, Q. Effect of high-energy ball milling on the microstructure and properties of ultrafine gradient cemented carbides. Int. J. Appl. Ceram. Technol. 2020, 17, 2298–2306. [Google Scholar] [CrossRef]
- Nechaev, N.; Polezhaev, E. Effect of physicochemical treatment on titanium porous powder quality. Metallurgist 2016, 60, 339–341. [Google Scholar] [CrossRef]
- Chen, G.Z.; Fray, D.J.; Farthing, T.W. Direct electrochemical reduction of titanium dioxide to titanium in molten calcium chloride. Nature 2000, 407, 361–364. [Google Scholar] [CrossRef]
- Guo, Y. Recovery of high-purity magnesium powder from Mg-Zn-Mn alloy scrap by thermal treatment. J. Alloys Compd. 2020, 834, 155059. [Google Scholar]
- Pan, T.; Li, L.; Zhang, X.; Flood, A.; Karnati, S.; Cui, W.; Zhang, Y.; Li, W.; Liou, F. Investigation of significant factors on deformation with powder bed fusion system. Proc. Inst. Mech. Eng. Part B J. Eng. Manuf. 2021, 235, 902–911. [Google Scholar] [CrossRef]
- Heigel, J.C.; Michaleris, P.; Palmer, T.A. Measurement of forced surface convection in directed energy deposition additive manufacturing. Proc. Inst. Mech. Eng. Part B J. Eng. Manuf. 2016, 230, 1295–1308. [Google Scholar] [CrossRef]
- Sasikumar, K.; Arulshri, K.; Ponappa, K.; Uthayakumar, M. A study on kerf characteristics of hybrid aluminium 7075 metal matrix composites machined using abrasive water jet machining technology. Proc. Inst. Mech. Eng. Part B J. Eng. Manuf. 2018, 232, 690–704. [Google Scholar] [CrossRef]
- Papazetis, G.; Vosniakos, G.-C. Feature-based process parameter variation in continuous paths to improve dimensional accuracy in three-dimensional printing via material extrusion. Proc. Inst. Mech. Eng. Part B J. Eng. Manuf. 2019, 233, 2241–2250. [Google Scholar] [CrossRef]
- Gibson, I.; Rosen, D.; Stucker, B.; Khorasani, M. Sheet lamination. In Additive Manufacturing Technologies; Springer: Cham, Switzerland, 2021; pp. 253–283. [Google Scholar]
- Yang, X.; Li, W.; Chen, Y.; Guo, Y. Construction of a COVID-19 Pandemic Situation Knowledge Graph Considering Spatial Relationships: A Case Study of Guangzhou, China. ISPRS Int. J. Geo-Inf. 2022, 11, 561. [Google Scholar] [CrossRef]
- Tiwari, S.; Al-Aswadi, F.N.; Gaurav, D. Recent trends in knowledge graphs: Theory and practice. Soft Comput. 2021, 25, 8337–8355. [Google Scholar] [CrossRef]
- Oliveira, W.; Oliveira, D.D.; Braganholo, V. Provenance analytics for workflow-based computational experiments: A survey. ACM Comput. Surv. CSUR 2018, 51, 1–25. [Google Scholar] [CrossRef]
- Chen, Z.; Zhang, F.; Liu, H.; Wang, L.; Zhang, Q.; Guo, L. Real-time detection algorithm of helmet and reflective vest based on improved YOLOv5. J. Real-Time Image Process. 2023, 20, 4. [Google Scholar] [CrossRef]
- Aversa, A.; Marchese, G.; Bassini, E. Directed energy deposition of aisi 316l stainless steel powder: Effect of process parameters. Metals 2021, 11, 932. [Google Scholar] [CrossRef]


Disclaimer/Publisher’s Note: The statements, opinions and data contained in all publications are solely those of the individual author(s) and contributor(s) and not of MDPI and/or the editor(s). MDPI and/or the editor(s) disclaim responsibility for any injury to people or property resulting from any ideas, methods, instructions or products referred to in the content. |
© 2023 by the authors. Licensee MDPI, Basel, Switzerland. This article is an open access article distributed under the terms and conditions of the Creative Commons Attribution (CC BY) license (https://creativecommons.org/licenses/by/4.0/).