Abstract
Collision avoidance has been widely researched in the field of intelligent vehicles (IV). However, the majority of research neglects the individual driver differences. This paper introduced a novel personalized collision avoidance control (PCAC) strategy for IV based on driving characteristics (DC), which can better satisfy various scenarios and improve drivers’ acceptance. First, the driver’s DC is initially classified into four types using K-means clustering, followed by the application of the analytic hierarchy process (AHP) method to construct the DC identification model for the PCAC design. Then, a novel PCAC is integrated with a preview-follower control (PFC) module, an active rear steering (ARS) module, and a forward collision control (FCC) module to ensure individual requirements and driving stability. Moreover, simulations verified the validity of the developed PCAC in terms of path tracking, lateral acceleration, and yaw rate. The research results indicate that DC can be identified effectively through APH, and PCAC based on DC can facilitate the development of intelligent driving vehicles with superior human acceptance performance.
1. Introduction
Intelligent vehicles (IV), equipped with advanced driving assistant systems (ADAS), are the best way to improve traffic efficiency, reduce collisions, and achieve self-driving. However, complex traffic situations, unexpected objects, and different driving styles could easily induce crash accidents [1]. Therefore, collision avoidance is one essential issue in the development of IV. Early collision avoidance strategies, such as active emergency brake (AEB), forward collision warning (FCW), and adaptive cruise control (ACC), are mainly focused on longitudinal control [2,3,4]. It cannot achieve all driving conditions at this stage. Meanwhile, driver and IV will exist simultaneously in the long future. The driving characteristics (DC) of different individuals are an essential factor that affects the performance of collision avoidance controllers (CAC) [5]. For this reason, the DC is becoming a mainly considered aspect of CAC design.
The study on driving characteristics and self-driving for IV has become even more popular in recent years [6,7]. Presently, humans need to intervene timely according to the request of the vehicle decision module for quite some time as IV can only handle some instruction in a specific context. Autonomous collision avoidance faces challenges in complex environments for IV [8,9]. The integral design thinking for CAC involves initial path planning followed by precise path tracking [10]. Claussmann et al. [11] reviewed the most representative methods for path planning. Yim et al. [12] discussed the active steering methods for path tracking, such as active front steering (AFS) [13], four-wheel independent steering (4WIS) [14], and active rear steering (ARS) [6]. However, without considering the effects of DC, these methods lack some accuracy.
To further consider the effects of DC, Guo et al. [15] reviewed and analyzed the application of the driving assistance system and man–machine co-driving cooperation control based on the research results of driving characteristics. Yi et al. [16] developed a personalized assistance system by observing different drivers performing the same operation at intersections. Zhu et al. [17] divided the drivers of autonomous vehicles into adaptive drivers and non-adaptive drivers and proved that the traffic capacity improved with the increase in the number of adaptive drivers. Li et al. [18] established a human-like trajectory-planning method of IV based on a cyclic neural network. Zhu et al. [19] designed a human-like autonomous car-following model with deep reinforcement learning. Yang et al. [20] developed an automated highway driving decision considering driver characteristics. Jiang et al. [21] designed a personalized driver model, including a longitudinal driving behavior model and a lateral lane-change trajectory-planning model by analyzing the driving habits of different drivers. These methods have greatly improved driver adaptability, but they neglect driving safety issues.
When implementing CAC in reality, the driving characteristics cannot be assumed and must be extracted from data. To further identify DC, Wang et al. [22] used the parameters of time headway, the inverse of the time to the collision to distinguish driver characteristics, and the K-means clustering algorithm to classify driving behavior. Zong et al. [23] defined a driver characteristics identification model by using the neural network method, and the parameters of steering wheel speed and average velocity are used to characterize driving characteristics. Wang et al. [24] presented a novel framework for driving style analysis based on a Bayesian non-parametric approach. Zhu et al. [25] introduced a random forest model to establish a driving style identification strategy according to the hierarchical clustering theory. Zou et al. [26] employed a support vector machine to identify the driving styles, which is more objective than traditional studies on driving characteristics that are partially subjective and may have issues with calibration accuracy, training sample labels, and identification results. Compared to traditional DC studies, many previous works of machine learning (ML) have been utilized [27,28]. Guo et al. [29] developed a hybrid unsupervised deep learning model for driving behavior recognition. These machine learning techniques presuppose a balanced dataset, but in most cases, the data are imbalanced. Therefore, directly applying these methods may lead to a loss of accuracy.
Motivated by the above discussion, this paper develops a novel PCAC strategy with active security cooperative control. The architecture of the PCAC is comprised of perception sensors together with a decision layer, a control layer, and a chassis actuator. The innovations are summarized as follows:
- Unlike the previous work [26] that only collected DC data under a DLC condition, our study designed five test scenarios for data collection: road construction, the bus station, crossing pedestrians, opposite lane motorcade, and stopped taxi. We adopted K-means clustering to classify DC and used AHP to identify it. The first stage evaluation includes speeding range, brake deceleration, velocity SD, and time ahead of turn signal with varying weightage;
- Unlike the works [6,12,13,14] that design the CAC through pure steering or braking control, this article proposed a PCAC incorporating personalized driver preferences as a key design factor. Specifically, the PCAC is tailored to individual driving habits while ensuring optimal driving stability;
- To validate the proposed PCAC based on DC, the PFC model with different DC based on lateral acceleration feedback (LAC), ARS with different DC based on Adaptive model-predictive control (AMPC), and FCC with different DC based on fuzzy PID are respectively designed. Simulation results demonstrate that the proposed PCAC not only effectively avoids collisions but also enhances drivers’ acceptance. Furthermore, the proposed PCAC improves driving stability and acceptance for both steady and general drivers, particularly in high-speed conditions.
2. Driving Characteristics Classification and Identification
Every driver has a unique driving characteristic, also referred to as driving style, which needs to be classified before identification [30]. In this section, driving characteristics are classified into four types by the K-means clustering algorithm and identified by the analytic hierarchy process (AHP) method later. Typically, driving characteristics are characterized by a large number of driving parameters. The first stage evaluation indexes of over-speed range, brake deceleration, velocity SD, and time ahead of turn signal are an accumulation from the solution layer to the criterion layer. The structure of DC identification is shown in Figure 1.
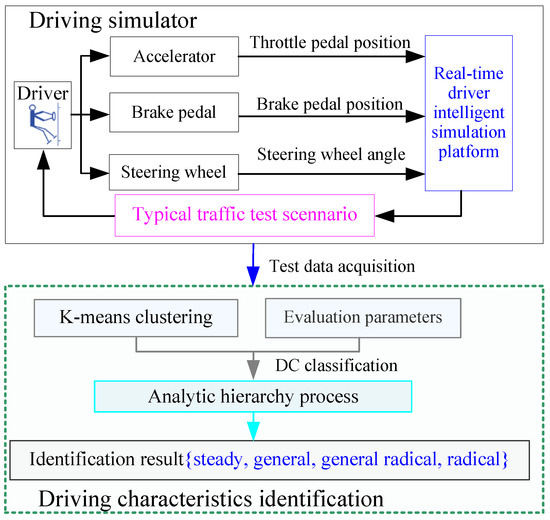
Figure 1.
Structure of driving characteristics identification.
2.1. Driving Characteristics Classification Model
To reach a viable classification of the DC, it is necessary to select feasible evaluation parameters that can describe it.
2.1.1. Evaluation Parameters
To evaluate the DC, the driver’s operation (acceleration, deceleration, steering, shifting, and braking) can reflect the level of safety consciousness of drivers and the ability of collision avoidance. The driver’s operation behavior parameters and vehicle dynamics parameters are taken as the basic indexes to evaluate the DC.
In terms of operation behavior, indicators such as accelerator, steering, brake, and time ahead of turn signal are mainly considered. In this paper, overspeed, brake deceleration, velocity SD, and time ahead of the turn signal are used as the evaluation indexes.
2.1.2. K-Means Clustering Algorithm
According to the selected indicators, DC is classified using the K-means clustering algorithm [26]. Five test scenarios are employed based on typical traffic design principles: road construction, bus station, crossing pedestrians, opposite lane motorcade, and stopped taxi. The driving styles are classified using the first three principal components (overspeed, brake deceleration, and velocity SD) under the bus station and stopped taxi scenario. After numerous calculations, a more precise classification is attained, resulting in the division of DC into four distinct categories as
DC = {steady, general, general radical, radical}
The process flow of K-means clustering is illustrated in Figure 2.
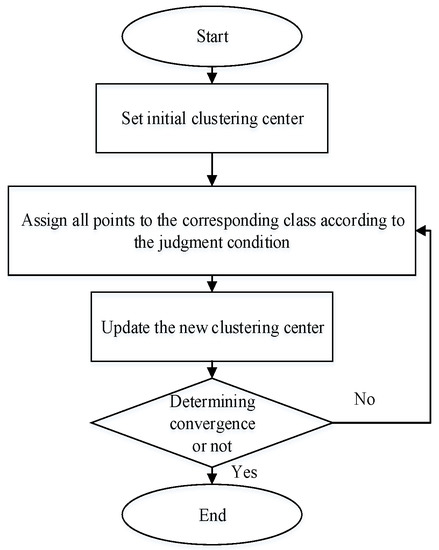
Figure 2.
K-means clustering processing.
2.2. AHP Method
The analytic hierarchy process (AHP) [31,32] is a powerful tool for decision-making situations that enables the determination of the weight of each evaluation index.
2.2.1. Hierarchical Structure
First, define a problem, such as DC recognition, then structure the hierarchy from the top with the target. Next, target through the criterion levels (first stage evaluation indexes of over-speed, brake deceleration, velocity SD, and time ahead of turn signal) to the solution level (5 test scenarios). The step hierarchy diagram for the driving characteristics recognition model is shown in Figure 3.
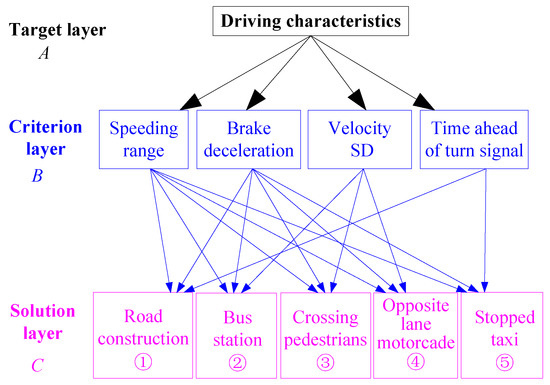
Figure 3.
Hierarchy diagram of the DC recognition mode.
2.2.2. Relative Weigh
Experts’ opinions on the factors were considered when determining the relative weightage of individual criteria. The AHP process includes a scientific research team consisting of six experts. The target layer, criterion layer, and solution layer are represented by symbols. Table 1 represents the general judgment matrix.

Table 1.
Comprehensive judgment matrix.
These coupled comparisons enable the development of a coupled comparison matrix that evaluates the sensitivity of each criterion in DC. The eigenvectors of the judgment matrix are obtained by the root value method [32] as:
Determine the largest matrix eigenvalue as:
Then normalizing the eigenvector of the λmax as:
To evaluate the consistency of the experts’ scoring, the consistency ratio PCR is designed as:
where RI is a random index (detailed value reference [27]), n is the order of the judgment matrix, CI is the consistency index, and .
Based on the weight of each index, the following DC identification model is established as:
where .
2.2.3. Judgment Criteria
When applying AHP to identify DC, the judgment criteria for each indicator in the criterion layer after K-means clustering are as follows.
- Over-speed
The characteristics of over-speed are classified and further scored: with a speed that is 15 to 20 percent over the limit, it is considered Radical, scoring 40; 10 to 15% over the limit, considered General Radical, scoring 60; 5 to 10% over the speed limit, considered General, scoring 80; less than 5%, considered Steady, scoring 100;
- Brake deceleration
The brake deceleration of the driver is classified and scored: Greater than 4 m/s2 is considered to be Radical, scoring 40; 3 to 4 m/s2 is considered General Radical, scoring 60; 1 to 3 m/s2 considered General, scoring 80; less than 1 m/s2 considered Steady, scoring 100;
- Velocity SD
The standard deviation (SD) of the velocity is classified and scored: Greater than 12 km/h is considered to be Radical, scoring 40; 8 to 12 km/h is considered General Radical, scoring 60; 1 to 8 km/h considered General, scoring 80; less than 4 km/h considered Steady, scoring 100;
- Time ahead of turn signal
The time ahead of the turn signal is classified and scored: Less than 1 s is considered Radical, scoring 40; 1 to 2 s is considered General Radical, scoring 60; 2 to 3 m/s2 is considered General, scoring 80; greater than 3 s considered Steady, scoring 100.
3. Personalized Collision Avoidance Control Design
The PCAC is a two-layered structure, which is composed of PFC, ARS, and FCC. The general framework of PCAC is shown in Figure 4.
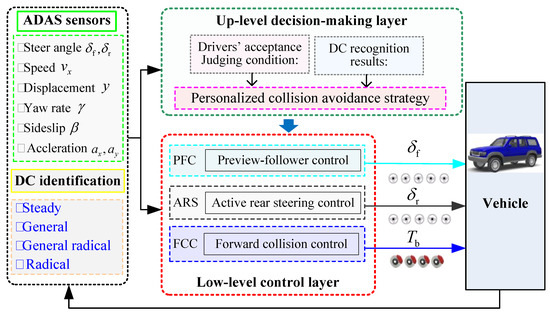
Figure 4.
General framework of PCAC.
3.1. Collision Avoidance by Preview-Follower Control
The preview-follower control (PFC) by LAC is designed in Figure 5.
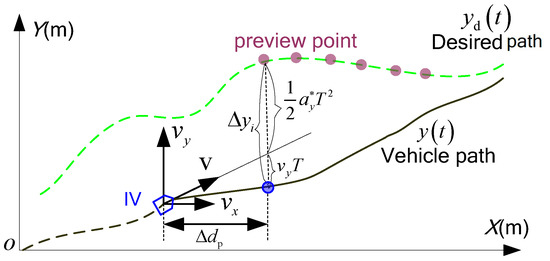
Figure 5.
PFC by LAC.
The relations of the preview distance ∆dp and preview time T can be described as:
where vx is the vehicle speed.
After T, the lateral position error can be eliminated as [6]:
where is the desired value of ay, yd, and y that are ideal and real side displacements.
The ideal lateral acceleration is designed as:
To achieve , the desired steer angle can design as [6]:
where .
Coefficient ψs is given by
where preview distance ∆dp varies with different drivers.
In this paper, we classify drivers by four types of DC (steady, general, general radical, and radical), which makes it easier to analyze the effect of preview distance ∆dp on PFC. The lateral acceleration and path-tracking responses are evaluation indices for driver acceptance and PFC efficiency. A block diagram of the PFC model based on LAC is shown in Figure 6.
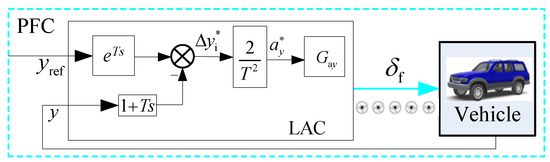
Figure 6.
PFC model based on LAC.
3.2. Collision Avoidance by Active Rear Steering Control
The ARS control based on AMPC is illustrated in Figure 7, where the inputs of AMPC include vehicle speed, steering angle, and yaw rate.
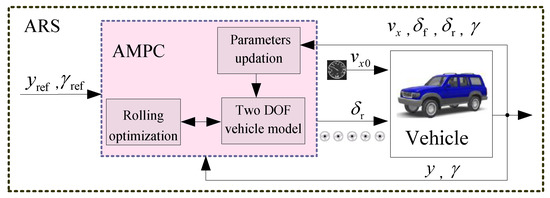
Figure 7.
ARS by AMPC.
For the two-DOF linear vehicle model equipped with four-wheel steering (4WS), Figure 8 illustrates its schematic diagram. For the purpose of analysis, we also make certain simplifying assumptions. The direct angles of the front and rear wheels are utilized as inputs. The righting torque influence is not taken into account; it only considers lateral motion and yaw motion. Therefore, the lateral and yaw motion can be mathematically expressed, as:
where kf and kr are the vehicle cornering stiffness, m is the mass of the IV, vx and vy are the longitudinal and lateral velocities, lf and lr are the distances from CG to the front and rear axles, respectively, δf and δr are the steering angle of the front and rear wheels, Iz is the yaw moment of inertia, and γ is the yaw rate.
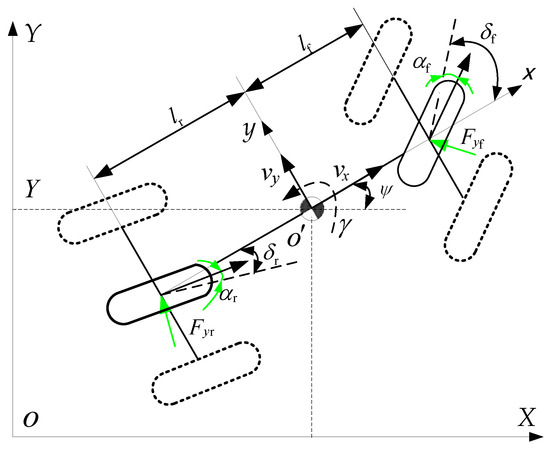
Figure 8.
Schematic diagram of two-DOF vehicle dynamic model equipped with 4WS.
The global coordinates in Y axis are transferred as follows:
where ψ is the yaw angle, is the vehicle velocity in global coordinates Y axis, and it is known that
Written in the state equation of Equations (13)–(15), as:
where the state vector x= [vy γ Y ψ]T, and the input vector u = [δf, δr]T,
Discrete state space of Equation (16) as
where , and x(k), x(k+1) are output states at time k, k + 1; ∆T is discretization time.
The states of the future P are:
Then,
where ,.
The sequence of reference Rk is
where .
Then, define a minimization function J as:
where Q and R are the weight matrices, Np and Nc are the predictive and control step lengths.
Then, the optimization problems for ARS control as:
where .
The reference value of yaw rate γref is given by [33]:
3.3. Forward Collision Control
The architecture of the forward collision control (FCC) based on fuzzy-PID is shown in Figure 9.
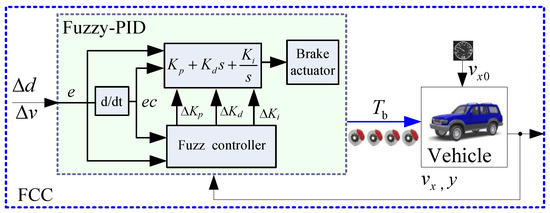
Figure 9.
FCC based on fuzzy-PID.
For safe collision time Tsc of FCC design, the value is often set as 2.4 s. Three DC levels (radical, general, and steady) are used to analyze the influence of DC on FCC and set ζs = {0.8,1,1.2}. To guarantee drivers’ acceptance, define the collision time by a collision risk coefficient ζs as:
where ∆d and ∆v are the relative distance and speed between the main vehicle and the obstacle, respectively.
To achieve the design of FCC, a fuzzy-PID is used. The interval changing of parameters (∆Kp, ∆Ki, ∆Kd) is obtained by fuzzy control. The required braking output of the FCC is as follows:
For the design of fuzzy control, seven conditions are considered for fuzzification. The linguistic variables of the input and output variables are classified as negative big (NB), negative middle (NM), negative small (NS), zero (ZO), positive small (PS), positive middle (PM), and positive big (PB). The vehicle is tested in Carsim with a safety range from 0 to 120 m. The basic theoretical domain for the error is [−6, 6]. Additionally, the same quantization objective is applied in the establishment of trigonometric membership functions and setting the theoretical domains for input and output variables as [−6, 6]. The initial values for Kp, Ki, and Kd are 1, 0.001, and 0.1, respectively. The fundamental theoretical ranges for ∆Kp, ∆Ki, and ∆Kd are [1, 10], [0.001, 0.01], and [0, 2], respectively. Figure 10 shows the membership functions of the input/output variables.
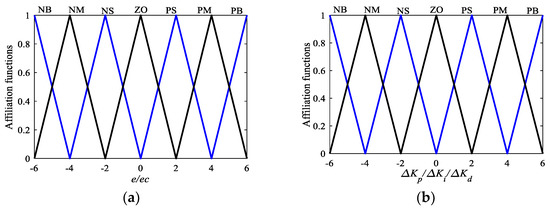
Figure 10.
Membership functions for FCC in fuzzy control: (a) input variables of e/ec; (b) output variables of ∆Kp/∆Ki/∆Kd.
Fuzzy rules must consider both dynamic error and overshoot. When the relative distance error is minimal, prompt deviation reduction is imperative to ensure that the vehicle attains a safe distance expeditiously. The fuzzy rules are given in Table 2.
Table 2.
Fuzzy rules.
3.4. PCAC by PFC, ARS, and FCC
The detailed personalized collision avoidance control scheme for IV integrated with PFC, ARS, and FCC is designed in Figure 11.
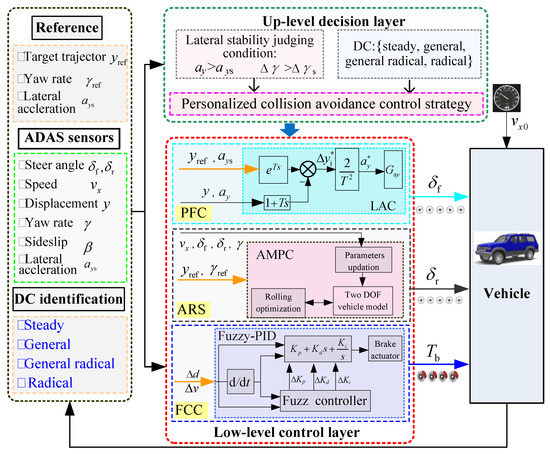
Figure 11.
Detailed PCAC scheme.
The decision layer must be supported by ADAS sensors, reference data, and recognized driving characteristics. The control layer is operated by the decision layer. The PCAC is being integrated with FPC via LAC, ARS through AMPC, and FCC means of fuzzy-PID. Table 3 illustrates the PCAC strategy.
Table 3.
Personalized collision avoidance control strategy.
4. Results and Discussion
To validate the proposed PCAC for IV, the DC will first be evaluated through a driving simulator, followed by an assessment of the PCAC strategy using virtual simulations. The CarSim vehicle model is utilized for test IV, which involves double lane change (DLC) maneuvers at speeds of 80, 100, and 120 km/h. The virtual simulation parameters are presented in Table 4.
Table 4.
Simulation parameters.
4.1. DC Evaluated by Driving Simulation Platform
In this section, the DC is assessed using a sample of 16 subjects in the selected test scenario.
4.1.1. Typical Traffic Scenarios Design
The designed scenario for the DC evaluation is illustrated in Figure 12, comprising five distinct test scenarios: road construction, bus station, crossing pedestrians, opposite lane motorcade, and stopped taxi, respectively.
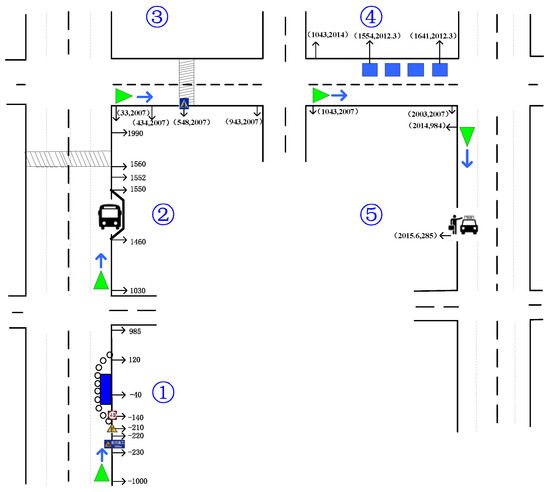
Figure 12.
Typical traffic scenarios used for DC evaluation.
- Road construction scenario
Drivers should change lanes to navigate through the construction area. Drivers with steady characteristics will anticipate the situation ahead of time, heed deceleration signs, and reduce speed for a smooth transition. Conversely, radical drivers may attempt to pass at high speeds or make sudden decelerations. The road construction scenario is shown in Figure 13a;
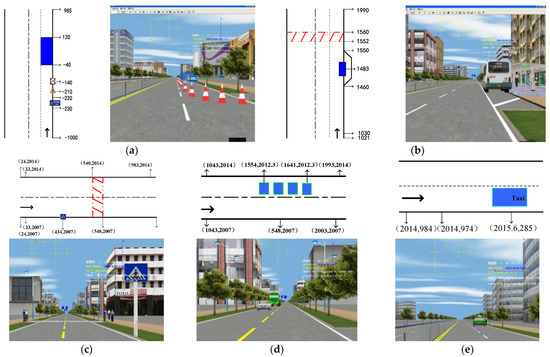
Figure 13.
Typical traffic scenarios: (a) road construction; (b) bus station; (c) crossing pedestrians; (d) opposite lane motorcade; (e) stopped taxi.
- Bus station scenario
The traffic characteristics of city buses involve frequent personnel embarkation and disembarkation during their start and stop operations. When a bus is parked at a station with a crosswalk in front, the steady characteristics drivers will anticipate its presence and reduce speed accordingly to ensure smooth operation. Conversely, radical drivers may abruptly decelerate or recklessly pass the bus at high speeds. The bus station scenario is shown in Figure 13b;
- Crossing pedestrians scenario
On a residential road, be cautious of pedestrian crossings that may pose traffic hazards. Vehicles must come to a stop at zebra crossings when pedestrians are present for safe driving. The crossing pedestrians scenario is shown in Figure 13c;
- Opposite lane motorcade scenario
Motorcades traveling in the opposite lane are a common occurrence on urban roads. Conservative drivers should reduce their speed, while radical drivers typically take no action. The opposite lane motorcade scenario is shown in Figure 13d;
- Stopped taxi scenario
In this scenario, the taxi comes to a halt at the roadside. Drivers with steady characteristics will decelerate in advance, maintain adequate distance, and endeavor to avoid abrupt braking. The scenario is shown in Figure 13e.
4.1.2. Driving Data Collection
To obtain the driver’s data for DC identification, a vehicle–road cooperative test and simulation platform is utilized, as depicted in Figure 14. A total of 16 drivers (14 male and 2 female) were selected, and their detailed information can be found in Table 5.
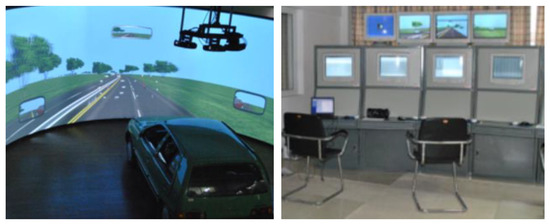
Figure 14.
Vehicle–road cooperative test and simulation platform.
Table 5.
Basic driver information.
The maximum deceleration, maximum, and minimum longitudinal speed of 16 drivers’ testing data under the same bus station scenario are collected in Figure 15.
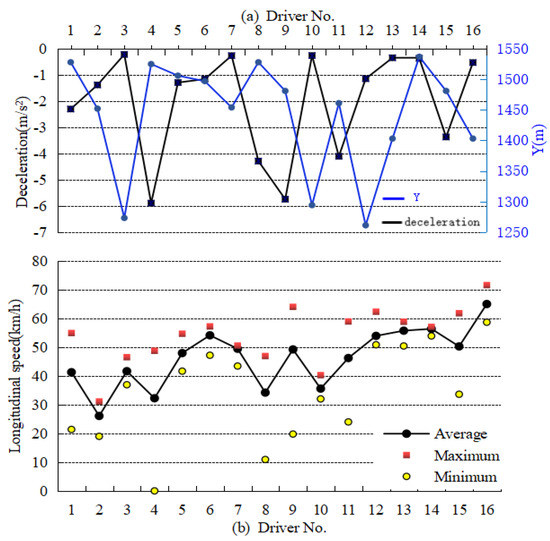
Figure 15.
Driver’s driving data: (a) deceleration; (b) longitudinal speed.
It can be seen from Figure 15 that the 16 drivers have different handling characteristics in the same condition, and the outputs of vehicle state response are also varied greatly.
4.1.3. DC Classification by K-Means Clustering
The four cluster centers of DC are the steady type (0.02, 1.28, 1.20), the general type (0.07, 0.55, 2.63), the general radical type (0.17, 1.30, 5.24), and the radical type (0.18, 4.35, 12.30). The results of K-means clustering are shown in Figure 16.
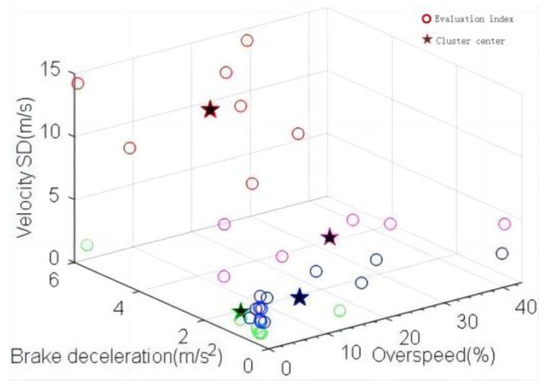
Figure 16.
Clustering results of DC.
The classification results of the criterion layer parameters B1, B2, and B3 from the five scenarios are shown in Figure 17.
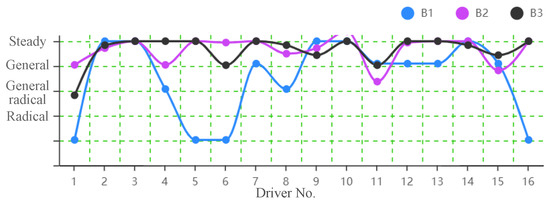
Figure 17.
B1, B2, and B3 classification results.
4.1.4. DC Identification by AHP
The index weights for the criterion and solution layers, as determined by AHP, are presented in Table 6.
Table 6.
Evaluated index weights of criterion and solution layer.
The identification results of the driver’s DC based on the AHP method are shown in Table 7.
Table 7.
DC identification results.
It can be observed that the prediction accuracy by AHP is high compared with an expert system [34]. Therefore, it concluded that the DC identification model demonstrates strong efficacy.
4.2. PCAC by PFC, ARS, and FCC
In this section, the performance of the designed PCAC will be evaluated numerically through simulations utilizing various methods.
4.2.1. PFC with Different DC
For PFC simulation, the target path is defined as a known volume, which can be referred to as Li [35]. DLC maneuvers are employed to validate the proposed PFC. Four test cases were designed with identical initial conditions but varying DC, where ∆dsafe = 30 m, and ψs = {0.6, 0.8, 1, 1.2} = {radical, general radical, general, steady}. The outputs with different DC are shown in Figure 18.
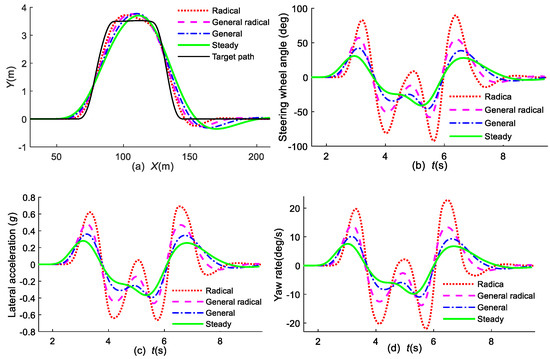
Figure 18.
Outputs comparison by PFC with different DC: (a) Y; (b) steering angle; (c) lateral acceleration; (d) yaw rate.
Figure 18 illustrates that the steering and evaluation index outputs of PFC exhibit smaller magnitudes, greater stability, and earlier initiation by steady and general drivers in comparison to radical drivers.
4.2.2. PFC + ARS with Different Methods
For steady and general drivers, the acceptance of the CAC is still limited by PFC due to lateral acceleration exceeding 4 m/s2. Therefore, an integrated CAC with PFC and ARS has been developed, with a steady level set for PFC. The comparison of path tracking, rear wheel steer angle, and evaluation index by ARS is illustrated in Figure 19.
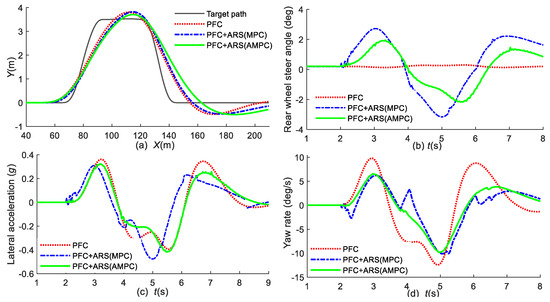
Figure 19.
Outputs comparison of ARS with different methods: (a) Y; (b) steering angle; (c) lateral acceleration; (d) yaw rate.
As shown in Figure 19, the lateral acceleration has decreased by 11% of PFC + ARS at 3.2 s compared to PFC alone. Furthermore, the reduction in the yaw rate surpasses 30%. This indicates that ARS can restrain lateral response and enhance comfort for steady drivers.
4.2.3. PFC + FCC with Different DC
To assess the CAC by FCC, the DLC maneuvers in different DC are performed. Set TSC = 2.4 s, ∆v = 75 km/h, ζs = 1, ∆d = 50 m. Three DC levels (radical, general, and steady) are utilized for analyzing the impact of DC on the FCC. The values of ζs set at {0.8,1,1.2}, while vx0 = 110 km/h. The vehicle speed, forward distance, path tracking, and yaw rate response under different DC conditions are illustrated in Figure 20, and the variation of brake moment by FCC with different DC is shown in Figure 21.
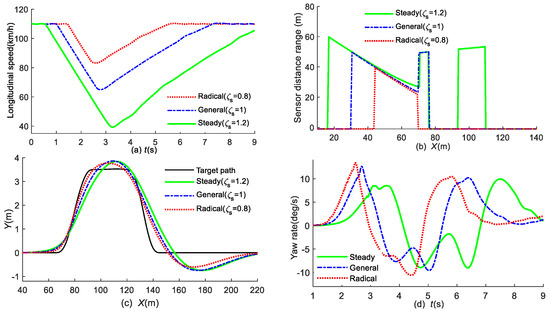
Figure 20.
State response by FCC with different DC: (a) vehicle speed; (b) forward collision distance; (c) path tracking; (d) yaw rate.
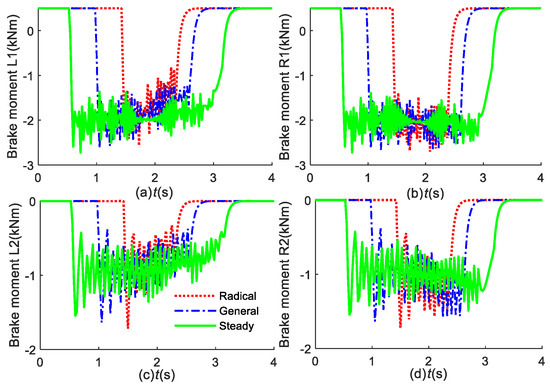
Figure 21.
Brake moment by FCC with different DC (‘L1’, ‘R1’, ‘L2’, and ‘R2’ denote the front left wheel, front right wheel, rear left wheel, and rear right wheel, respectively): (a) L1; (b) R1; (c) L2; (d) R2.
Figure 20 and Figure 21 demonstrate that the FCC applied braking at 0.5 s (with a forward collision distance ∆d = 60 m) for a steady driver, resulting in a reduction of vehicle speed to 40 km/h. This is in line with the habits of steady drivers. However, for a radical driver, it was found that applying brakes at 1.5 s (with a forward collision distance ∆d = 40 m) would be more appropriate.
4.2.4. PCAC with Different Methods
To verify the efficacy of PCAC by PFC + ARS + FCC, the DC of integrated CAC is maintained at a steady level with vx0 = 110 km/h. Figure 22 illustrates output comparisons for path tracking, rear wheel steer angle, and driver acceptance index under different control methods.
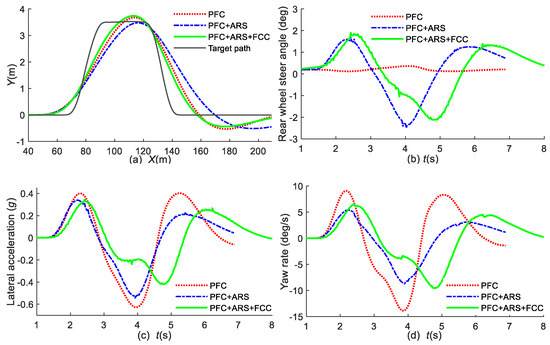
Figure 22.
Outputs comparison of the PCAC with different methods: (a) Y; (b) steering angle; (c) lateral acceleration; (d) yaw rate.
The results in Figure 22a indicate that the path tracking by the integrated CAC is more accurate than PFC and ARS. As shown in Figure 22c, PFC yields a lateral acceleration of up to 6 m/s2, rendering it unsuitable for general drivers. However, the vehicle controlled by the integrated CAC comprising PFC + ARS + FCC can significantly reduce lateral acceleration by over 30% compared to that achieved by PFC alone. In addition, as shown in Figure 22b,d, the yaw rate of the vehicle equipped with PFC + ARS and PFC + ARS + FCC is reduced by over 30% compared to those with CAC by PFC. The personalized CAC enhances acceptance among steady and general drivers, especially in high-speed obstacle-avoidance scenarios.
5. Conclusions
The designed novel personalized collision avoidance control (PCAC) strategy for intelligent vehicles (IV) based on driving characteristics (DC) can not only improve driving stability but also improve driver adaptability. The PCAC consists of a decision part and a control part. Specifically, the CAC is integrated with preview-follower control (PFC), active rear steering (ARS), and forward collision control (FCC). As a result, we came to the following conclusions:
The DC of 16 drivers can be classified into four types: steady, general, general radical, and radical. The analytic hierarchy process (AHP) can be used to recognize the DC accurately.
The PFC model with different DC based on lateral acceleration feedback (LAC) shows that the evaluation indexes are smaller, more stable, and steering earlier by steady and general drivers compared with radical drivers, which can meet individual requirements.
For steady and general drivers, the acceptance of the PCAC by PFC remains inadequate due to lateral acceleration surpassing its threshold. However, when combined with PFC+ARS, PCAC demonstrates an 11% reduction in lateral acceleration compared to PFC alone. Additionally, the peak value reduction of the yaw rate exceeds 30%.
The PCAC integrated with PFC, ARS, and FCC significantly reduces lateral acceleration and yaw rate, resulting in an improved acceptance index of over 30% compared to the PCAC with only PFC. This proposed system effectively enhances driving stability and acceptance for both steady and general drivers, particularly in high-speed obstacle-avoidance scenarios.
Future work will focus on drivers’ DC recolonization based on deep reinforcement learning (DRL).
Author Contributions
Conceptualization, H.L. and L.G.; methodology, software, validation, H.L., X.C. and L.G.; formal analysis, T.Z.; investigation, resources, data curation, writing—original draft preparation, writing—review and editing, visualization, H.L., X.C. and L.G.; supervision, project administration, L.G. and T.Z. All authors have read and agreed to the published version of the manuscript.
Funding
This research was funded by the Basic Research and Frontier Technology of the Chongqing Science and Technology Commission, grant number cstc2020jcyj- msxmX0915, the Chongqing Municipal Education Commission, grant number KJQN202100644, and the Fundamental Research Funds for the Central Universities, grant number E012A2020024.
Data Availability Statement
Not applicable.
Acknowledgments
The author greatly appreciated the financial support.
Conflicts of Interest
The authors declare no conflict of interest.
List of Symbols
| Symbol | Description |
| m, ms | Vehicle, sprung mass, |
| vx, vy | Longitudinal, lateral velocity |
| ay, ay | Longitudinal, lateral acceleration |
| a*y | Ideal lateral acceleration |
| muf, mur | Front, rear unsprung mass |
| lf, lr | Front, rear axle distance to CG |
| δf, δr | Front, rear-wheel steering angle |
| X, Y | Distance in global coordinates x, y-axis |
| x, y | Distance in vehicle coordinates x, y-axis |
| twf, twr | Wheel track width of front, rear axle |
| kf, kr | Front, rear axle cornering stiffnesses |
| Fyf, Fyr | Lateral forces of front, rear axle |
| h, hs | CG height to ground, roll center |
| ∆d, ∆v | Relative distance, speed between vehicle and obstacle |
| ∆dp | Preview distance |
| ψ, γ | Yaw angle, rate |
| Tsc | Safe collision time |
| T | Preview time |
| ∆T | Discretization time |
| Tb | Braking moment |
| ζs | Collision risk coefficient |
| γref | Reference value of yaw rate |
| rw | Wheel roll radius |
| Iz, Iy, Ix | Yaw, pitch, roll moment of inertia |
| g | Acceleration due to gravity |
| μ | Road adhesion coefficient |
| Ak | Target element of AHP |
| Bi | Selected criteria of AHP |
| bij | Priority score given to each criterion |
| Eigenvectors of the judgment matrix | |
| λmax | Largest matrix eigenvalue |
| PCR | Consistency ratio |
| Np, Nc | Predictive, control step length |
| P | States of the future |
Abbreviations
| IV | Intelligent vehicles |
| CAC | Collision avoidance control |
| PCAC | Personalized collision avoidance control |
| DC | Driving characteristics |
| ADAS | Advanced driving assistant systems |
| AHP | Analytic hierarchy process |
| PFC | Preview-follower control |
| ARS | Active rear steering |
| DLC | Double lane change |
| FCC | Forward collision control |
| LAC | Lateral acceleration feedback |
| AMPC | Adaptive model-predictive control |
| FCW | Forward collision warning |
| AEB | Active emergency brake |
| ACC | Adaptive cruise control |
| AFS | Active front steering |
| SD | Standard deviation |
| 4WIS | Four-wheel independent steering |
References
- Yang, D.; Jiang, K.; Zhao, D.; Yu, C.; Cao, Z.; Xie, S.; Xiao, Z.; Jiao, X.; Wang, S.; Zhang, K. Intelligent and connected vehicles: Current status and future perspectives. Sci. China Technol. Sci. 2018, 61, 1446–1471. [Google Scholar] [CrossRef]
- Musa, A.; Pipicelli, M.; Spano, M.; Tufano, F.; Nola, F.D.; Blasio, G.D. A review of model predictive controls applied to advanced driver-assistance systems. Energies 2021, 14, 7974. [Google Scholar] [CrossRef]
- Lee, C.; Moon, J. Robust lane detection and tracking for real-time applications. IEEE Trans. Intell. Transp. Syst. 2018, 19, 4043–4048. [Google Scholar] [CrossRef]
- Wang, X.; Chen, M.; Zhu, M.; Tremont, P. Development of a kinematic-based forward collision warning algorithm using an advanced driving simulator. IEEE Trans. Intell. Transp. Syst. 2016, 17, 2583–2591. [Google Scholar] [CrossRef]
- Liu, G.; Bei, S.; Li, B.; Liu, T.; Daoud, W.; Tang, H.; Guo, J.; Zhu, Z. Research on collision avoidance systems for intelligent vehicles considering driver collision avoidance behaviour. World Electr. Veh. J. 2023, 14, 150. [Google Scholar] [CrossRef]
- Li, H.; Li, J.; Su, Z.; Wang, X.; Luo, J. Research on active obstacle avoidance control strategy for intelligent vehicle based on active safety collaborative control. IEEE Access 2020, 8, 183736–183748. [Google Scholar] [CrossRef]
- Kolekar, S.; Winter, J.; Abbink, D. Human-like driving behaviour emerges from a risk-based driver model. Nat. Commun. 2020, 11, 4850. [Google Scholar] [CrossRef] [PubMed]
- Hang, P.; Lv, C.; Huang, C.; Hu, Z.X.; Xing, Y. An integrated framework of decision making and motion planning for autonomous vehicles considering social behaviors. IEEE Trans. Veh. Technol. 2020, 69, 14458–14469. [Google Scholar] [CrossRef]
- Zheng, X.; Huang, H.; Wang, J.; Xu, Q. Behavioral decision-making model based on driving risk assessment for intelligent vehicle development. Comput.-Aided Civ. Inf. 2019, 36, 820–837. [Google Scholar] [CrossRef]
- Wang, C.Y.; Zhao, W.Z.; Xu, Z.J.; Zhou, G. Path planning and stability control of collision avoidance system based on active front steering. Sci. China Technol. Sci. 2017, 60, 1231–1243. [Google Scholar] [CrossRef]
- Claussmann, L.; Revilloud, M.; Gruyer, D.; Glaser, S. A review of motion planning for highway autonomous driving. IEEE Trans. Intell. Transp. Syst. 2020, 21, 1826–1848. [Google Scholar] [CrossRef]
- Yim, S. Comparison among active front, front independent, 4-wheel and 4-wheel independent steering systems for vehicle stability control. Electronics 2020, 9, 798. [Google Scholar] [CrossRef]
- Hu, C.; Zhao, L.; Cao, L.; Tjan, P.; Wang, N. Steering control based on model predictive control for obstacle avoidance of unmanned ground vehicle. Meas. Control 2020, 53, 501–518. [Google Scholar] [CrossRef]
- Jeong, Y.; Yim, S. Integrated path tracking and lateral stability control with four-wheel independent steering for autonomous electric vehicles on low friction roads. Machines 2022, 10, 650. [Google Scholar] [CrossRef]
- Guo, L.; Ma, Y.; Yue, M.; Ming, Y.; Qin, Z. Overview of recognition and evaluation of driving characteristics and their applications in intelligent vehicles. J. Traffic. Transp. 2021, 21, 7–20. [Google Scholar]
- Yi, D.; Su, J.; Liu, C.; Chen, W.H. Trajectory clustering aided personalized driver intention prediction for intelligent vehicles. IEEE Trand. Ind. Inform. 2019, 15, 3693–3702. [Google Scholar] [CrossRef]
- Zhu, H.; Zhou, Y.; Wu, W. Modeling traffic flow mixed with automated vehicles considering drivers’ character difference. Physica A 2020, 549, 124337. [Google Scholar] [CrossRef]
- Li, A.; Jiang, H.; Zhou, J.; Zhou, X. Learning human-like trajectory planning on urban two-lane curved roads from experienced drivers. IEEE Access 2019, 7, 65828–65838. [Google Scholar] [CrossRef]
- Zhu, M.; Wang, X.; Wang, Y. Human-like autonomous car-following model with deep reinforcement learning. Transp. Res. Part C Emerg. Technol. 2018, 97, 348–368. [Google Scholar] [CrossRef]
- Yang, W.; Zheng, L.; Li, Y.; Ren, Y.; Xiong, Z. Automated highway driving decision considering driver characteristics. IEEE Trans. Intell. Transp. Syst. 2019, 21, 2350–2359. [Google Scholar] [CrossRef]
- Jiang, L.; Wang, Y. personalized computational model for human-like automated decision- making. IEEE Trans. Autom. Sci. Eng. 2022, 19, 850–863. [Google Scholar] [CrossRef]
- Wang, J.; Lu, M.; Li, K. Characterization of longitudinal driving behavior by measurable parameters. Transp. Res. Rec. 2010, 2185, 15–23. [Google Scholar] [CrossRef]
- Zong, C.; Lin, N.; Zhang, Z.; Li, G. A study on the identification algorithm of driver characteristics for X-by-wire vehicles. Auto. Eng. 2014, 36, 1140–1144. [Google Scholar]
- Wang, W.; Xi, J.; Zhao, D. Driving style analysis using primitive driving patterns with Bayesian non-parametric approaches. IEEE Trans. Intell. Transp. Syst. 2019, 20, 2986–2998. [Google Scholar] [CrossRef]
- Zhu, B.; Li, W.; Wang, Z.; Zhao, J.; He, R.; Han, J. Identification strategy of driving style based on random forest. Auto. Eng. 2019, 41, 213–218. [Google Scholar]
- Zou, S.; Luan, Z.; Zhao, W.; Wang, C. Personalized design strategy of vehicle steer-by-wire characteristics considering driving style. Proc. Inst. Mech. Eng. Part C J. Mech. Eng. Sci. 2023, 237, 253–266. [Google Scholar] [CrossRef]
- Wang, H.; Zhang, C.; Shi, T.; Wang, F.; Ma, S. Real-time EEG-based detection of fatigue driving danger for accident prediction. Int. J. Neural Syst. 2015, 25, 1550002. [Google Scholar] [CrossRef]
- Wijnands, J.; Thompson, J.; Aschwanden, G.; Stevenson, M. Identifying behavioural change among drivers using Long Short- Term Memory recurrent neural networks. Transp. Res. Part F Traffic Psychol. Behav. 2018, 53, 34–49. [Google Scholar] [CrossRef]
- Guo, J.; Liu, Y.; Zhang, L.; Wang, Y. Driving behaviour style study with a hybrid deep learning framework based on GPS data. Sustainability 2018, 10, 2351. [Google Scholar] [CrossRef]
- Na, L.; Zong, C.; Tomizuka, M.; Pan, S.; Zhang, Z.; Gang, L. An overview on study of identification of driver behavior characteristics forautomotive control. Math. Probl. Eng. 2014, 2014, 569109. [Google Scholar]
- Vaidya, O.; Kumar, S. Analytic hierarchy process: An overview of applications. Eur. J. Oper. Res. 2006, 169, 1–29. [Google Scholar] [CrossRef]
- Abdo, H.; Almohamad, H.; Dughairi, A.; Al-Mutiry, M. Gis-based frequency ratio and analytic hierarchy process for forest fire susceptibility mapping in the western region of Syria. Sustainability 2022, 14, 4668. [Google Scholar] [CrossRef]
- Li, H.; Zhao, Y.; Lin, F.; Zhu, M. Nonlinear dynamics modeling and rollover control of an off-road vehicle with mechanical elastic wheel. J. Braz. Soc. Mech. Sci. 2018, 40, 51. [Google Scholar] [CrossRef]
- Gao, L. Driving simulation evaluation method to driver’s safety. Kunming Univ. Sci. Technol. 2015. [Google Scholar]
- Luo, J.; Li, S.; Li, H.; Xia, F. Intelligent network vehicle driving risk field modeling and path planning for autonomous obstacle avoidance. Proc. Inst. Mech. Eng. Part C J. Mech. Eng. Sci. 2022, 236, 8621–8634. [Google Scholar] [CrossRef]


Disclaimer/Publisher’s Note: The statements, opinions and data contained in all publications are solely those of the individual author(s) and contributor(s) and not of MDPI and/or the editor(s). MDPI and/or the editor(s) disclaim responsibility for any injury to people or property resulting from any ideas, methods, instructions or products referred to in the content. |
© 2023 by the authors. Licensee MDPI, Basel, Switzerland. This article is an open access article distributed under the terms and conditions of the Creative Commons Attribution (CC BY) license (https://creativecommons.org/licenses/by/4.0/).