Article

Optimization Effect of the Improved Power System Integrating Composite Motors on the Energy Consumption of Electric Vehicles

School of Automotive Engineering, Henan Mechanical and Electrical Vocational College, Zhengzhou 451191, China
World Electr. Veh. J. 2023, 14(9), 257; https://doi.org/10.3390/wevj14090257
Submission received: 5 July 2023 / Revised: 14 August 2023 / Accepted: 25 August 2023 / Published: 11 September 2023

Abstract

:
The multi-power source coupled transmission system is a high-performance and energy-saving potential power transmission system, and most of the commonly used pure electric vehicles in the market that use multi-power source coupled drive adopt the motor dual-axis distributed independent drive scheme. The configuration design method for multi-power source fusion hybrid systems mainly focuses on the search and selection of power split hybrid systems based on planetary gear mechanisms. But it has not yet covered the configuration design of transmission systems, resulting in a lack of universal expression and generation methods for the configuration of multi-power source fusion hybrid systems in pure electric vehicles. Therefore, to solve the configuration optimization design problem of a dual-motor single-planetary-array power system, an improved general matrix topology design method is proposed to generate all feasible topology structures. And energy consumption, economy, and the dynamic performance of alternative configurations are optimized and simulated through the control strategy based on a dynamic programming algorithm. Under comprehensive testing conditions, 25 alternative options that met the screening criteria were selected, and, ultimately, five optimized configuration options were obtained. Configuration 1 has the best economy, reducing energy consumption by about 6.3%and increasing driving range by about 6.7%. Its 0–100 km/h acceleration time is about 31.4% faster than the reference configuration. In addition, the energy consumption economy during actual driving is almost the same as the theoretical optimal energy consumption economy, with a difference of only 0.3%. The success of this study not only provides an innovative method for optimizing the configuration of dual-motor single-row star train power systems, but also has a positive impact on improving energy utilization efficiency, reducing energy consumption, and improving the overall performance of electric vehicles.

1. Introduction

In recent decades, global automobile demand has been continuously increasing with population growth and technological development, leading to a continuous increase in automobile production and sales. However, this growth has caused serious damage to the ecological environment of the earth, as fossil fuel burning generates pollutant emissions, posing a serious threat to the environment. The known oil reserves of the world cannot meet demand in the next 50 years, and energy supply has become a problem concerning the world [1,2,3]. As a populous country, China is facing more prominent issues of energy supply and environmental pollution. China’s dependence on foreign oil exceeds 50%, and energy supply contradictions and security issues seriously constrain the country’s development. To address these issues, the Chinese automotive industry should focus on developing and researching energy-saving and emission-reduction technologies represented by new energy technologies. Compared with traditional fuel vehicles and hybrid electric vehicles, a pure electric vehicle has the advantages of zero fuel consumption, zero emissions, and high energy utilization. At the same time, it can balance the load on the power grid and improve the utilization of power resources [4,5,6]. However, the further development of pure electric vehicles is limited by bottlenecks such as high production costs, a short range, and a long charging time. To break through these bottlenecks, it is necessary to develop efficient and high-performance transmission systems and vehicle control strategies to improve energy utilization, recovery efficiency, and vehicle operating efficiency. Pure electric vehicles, as a key technological path, have high development prospects [7,8,9]. However, to achieve its large-scale and effective popularization, it is necessary to address technical bottlenecks and control strategies. The research on the power-train system of pure electric vehicles mainly focuses on the multi-field coupling characteristics of the electric drive system, the configuration design and optimization methods of the power-train system, and comprehensive control strategies. At present, the power system of pure electric vehicles mainly adopts single-motor drive and multi-motor coordinated/joint drive schemes. There are some problems with the single-motor drive scheme, including the fact that it can only meet the needs of complex driving conditions through the speed and torque of the motor itself, resulting in high requirements for motor performance and difficulty in achieving sustained and efficient operation, thereby reducing the vehicle’s range. These issues have become important reasons for the difficulty of promoting pure electric vehicles on a large scale and effectively. In order to solve these problems, major automobile manufacturers are gradually adopting a multi-power source (multi-motor) coupled transmission system solution, replacing the single-power source transmission system solution with a single motor as the sole power source. The multi-power source coupling transmission system can be divided into distributed and centralized coupling types. By introducing mechanical coupling mechanisms such as planetary gear mechanisms and gear pairs, as well as executing mechanisms, the connection mode of power source components can be changed to achieve multiple driving modes and improve the operational efficiency of the system under complex driving conditions. However, the flexible and variable connection between power source components and mechanical coupling mechanisms leads to diverse and numerous system configurations, making it difficult to express both the topological structure and functional characteristics of the configurations simultaneously and making it difficult to determine the feasibility and applicability of the configurations. Therefore, finding high-performance configurations from a vast array of configuration solutions is a challenging task. Therefore, an improved general matrix topology design method that represents the constraint relationship between mechanical coupling mechanical nodes and power source components is proposed in this study. An energy efficiency optimal control framework based on dynamic traffic information flow was proposed, and a vehicle speed prediction layer was built using a general regression neural network. Research and development of efficient and high-performance transmission systems and vehicle control strategies are important for promoting the industrialization of new energy vehicles.
The study consists of four parts. It firstly introduces the research purpose and conducts a literature review. Then, an electric vehicle energy efficiency optimization strategy was designed under the integration of a composite motor and an improved power system. Next, experimental verification was conducted. Finally, a conclusion was drawn.

2. Related Works

In recent years, research on electric vehicle energy consumption has gradually enriched. Zhao X’s team has proposed an effective method for constructing representative driving cycles for electric vehicles. Then, a filtering process was designed to screen out the most representative driving cycles. In the comparison of test results, there is an important relative error in estimating energy consumption per kilometer, driving range, and equivalent emissions of an electric vehicle under the official driving cycle [10]. Modi S’s team adopts an improved neural network that can accurately predict the remaining vehicle range in real-time, thereby reducing drivers’ range anxiety. This proposed model has consistently outperformed existing technologies and has the lowest error [11]. Alateef S’s team aims to address electric vehicle range anxiety and has designed a speed model based on route information to estimate electric vehicle range. This model utilizes public datasets from multiple map service APIs and incorporates them into the range estimation algorithm. It is feasible to generate realistic driving cycles using public data and simulate driving patterns to meet constraint conditions [12]. Albatayneh A’s team investigated the overall energy efficiency of traditional internal combustion engine vehicles (gasoline, diesel), compressed natural gas vehicles, and electric vehicles. And the following conclusions are reached: When electric vehicles are powered by natural gas power plants, the overall energy efficiency reaches its highest value, ranging from approximately 13% to 31% [13]. Basso R’s team proposed an electric vehicle path planning problem that does not consider the limited driving range and traffic uncertainty of electric commercial vehicles, which are independent of time, do not have probability constraints, and are fully charged. Energy prediction has low accuracy and cannot achieve energy savings and improve route reliability [14].
The limitations of a single-motor drive scheme result in the inability to meet the needs of automobiles under complex driving conditions, increasing the demand for motor performance and making it difficult to achieve sustained and efficient operation of the motor. These issues have become important factors hindering the large-scale promotion of pure electric vehicles. Therefore, in order to alleviate these problems, major automobile manufacturers are gradually adopting a multi-motor coupled transmission system solution to replace a single power source transmission system solution with a single motor as the sole power source. At present, it is common in the market to use a motor dual-axis distributed independent drive scheme. In recent years, research on dual motors has also deepened. Muduli U R’s team introduced a newly developed electric vehicledual-motor differential four-wheel drive system that uses an open-winding induction motor. And a dynamic model of the proposed actuator was proposed. The results confirmed that electric vehicle operation is stable during normal driving cycles [15]. Tu Z’s team designed a free-flight example of a laborious bird robot that independently controls its wings, scaled down and controlled through wireless connections. This study conducted free flight experiments in indoor and outdoor environments and demonstrated that the robot had sustained and stable flight ability [16]. The power system configuration research is also increasing year by year. Jafari M’s team proposed a multi-objective fault current controller configuration scheme based on safety risks and considered its role in dynamic response in the time domain. Compared with a deterministic system, the risk-based model can allocate FCL more effectively, and the average FCL investment has decreased by 7.5% [17]. Mohammad Alikhani A’s team used a two-stage multi-objective optimization algorithm to design a cost-effective and environmentally friendly alternating current micro-grid hybrid power supply system. Compared to traditional algorithms, this proposed algorithm reduces sensitivity to multiple runs and achieves more optimized power supply system design [18]. Sun G J’s team developed a photovoltaic power generation system by using two independently manufactured direct current 180 [V] photovoltaic series connection circuits to achieve smooth experimental progress. This study successfully eliminated the arc occurrence by adding a parallel insulated gate bipolar transistor, and a safe and efficient cut-off circuit was constructed [19].
In recent years, with the electric vehicle market rapidly developing, electric vehicle energy consumption research has received increasing attention. Multiple research teams have proposed different methods to evaluate and optimize the energy consumption, driving range, and corresponding emissions of electric vehicles. In particular, some research teams have focused on the real-time energy consumption of the electric vehicleand its relationship with range, attempting to alleviate range anxiety through more accurate and practical methods. This research will first carry out a detailed optimization design and analysis of a composite motor-integrated power system. The innovation lies in comprehensively considering a dual-motor differential four-wheel drive system and the power system configuration’s optimization design. And it tries to propose a composite motor-integrated power system to effectively reduce electric vehicle energy consumption in practical applications.

3. Optimization of Electric Vehicle Energy Efficiency by Integrating Composite Motor and Improved Power System

This section investigates the configuration optimization design problem of a dual-motor single-planetary-row power system. Firstly, a new configuration was referenced, and the power source components and mechanical coupling mechanism were separated to obtain the basic configuration scheme. Secondly, an improved general matrix topology design method is proposed to generate feasible topologies. And the energy consumption economy and dynamic performance of the alternative configuration are optimized and simulated through the control strategy based on the dynamic programming algorithm. Finally, by comparing the comprehensive performance, the optimal configuration scheme of the dual-motor single-planetary-row power system is obtained.

3.1. Configuration Optimization Design of Integrated Composite Motor and Electric Vehicle Power Systems

The composition of electric vehicles includes electric drive and control systems, mechanical systems such as driving force transmission, and working devices to complete predetermined tasks. The electric drive and control system is the core of electric vehicles and the biggest difference from internal combustion engine vehicles. The electric drive and control system consists of a driving motor, a power supply, and a speed control device for the motor. Pure electric vehicles have many advantages over traditional fuel vehicles and hybrid vehicles, including zero fuel consumption, zero emissions, and high energy efficiency. Developing pure electric vehicles not only ensures energy security, but also contributes to the development of related industrial chains and becomes a new economic growth point. However, pure electric vehicles currently face problems such as high production costs, a short driving range, and a long charging time, making it difficult to achieve large-scale popularization. To break through these bottlenecks, in addition to relying on battery technology, it is also necessary to improve the powertrain design and vehicle control technology. Developing efficient and high-performance transmission systems and control strategies can improve energy utilization and recovery efficiency, improve vehicle operation efficiency, increase driving range, and reduce performance requirements for motors and batteries, reducing manufacturing and operating costs [20,21].
To improve the energy consumption economy of pure electric vehicle power train systems, a study was conducted to split the existing reference configurations and obtain the powertrain system’s basic configuration scheme. So, it can explore the maximum energy-saving potential of a dual-motor single-planetary exhaust powertrain system configuration. Figure 1 shows the basic configuration scheme framework and a simplified diagram.
Figure 1 shows OUT as the system output axis. The basic configuration scheme can install up to 12 clutches/brakes. Changing the position and arrangement of power components can form different driving modes. To eliminate redundant and infeasible topologies, this study proposes an improved universal matrix topology design method to systematically generate the possible topology structures and alternative configurations. This method uses a matrix to express the internal constraint relationship between power source components and mechanical nodes. According to the improved universal matrix topology design method, this system dynamic equation is composed of an inertia matrix, a torque constraint relationship matrix, a speed constraint relationship matrix, and D matrix. They are respectively represented by symbols J , T r , S r , and D , and together form basic matrix A . Equation (1) is the system dynamics equation for this method.
I m g 1 + I S 0 0 0 0 1 0 0 0 1 S 0 0 I m g 2 + I g 2 0 0 0 0 1 0 0 0 0 r g 2 0 0 I o u t + I C 0 0 0 0 1 0 0 S + R 0 0 0 0 I R 0 0 0 0 1 0 R 0 0 0 0 0 I g 1 0 0 0 0 1 0 r g 1 1 0 0 0 1 0 0 0 0 0 0 0 0 0 0 1 0 0 0 0 0 0 0 0 S 0 S + R R 0 0 0 0 0 0 0 0 0 r g 2 0 0 r g 1 0 0 0 0 0 0 0 ω m g 1 ω m g 2 ω o u t ω R ω g 1 T m g 1 T m g 2 T o u t T R T g 1 F P G F G = 0 0 0 0 0 0 0 0 0
In Formula (1), I g 1 is the inertia moment of gear 1. I g 2 is the inertia moment of gear 2. I R is the inertia moment of the ring gear. I S is the inertia moment of the sun wheel. I C is the inertia moment of the planet carrier. ω o u t is an output shaft speed. T o u t is an output shaft torque. r g 1 is the radius of gear 1. r g 2 is the radius of gear 2. F P G is the internal force of the planetary gear mechanism. F G is the internal force of the gear pair. Equation (2) calculates the steady-state torque of the planetary array, gear pair nodes, and power source components.
T r D T = 0 i = 1 3 n + 2 m j = 1 3 n + 2 m T r i , j T j , 1 + D i , 1 T 3 n + 2 m + 1 , 1 + D i , 2 T 3 n + 2 m + 2 , 1 = 0
Formula (3) stands for the driving mode dynamic equation.
H = A · B
A in Formula (3) can be calculated by using Formula (4).
A = J D 1 D 2 0
In Formula (4), D 1 can be calculated as follows:
D 1 = T r e l a t i o n D
In Formula (4), D 2 can be calculated as follows:
D 2 = S r e l a t i o n D T T
Then, Formula (7) can be obtained.
A = J T r e l a t i o n D S r e l a t i o n 0 0 D T 0 0
In Formula (7), T r e l a t i o n and S r e l a t i o n , respectively, represent the relationship matrix between torque and speed. T stands for a torque matrix. D stands for the basic matrix. J stands for the inertia moment matrix. B can be calculated by using Formula (8).
B = Ω T
Ω in Formula (8) stands for the angular acceleration matrix. An optimized universal matrix topology design method has been proposed to quickly determine, classify, and combine corresponding driving modes. By adjusting the arrangement order of non-zero elements in the torque relationship matrix and speed relationship matrix, the connection constraint relationship between nodes of the planetary train dynamic coupling transmission system was characterized. And the functional characteristics of the topological structure were judged and expressed. On this basis, a configuration mode configuration generation and configuration optimization strategy was studied and designed, and Figure 2 shows the entire process.
The driving mode is filtered and classified through specific matrix relationships to accurately determine the status of each node. If there is only one non-zero element in a row of the relationship matrix, the corresponding node is considered locked. Non-diagonal elements that meet specific conditions correspond to connected nodes. This method identifies and categorizes the possible driving modes. By combining the topology structure and driving mode, alternative configurations can be generated, including four modes: speed coupling, torque coupling, motor 1 drive, and motor 2 drive. Table 1 shows the topology of the generated alternative configurations.
In the configuration optimization phase, it is first necessary to establish system and component models. A battery internal resistance model is selected, and formulas are used to calculate battery power and current. At the same time, dynamic programming algorithms are used to evaluate the energy consumption and dynamic performance of the alternative configurations. The 0–120 km/h acceleration time is used as the evaluation indicator, assuming that the battery energy is sufficient and the motor power meets the demand. The acceleration time at this time is used as the cost function of the optimal control strategy. In energy consumption assessment, specific cost functions are used to describe battery energy consumption, mode switching penalty factors, etc. These two control strategies are optimized under state and control variable constraints. Through these methods, the most suitable configuration and driving mode can be designed.

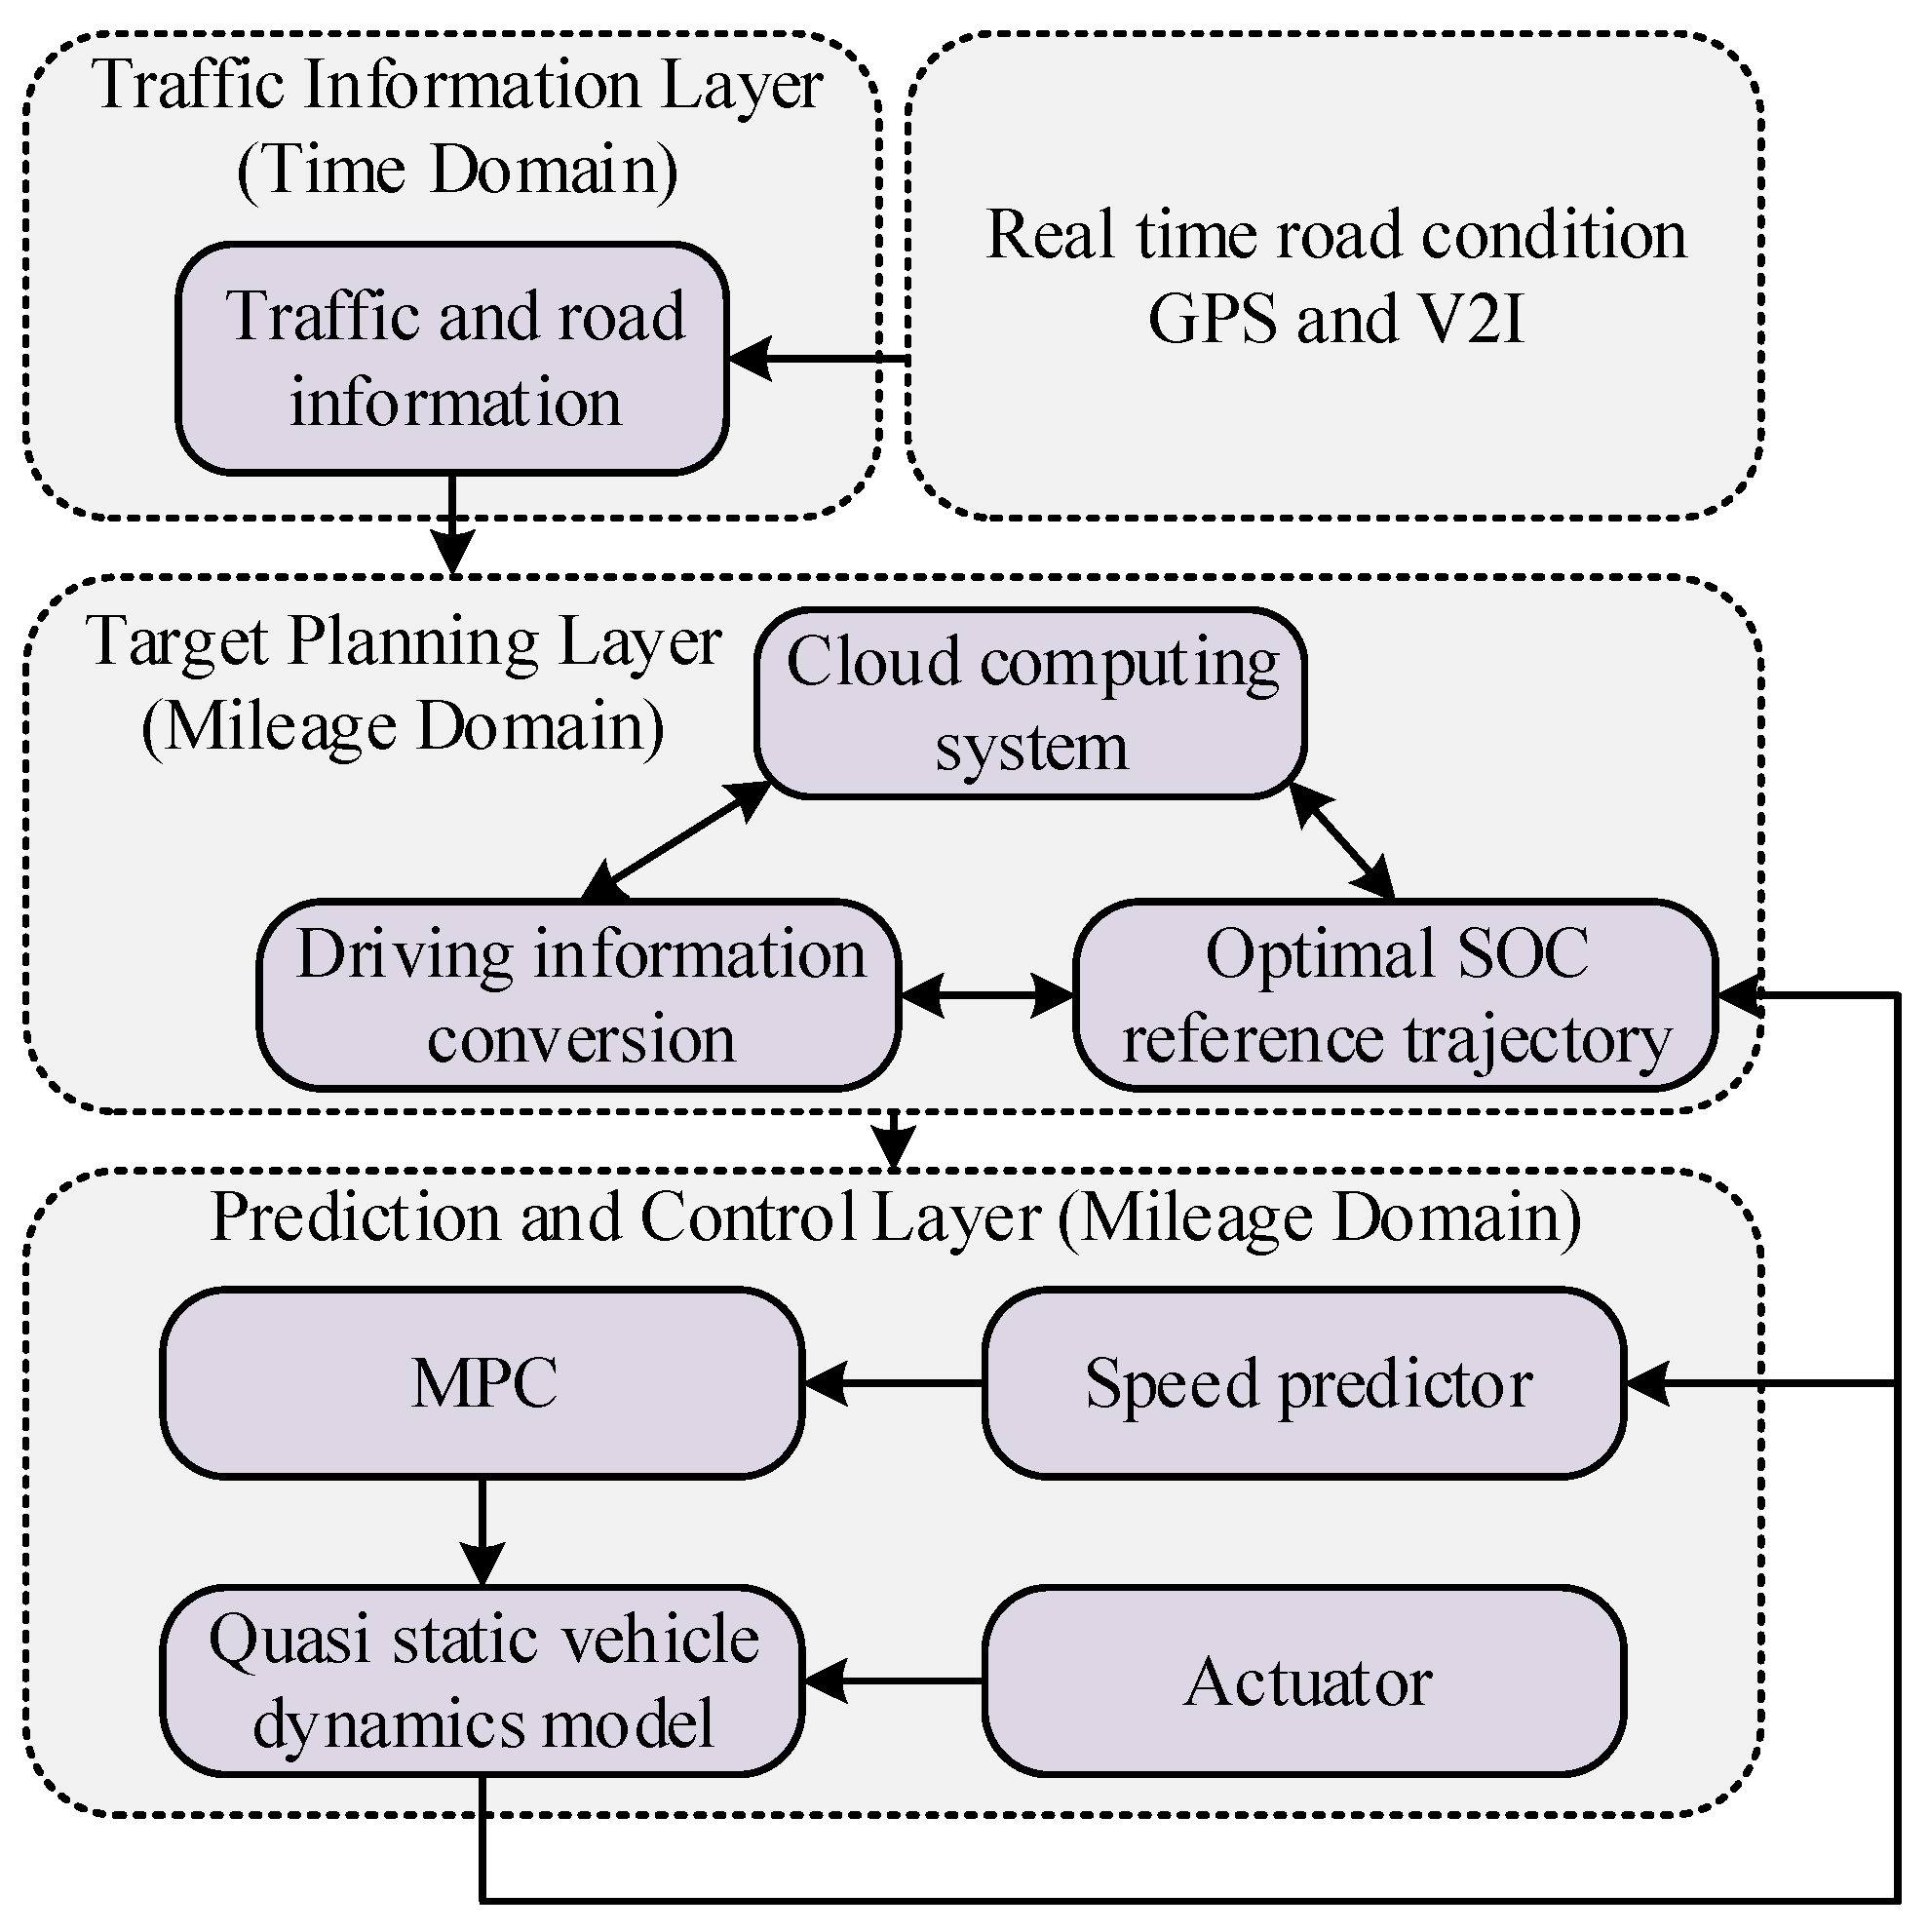
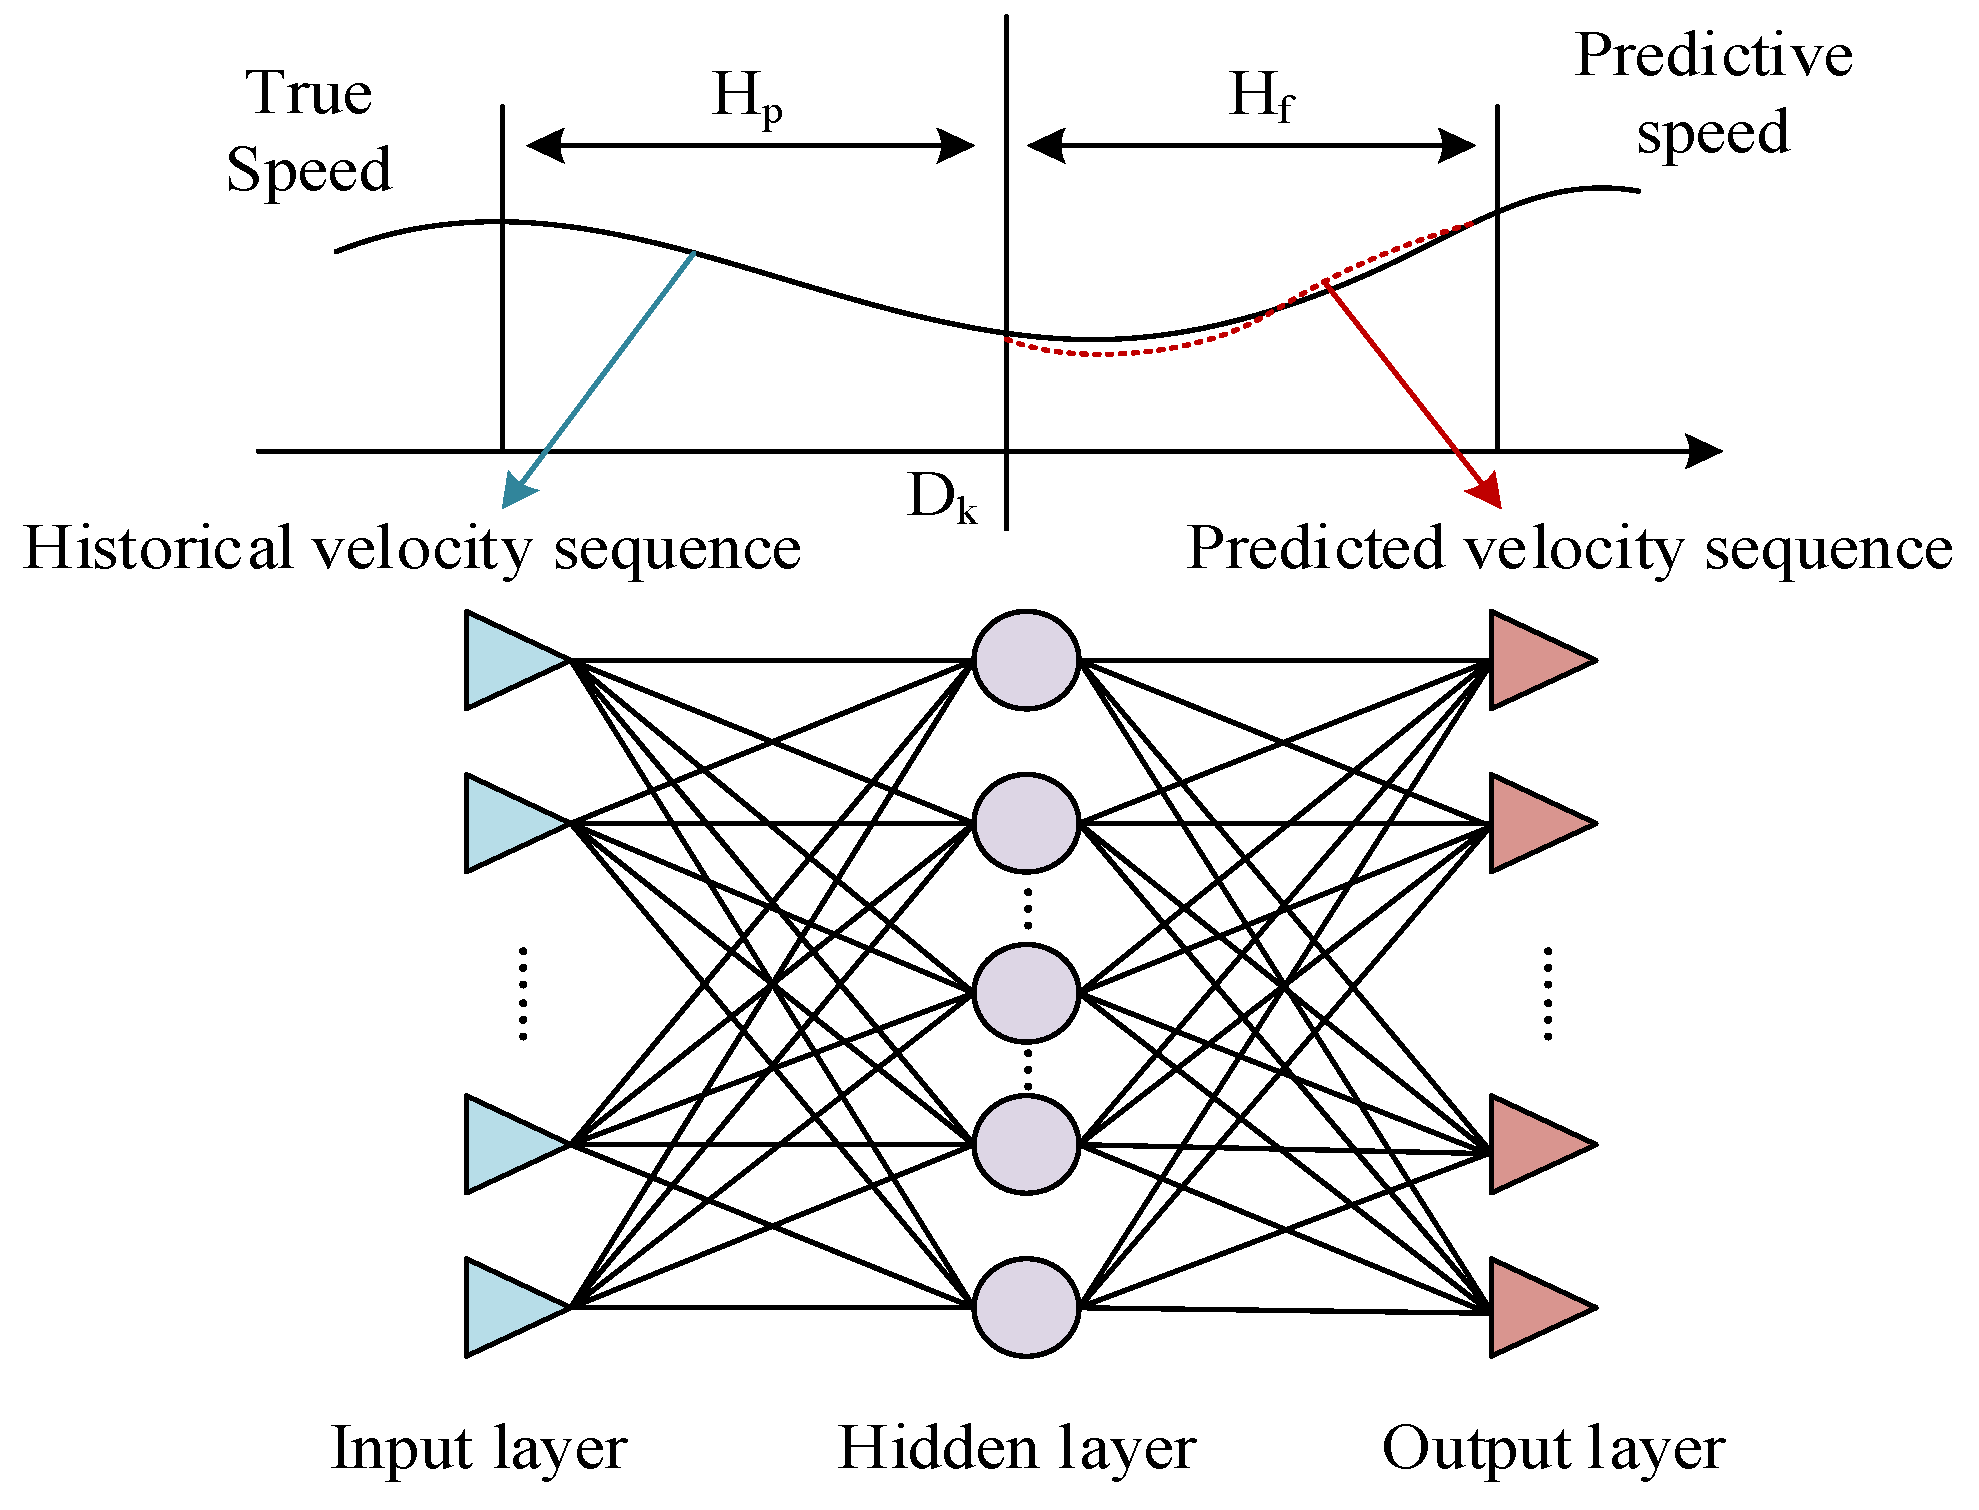
3.2. Improved Power System-Based Optimal Control Strategy for Energy Efficiency

Due to the popularity of pure electric vehicles and the rapid development of traffic information technology, research on optimal control strategies for the energy efficiency of pure electric vehicles has shifted from focusing on static information and offline optimization to real-time processing and online optimization of dynamic traffic information. This article proposes an energy consumption optimal control framework based on dynamic traffic information, including a traffic information layer, a goal planning layer, a speed predictor, and a model predictive control layer. Figure 3 shows this framework.
Firstly, the traffic information layer receives and updates traffic information in real-time. After collecting information, it needs to transmit the driving cycle and road slope information to the target planning layer. The main task of the goal planning layer is to synchronously update real-time available time domain information and transmit it to the next layer. The goal planning layer formulates the optimal reference trajectory for electricity consumption within the predetermined mileage range based on continuously updated traffic information. Thus, a relationship curve between energy consumption and the driving range of the entire vehicle can be obtained. To achieve this goal, it is necessary to convert traffic information. After the target planning layer receives the information data transmitted by the previous layer, this travel information conversion module calculates the car mileage within the predetermined time domain based on the obtained traffic information data and converts the time domain information into mileage domain information.
The entire vehicle sends the predetermined mileage range information to the cloud through communication devices and uses cloud computing to generate the optimal energy efficiency electricity reference trajectory. The cloud computing system used in the study includes vehicles sending travel information to the cloud, the main server configuring computing resources based on the amount of computation and demand time, and quickly calculating the reference trajectory of electricity that represents the best energy efficiency. Finally, the main server sends the processed information required by the user back to the vehicle terminal. The research assumes that the process of uploading traffic information to a cloud computing system for processing and transmitting the required information back to the vehicle terminal is instantaneous. Figure 4 shows the cloud computing communication system.
The speed predictor is a key speed and prediction layer component. This study uses GRNN with effective self-learning abilities to accurately predict driving speed. The efficient deep learning features of neural networks are beneficial for predicting speed [22]. Therefore, this study used GRNN to build a speed predictor, selecting nine typical driving conditions such as urban roads, suburban roads, and highways as the training set, and using real driving cycles on other roads as the test set. GRNN has various advantages, including no need for iterative training, the number of neurons being adaptively determined by the training set, the connection weights between network layers being determined and unique by the training set, and strong generalization ability. This characteristic makes GRNN very suitable for speed prediction. Through parameter adjustment and optimization algorithms, this speed predictor based on GRNN has good prediction performance, meeting the traffic information prediction requirements of comprehensive commuting vehicles in real road environments. Figure 5 shows the velocity layer framework.
Formula (9) is the model’s radial basis function.
C = P T
In Formula (9), P stands for an input matrix and T stands for an output matrix. Formula (10) is the threshold corresponding to hidden layer neurons.
b 1 = b 1 , 1 , b 1 , 2 , , b 1 , n T b 1 , 1 = b 1 , 2 = = b 1 , n = γ S S R B F
In Formula (10), γ stands for the empirical coefficient, and S S R B F stands for the expansion speed of the radial basis function. Formula (11) stands for the output of neuron output layer.
y i = p u r e l i n x i , i = 1 , 2 , n
In Formula (11), p u r e l i n · stands for a linear transfer function. x i in Formula (11) can be calculated as follows:
x i = W a i j = 1 Q a j i , i = 1 , 2 , , n
In Formula (12), W stands for a connection weight value, and a i stands for the hidden layer output of a neuron. S S R B F is the only adjustable parameter in GRNN that has a significant impact on prediction accuracy. In order to determine the optimal value of S S R B F , the range of S S R B F was set to [0.05, 0.05, 2], and a speed predictor based on GRNN was used to detect the test set. The results indicate that the predictor achieves the highest accuracy when S S R B F is around 1. Therefore, the study sets the value of S S R B F for the speed predictor to 1.
Finally, in the Model Predictive Control (MPC) layer, the whole vehicle’s actual running state of charge always follows the best energy consumption economy’s state of charge reference track by dynamically adjusting the control sequence. So, it can achieve the best energy consumption and economic driving within the mileage range. When entering each predicted mileage interval, the MPC controller generates corresponding control strategies according to the state of charge reference track, real-time traffic information, and road slope information at this current stage and adjusts vehicle running status online through MPC. Formula (13) is the state of charge reference trajectory control variable.
U = ω m g 1 , T m g 2 , M o d e T
In Formula (13), ω m g 1 stands for speed (motor 1), T m g 2 stands for torque (motor 2), and M o d e stands for a driving mode. Formula (14) is the state variable.
X = S O C , 0 , 0 T
At this point, Formula (15) is the optimal energy consumption economic control strategy’s cost function.
min J e l e U P X P = D + 1 D + D f l o w E b a t t _ k + β · Δ M o d e k
In Formula (15), β stands for penalty factor (mode switching). P stands for the variable’s feasible range, and E b a t t _ k stands for the power consumption during the k phase. In practical applications, the entire control framework is combined with the vehicle powertrain model. The optimal state of charge reference, the trajectory generated by the cloud computing system, the control strategy generated by the MPC method, and the speed curve predicted by the GRNN-based speed predictor were used as inputs. The controller adjusts control strategy in real-time to make the entire vehicle’s state of charge follow the state of charge reference trajectory as much as possible within each predetermined mileage interval.

4. Configuration Testing and Energy Consumption Simulation Analysis

This study conducted simulation tests on the energy consumption economy and power performance of alternative configurations and selected configuration options that met the screening criteria. In energy consumption simulation analysis, battery charging state percentage is first analyzed. Then the operational performance and energy consumption economy are analyzed by comparing the corresponding energy consumption of the actual operating state of charge and the reference state of charge.

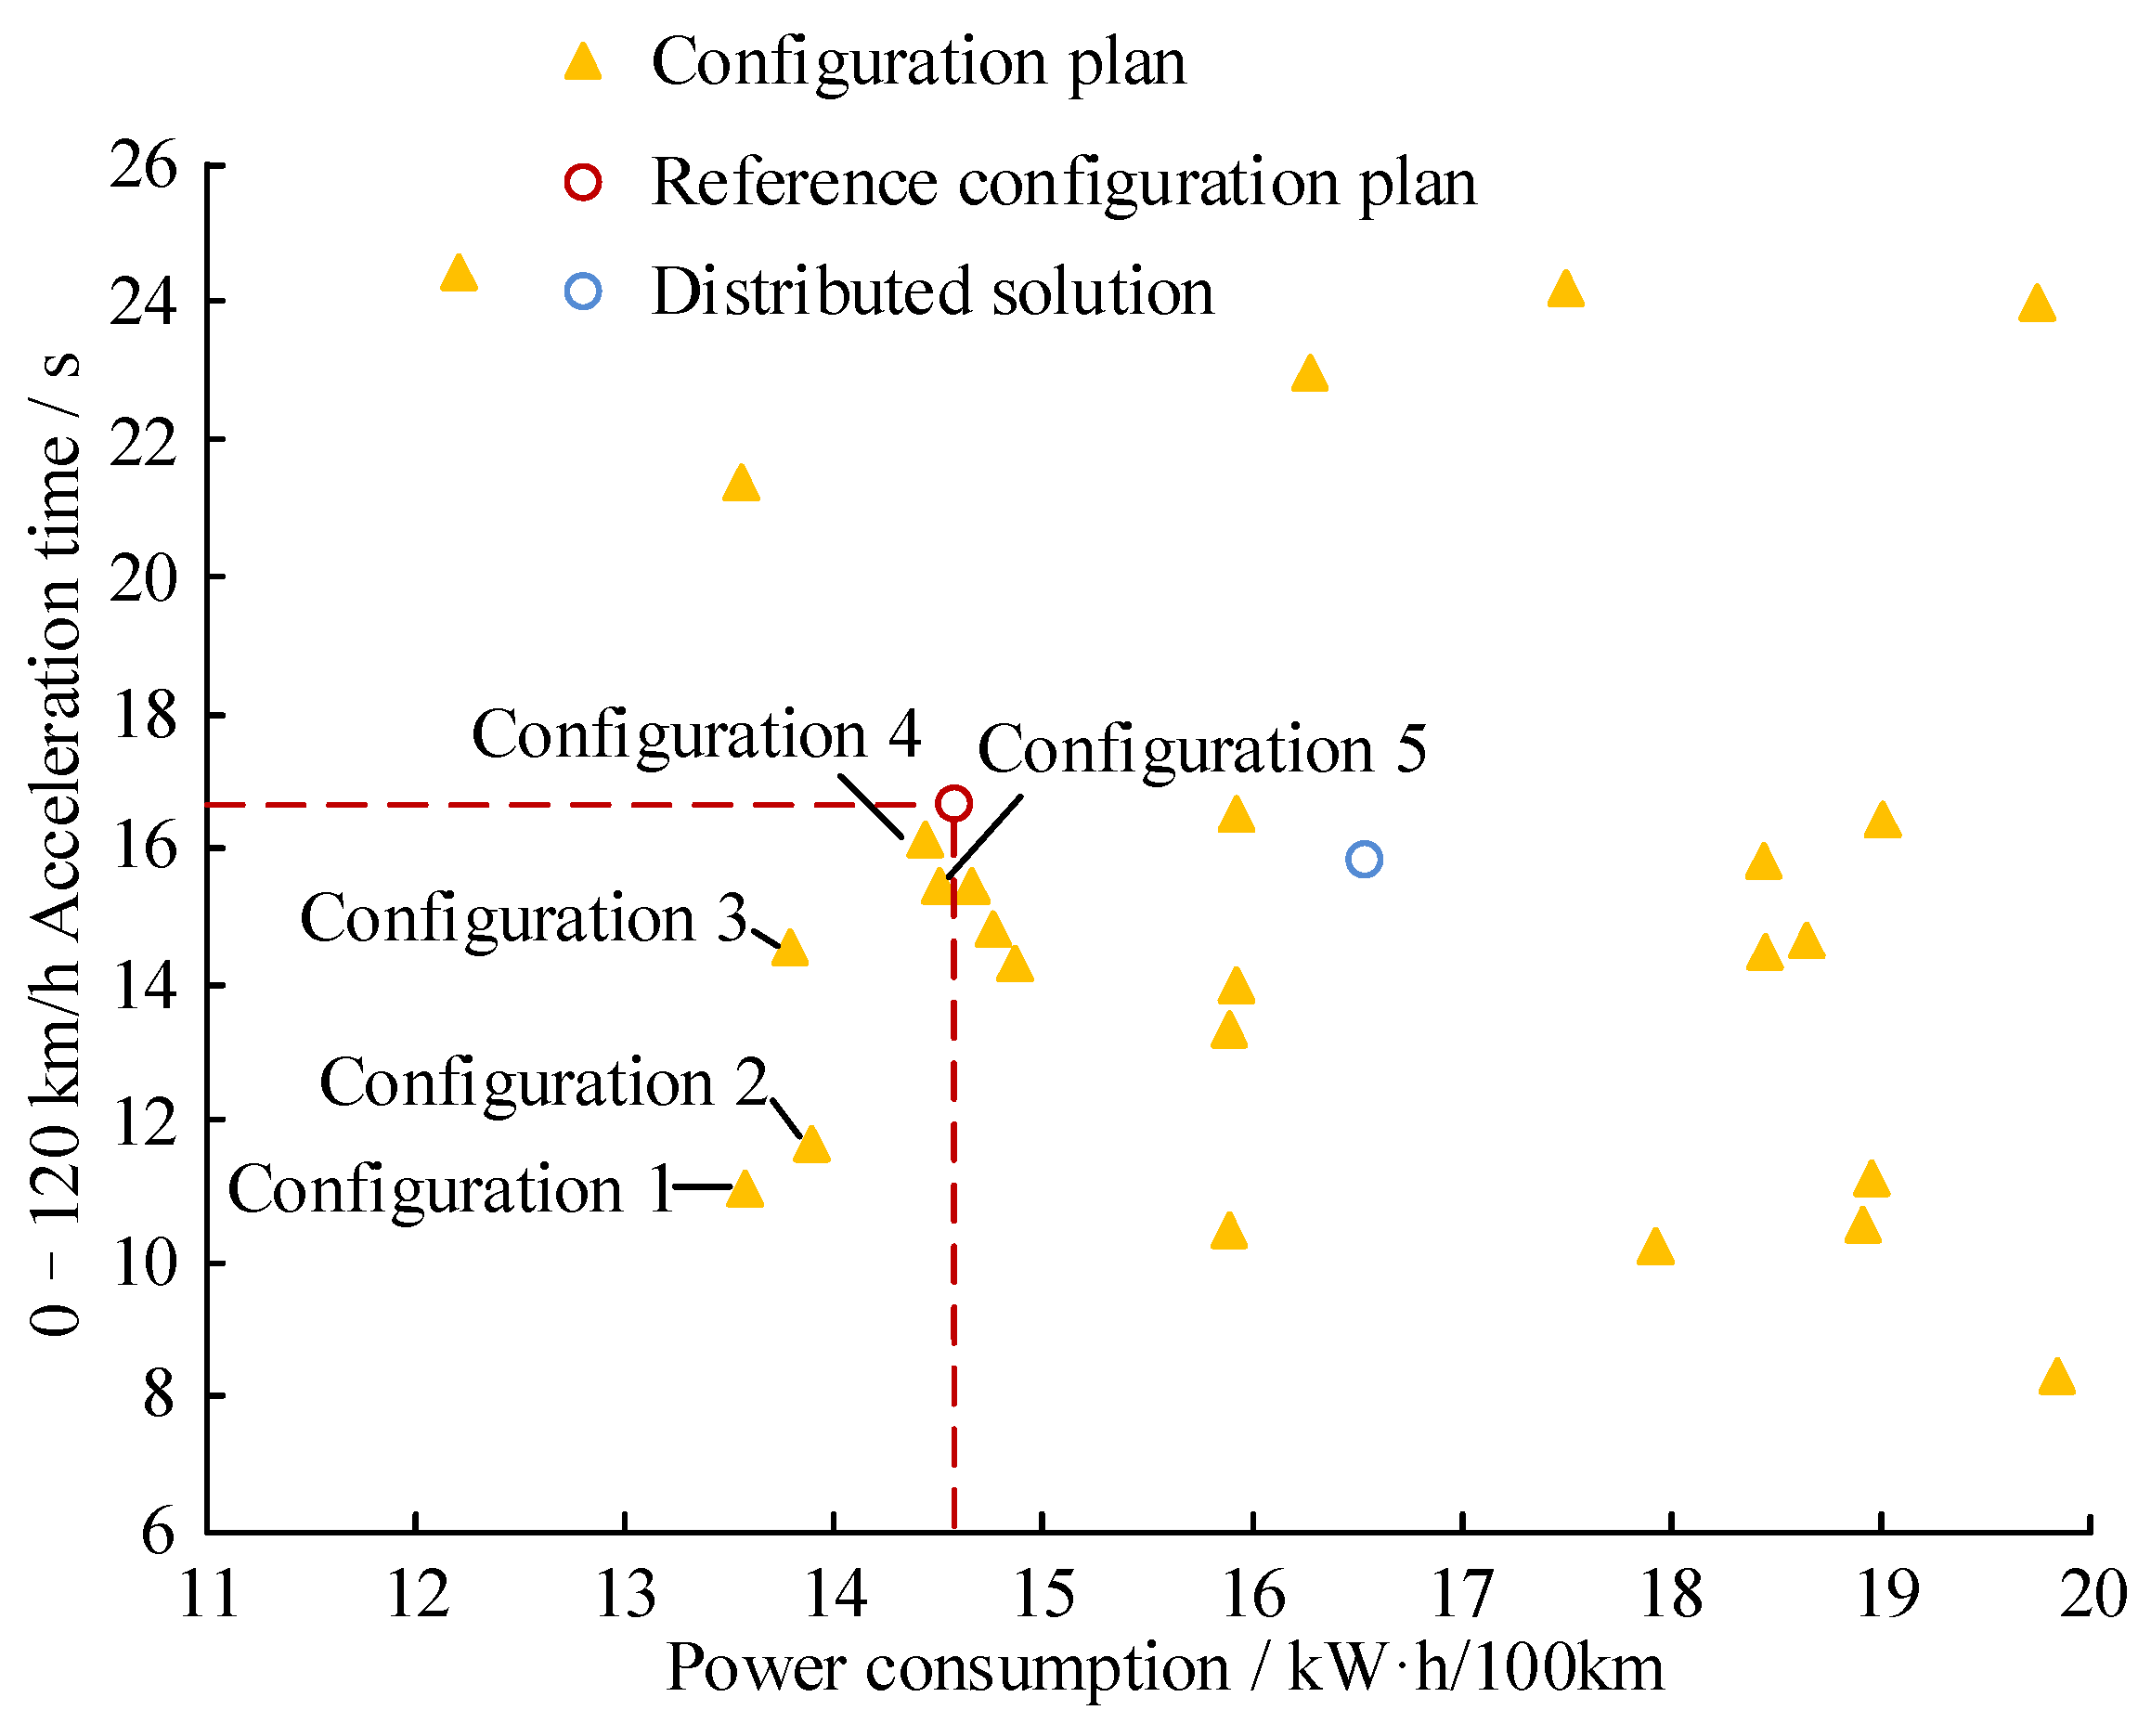
4.1. Configuration Optimization Testing

To test the energy consumption economy of alternative configurations, the Urban Dynamometer Driving Schedule (UDDS), Highway Fuel Economy Test (HWFET), New European Driving Cycle (NEDC), and Worldwide harmonized Light vehicles Test Cycle (WLTC) are selected as the comprehensive test conditions to cover different road driving environments. Figure 6 shows the test results.
In the study, 25 alternative solutions that meet the screening criteria were selected through simulation testing of energy efficiency and power performance for various alternative configurations. These schemes cover different energy types, configuration methods, and technological levels, reflecting the diversity of possible configuration schemes currently available. In the further selection process, we conducted a comprehensive performance evaluation of these 25 alternative configurations, including but not limited to their energy consumption, power, stability, reliability, and other dimensions of consideration. Through this comprehensive evaluation, it is possible to select configuration solutions with excellent overall performance. Then, a reference scheme was selected for in-depth research. This reference plan is selected based on an understanding of existing technology and market demand, as well as a prediction of future development trends. These 25 configurations that meet the screening criteria have been optimized with the goal of improving energy efficiency and economy as much as possible while ensuring performance. The optimization process includes multiple steps such as parameter adjustment, structural improvement, and control strategy optimization. Finally, five optimized configuration schemes were obtained, namely configurations 1–5. These five configuration schemes are superior to the reference scheme in terms of energy efficiency and power performance, indicating that our optimization work has achieved significant results. This process not only provides a system configuration selection and optimization method, but also provides optimized configuration solutions, providing a reference for practical applications.
In Figure 7, all five configurations are within the optimal block. In addition, a distributed drive system configuration was added as a performance comparison in Table 2.
According to Table 2, there are significant differences in economy, driving range, and acceleration performance among different configurations. In terms of economic indicators (kW·h/100 km), configuration 1 has the best economic performance, with a value of 13.6109, which has a significant advantage compared to the reference configuration of 14.5200, reducing energy consumption by approximately 6.3%. In addition, the economics of configuration 2 and configuration 3 are 13.8769 and 13.7968, respectively, which are relatively superior, but still slightly inferior to configuration 1. Relatively speaking, the economic performance of configuration 4, configuration 5, and distributed configuration is poor, with values of 14.4263, 14.5174, and 16.4998, respectively. Especially for distributed configurations, their power consumption is the highest, approximately 13.6% higher than the reference configuration. In terms of driving range, configuration 1 performs the best, reaching 510.601 km, which is about 6.7% higher than the reference configuration’s 478.601 km. The driving range of other configurations is 500.799 km (configuration 2), 503.801 km (configuration 3), 481.802 km (configuration 4), and 478.701 km (configuration 5), which is also improved compared to the reference configuration but lower than configuration 1. Especially for configuration 5 and distributed configurations, their driving range is only about 0.02% higher and 8.6% lower than the reference configuration. Configuration 1 still has advantages in terms of acceleration performance between 0–100 km/h and 0–120 km/h. Its 0–100 km/h acceleration time is 8.2167 s, which is about 31.4% faster than the reference configuration’s 11.9614 s. Similarly, in terms of acceleration performance from 0–120 km/h, the performance of configuration 1 is 10.9730 s, which is about 33.7% higher than the reference configuration’s 16.5649 s. It is worth noting that distributed configuration performs better than other non-configuration 1 schemes in this regard, with 10.9181 s and 15.9099 s, respectively. Although slightly inferior to configuration 1, it still has high acceleration performance.
Next, Table 3 displays the working status of optimization component 1. Before conducting an in-depth analysis, we need to understand the functionality of this component and its role in the entire system. This will help us better understand the impact of different configurations on their performance and how to improve overall performance by optimizing these configurations. At the same time, we also need to consider other factors that may affect performance, such as environmental conditions, usage, etc.
In Table 3, we can see the states of various parts of Component 1 under different working modes. In the coupling mode of speed and torque, both motor 1 and motor 2 remain running, but their collaborative working mode is different. This may be because the performance and efficiency of the two motors vary under different operating modes. The first clutch operates in speed and torque coupling mode, but does not operate in motor drive mode. This may be to improve the efficiency of the system by closing the first clutch and distributing all power to the motor when greater torque or speed is required. The second clutch only operates in speed-coupled mode, which may be because during high-speed operation, the performance of the second clutch is better and can transmit power better. The third clutch operates in torque coupling mode and motor 1 drive mode, which may improve system stability and reliability by activating the third clutch at low speeds and high torque. The brake operates in torque coupling mode and motor drive mode, but does not operate in speed coupling mode. This may be to quickly reduce the speed of the vehicle and ensure safety by turning off the brakes when emergency braking is required. Overall, this system aims to achieve optimal work efficiency and performance by adjusting the working status of various components under different working modes.

4.2. Energy Consumption Simulation Analysis

In energy consumption simulation analysis, this study first analyzes battery charging state percentage. Figure 8 shows the state of charge curve variation.
In Figure 8, the actual operating state of charge (SOC) value of each mileage sampling point is very close to the reference SOC value. During the entire driving process, the maximum SOC error was only 0.00159, while the average error was even lower, only 0.00040. When the car reaches the finish line, its actual operating SOC is 0.75547, while the reference SOC is 0.75631. Comparing the energy consumption corresponding to the actual operating SOC with the reference SOC, it was found that the difference between them is very small. The energy consumption corresponding to the actual operation of SOC is 14.7261 kWh, while the optimal energy consumption for the reference SOC trajectory is 14.6832 kWh, with a difference of only 0.3% between them. The energy consumption economy in actual driving is almost the same as the optimal energy consumption economy in theory. These data show that during actual driving, the energy management system of the car can effectively control and manage the SOC of the battery, making it as close as possible to the reference SOC, thereby achieving optimal energy consumption. This also indicates that the energy management system of a car has excellent performance in controlling and managing battery SOC, and can achieve theoretically optimal energy consumption economy during actual driving. Table 4 shows the computational performance.
In Table 4, the research method’s performance under the three routes is superior. In terms of computational performance, research and design methods have outstanding advantages and are more suitable for fast computation in practical applications compared to the other two algorithms. In terms of the terminal value of the battery remaining charge (SOC), the research method is higher than the other two methods, which means that during driving, the battery consumption of this method is less and the energy utilization rate is higher. In terms of energy economy, the energy consumption (in kW·h/100 km) of the research method is lower than that of the other two methods on all routes, which means it consumes less energy per unit distance. In terms of mileage, the research method has a higher mileage on each route than the other two methods, indicating its superiority in practical applications. In terms of computational time, the research method requires significantly lower computational time (0.13 s) than the other two methods, which gives it a significant advantage in practical applications that require fast computation. In terms of application categories, both research methods and rule-based methods can be applied offline/online, while DP methods can only be applied offline, making research methods and rule-based methods more flexible in their application scope. The calculation time for predicting the mileage interval is 0.13 s. Another noteworthy detail is that both the research method and the rule-based method are applied offline/online, while the DP method is only offline.

5. Conclusions

The multi-power source fusion composite transmission system uses mechanical coupling mechanisms such as planetary gear mechanisms and gear pairs, as well as the introduction of actuators, to change the connection mode of power source components, achieve multiple driving modes, and improve the operational efficiency of the system under complex driving conditions. Therefore, finding high-performance configurations from a vast array of configuration solutions is a challenging task. The advantages of the multi-power fusion composite transmission system proposed in this study lie in its mechanical coupling mechanism and the introduction of actuators, which enable the system to change the connection mode of power components under complex driving conditions, achieve multiple driving modes, and improve the operational efficiency of the system. In addition, by using an improved universal matrix topology design method, we can generate feasible topology structures and optimize the energy consumption, economy, and power performance of alternative configurations through control strategies based on dynamic programming algorithms. This method has superior computational performance and is suitable for fast calculations in practical applications. In terms of progress, we have found high-performance configurations from a large number of configuration solutions, and through structural optimization testing, we have determined that configuration 1 has the best economic performance. Its energy consumption decreased by about 6.3%, the range increased by about 6.7%, and the acceleration time from 0–100 km/h is about 31.4% faster than the reference configuration. In terms of contribution, this study provides a joint optimization scheme and design idea for the configuration control strategy of the dual-motor coupled transmission system of pure electric vehicles, provides a theoretical and practical basis for the improvement and optimization of the multi-power fusion composite motor system, and further promotes the development of the multi-power fusion composite motor transmission system of electric vehicles.
However, this study also has some limitations. Firstly, the effectiveness of current control strategies in practice still needs to be improved. Secondly, although our model has high theoretical superiority, it may be affected by specific situations in practical application scenarios, which requires us to further optimize and improve our model in future research to make it practical and applicable. In addition, although our research has made some progress in improving and optimizing the multi-power fusion composite motor system, there are still some unresolved issues, such as how to further improve the energy efficiency of the system and how to achieve the optimal control strategy in practical operation. We hope to address these issues in future research.

Funding

This research received no external funding.

Data Availability Statement

All data generated or analysed during this study are included in this published article.

Conflicts of Interest

The author declares no conflict of interest.

References

  1. Wang, T.; Luo, H.; Zeng, X.; Yu, Z.; Liu, A.; Sangaiah, A. Mobility based trust evaluation for heterogeneous electric vehicles network in smart cities. IEEE Trans. Intell. Transp. Syst. 2020, 22, 1797–1806. [Google Scholar] [CrossRef]
  2. Gryparis, E.; Papadopoulos, P.; Leligou, H.C.; Psomopoulos, C.S. Electricity demand and carbon emission in power generation under high penetration of electric vehicles. A European Union perspective. Energy Rep. 2020, 6, 475–486. [Google Scholar] [CrossRef]
  3. Yang, C.; Zha, M.; Wang, W.; Liu, K.; Xiang, C. Efficient energy management strategy for hybrid electric vehicles/plug-in hybrid electric vehicles: Review and recent advances under intelligent transportation system. IET Intell. Transp. Syst. 2020, 14, 702–711. [Google Scholar] [CrossRef]
  4. Wu, J.; Zhang, N.; Tan, D.; Chang, J.; Shi, W. A robust online energy management strategy for fuel cell/battery hybrid electric vehicles. Int. J. Hydrogen Energy 2020, 45, 14093–14107. [Google Scholar] [CrossRef]
  5. Patil, H.; Kalkhambkar, V.N. Grid integration of electric vehicles for economic benefits: A review. J. Mod. Power Syst. Clean Energy 2020, 9, 13–26. [Google Scholar] [CrossRef]
  6. Li, Y.; Han, M.; Yang, Z.; Li, G. Coordinating flexible demand response and renewable uncertainties for scheduling of community integrated energy systems with an electric vehicle charging station: A bi-level approach. IEEE Trans. Sustain. Energy 2021, 12, 2321–2331. [Google Scholar] [CrossRef]
  7. Sanguesa, J.A.; Torres-Sanz, V.; Garrido, P.; Martinez, F.J.; Marquez-Barja, J.M. A review on electric vehicles: Technologies and challenges. Smart Cities 2021, 4, 372–404. [Google Scholar] [CrossRef]
  8. Alimujiang, A.; Jiang, P. Synergy and co-benefits of reducing CO2 and air pollutant emissions by promoting electric vehicles—A case of Shanghai. Energy Sustain. Dev. 2020, 55, 181–189. [Google Scholar] [CrossRef]
  9. Cunanan, C.; Tran, M.K.; Lee, Y.; Kwok, S.; Leung, V.; Fowler, M. A review of heavy-duty vehicle powertrain technologies: Diesel engine vehicles, battery electric vehicles, and hydrogen fuel cell electric vehicles. Clean Technol. 2021, 3, 474–489. [Google Scholar] [CrossRef]
  10. Zhao, X.; Ye, Y.; Ma, J.; Shi, P.; Chen, H. Construction of electric vehicle driving cycle for studying electric vehicle energy consumption and equivalent emissions. Environ. Sci. Pollut. Res. 2020, 27, 37395–37409. [Google Scholar] [CrossRef]
  11. Modi, S.; Bhattacharya, J.; Basak, P. Estimation of energy consumption of electric vehicles using deep convolutional neural network to reduce driver’s range anxiety. ISA Trans. 2020, 98, 454–470. [Google Scholar] [CrossRef] [PubMed]
  12. Alateef, S.; Thomas, N. Energy consumption estimation for electric vehicles using routing API data. In European Workshop on Performance Engineering; Springer International Publishing: Cham, Switzerland, 2022; pp. 37–53. [Google Scholar]
  13. Albatayneh, A.; Assaf, M.N.; Alterman, D.; Jaradat, M. Comparison of the overall energy efficiency for internal combustion engine vehicles and electric vehicles. Rigas Teh. Univ. Zinat. Raksti 2020, 24, 669–680. [Google Scholar] [CrossRef]
  14. Basso, R.; Kulcsár, B.; Sanchez-Diaz, I. Electric vehicle routing problem with machine learning for energy prediction. Transp. Res. Part B Methodol. 2021, 145, 24–55. [Google Scholar] [CrossRef]
  15. Muduli, U.R.; Beig, A.R.; Al Jaafari, K.; Alsawal, J.Y.; Behera, B.K. Interrupt-free operation of dual-motor four-wheel drive electric vehicle under inverter failure. IEEE Trans. Transp. Electrif. 2020, 7, 329–338. [Google Scholar] [CrossRef]
  16. Tu, Z.; Fei, F.; Deng, X. Untethered flight of an at-scale dual-motor hummingbird robot with bio-inspired decoupled wings. IEEE Robot. Autom. Lett. 2020, 5, 4194–4201. [Google Scholar] [CrossRef]
  17. Jafari, M.; Korpås, M.; Botterud, A. Power system decarbonization: Impacts of energy storage duration and interannual renewables variability. Renew. Energy 2020, 156, 1171–1185. [Google Scholar] [CrossRef]
  18. Mohammad-Alikhani, A.; Mahmoudi, A.; Khezri, R.; Kahourzade, S. Multiobjective optimization of system configuration and component capacity in an AC minigrid hybrid power system. IEEE Trans. Ind. Appl. 2022, 58, 4158–4170. [Google Scholar] [CrossRef]
  19. Sun, G.J.; Yun, J.H.; Cheon, M.W. Parallel Switch Configuration for High Voltage DC switching to secure PV power system safety. Trans. Electr. Electron. Mater. 2021, 22, 108–113. [Google Scholar] [CrossRef]
  20. Vishnuram, P.; P., S.; R., N.; K., V.; Nastasi, B. Wireless Chargers for Electric Vehicle: A Systematic Review on Converter Topologies, Environmental Assessment, and Review Policy. Energies 2023, 16, 1731. [Google Scholar] [CrossRef]
  21. Deepak, K.; Frikha, M.A.; Benômar, Y.; El Baghdadi, M.; Hegazy, O. In-Wheel Motor Drive Systems for Electric Vehicles: State of the Art, Challenges, and Future Trends. Energies 2023, 16, 3121. [Google Scholar] [CrossRef]
  22. Wang, X.; Cheng, M.; Eaton, J.; Hsieh, C.J.; Wu, S.F. Fake node attacks on graph convolutional networks. J. Comput. Cogn. Eng. 2022, 1, 165–173. [Google Scholar] [CrossRef]
Figure 1. Basic configuration plan.
Wevj 14 00257 g001
Figure 2. Configuration generation process.
Wevj 14 00257 g002
Figure 3. Energy efficiency optimal control framework.
Wevj 14 00257 g003
Figure 4. Cloud computing communication system.
Wevj 14 00257 g004
Figure 5. Speed predictor framework.
Wevj 14 00257 g005
Figure 6. Comprehensive testing conditions.
Wevj 14 00257 g006
Figure 7. Performance simulation test results.
Wevj 14 00257 g007
Figure 8. Changes instate of charge curve.
Wevj 14 00257 g008
Table 1. Topological structure of alternative configurations.
Mode TypeClassification Criteria
Speed coupling mode x 1 , 1 2 + x 1 , 2 2 0 , x 2 , 1 2 + x 2 , 2 2 0 y 1 , 1 · y 1 , 2 0 , y 2 , 1 · y 2 , 2 0
Torque coupling mode x 1 , 1 · x 1 , 2 0 , x 2 , 1 · x 2 , 2 0 y 1 , 1 2 + y 1 , 2 2 0 , y 2 , 1 2 + y 2 , 2 2 0
Motor 1 drive mode T m g 2 = 0 , ω m g 2 = 0 , x 1 , 1 = 1 / x 2 , 1 0 , x 1 , 2 = x 2 , 2 = 0 y 1 , 1 = 1 / y 2 , 1 0 , y 1 , 2 = y 2 , 2 = 0
Motor 2 drive mode T m g 1 = 0 , ω m g 1 = 0 , x 2 , 1 = 0 , x 2 , 2 = x 1 , 2 / x 1 , 1 0 y 2 , 1 = 0 , y 2 , 2 = y 1 , 2 / y 1 , 1 0
Table 2. Configuration performance.
ConfigurationEconomy (kW·h/100 km)Driving Range (km)0–100 km/h Acceleration Performance (s)0–120 km/h Acceleration Performance (s)
113.6109510.6018.216710.973
213.8769500.7998.87211.7245
313.7968503.8019.988114.4306
414.4263481.80211.267115.9831
514.5174478.70110.842515.3319
Distributed Configuration14.5201478.60311.961416.5649
Reference configuration16.4998421.19710.918115.9099
Table 3. Optimize the working status of component 1.
ComponentSpeed Coupling ModeTorque Coupling ModeMotor 1 Drive ModeMotor 2 Drive Mode
Motor 1AAAB
Motor 2AABA
First clutchAABA
Second clutchABBB
Third clutchBAAB
BrakesBAAA
Table 4. Operational performance.
Control StrategyDP MethodRule-Based ApproachResearch Design Methods
Route 1SOCInitial0.90.90.9
Terminal0.75540.74120.7546
Power consumptionEnergy Economy (kW·h/100 km)14.684315.318514.7271
Range (km)474458471
Mileage difference ratio (%)99.7995.8799.86
Route 2SOCInitial0.90.90.9
Terminal0.75370.73680.7514
Power consumptionEnergy Economy (kW·h/100 km)14.698315.362314.7473
Range (km)474454473
Mileage difference ratio (%)99.6195.5899.72
Route 3SOCInitial0.90.90.9
Terminal0.83410.82170.8324
Power consumptionEnergy Economy (kW·h/100 km)13.402414.156213.4472
Range (km)518492515
Mileage difference ratio (%)99.5394.7399.59
Operational performanceCalculation time for predicting mileage intervals (s)2.680.320.13
Applicative categoriesOfflineOffline/OnlineOffline/Online
Disclaimer/Publisher’s Note: The statements, opinions and data contained in all publications are solely those of the individual author(s) and contributor(s) and not of MDPI and/or the editor(s). MDPI and/or the editor(s) disclaim responsibility for any injury to people or property resulting from any ideas, methods, instructions or products referred to in the content.

