Abstract
Ensuring efficiency and safety is critical when developing charging strategies for lithium-ion batteries. This paper introduces a novel method to optimize fast charging for cylindrical Li-ion NMC 3Ah cells, enhancing both their charging efficiency and thermal safety. Using Model Predictive Control (MPC), this study presents a cost function that estimates the thermal safety boundary of Li-ion batteries, emphasizing the relationship between the temperature gradient and the state of charge (SoC) at different temperatures. The charging control framework combines an equivalent circuit model (ECM) with minimal electro-thermal equations to estimate battery state and temperature. Optimization results indicate that at ambient temperatures, the optimal charging allows the cell’s temperature to self-regulate within a safe operating range, requiring only one additional minute to reach 80% SoC compared to a typical fast-charging protocol (high current profile). Validation through numerical simulations and real experimental data from an NMC 3Ah cylindrical cell demonstrates that the simple approach adheres to the battery’s electrical and thermal limitations during the charging process.
1. Introduction
Lithium-ion batteries (LiBs) have become a cornerstone of modern technology, and are utilized in devices such as laptops, smartphones, and automobiles [1]. A significant challenge in the battery industry is achieving rapid charging while ensuring safety and minimizing degradation. Lengthy charging times are a major barrier to the widespread adoption of electric vehicles (EVs) [2], highlighting the need for fast charging stations [3]. These stations are essential for providing quick and reliable charging, thereby maximizing battery efficiency. However, charging at high c-rates involves a delicate balance, introducing trade-offs with battery thermal gradients and lifespan [4]. High c-rates accelerate ageing due to increased temperatures, faster growth of the solid–electrolyte interface (SEI) layer, elevated lithium plating, and greater mechanical stresses [5,6,7].
These adverse effects are aggravated when fast charging in extreme temperatures. For instance, at low temperatures, the internal resistance of the battery increases [8], leading to significant power loss [9,10]. Typically, a preconditioning thermal management strategy is integrated into the battery system to enable fast charging [11,12].
Various optimal control algorithms have been proposed to mitigate the negative effects of fast charging. These algorithms address real-time optimal charging problems using methods such as dynamic programming (DP) [13], Pontryagin’s minimum principle (PMP) [14], and Model Predictive Control (MPC) strategies [15,16,17]. However, there is a relative scarcity of studies validating optimal fast-charging control with real-life batteries.
This paper introduces an MPC-based fast-charging controller developed with a straightforward yet high-fidelity electro-thermal model. The numerical solution accurately represents the cell’s electrical and thermal characteristics using minimal equations while incorporating environmental temperature influence. The model underwent validation through fast-charging experiments conducted on an NMC 3Ah cylindrical cell and was subsequently utilized for optimization purposes for comparison.
The structure of this paper is as follows: Section 2 details the experimental setup used for the fast-charging test, while Section 3 outlines the fast-charging results. Section 4 covers the development of the electro-thermal and MPC models. Section 5 presents the optimization results. Finally, the conclusions are provided in Section 6.
2. Experimental Setup
2.1. Battery Feature
The tested batteries were cylindrical VTC6 3Ah 18650-type LiBs (Sony, Beijing, China) with the Li(NiMnCo)1/3O2 cathode and graphite as anode, and the average mass was measured to be 46.6 g. The nominal capacity and voltage of the battery were 3 Ah and 3.7 V, respectively. Moreover, the c-rate noted C in this paper is defined as 1C = 3 A.
The Neware CT-4008 (Neware, Shenzhen, China) (25 mV to 5 V—0.5 mA to 6 A) controlled by the computer was used to cycle the LiBs with the standard charging and discharging current of A, according to the battery specification [18]. A type-K thermocouple was attached to the cell and used to monitor the battery temperature. Figure 1 depicts the fast-charging experimental setup.
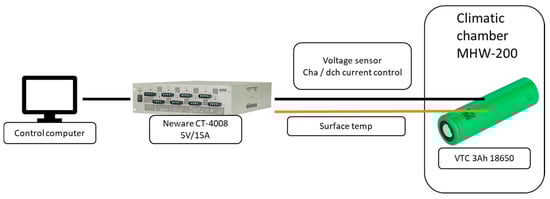
Figure 1.
Schematic of the experimental setup used for testing the VTC6 NMC/G 3Ah.
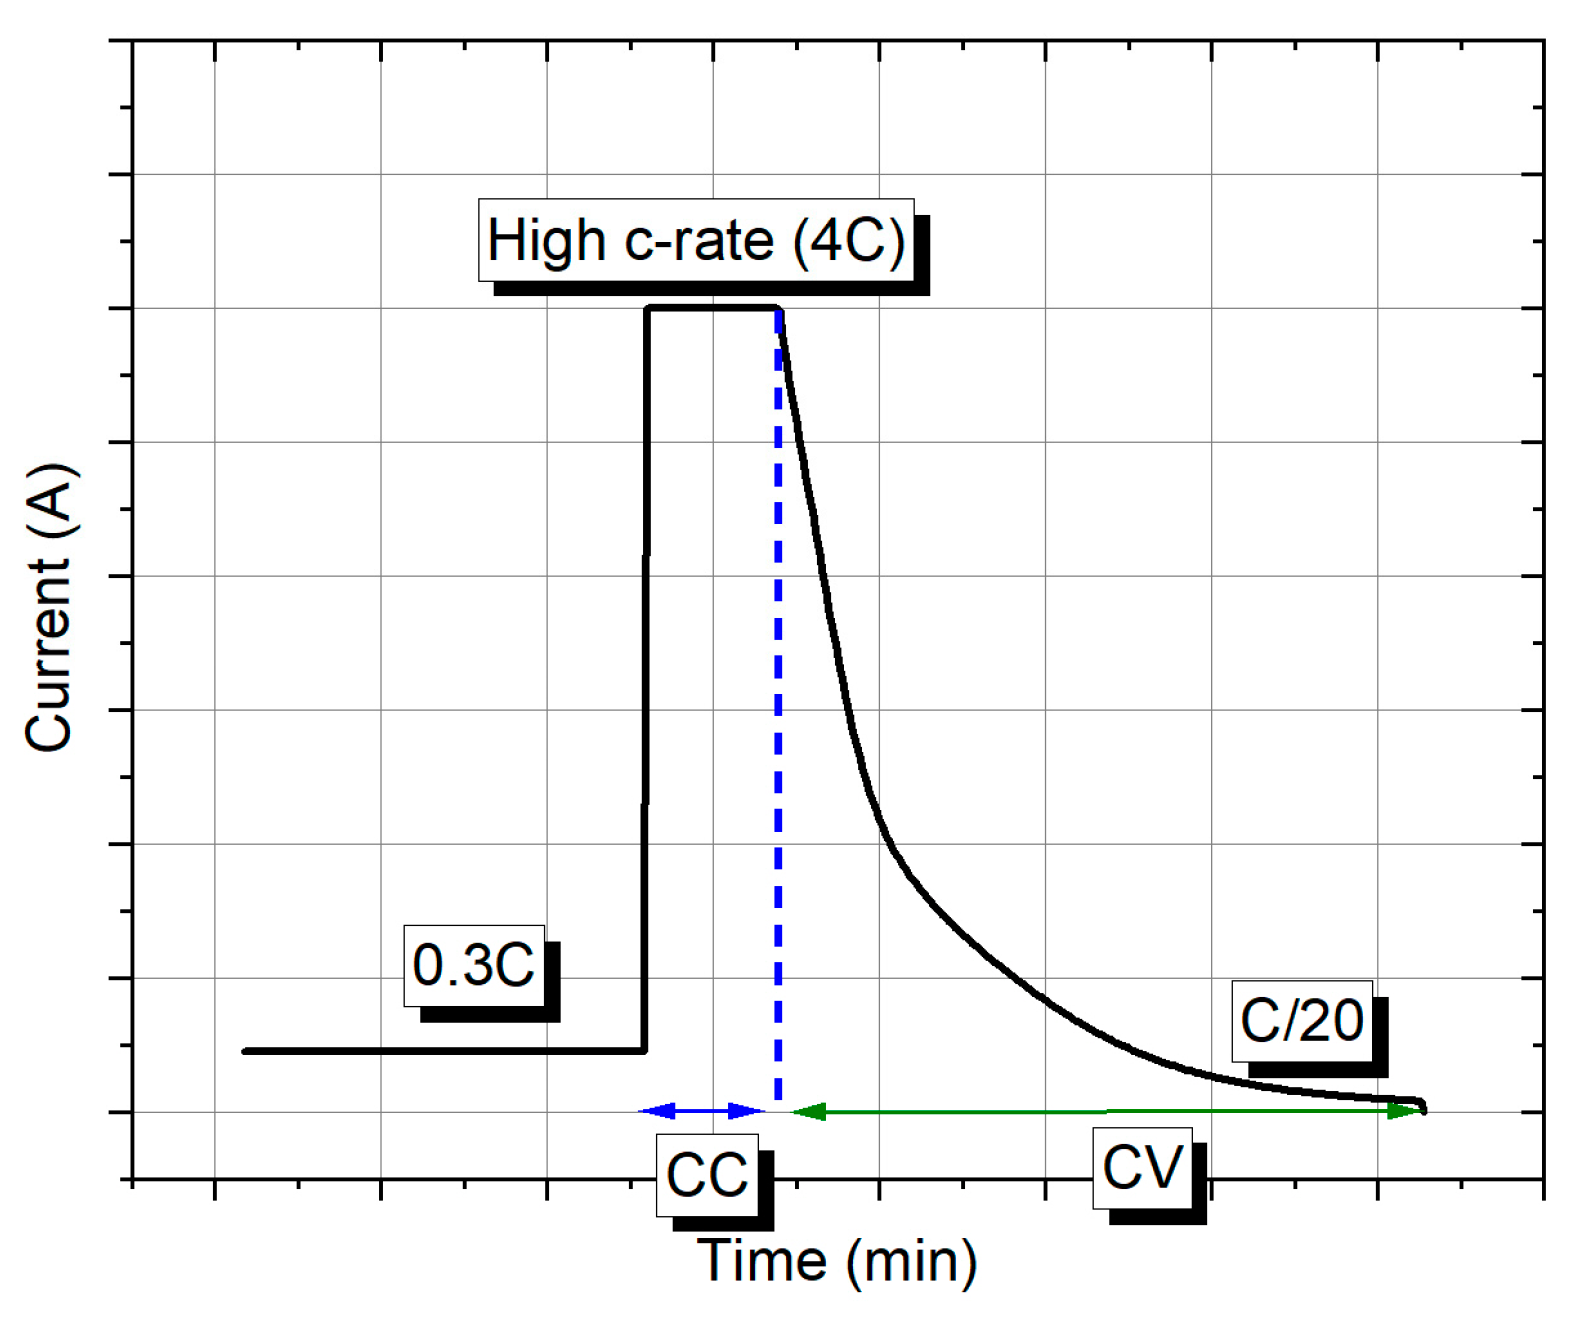
2.2. Fast-Charging Profile
The fast-charging profile involves a high charging current of 4C (12 A) until the battery voltage reaches 4.2 V, which is the maximum recommended upper voltage limit [18]. This is followed by a constant voltage (CV) phase, which continues until the cut-off current reaches C/20 (0.15 A). The fast-charging mission profile is designed to emulate a real-world fast-charging scenario using high currents [19,20,21]. The testing procedure includes the following stages to provide a more comprehensive overview:
- Charging at C/3 from 0% to 10% state of charge (SoC).
- Charging at 4C from 10% SoC up to the upper cut-off voltage of 4.2 V.
- Maintaining a CV phase until the charge rate reaches C/20.
Figure 2 depicts the fast-charging profile.
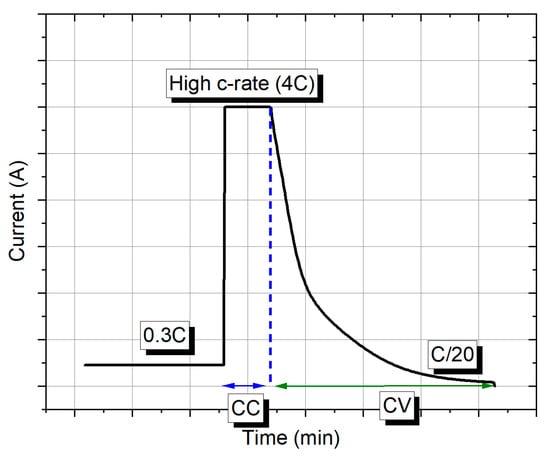
Figure 2.
Fast-charging profile.
3. Fast-Charging Results
3.1. Ambient Temperature Testing
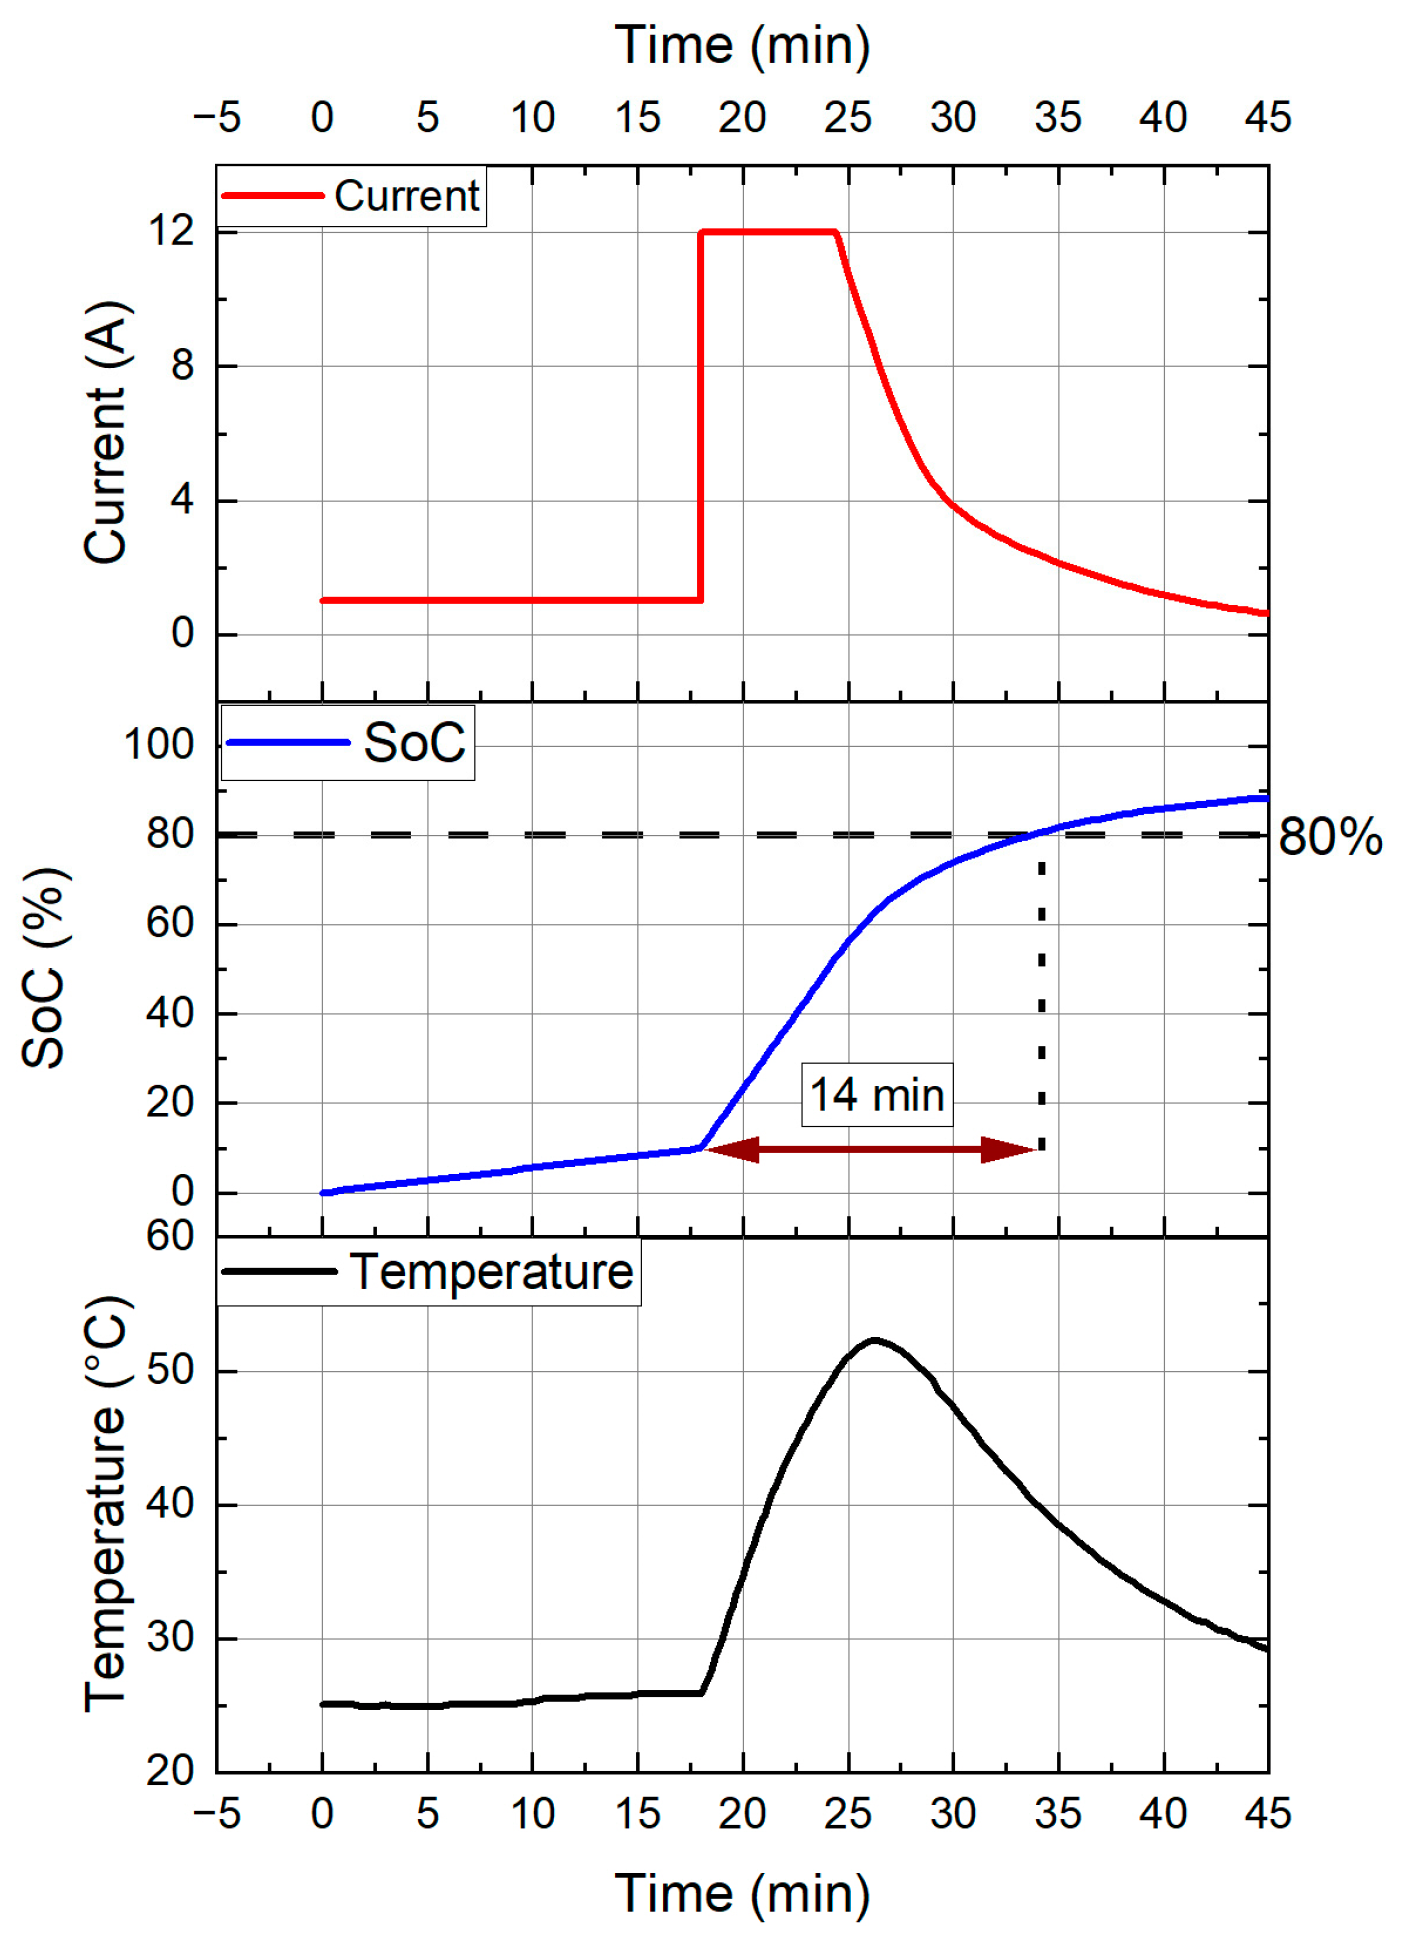
Figure 3 presents the fast-charging profile of a 3 Ah NMC cell at 25 °C, showing the current, SoC, and temperature over time. Initially, with a low current rate of C/3 (1 A), the SoC gradually reaches 10% in 18 min. When the current rate transitions to 4C (12 A), rapid charging occurs, and the SoC quickly rises to 80% in under 15 min. These results align with current commercial targets and highlight the impressive performance of these cells.
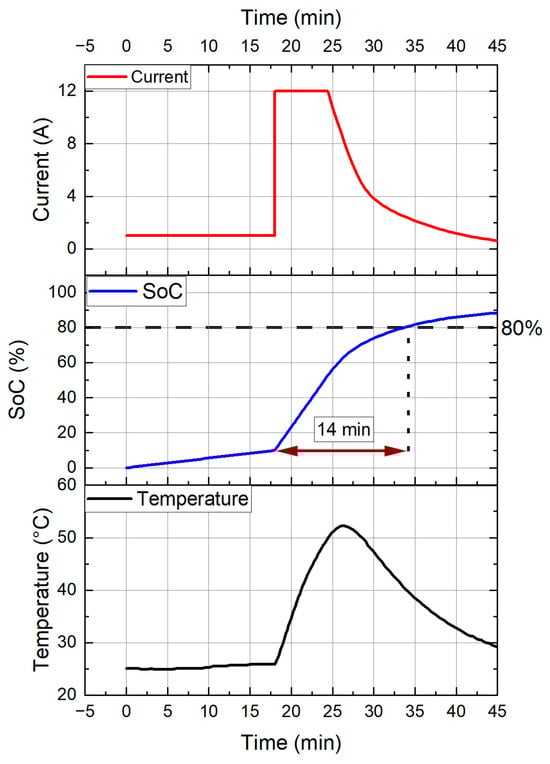
Figure 3.
Fast-charging results of the NMC VTC6 3Ah cell.
Regarding temperature, the cell remains relatively stable during the 0% to 10% SoC range due to the low current rate. However, when the 4C (12 A) phase starts, the temperature increases to 54 °C. This temperature rise raises important concerns at the battery pack level, emphasizing the need for precise charging strategies to mitigate overheating risks and ensure the battery pack’s safety and long-term operational integrity.
Ultimately, achieving safe fast charging for these cells requires balancing the desired SoC levels with effective temperature management strategies to avoid thermal runaway.
3.2. Extreme Temperature Testing
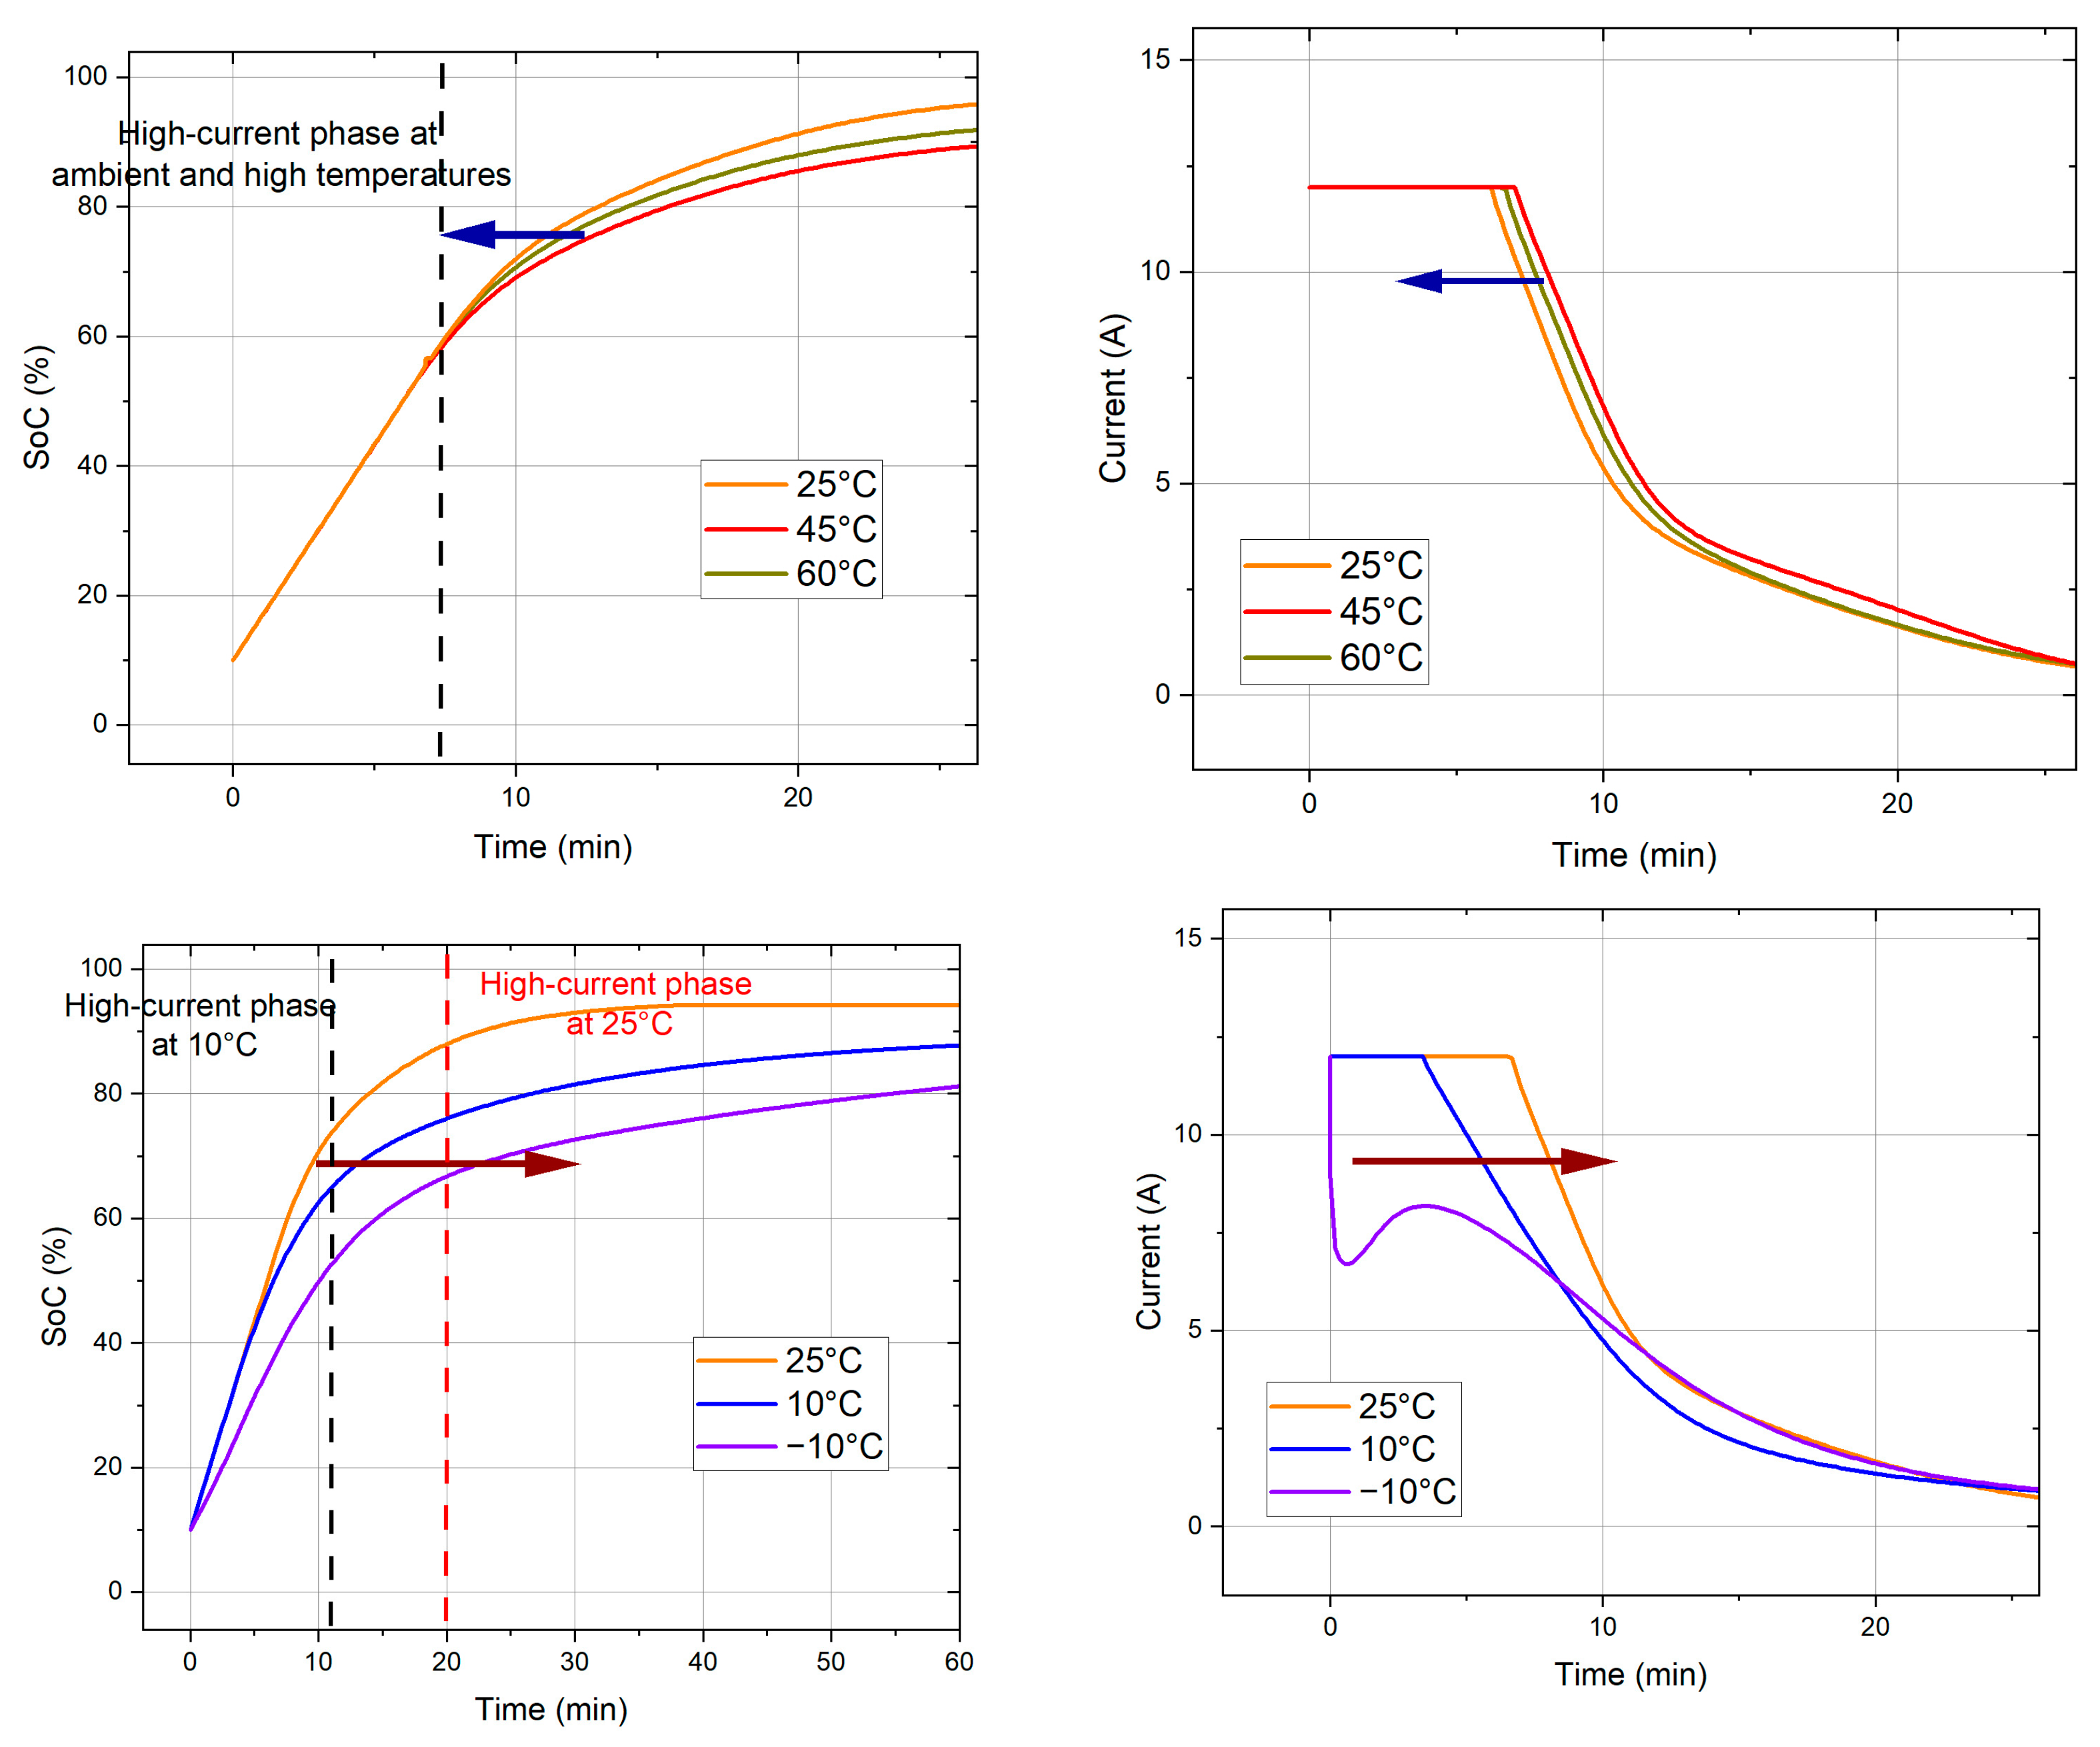
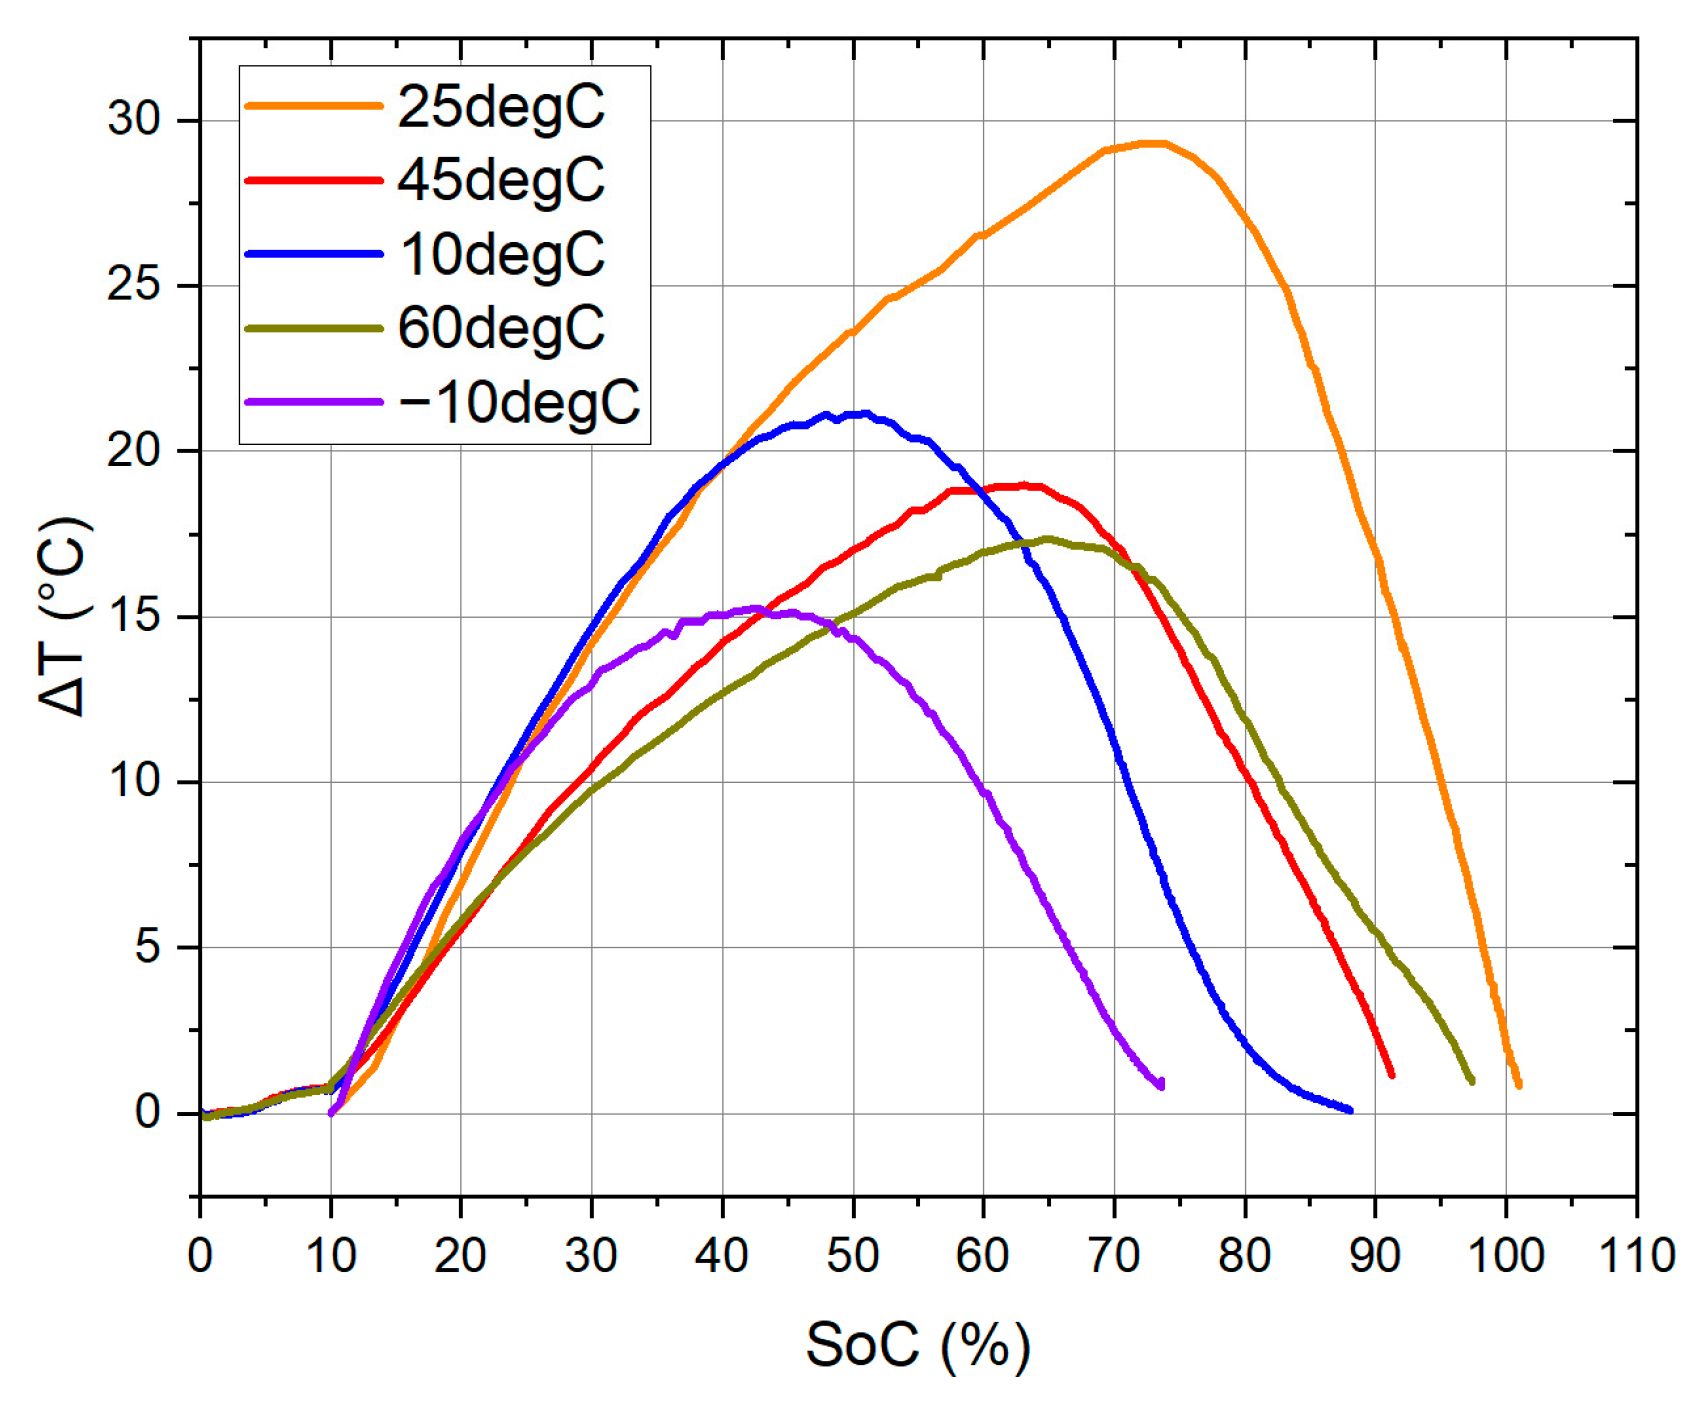
In Figure 4, the results of the fast-charging test at extreme temperatures (−10 °C, 10 °C, 45 °C, and 60 °C) are presented. The temperature results of the fast-charging test are shown in Figure 5, for which the variation in temperature, ΔT, is displayed in order to compare the tests. ΔT is a way of expressing temperature differences when conducting temperature tests and is calculated by subtracting the current battery temperature from the initial battery temperature. That is to say, it is a good way to compare different temperature tests for which the initial temperature is not the same.
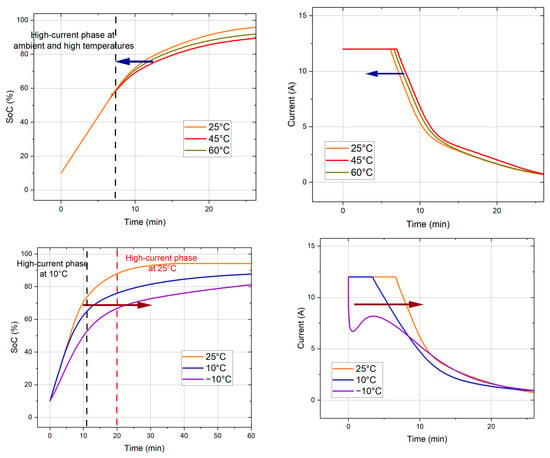
Figure 4.
(Top): Fast-charging results of the NMC VTC6 3Ah cell at high temperatures (45 °C & 60 °C). (Bottom): Fast-charging results of the NMC VTC6 3Ah cell at low temperatures (−10 °C & 10 °C).

Figure 5.
Temperature variation of the fast-charging test.
For high-temperature tests, it is evident that 45 °C is the most favorable for fast charging, as the high-current phase lasts longer than at other elevated temperatures. When the temperature decreases to ambient (25 °C), the high-current phase shortens due to the higher resistance compared to that at 45 °C [22].
At 60 °C, the CC phase is shorter than at 45 °C. This may be attributed to increased resistance from accelerated ageing in this environment. The extreme testing conditions at 60 °C lead to a significant rise in resistance, which is linked to the growth of the solid–electrolyte interface (SEI) layer on the graphite negative electrode [23]. Elevated cycling temperatures cause increased lithium plating during cycling, with deposits detected on the graphite electrodes [23]. Consequently, the fast-charging test at 60 °C may have triggered lithium deposition on the anode, increasing internal resistance.
In low-temperature environments, the high current phase is notably impacted. At 10 °C and lower, the CC phase is shorter than at 25 °C due to a higher internal resistance [24]. Specifically, at −10 °C, the current profile initially drops but then shows a short increase as charging continues. This is due to the evolution of resistance: starting high at the beginning of the fast-charging test, it decreases as the cell’s temperature rises, thus lowering resistance and causing the observed current profile [25,26].
Overall, low-temperature conditions are not conducive to fast charging, meaning that twice as much time is needed to charge to 80% in 10 °C conditions. Therefore, a preconditioning thermal management strategy should be developed to optimize fast charging in such environments [11,12].
4. Model Development
4.1. Model Methodology
This paper utilizes a 1D electro-thermal model based on a semi-empirical approach within a MATLAB/Simulink® 2023 interface. The model aims to replicate the cell’s electrical and thermal performance through two primary components: the electrical and thermal modules. The electrical module calculates the SoC using electrical parameters, while the thermal module estimates the cell’s temperature based on the heat generation equation.
The electrical model, depicted in Figure 6 and constructed using the Rint model [27], consists of a voltage source in series with a single resistance. According to the equivalent circuit model, the battery’s output voltage for the Li-ion cell is determined by the voltage drop caused by the battery’s open circuit voltage (OCV) and internal resistance (Rint). The cell’s output voltage is calculated using the formula described in [27]:
where Ibatt is the flowing current in the battery (A). Thereafter, the SoC is determined by the Coulomb-counting method and is defined in [26]:
with SoC0 as the initial SoC of the cell. Cinit is defined as the initial capacity (Ah) and it is assumed to be temperature-dependent as well as being influenced by the current. In Equation (1), all the circuit parameters are derived from the manufacturer’s datasheet, resulting in an internal resistance value of 28 mΩ at 25 °C and 44 mΩ/80 mΩ at 10 °C.
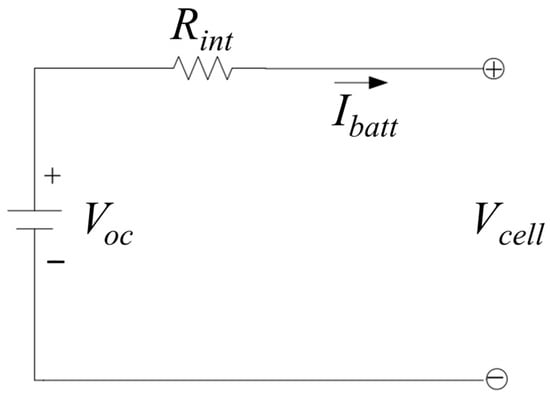
Figure 6.
The Rint electrical model [27].
The thermal aspect of the model incorporates thermodynamic equations relevant to cylindrical cells. It considers a single temperature point, assuming heat generation at a specific location on the cell’s surface, characterized by a defined heat capacity and mass. Heat is then transferred from the cell’s surface to the surrounding environment. By applying a heat balance equation at this specific surface point, the following thermodynamic equations describe the heat transfer between the surface and the ambient environment [28]:
where Ucell, the internal energy, is the total energy contained by a thermodynamic system (J), Qgen is the generating heating rate (W) in the corresponding element, and Qloss is the heat losses of the corresponding element (W). Cp is the specific heat of the cell (kJ/kg·K) and m is the mass of the cell (kg). The thermal model operates under the following assumptions:
- The temperature of the cell’s surface, denoted as Tcell, is considered to be uniformly distributed, and as such, it represents the overall temperature of the entire cell.
- This paper accounts for natural convective heat transfer, characterized by the following parameters: ambient temperature, Tamb, (°C), the heat exchange surface area, Sarea (in m2), and the convective heat transfer coefficient, hconv (W/m2·K).
- All thermal parameters utilized in this paper are sourced from the cell manufacturer’s datasheet. Consequently, the model employs a specific heat capacity (Cp) of 1006 kJ/kg·K, a mass of 0.046 kg, and an area of 0.004327 m2. Given the use of natural convection, an hconv of 15 W/m2·K is applied [29].
4.2. Model Validation
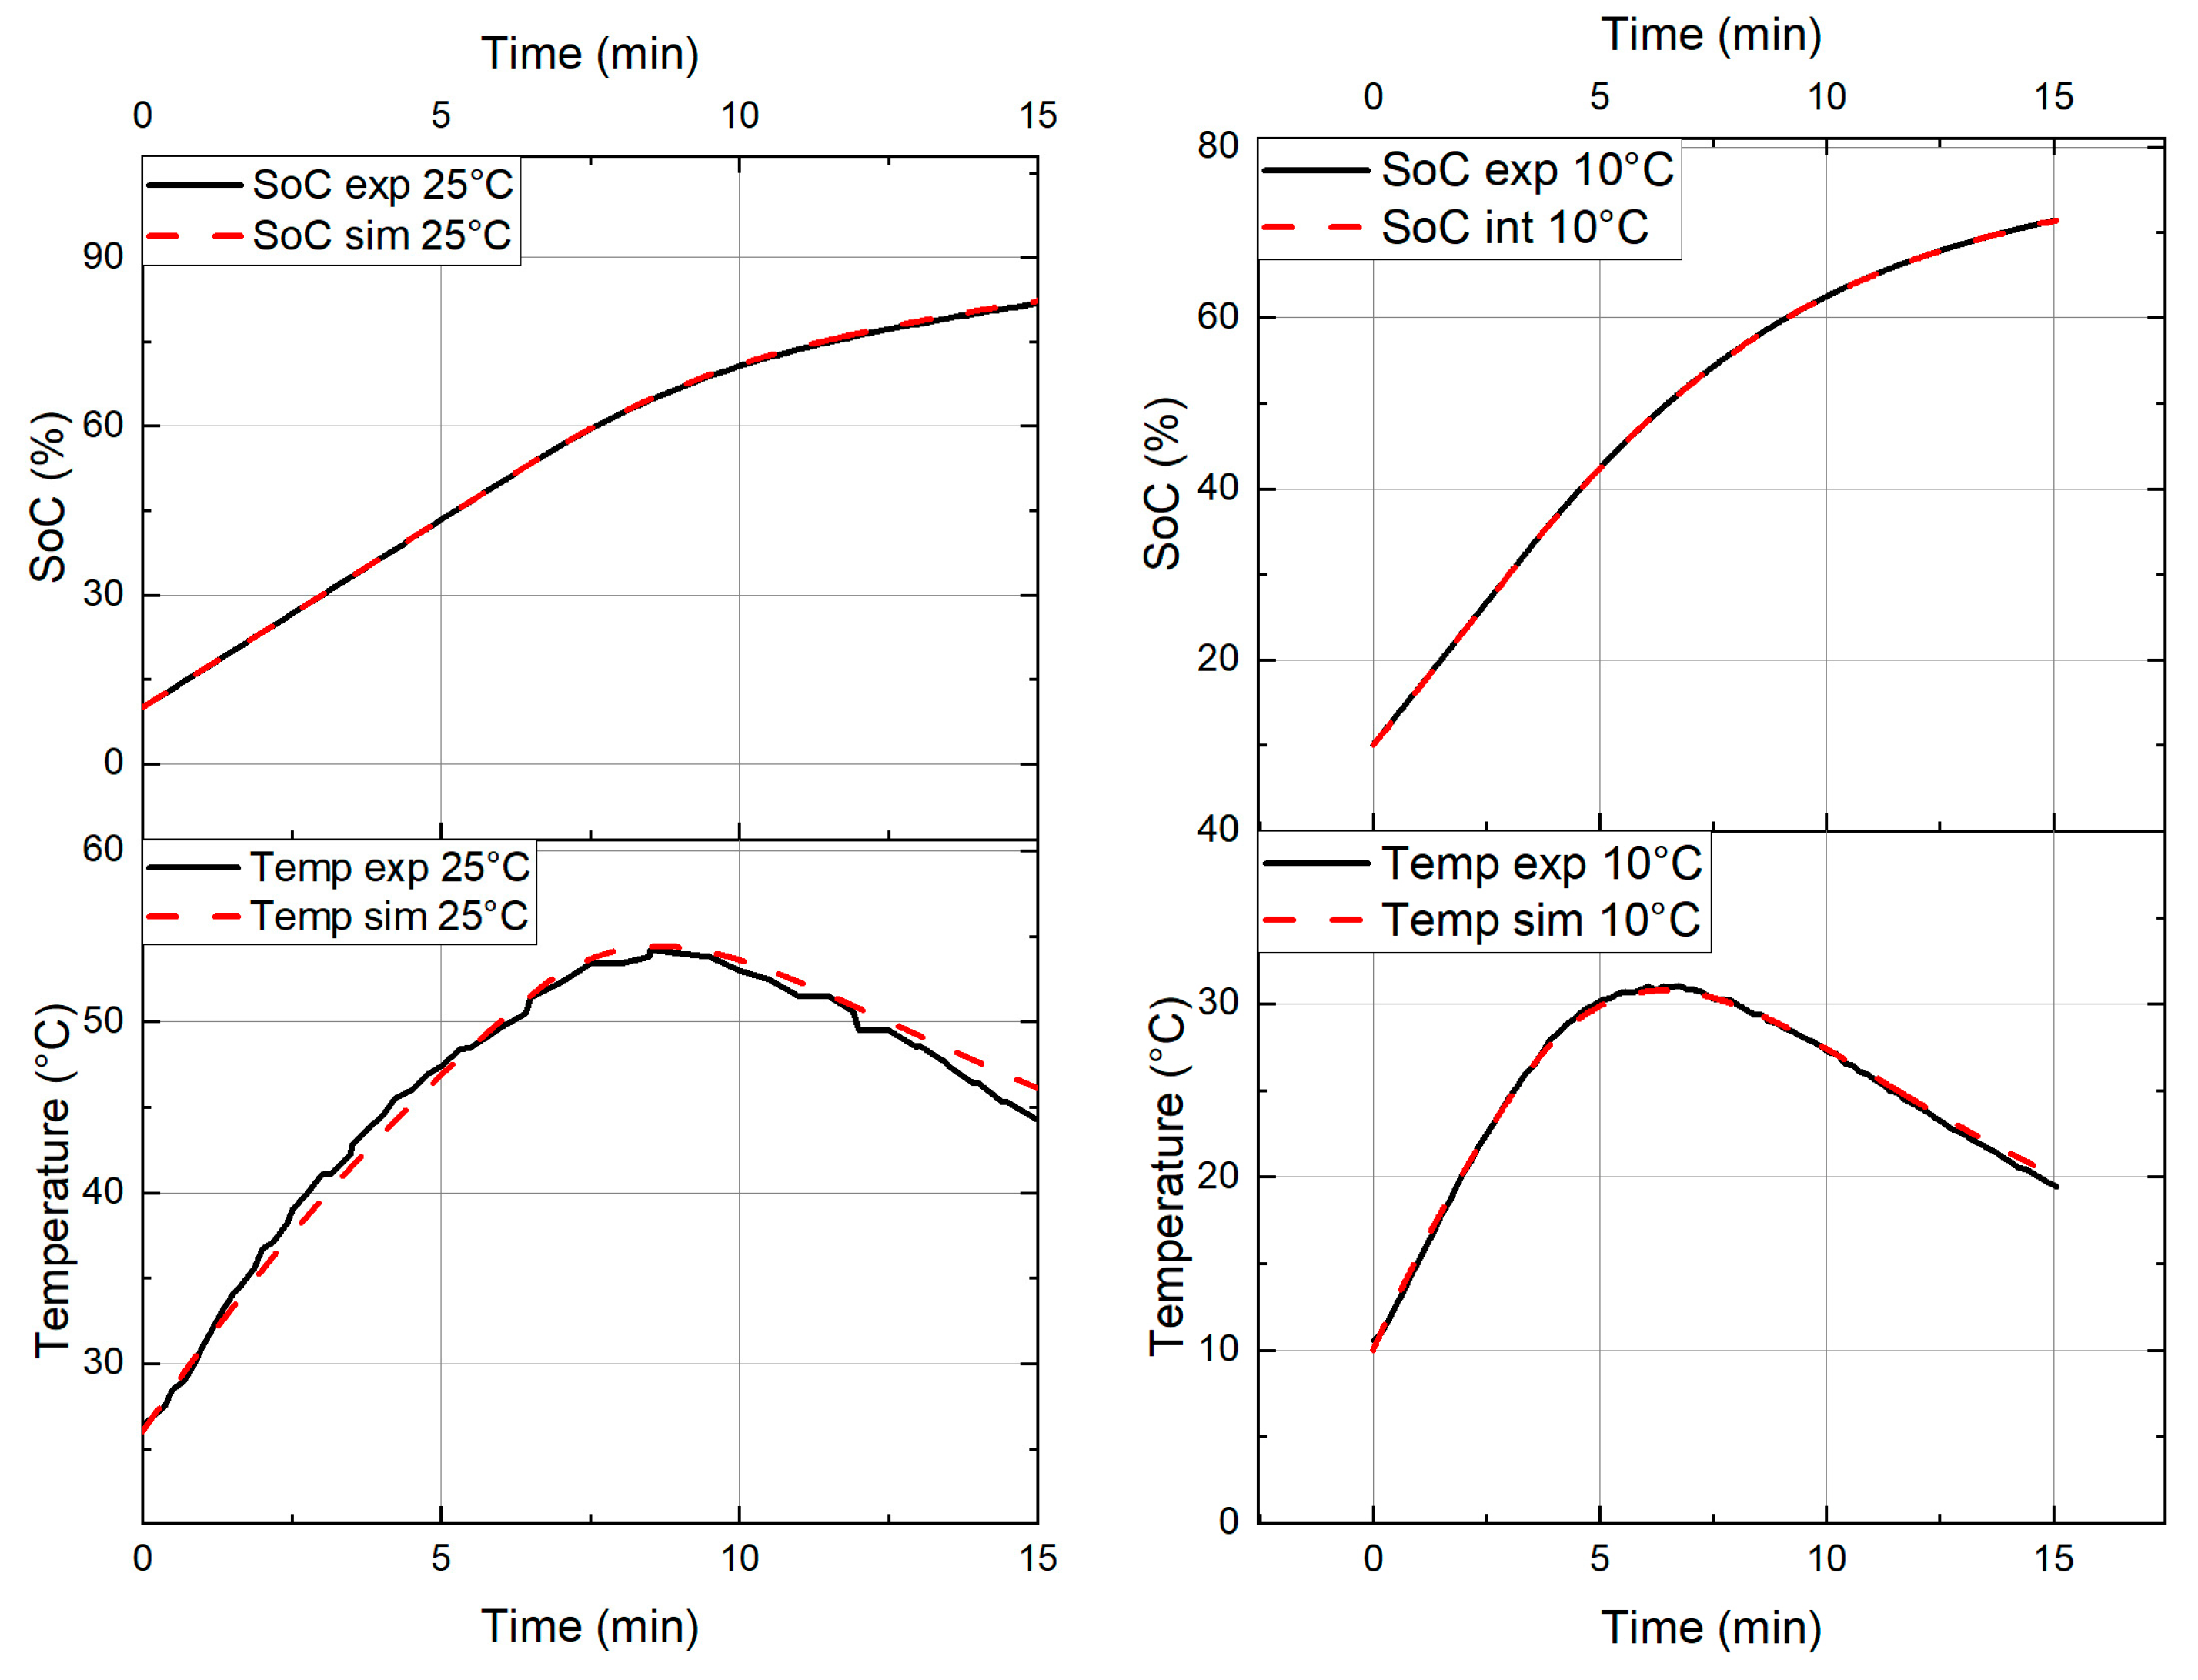
Figure 7 presents the results of model validation at 25 °C and 10 °C, comparing the measured and estimated SoC and temperature for the cell during the fast-charging phase (4C or 12 A). The data show that the modeled SoC closely matches the SoC obtained from electrical experiments, further validating the electrical modeling and the accuracy of the electrical parameters at both ambient and low temperatures.
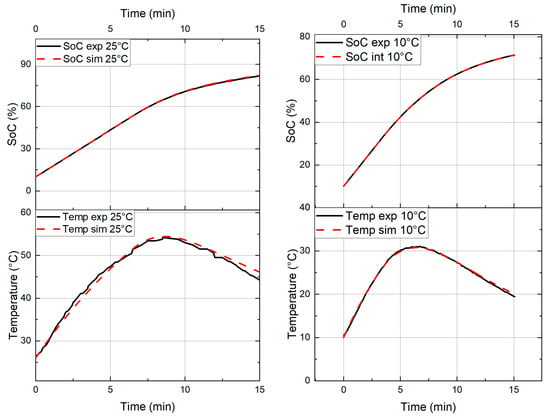
Figure 7.
Validation of the electrical and thermal model at 25 °C (left-hand side) and 10 °C (right-hand side).
In terms of temperature evolution, the model demonstrates remarkable accuracy in predicting the cell’s temperature at both 25 °C and 10 °C, even with the use of a single resistance. The strong correlation between the model’s predictions and the experimental results for both electrical and thermal behaviors underscores the model’s validity. Thus, the electro-thermal model is confirmed as a reliable tool for optimization processes.
4.3. Model Predictive Control
Model Predictive Control (MPC) is an advanced control strategy that is widely used in engineering, economics, and robotics [30,31]. MPC is a dynamic optimization technique that leverages a mathematical model of a system to make informed control decisions. Unlike traditional control methods, MPC operates over a defined prediction horizon, which represents a future time window. During this horizon, the controller predicts the system’s response to various control inputs.
MPC formulates an optimization problem that aims to optimize a cost or objective function over the prediction horizon. This function typically includes terms related to system performance, such as tracking a reference trajectory or minimizing costs, while adhering to constraints. At each time step, MPC solves the optimization problem based on the system’s current state and the prediction horizon. It calculates the optimal control inputs for the horizon but only applies the first input to the system. After applying this control input, MPC advances to the next time step, updates the system state, and repeats the optimization process. This iterative procedure provides continuous feedback control as the system evolves. Figure 8 shows the flowchart of the MPC and the semi-empirical model.
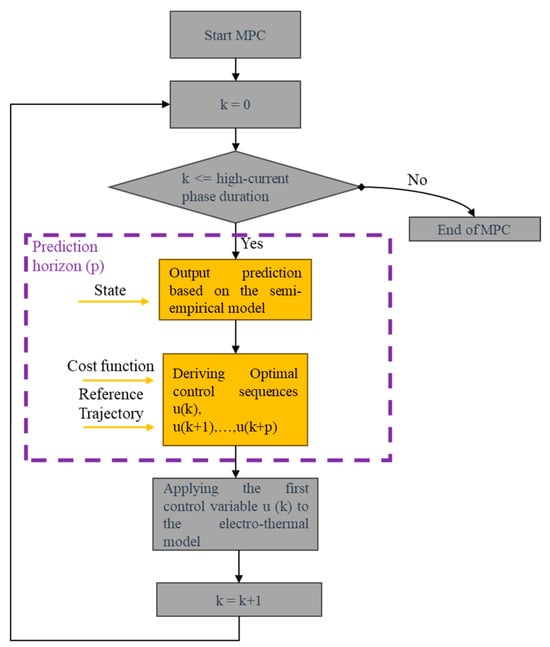
Figure 8.
MPC flowchart.
The demand for safe and rapid charging strategies has become increasingly crucial, especially for fast charging [19,31,32,33]. MPC has emerged as a promising and versatile approach to meet this demand, utilizing predictive modeling and real-time optimization for precise control over the charging process.
In this paper, the primary objective of the controller is to minimize battery temperature while maximizing the SoC simultaneously. This is a complex challenge, involving a multi-state, constrained, and nonlinear dynamic optimal control problem. The key states considered are the battery temperature (Tbatt) and SoC, with the charging current (Ibatt) as the control variable.
To address fast charging, the MPC problem is formulated with strict constraints on both battery temperature and SoC. By utilizing the probability distribution of the estimated battery temperature and SoC levels, MPC strategically determines the optimal charging current rate. The goal is to maximize the SoC while effectively regulating the battery temperature within set limits. This complex control challenge is encapsulated in the following cost function:
where Np, representing the prediction horizon, is set to 10 (equivalent to 10 s); SoC signifies the charge level at the k-th time step; and α and β represent the weighting factors. The first component of the cost function is dedicated to maximizing the SoC, aligning with our primary objective. The equality constraint of the MPC is stated as follows:
where x(k) is the state and u(k) is the control input. These are expressed as follows:
4.4. Problem Description
This section describes the case study for the optimization process. The study is centered on the fast-charging profile discussed in Section 2, specifically using the electro-thermal model designed for the VTC6 3Ah NMC battery.
The control algorithm utilized in this study employs a receding horizon mechanism. Within this framework, optimal control sequences are computed over a prediction horizon, and the initial control input is executed while adhering to predefined constraints. Throughout our study, these constraint values are set as follows:
where min and max refer to the minimum and maximum values, respectively.
The temperature and current values in use are in accordance with the cell manufacturer’s recommendations. Regarding the initial SoC, given that during the initial 0% to 10% SoC range, the cell’s temperature is relatively stable, the MPC will focus on optimizing the high-current phase, commencing at 10% SoC. Furthermore, the initial temperature is established at 25 °C, aligning with ambient environmental conditions.
5. Results and Discussion
5.1. Fast-Charging Optimization
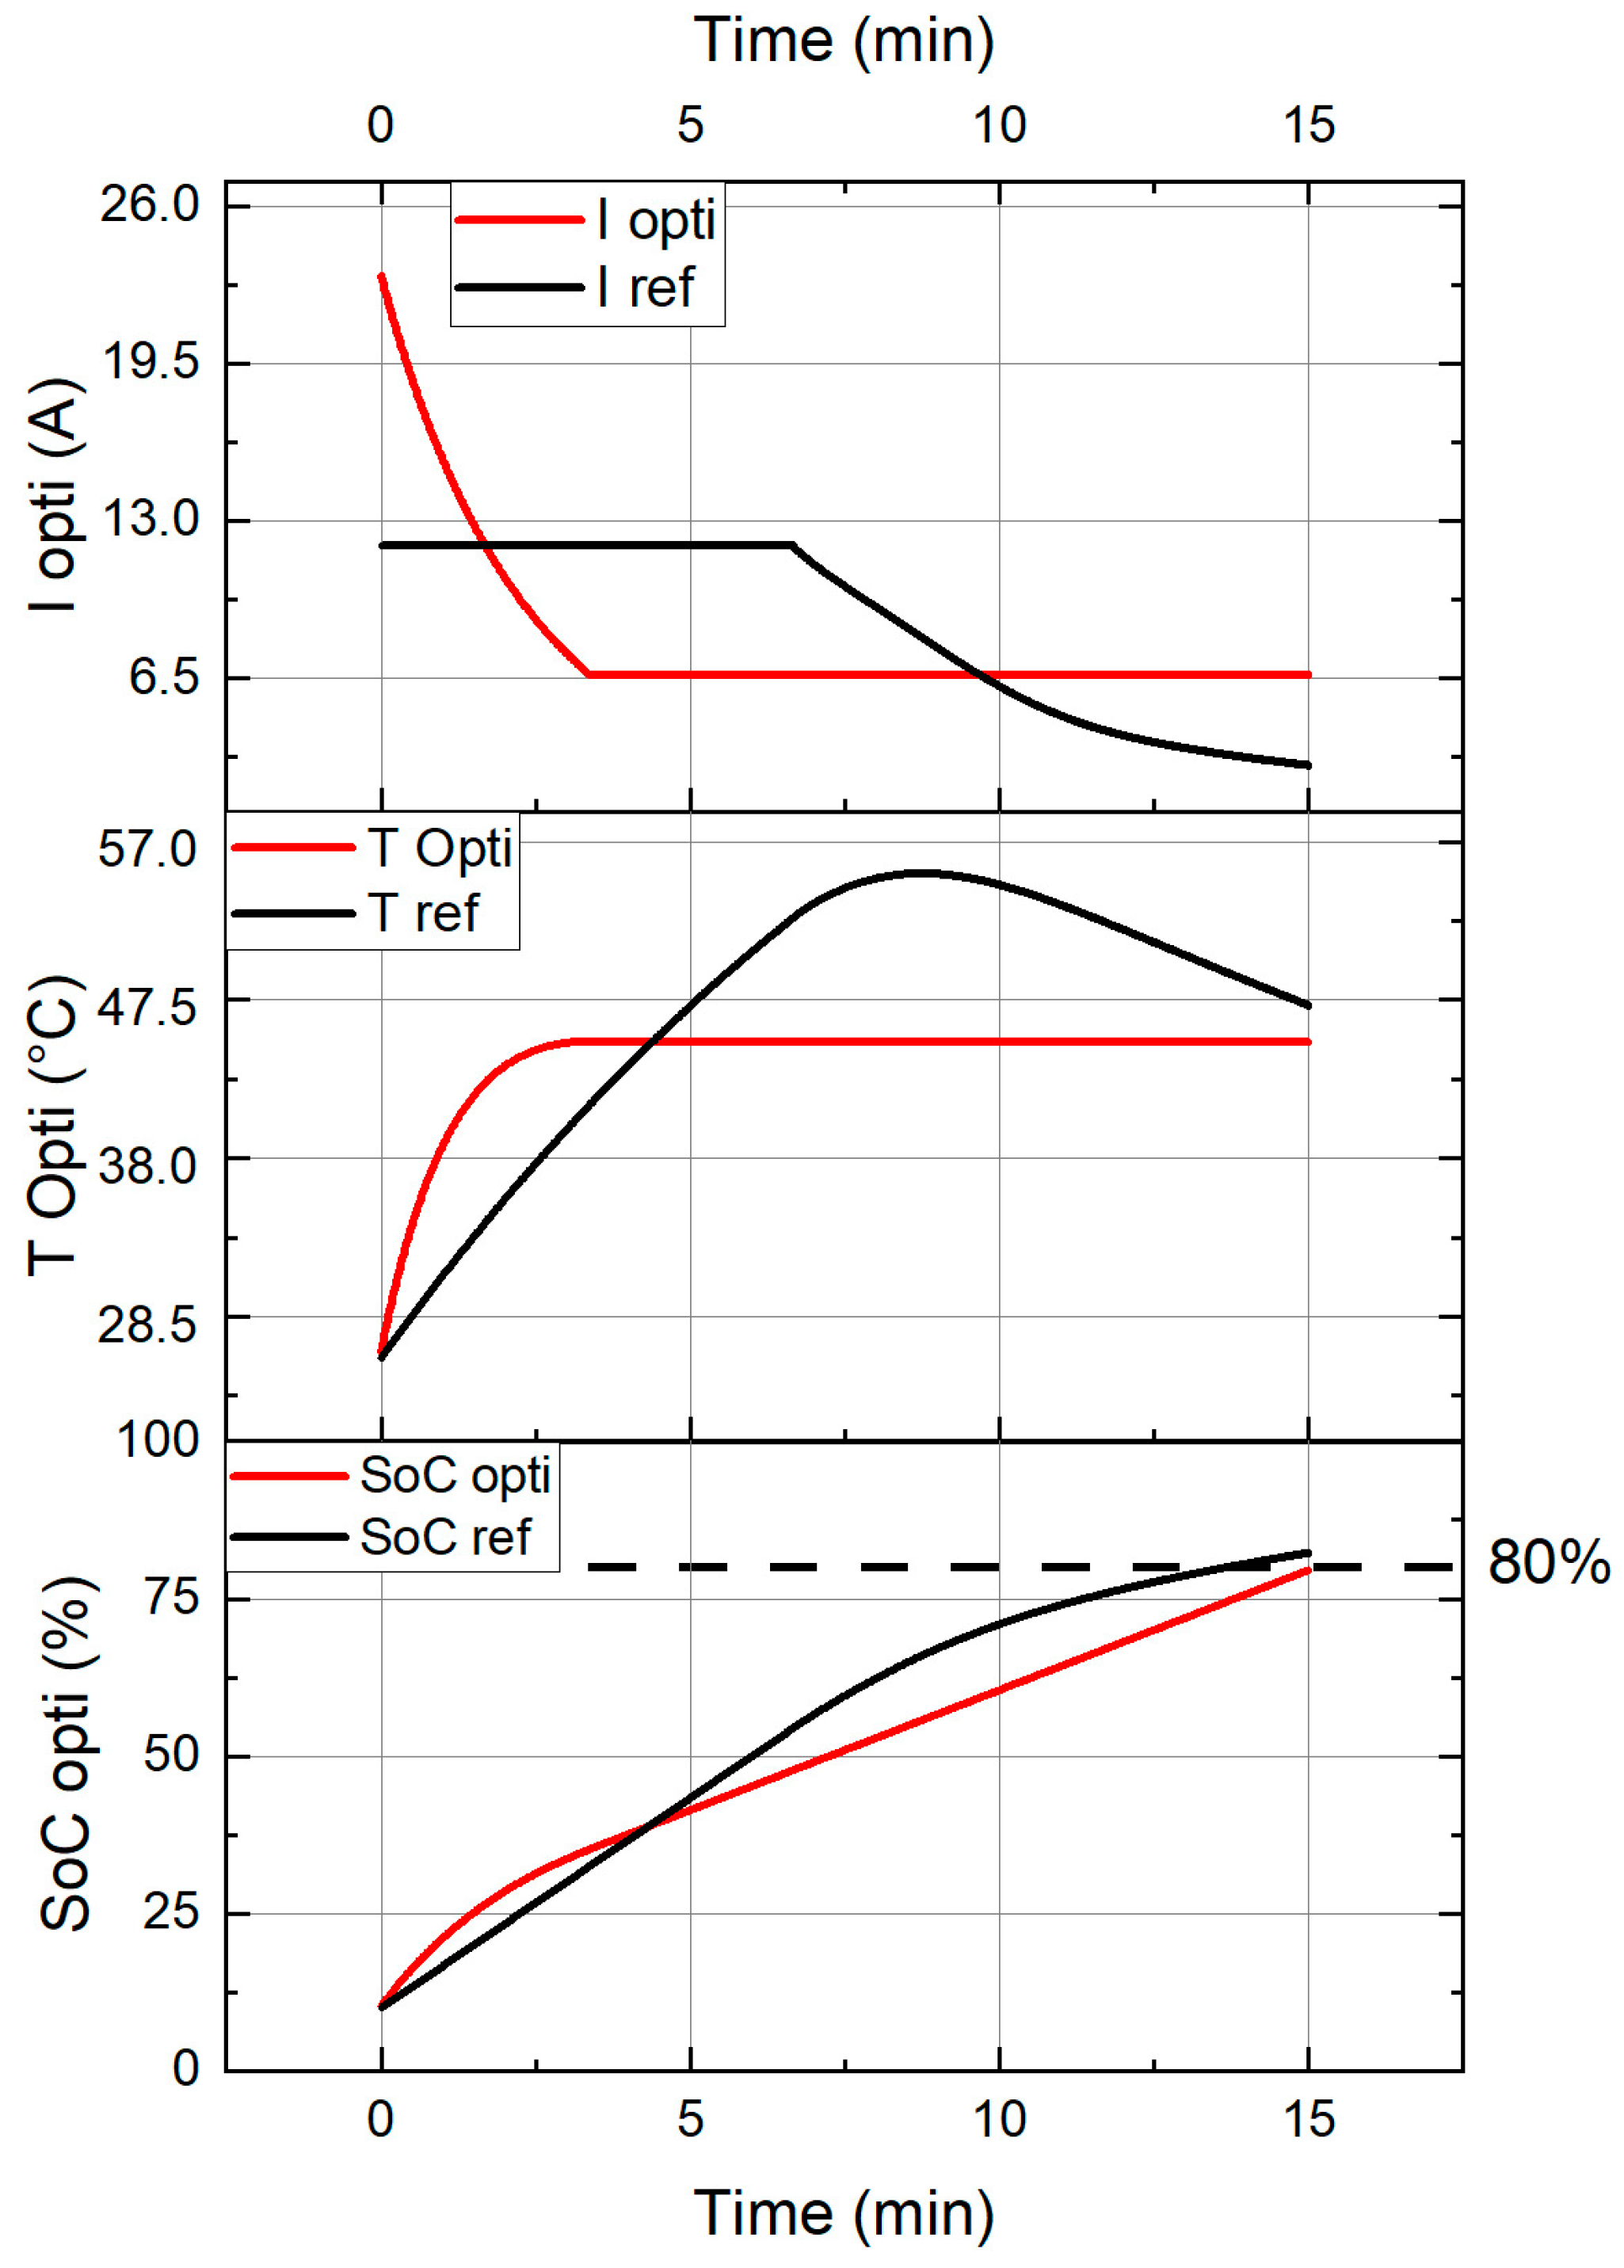
Figure 9 depicts the outcomes of MPC application during the high-current phase (4C or 12 A). In this simulation, both weighting factors were assigned a value of one. The red line represents the optimal results, contrasting with the reference values shown by the black line.
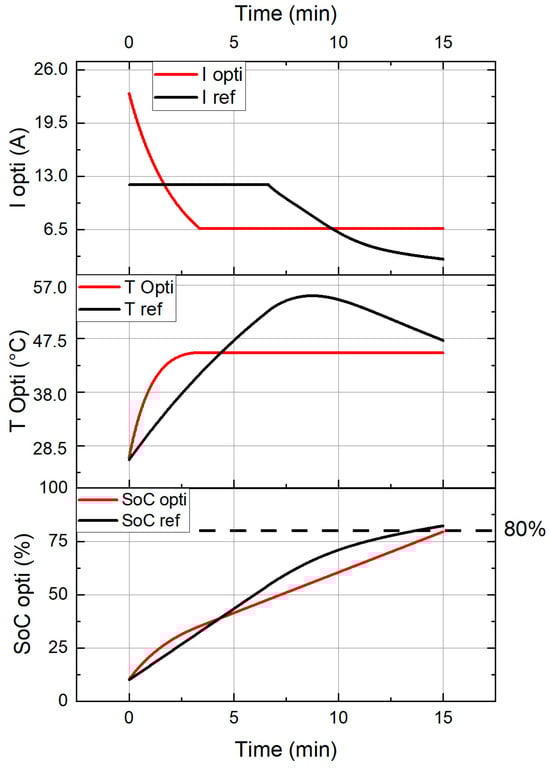
Figure 9.
MPC results of the high-current phase.
The MPC-calculated current trajectory reveals a charging process divided into two phases. Initially, a peak current of 23 A is applied, gradually decreasing to a stable 6.5 A. Due to this variation in the current profile, it takes an additional minute to reach an 80% SoC compared to the reference profile.
Significantly, the optimal charging strategy effectively keeps the cell’s temperature below 45 °C, aligning with the manufacturer’s temperature limit without necessitating an external cooling system. This ability to regulate temperature via the optimal current profile suggests the feasibility of employing a smaller cooling system for this battery pack, potentially reducing weight, mass, and overall costs.
5.2. Optimal Fast-Charging Profile Validation
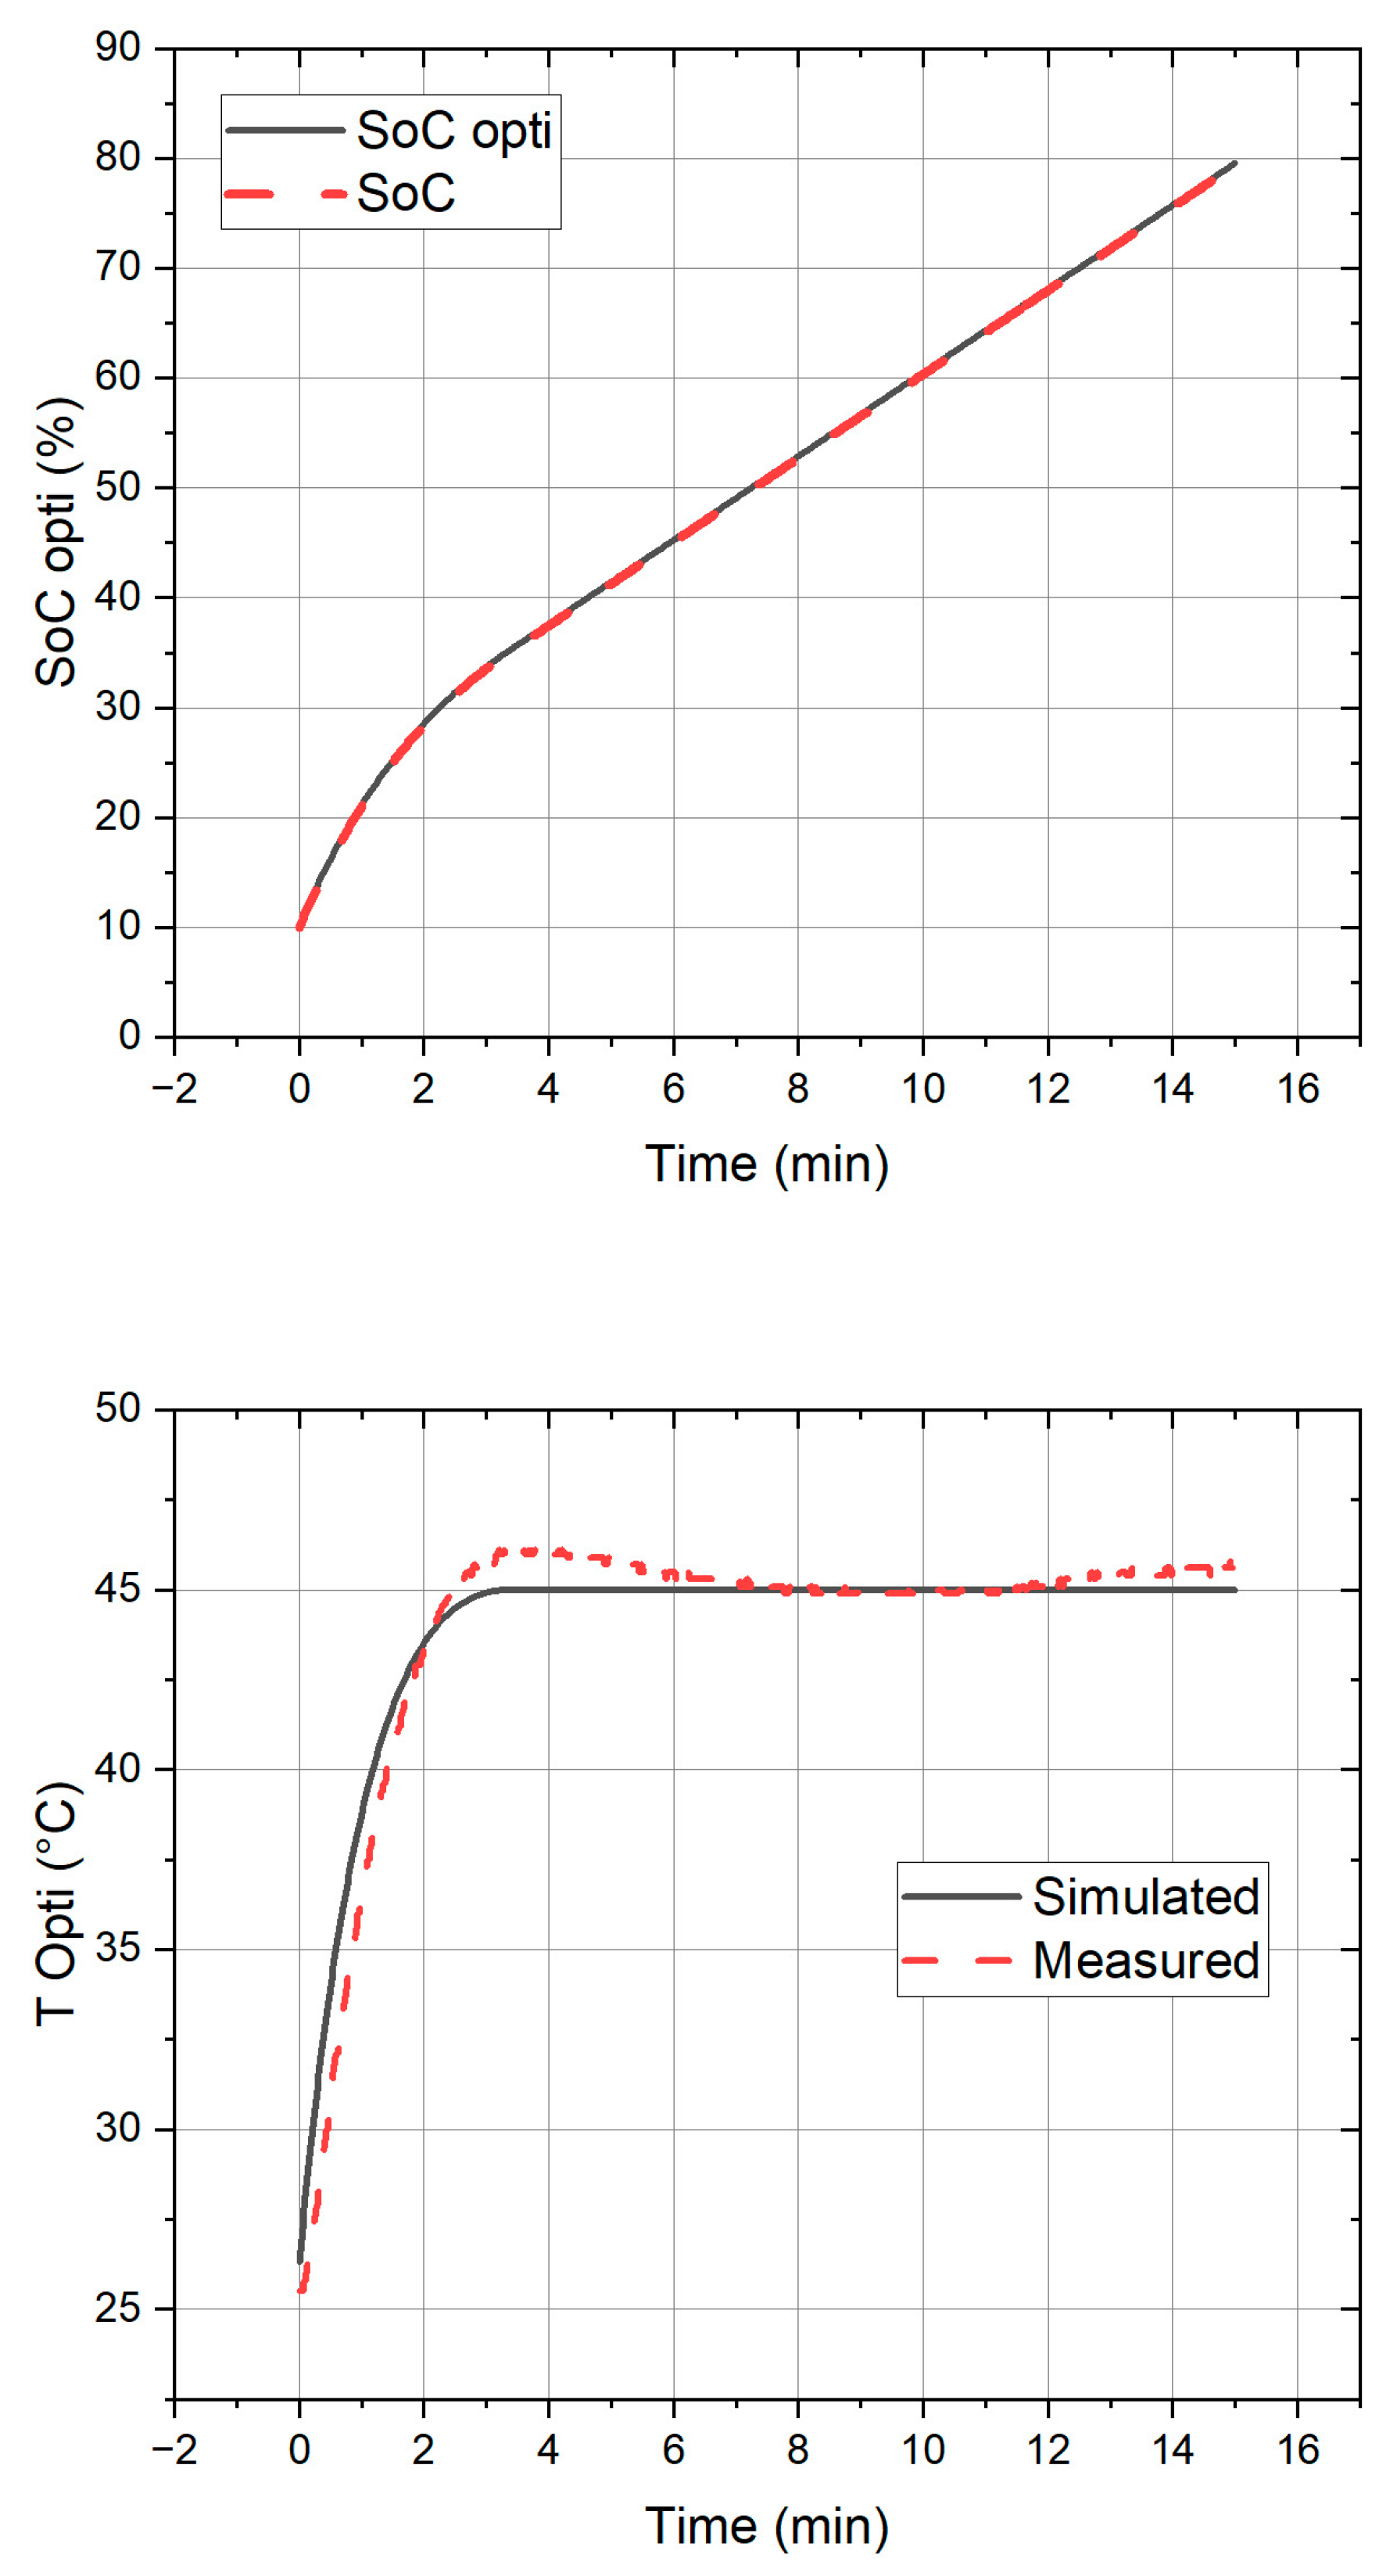
In this subsection, validation of an optimal fast-charging profile was undertaken through a comprehensive analysis involving computational modeling and experimental testing. The charging profile, optimized using an algorithm, underwent evaluation by comparing the evolutions of SoC and temperature. The results of this validation test are illustrated in Figure 10, juxtaposing practical experiment data from a VTC6 3A NMC cell.
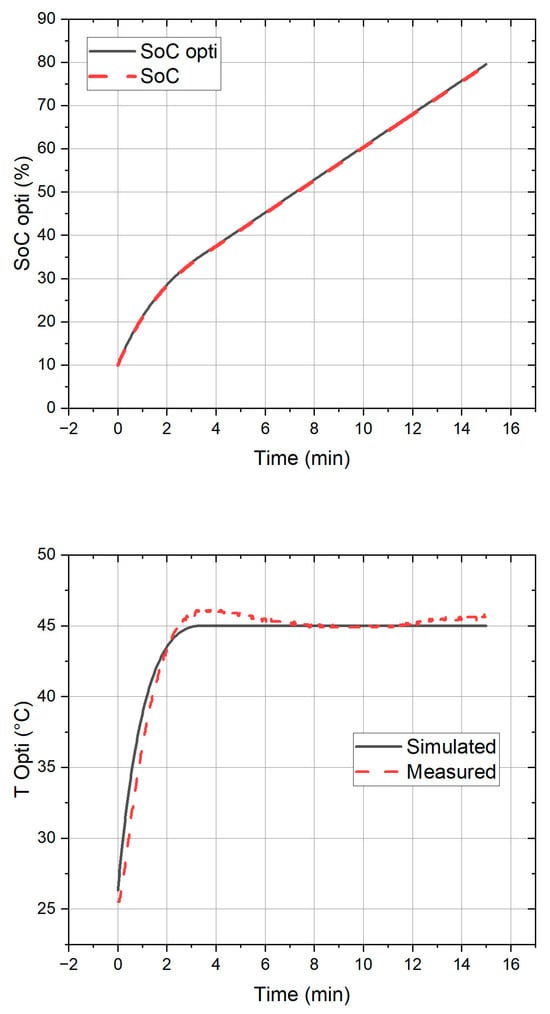
Figure 10.
Optimal fast-charging profile validation.
Figure 10 depicts a close alignment between the measured SoC and temperature evolution and the simulated values. This successful validation against real-world experimental data underlines that the profile is not merely a theoretical concept derived from a simplified battery model but highlights its practical potential for optimizing fast-charging strategies for LiBs.
5.3. Effect of the Current Limit
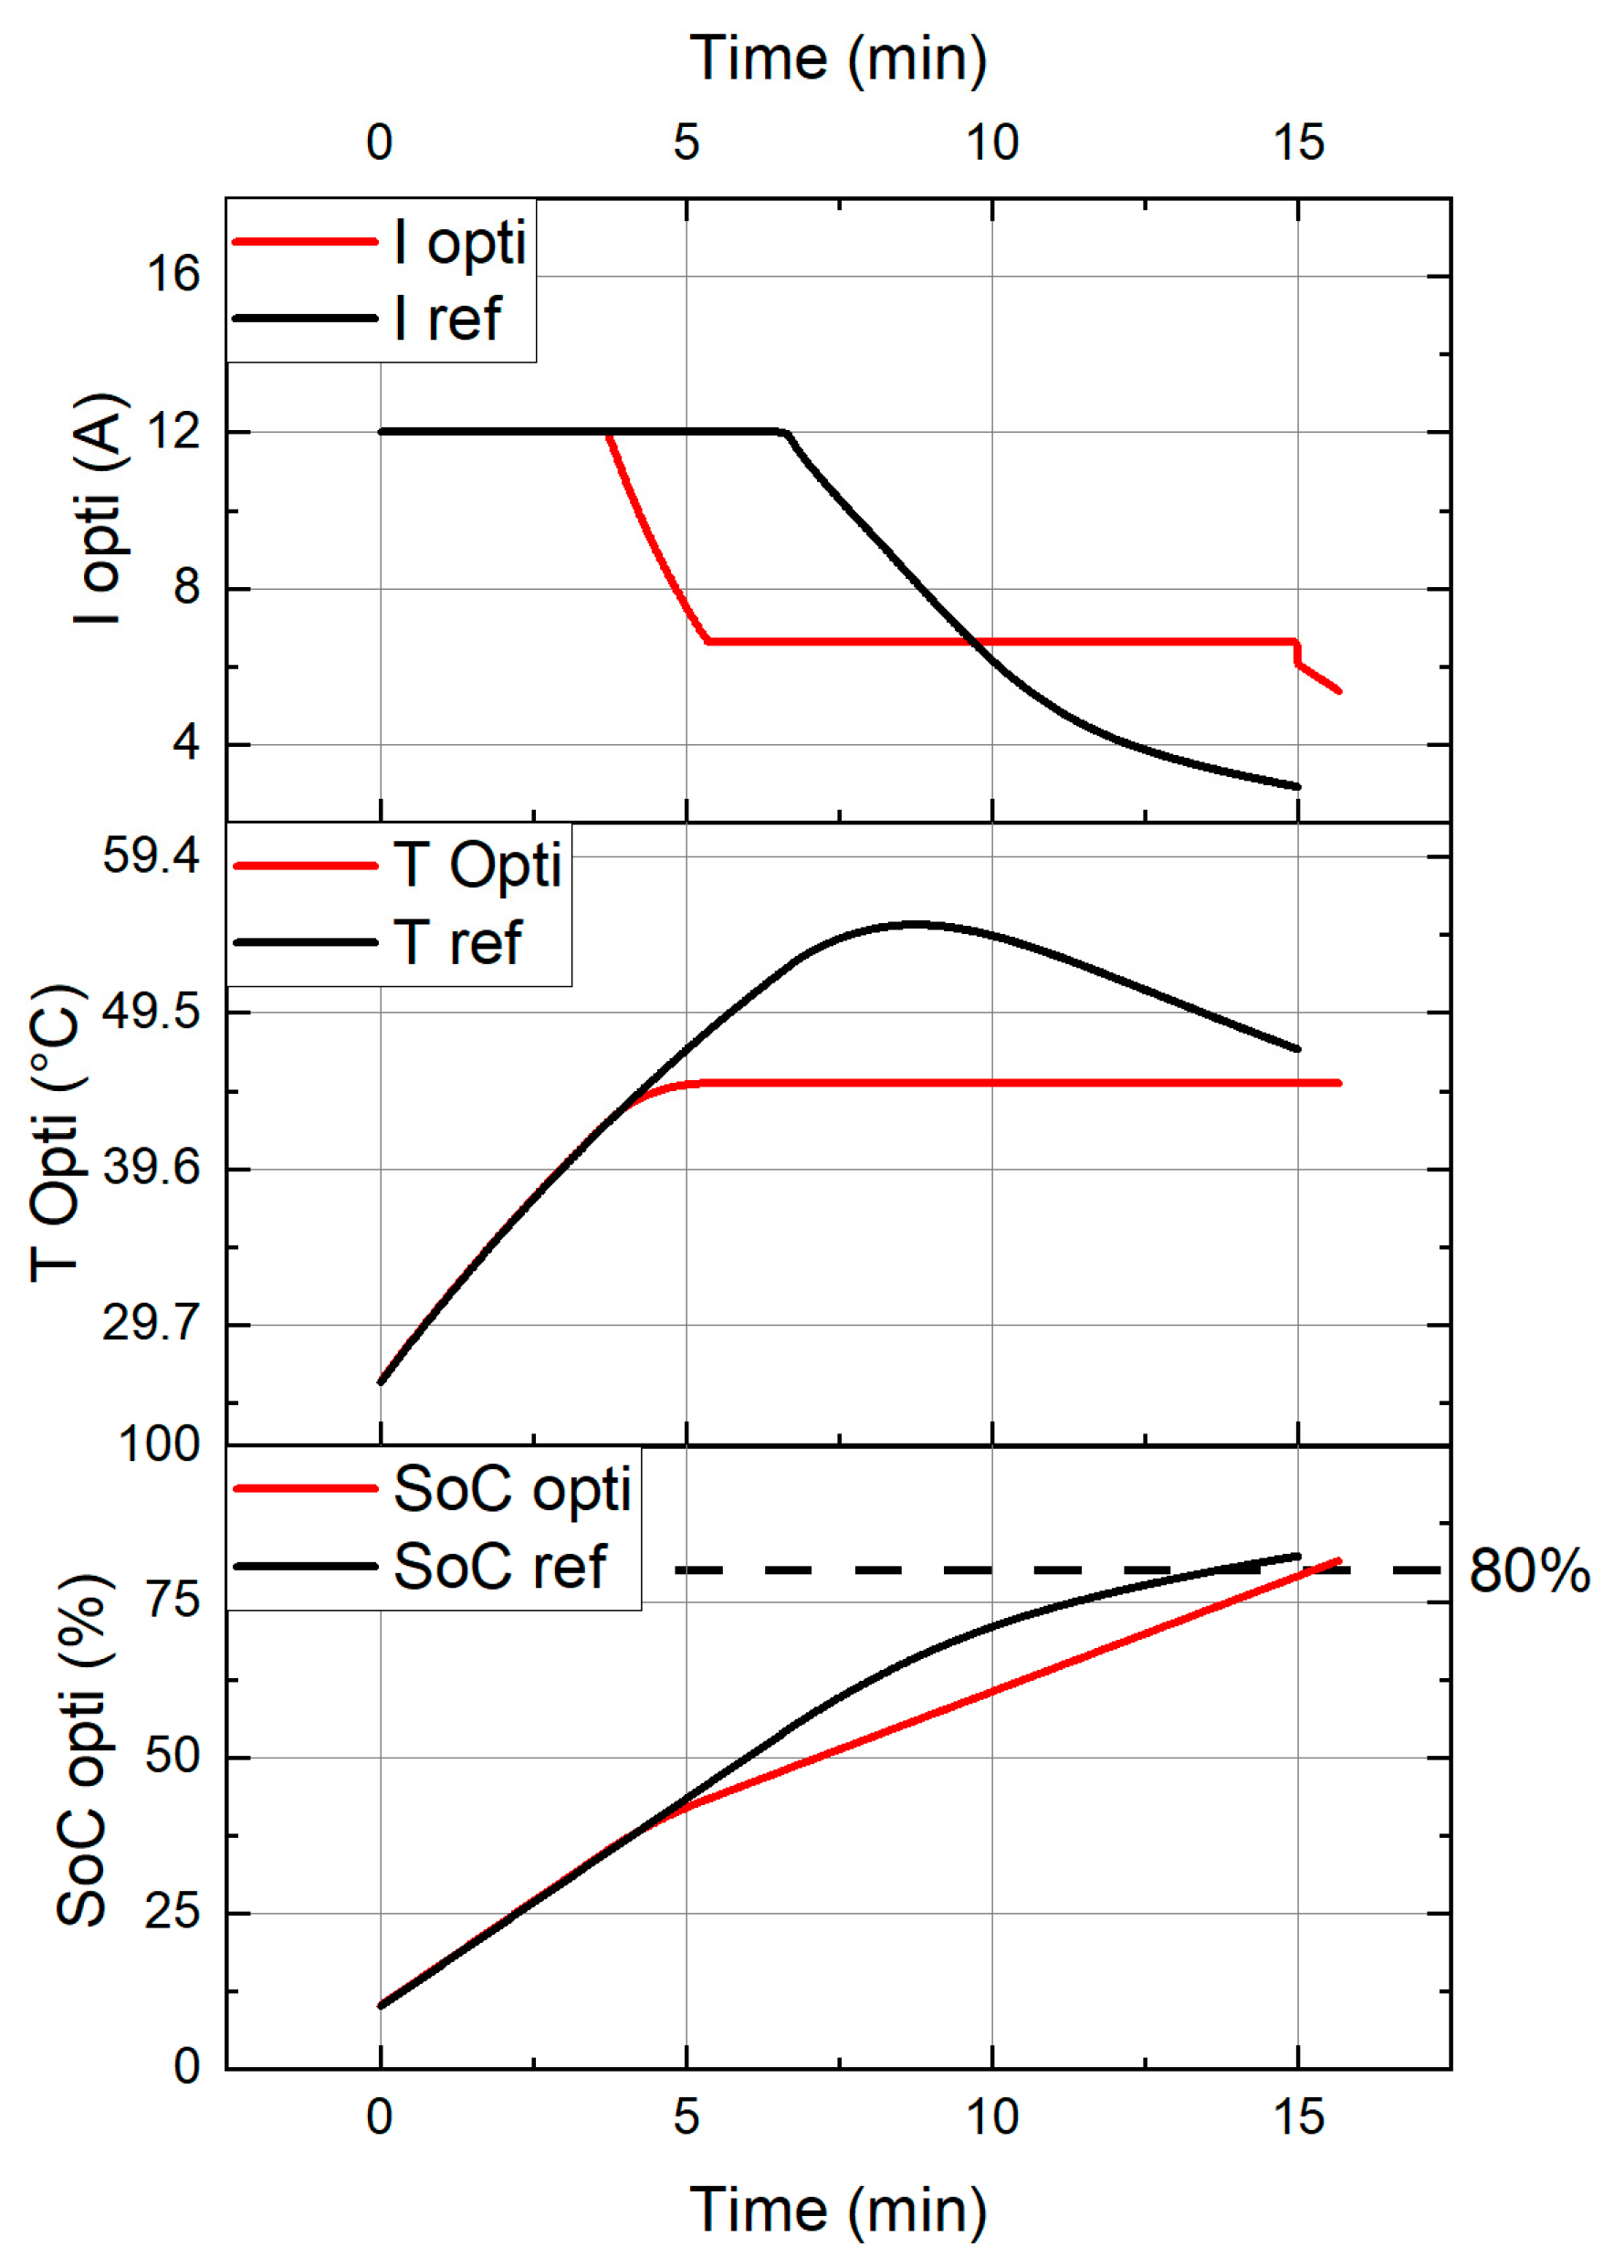
In the previous section, the MPC’s maximum current limit was initially set to the manufacturer’s recommended 10C, corresponding to 30 A. However, due to typical operational conditions within the battery pack application, which seldom exceed 4C, a new MPC simulation was conducted using a maximum current limit of 4C (12 A), maintaining consistent weighting factors.
Figure 11 presents the outcomes of the MPC simulation with the 4C current limit. The optimized charging profile exhibits a three-phase pattern. Initially, a 4C (12 A) charging rate is applied for 3 min, followed by a reduction to 6.5 A to ensure the cell’s temperature remains below 45 °C. After 15 min, the current gradually decreases further. Despite extending the charging duration by more than 1 min and 30 s compared to the reference profile, this approach successfully maintains the cell’s thermal gradient within a safe range.
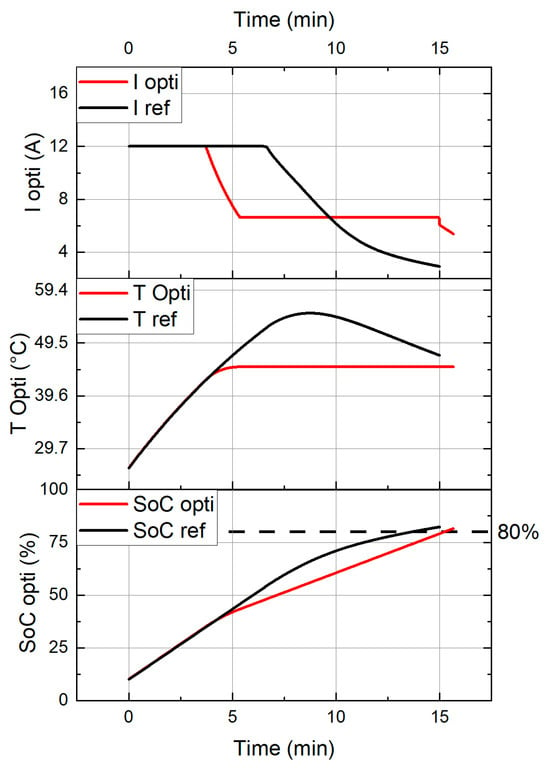
Figure 11.
MPC results of the optimal high-current phase using a current limit of 12 A.
In the end, while the temperature remains below the critical 45 °C threshold, it is essential to conduct a comprehensive lifetime study to assess the long-term viability of this optimized charging strategy.
5.4. Effect of the Low-Temperature Environment
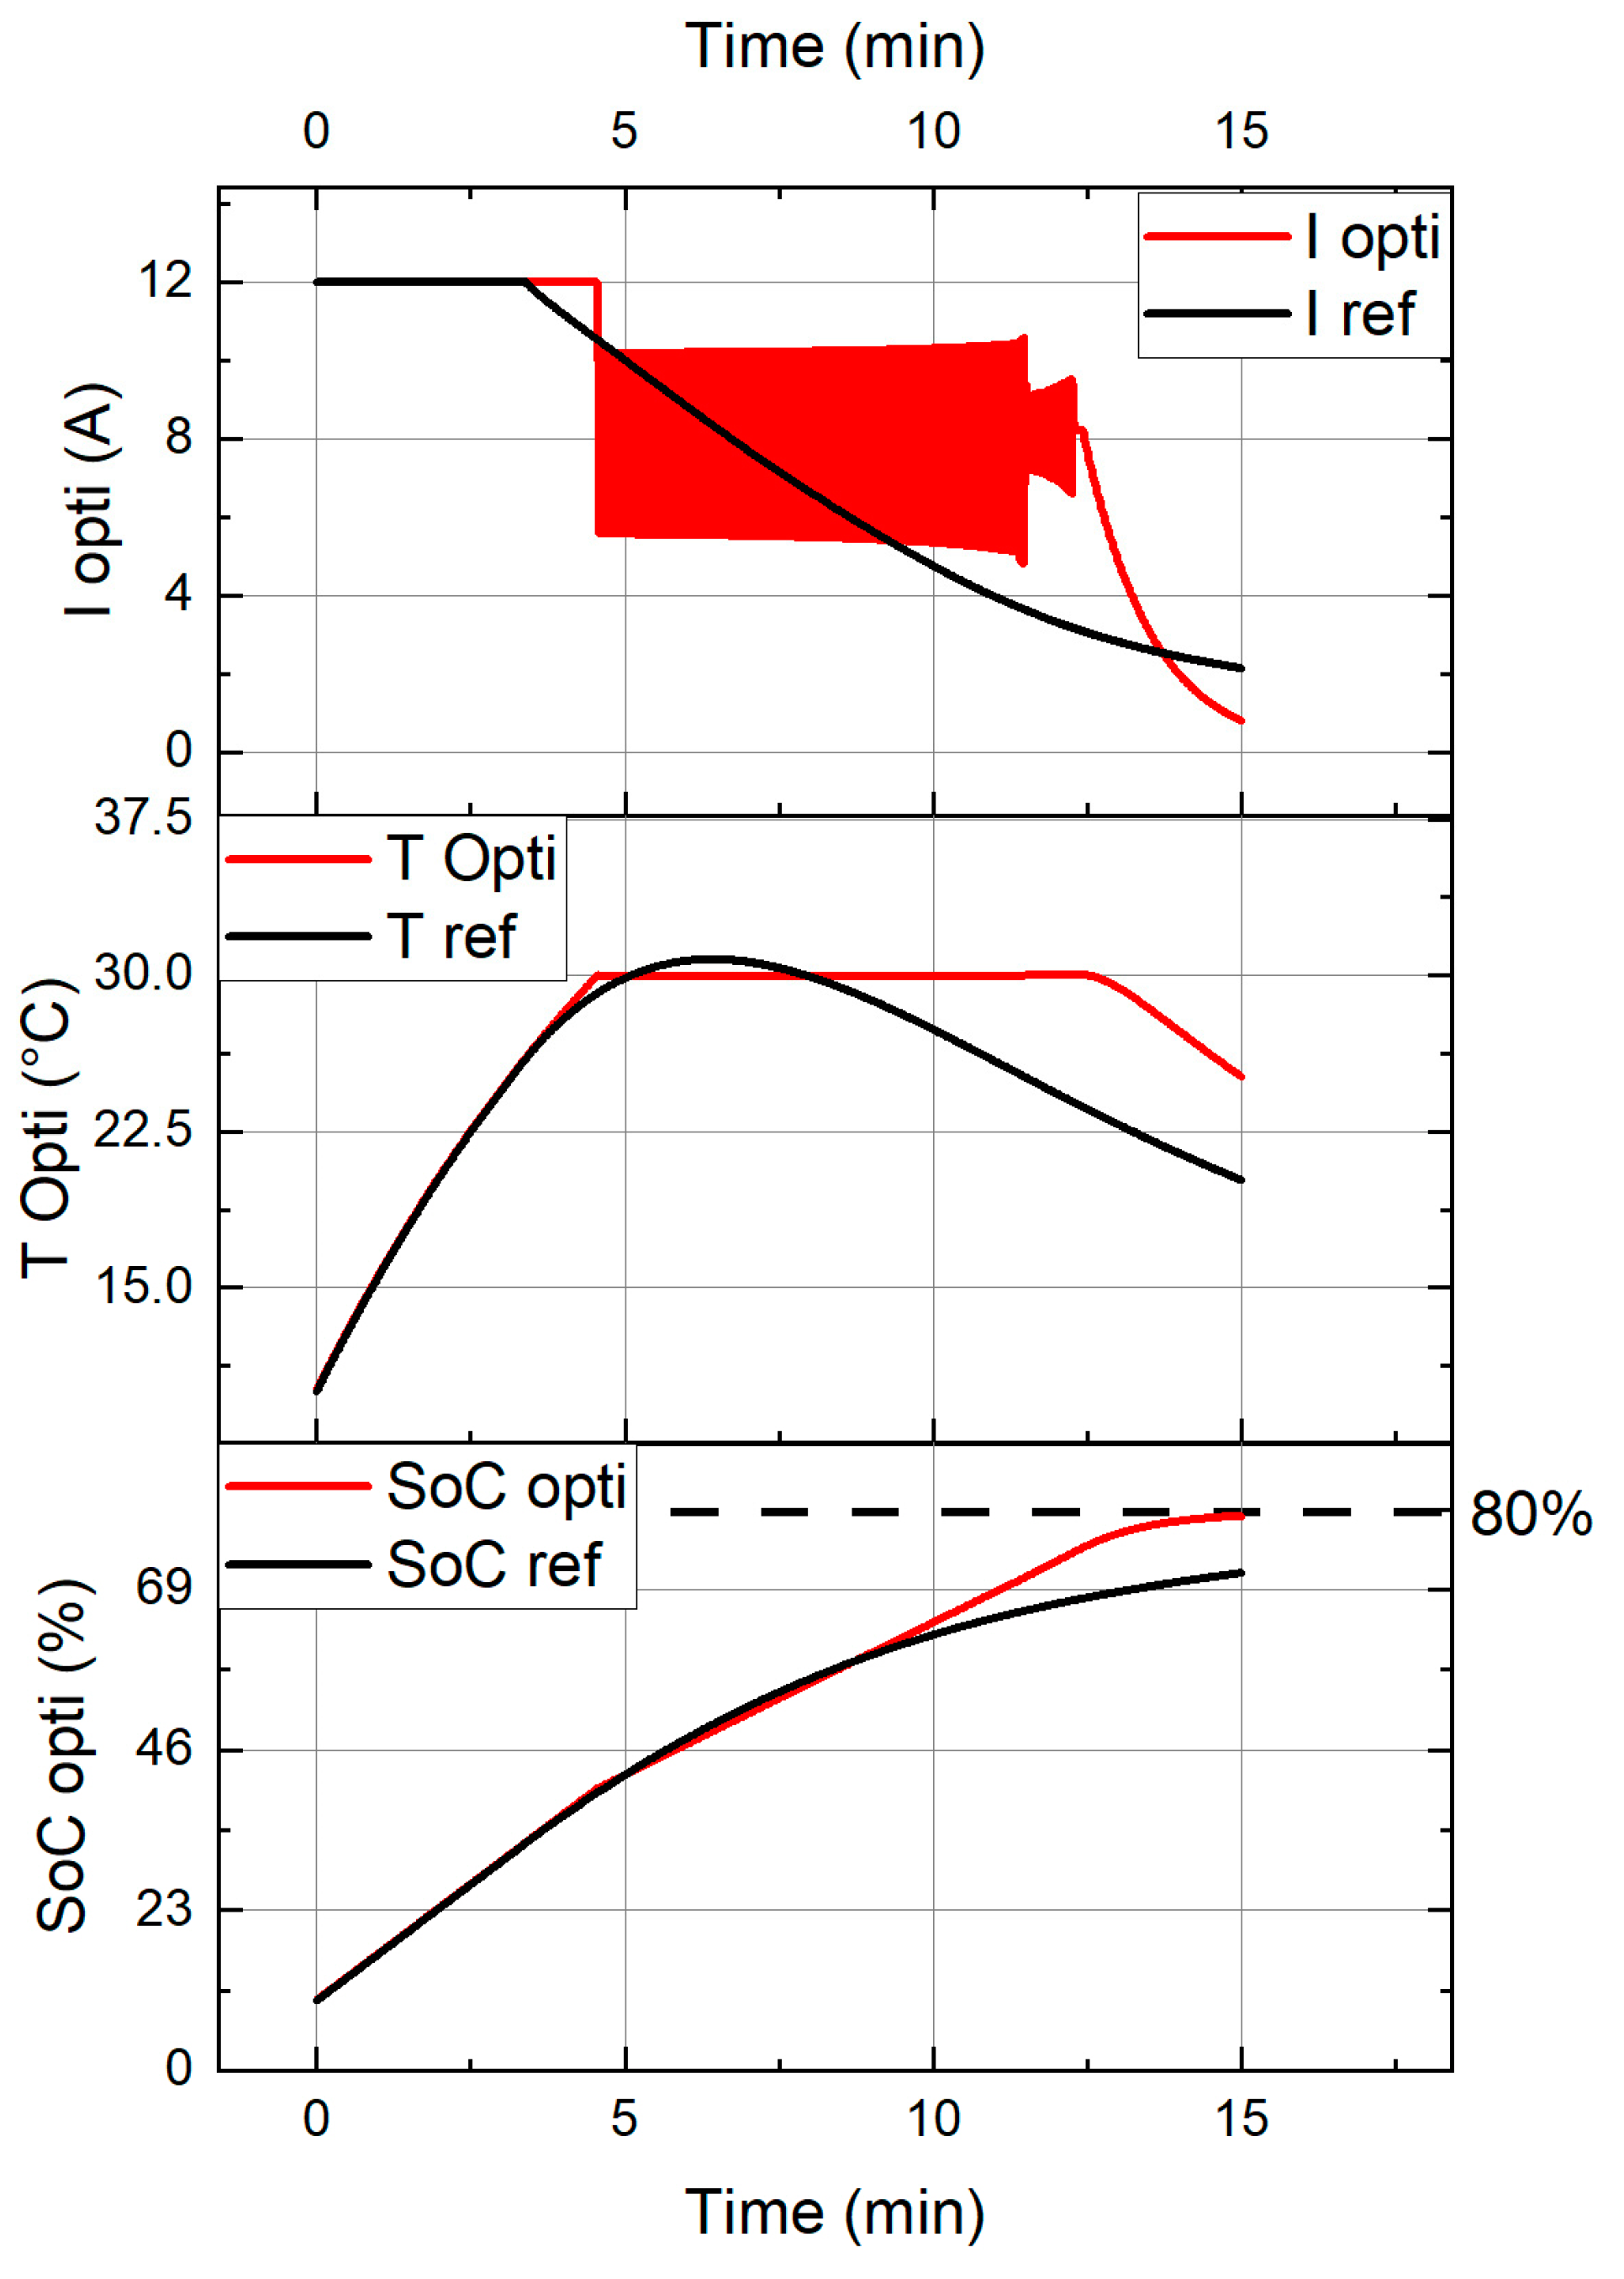
In the previous section, the MPC algorithm was configured for an ambient temperature of 25 °C. This section simulates the algorithm under cold temperature conditions, with both the initial cell temperature and ambient temperature set to 10 °C. The maximum allowable battery temperature is capped at 30 °C to ensure optimal battery performance, and the current limit is set to 12 A, reflecting the power limitations of battery systems operating in low-temperature environments [34]. Given the energy constraints imposed by cold temperatures, the algorithm prioritizes achieving the highest possible SoC while maintaining a safe temperature range.
Figure 12 illustrates the results obtained under low-temperature conditions. The optimized charging profile displays a three-phase charging pattern. Initially, a 4C (12 A) charging rate is applied for 4–5 min, followed by current oscillations between 5 A and 10 A to maintain the cell temperature at 30 °C. This section of the optimal current profile identified by the MPC alternates every second with an amplitude of 5 A. This high-frequency current switching is intended to maintain the cell’s temperature within a safe range while maximizing the SoC. However, this profile must be tested on a single cell to evaluate its feasibility.
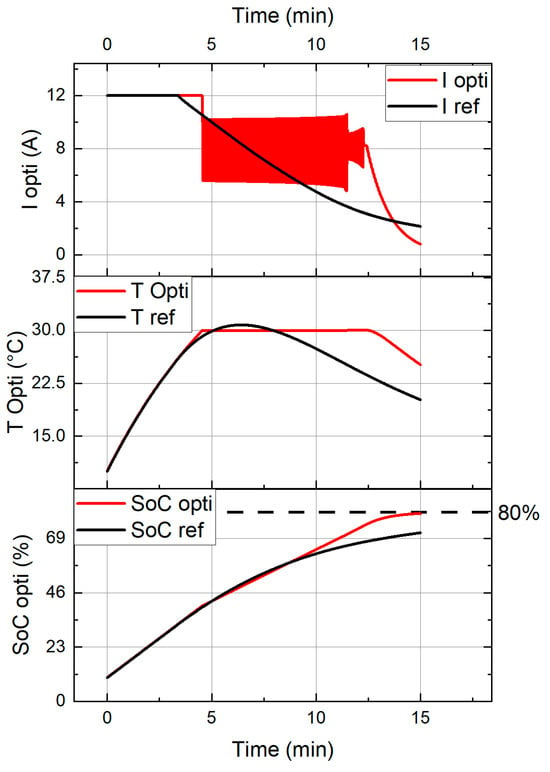
Figure 12.
MPC results of the optimal high-current phase at 10 °C.
Charging at a high frequency at low temperatures is a promising preconditioning method that helps to manage the thermal gradient more effectively, with a faster temperature rise, and ensures a more uniform temperature distribution within the cell [35,36,37]. This can enhance the overall performance and longevity of the battery by counting on the internal resistance of the cell to provoke self-heat generation [12]. Moreover, rapid switching can help mitigate lithium plating, which is more likely to occur at low temperatures and high current rates, thereby improving the safety and durability of the battery [38].
After 12 min, the current gradually decreases. This approach maintains the cell within an optimal temperature range while achieving an almost 80% SoC after 15 min, which was not feasible with the reference profile. By prioritizing maximum SoC, the MPC algorithm proposes a profile where the cell’s temperature is optimized at 30 °C, maximizing its capacity under these conditions.
6. Conclusions
This paper represents a significant advancement in optimizing fast-charging strategies for Li-ion batteries (LiBs) using MPC, emphasizing the delicate balance between SoC management and thermal safety. Initially, an NMC battery model was developed and rigorously validated using a single-resistance framework, demonstrating the efficacy of this simplified modeling approach.
Building from this model, a customized MPC system tailored for fast-charging applications was conceptualized and implemented. The results illustrate an optimized charging profile that enhances thermal performance with minimal compromise—extending the charging duration by just one minute compared to typical fast-charging profiles.
Crucially, the study shows that this optimized profile not only enables rapid charging but also maintains the cell temperature within the recommended 45 °C threshold. Moreover, in cold environments, the algorithm identified a current profile that kept the cell within an optimal temperature range, achieving nearly 80% SoC in 15 min, whereas the reference profile only reached 70% within the same timeframe.
This advancement has the potential to reduce the need for elaborate cooling/heating systems, offering significant savings in costs, weight, and volume in battery pack design. Future research will focus on the ageing aspect of the cells. Extensive lifetime studies will be conducted to assess the long-term impact of fast-charging strategies on cell durability and the impact on the optimal fast-charging profile. Moreover, efforts will be dedicated to studying the discharging effect and comparing the effectiveness of the methodology.
Further enhancements in battery modeling methodologies, potentially incorporating additional electrical parameters such as an RC loop, are also planned. Extreme temperature simulations of the model and MPC are also intended to expand the model’s capability. Ultimately, the goal is to scale up these findings to broader battery modules, aligning the research with practical applications in real-world scenarios.
Author Contributions
Conceptualization: J.J.; Data curation: J.J.; Formal analysis: J.J.; Funding acquisition: F.B.; Investigation: J.J.; Methodology: J.J.; Project administration: J.J.; Resources: J.J.; Software: J.J.; Supervision: A.D.; Validation: J.J.; Visualization: J.J.; Writing—original draft: J.J.; Writing—review and editing: J.J. and A.D. All authors have read and agreed to the published version of the manuscript.
Funding
This research received no external funding.
Data Availability Statement
The raw data supporting the conclusions of this article will be made available by the authors on request.
Acknowledgments
This study is supported by SOLiTHOR BV, a company located in Belgium.
Conflicts of Interest
The authors declare no conflicts of interest. All authors are employees of SOLiTHOR. The paper reflects the views of the scientists, and not the company.
References
- Armand, M.; Axmann, P.; Bresser, D.; Copley, M.; Edström, K.; Ekberg, C.; Guyomard, D.; Lestriez, B.; Novák, P.; Petranikova, M.; et al. Lithium-Ion Batteries–Current State of the Art and Anticipated Developments. J. Power Sources 2020, 479, 228708. [Google Scholar] [CrossRef]
- Martinez, W.H.; Leuven, K.U.; Suarez, C.; Martinez, W. Fast and Ultra-Fast Charging for Battery Electric Vehicles-A Review. In Proceedings of the IEEE Energy Conversion Congress and Exposition (ECCE), Baltimore, MD, USA, 29 September–3 October 2019. [Google Scholar]
- LaMonaca, S.; Ryan, L. The State of Play in Electric Vehicle Charging Services—A Review of Infrastructure Provision, Players, and Policies. Renew. Sustain. Energy Rev. 2022, 154, 111733. [Google Scholar] [CrossRef]
- Liu, S.; Liu, X.; Dou, R.; Zhou, W.; Wen, Z.; Liu, L. Experimental and Simulation Study on Thermal Characteristics of 18,650 Lithium–Iron–Phosphate Battery with and without Spot–Welding Tabs. Appl. Therm. Eng. 2020, 166, 114648. [Google Scholar] [CrossRef]
- Ouyang, D.; Weng, J.; Chen, M.; Wang, J. Impact of High-Temperature Environment on the Optimal Cycle Rate of Lithium-Ion Battery. J. Energy Storage 2020, 28, 101242. [Google Scholar] [CrossRef]
- Zhang, G.; Wei, X.; Han, G.; Dai, H.; Zhu, J.; Wang, X.; Tang, X.; Ye, J. Lithium Plating on the Anode for Lithium-Ion Batteries during Long-Term Low Temperature Cycling. J. Power Sources 2021, 484, 229312. [Google Scholar] [CrossRef]
- Ouyang, D.; Weng, J.; Chen, M.; Wang, J.; Wang, Z. Electrochemical and Thermal Characteristics of Aging Lithium-Ion Cells after Long-Term Cycling at Abusive-Temperature Environments. Process Saf. Environ. Prot. 2022, 159, 1215–1223. [Google Scholar] [CrossRef]
- Jaguemont, J.; Boulon, L.; Dubé, Y. A Comprehensive Review of Lithium-Ion Batteries Used in Hybrid and Electric Vehicles at Cold Temperatures. Appl. Energy 2016, 164, 99–114. [Google Scholar] [CrossRef]
- Lei, Z.-G.; Cheng-Ning, Z.; Li, J.-Q. Research on the Low Performance of Power Lithium-Ion Battery in Electric Vehicle. In Proceedings of the 2014 IEEE Conference and Expo Transportation Electrification Asia-Pacific (ITEC Asia-Pacific), Beijing, China, 31 August–3 September 2014. [Google Scholar]
- Senol, M.; Member, S.; Bayram, I.S.; Member, S. Electric Vehicles Under Low Temperatures: A Review on Battery Performance, Charging Needs, and Power Grid Impacts. IEEE Access 2023, 11, 39879–39912. [Google Scholar] [CrossRef]
- Ye, Z.; Fu, X.; Zhou, S. Research on Control Strategy of Rapid Preheating for Power Battery in Electric Vehicle at Low Temperatures. Appl. Therm. Eng. 2024, 245, 122770. [Google Scholar] [CrossRef]
- Hu, Z.; Liu, F.; Chen, P.; Xie, C.; Huang, M.; Hu, S.; Lu, S. Experimental Study on the Mechanism of Frequency-Dependent Heat in AC Preheating of Lithium-Ion Battery at Low Temperature. Appl. Therm. Eng. 2022, 214, 118860. [Google Scholar] [CrossRef]
- Inuzuka, S.; Shen, T.; Kojima, T. Dynamic Programming Based Energy Management of HEV with Three Driving Modes. IOP Conf. Ser. Mater. Sci. Eng. 2020, 715, 012063. [Google Scholar] [CrossRef]
- Padovani, T.M.; Debert, M.; Colin, G.; Chamaillard, Y. Optimal Energy Management Strategy Including Battery Health through Thermal Management for Hybrid Vehicles. IFAC Proc. Vol. 2013, 7, 384–389. [Google Scholar] [CrossRef]
- Park, S.; Ahn, C. Computationally Efficient Stochastic Model Predictive Controller for Battery Thermal Management of Electric Vehicle. IEEE Trans. Veh. Technol. 2020, 69, 8407–8419. [Google Scholar] [CrossRef]
- Choi, M.E.; Lee, J.S.; Seo, S.W. Real-Time Optimization for Power Management Systems of a Battery/Supercapacitor Hybrid Energy Storage System in Electric Vehicles. IEEE Trans. Veh. Technol. 2014, 63, 3600–3611. [Google Scholar] [CrossRef]
- Zhu, C.; Lu, F.; Zhang, H.; Mi, C.C. Robust Predictive Battery Thermal Management Strategy for Connected and Automated Hybrid Electric Vehicles Based on Thermoelectric Parameter Uncertainty. IEEE J. Emerg. Sel. Top. Power Electron. 2018, 6, 1796–1805. [Google Scholar] [CrossRef]
- Sony VTC6 Battery Technical Information. 2015. Available online: https://www.imrbatteries.com/content/sony_us18650vtc6-2.pdf (accessed on 24 June 2024).
- Berliner, M.D.; Jiang, B.; Cogswell, D.A.; Bazant, M.Z.B.; Braatz, R.D. Fast Charging of Lithium-Ion Batteries by Mathematical Reformulation as Mixed Continuous-Discrete Simulation. In Proceedings of the 2022 American Control Conference (ACC), Atlanta, GA, USA, 8–10 June 2022. [Google Scholar]
- Jaguemont, J.; Omar, N.; Abdel-Monem, M.; Van den Bossche, P.; Van Mierlo, J. Fast-Charging Investigation on High-Power and High-Energy Density Pouch Cells with 3D-Thermal Model Development. Appl. Therm. Eng. 2018, 128, 1282–1296. [Google Scholar] [CrossRef]
- Choe, S.-Y.; Li, X.; Xiao, M. Fast Charging Method Based on Estimation of Ion Concentrations Using a Reduced Order of Electrochemical Thermal Model for Lithium Ion Polymer Battery. In Proceedings of the EVS 2017—30th International Electric Vehicle Symposium and Exhibition, Stuttgart, Germany, 11 October 2017. [Google Scholar]
- Chin, C.S.; Gao, Z.; Zhang, C.Z. Comprehensive Electro-Thermal Model of 26650 Lithium Battery for Discharge Cycle under Parametric and Temperature Variations. J. Energy Storage 2020, 28, 101222. [Google Scholar] [CrossRef]
- Jalkanen, K.; Karppinen, J.; Skogström, L.; Laurila, T.; Nisula, M.; Vuorilehto, K. Cycle Aging of Commercial NMC/Graphite Pouch Cells at Different Temperatures. Appl. Energy 2015, 154, 160–172. [Google Scholar] [CrossRef]
- Wu, H.; Zhang, X.; Cao, R.; Yang, C. An Investigation on Electrical and Thermal Characteristics of Cylindrical Lithium-Ion Batteries at Low Temperatures. Energy 2021, 225, 120223. [Google Scholar] [CrossRef]
- Silva, L.I.; Jaguemont, J.; De Angelo, C.H.; Boulon, L. Modeling an Electric Vehicle Lithium-Ion Battery Pack Considering Low Temperature Behavior. In Proceedings of the 2016 IEEE Vehicle Power and Propulsion Conference (VPPC), Hangzhou, China, 17–20 October 2016. [Google Scholar] [CrossRef]
- Jaguemont, J.; Boulon, L.; Dubé, Y. Characterization and Modeling of a Hybrid-Electric-Vehicle Lithium-Ion Battery Pack at Low Temperatures. IEEE Trans. Veh. Technol. 2016, 65, 1–14. [Google Scholar] [CrossRef]
- He, H.; Xiong, R.; Fan, J. Evaluation of Lithium-Ion Battery Equivalent Circuit Models for State of Charge Estimation by an Experimental Approach. Energies 2011, 4, 582–598. [Google Scholar] [CrossRef]
- White, G.; Hales, A. Novel Methods for Measuring the Thermal Diffusivity and the Thermal Conductivity of a Lithium-Ion Battery. Appl. Therm. Eng. 2022, 212, 118573. [Google Scholar] [CrossRef]
- Wu, M.S.; Liu, K.H.; Wang, Y.Y.; Wan, C.C. Heat Dissipation Design for Lithium-Ion Batteries. J. Power Sources 2002, 109, 160–166. [Google Scholar] [CrossRef]
- Robinson, P.R.; Cima, D. Model-Predictive Control Fundamentals. In Springer Handbook of Petroleum Technology; Springer: Berlin/Heidelberg, Germany, 2017; Part F1; pp. 833–839. [Google Scholar] [CrossRef]
- Meng, J.; Yue, M.; Diallo, D. Nonlinear Extension of Battery Constrained Predictive Charging Control with Transmission of Jacobian Matrix. Int. J. Electr. Power Energy Syst. 2023, 146, 108762. [Google Scholar] [CrossRef]
- Li, Y.; Wik, T.; Huang, Y.; Zou, C. Nonlinear Inversion-Based Output Tracking Control for Battery Fast Charging. IEEE Trans. Control Syst. Technol. 2023, 32, 225–240. [Google Scholar] [CrossRef]
- Jia, G.; Cai, X. Fast Charging Strategy of Lithium-Ion Batteries with Thermal Safety Margin Based on Model Predictive Control. In Proceedings of the 2022 41st Chinese Control Conference (CCC), Hefei, China, 25–27 July 2022. [Google Scholar]
- Zhang, J.; Ge, H.; Li, Z.; Ding, Z. Internal Heating of Lithium-Ion Batteries Using Alternating Current Based on the Heat Generation Model in Frequency Domain. J. Power Sources 2015, 273, 1030–1037. [Google Scholar] [CrossRef]
- Bloomfield, A.P. A High Frequency Alternating Current Battery Heater for Military Vehicles. Master’s Thesis, University of Toledo, Toledo, OH, USA, 2011; pp. 10–27. [Google Scholar]
- Jiang, J.; Ruan, H.; Sun, B.; Wang, L.; Gao, W.; Zhang, W. A Low-Temperature Internal Heating Strategy without Lifetime Reduction for Large-Size Automotive Lithium-Ion Battery Pack. Appl. Energy 2018, 230, 257–266. [Google Scholar] [CrossRef]
- Kalogiannis, T.; Jaguemont, J.; Omar, N.; Van Mierlo, J.; Van Den Bossche, P. Internal Preheat Method for NMC Batteries at Cold Climate Conditions. In Proceedings of the 31st International Electric Vehicle Symposium & Exhibition and International Electric Vehicle Technology Conference (EVS31 & EVTeC 2018), Kobe, Japan, 30 September–4 October 2018. [Google Scholar]
- Abdel Monem, M.; Trad, K.; Omar, N.; Hegazy, O.; Mantels, B.; Mulder, G.; Van den Bossche, P.; Van Mierlo, J. Lithium-Ion Batteries: Evaluation Study of Different Charging Methodologies Based on Aging Process. Appl. Energy 2015, 152, 143–155. [Google Scholar] [CrossRef]


Disclaimer/Publisher’s Note: The statements, opinions and data contained in all publications are solely those of the individual author(s) and contributor(s) and not of MDPI and/or the editor(s). MDPI and/or the editor(s) disclaim responsibility for any injury to people or property resulting from any ideas, methods, instructions or products referred to in the content. |
© 2024 by the authors. Licensee MDPI, Basel, Switzerland. This article is an open access article distributed under the terms and conditions of the Creative Commons Attribution (CC BY) license (https://creativecommons.org/licenses/by/4.0/).