Article

Research on the Driving Behavior and Decision-Making of Autonomous Vehicles (AVs) in Mixed Traffic Flow by Integrating Bilayer-GRU-Att and GWO-XGBoost Models

1
School of Automobile & Rail Transportation, Tianjin Sino-German University of Applied Sciences, Tianjin 300350, China
2
School of Automobile, Chang’an University, Xi’an 710061, China
*
Authors to whom correspondence should be addressed.
World Electr. Veh. J. 2024, 15(8), 333; https://doi.org/10.3390/wevj15080333
Submission received: 30 June 2024 / Revised: 20 July 2024 / Accepted: 23 July 2024 / Published: 25 July 2024

Abstract

:
The continuous increase in the penetration rate of autonomous vehicles in highway traffic flow has become an irreversible development trend; in this paper, a novel hybrid prediction model of deep sequence learning and an integrated decision tree is proposed for human–machine mixed driving heterogeneous traffic flow scenarios, so as to realize the accurate prediction of the driving intention of the target vehicle in the traffic environment by autonomous vehicles (AVs). Firstly, the hybrid model uses the attention mechanism-based double-layer gated network model (Bilayer-GRU-Att) to effectively capture the time sequence dependence of the target vehicle’s driving state, and then accurately calculate its trajectory data in different prediction time-domains (tpred). Furthermore, the hybrid model introduces the eXtreme Gradient Boosting decision tree optimized by the Grey Wolf Optimization model (GWO-XGBoost) to identify the lane-changing intention of the target vehicle, because the prediction information of the future trajectory data of the target vehicle by the aforementioned Bilayer-GRU-Att model is properly integrated. The GWO-XGBoost model can accurately predict the lane-changing intention of the target vehicle in different prediction time-domains. Finally, the efficacy of this hybrid model was tested using the HighD dataset for training, validation, and testing purposes. The results of a benchmark analysis indicate that the hybrid model proposed in this paper has the best error evaluation index and balanced prediction time consuming index under the six prediction time-domains. Meanwhile, the hybrid model demonstrates the best classifying performance in predicting the lane-changing intentions of “turning left”, “going straight”, and “turning right” driving behaviors.

1. Introduction

Worldwide, with the rapid commercialization of autonomous driving and vehicle–road collaboration technologies in social open traffic environments, mixed traffic scenarios where autonomous vehicles and human-driven vehicles interact with each other are becoming a new normal, as discussed in detail by Andreotti et al. [1]. Human–machine mixed driving traffic flow has thus become an important part of the modern transportation system. For manned driving, the driver needs to make continuous and dynamic comprehensive judgments based on the external traffic environment, the operating state of the self-vehicle, and traffic regulations in order to make reasonable driving decisions in real-time. However, due to the driver’s driving style, driving skills, subjective cognition level, and other uncertain factors, the results of driving decisions may have certain limitations and risks, as reviewed by Singh and Kathuria [2] and analyzed by Jing et al. [3]. Based on objectively perceived external environment information, autonomous vehicles (AVs) can reasonably predict the movement trend of neighboring vehicles and make the optimal driving decision to follow or change lanes under multiple constraints to meet the needs of safety, economy, and ride comfort, as demonstrated by Yi et al. and Peng Y H et al. [4,5]. Automatic driving decision systems are mainly composed of vehicle trajectory planning and behavior decision technology modules, which are the technical base for AVs to achieve various driving tasks safely and efficiently. They have become important indicators to measure the development level of autonomous driving technology and are a hot topic in theoretical and technical research all over the world.
Ding Hua et al. [6] incorporated driving intention into the vehicle lane-changing trajectory prediction model and provided decision support for AVs by identifying the driver’s lane-changing intention. MorIDpour S et al. [7] proposed a lane-changing decision model with fuzzy logic to address the greater impact of the lane-changing behavior of heavy trucks on the surrounding traffic characteristics and obtained good results. Messaoud K et al. [8] proposed a vehicle trajectory prediction method with excellent performance in dealing with complex and dynamic traffic environments by introducing an attention mechanism; the model processes historical trajectory data through encoder–decoder architecture and utilizes the attention mechanism to weight different historical trajectory points in the decoding stage to obtain satisfactory prediction results. Do J et al. [9] proposed a model of lane-changing intention inference and trajectory prediction for vehicles in a freeway environment, which could accurately identify lane-changing intention and predict vehicle trajectory, thus improving the safety and response speed of AVs. Y. Wang et al. [10] proposed a decision planning method based on motivation and risk assessment, which can carry out real-time driving behavior decision-making and trajectory planning according to the current environment, improving efficiency and ensuring the safety of decision planning. Jeong Yonghwan [11] proposed a Recursive Neural Network (RNN) based on the Bi-LSTM model to make lane-changing decision for ego vehicles and trained and verified the proposed decision model through driving data collected by vision, a laser scanner, and the autonomous vehicle chassis sensor. Zhao Shuen et al. [12] proposed an interactive vehicle driving intention recognition and trajectory prediction model based on the Graph Neural Network (GNN); the model constructed the interaction graph between vehicles and learned the interaction information between vehicles by using the GNN, so as to realize the accurate recognition of driving intention and the prediction of future vehicle trajectory.
In summary, the adaptability of current research findings from around the globe to intricate traffic environments still needs enhancement. Many studies rely solely on single-property models utilizing traditional machine learning or deep learning methods, neglecting the beneficial integration of both approaches. Simultaneously, prevalent research often disregards the significance of different extended time-domain forecasting for driving intentions and its cohesive link to trajectory prediction, thereby impacting the model’s generalization and predictive precision. Additionally, the exploration of driving behaviors within mixed traffic flows remains inadequate, and the acquisition and validation of extensive micro-driving data samples require further investigation [13]. To address these limitations and elevate the comprehensive performance of predictive models, this paper proposes a hybrid prediction model dubbed Bilayer-GRU-Att_GWO-XGboost. This model integrates a vehicle trajectory prediction model (Bilayer-GRU-Att) and a lane-changing intention prediction model (GWO-XGboost). Tailored for highway scenarios, it captures real-time features and computes dynamic time windows to anticipate the driving status of target vehicles in the future time-domain based on interactive vehicular behaviors. To ascertain the model’s efficacy, the pre-processed German HighD dataset, grounded in real road conditions, is employed for model training, verification, and testing.

2. Model Framework

In this paper, the main function of the Bilayer-GRU-Att model is to accurately predict the future trajectory of the target vehicle; based on the prediction results from the Bilayer-GRU-Att model, the GWO-XGBoost model further predicts the lane-changing intention of the vehicle, thereby improving the prediction accuracy and robustness of the total autonomous driving decision system. The hybrid model can make full use of the spatio-temporal characteristics of vehicle trajectory data, accurately predict the trajectories of surrounding vehicles, and identify the lane-changing intention in real-time, so as to improve the system safety of the human–machine hybrid driving traffic environment. The logical structure diagram of the hybrid model is shown in Figure 1, and its working mechanism is as follows.
  • The Bilayer-GRU-Att model aims to capture and predict the dynamic behavior of vehicles in complex traffic environments and simulate the nonlinear dynamic characteristics of vehicles during driving. The model consists of four parts: the input layer, the Bilayer-GRU network (encoder–decoder), the attention mechanism layer (located between the first GRU and the second GRU) [14], and the fully connected layer for trajectory output. Firstly, the input layer performs filtering and standardization on the vehicle trajectory data, and reconstructs feature vectors including vehicle coordinates, longitudinal speed, lateral speed, longitudinal acceleration, lateral acceleration, and heading angle. Then, the Bilayer-GRU captures the contextual information in the time sequence through a double-layer Gated Recurrent Unit (GRU) network and completes the encoding and decoding process. Here, the attention mechanism simulates the ability of human drivers to quickly focus on key target information, prevents the loss of high-value information to make up for the shortcomings of traditional encoders in micro-lane-changing features, and thus improves the accuracy of trajectory prediction. Finally, through the fully connected layer, the model generates trajectory prediction results for future time steps.
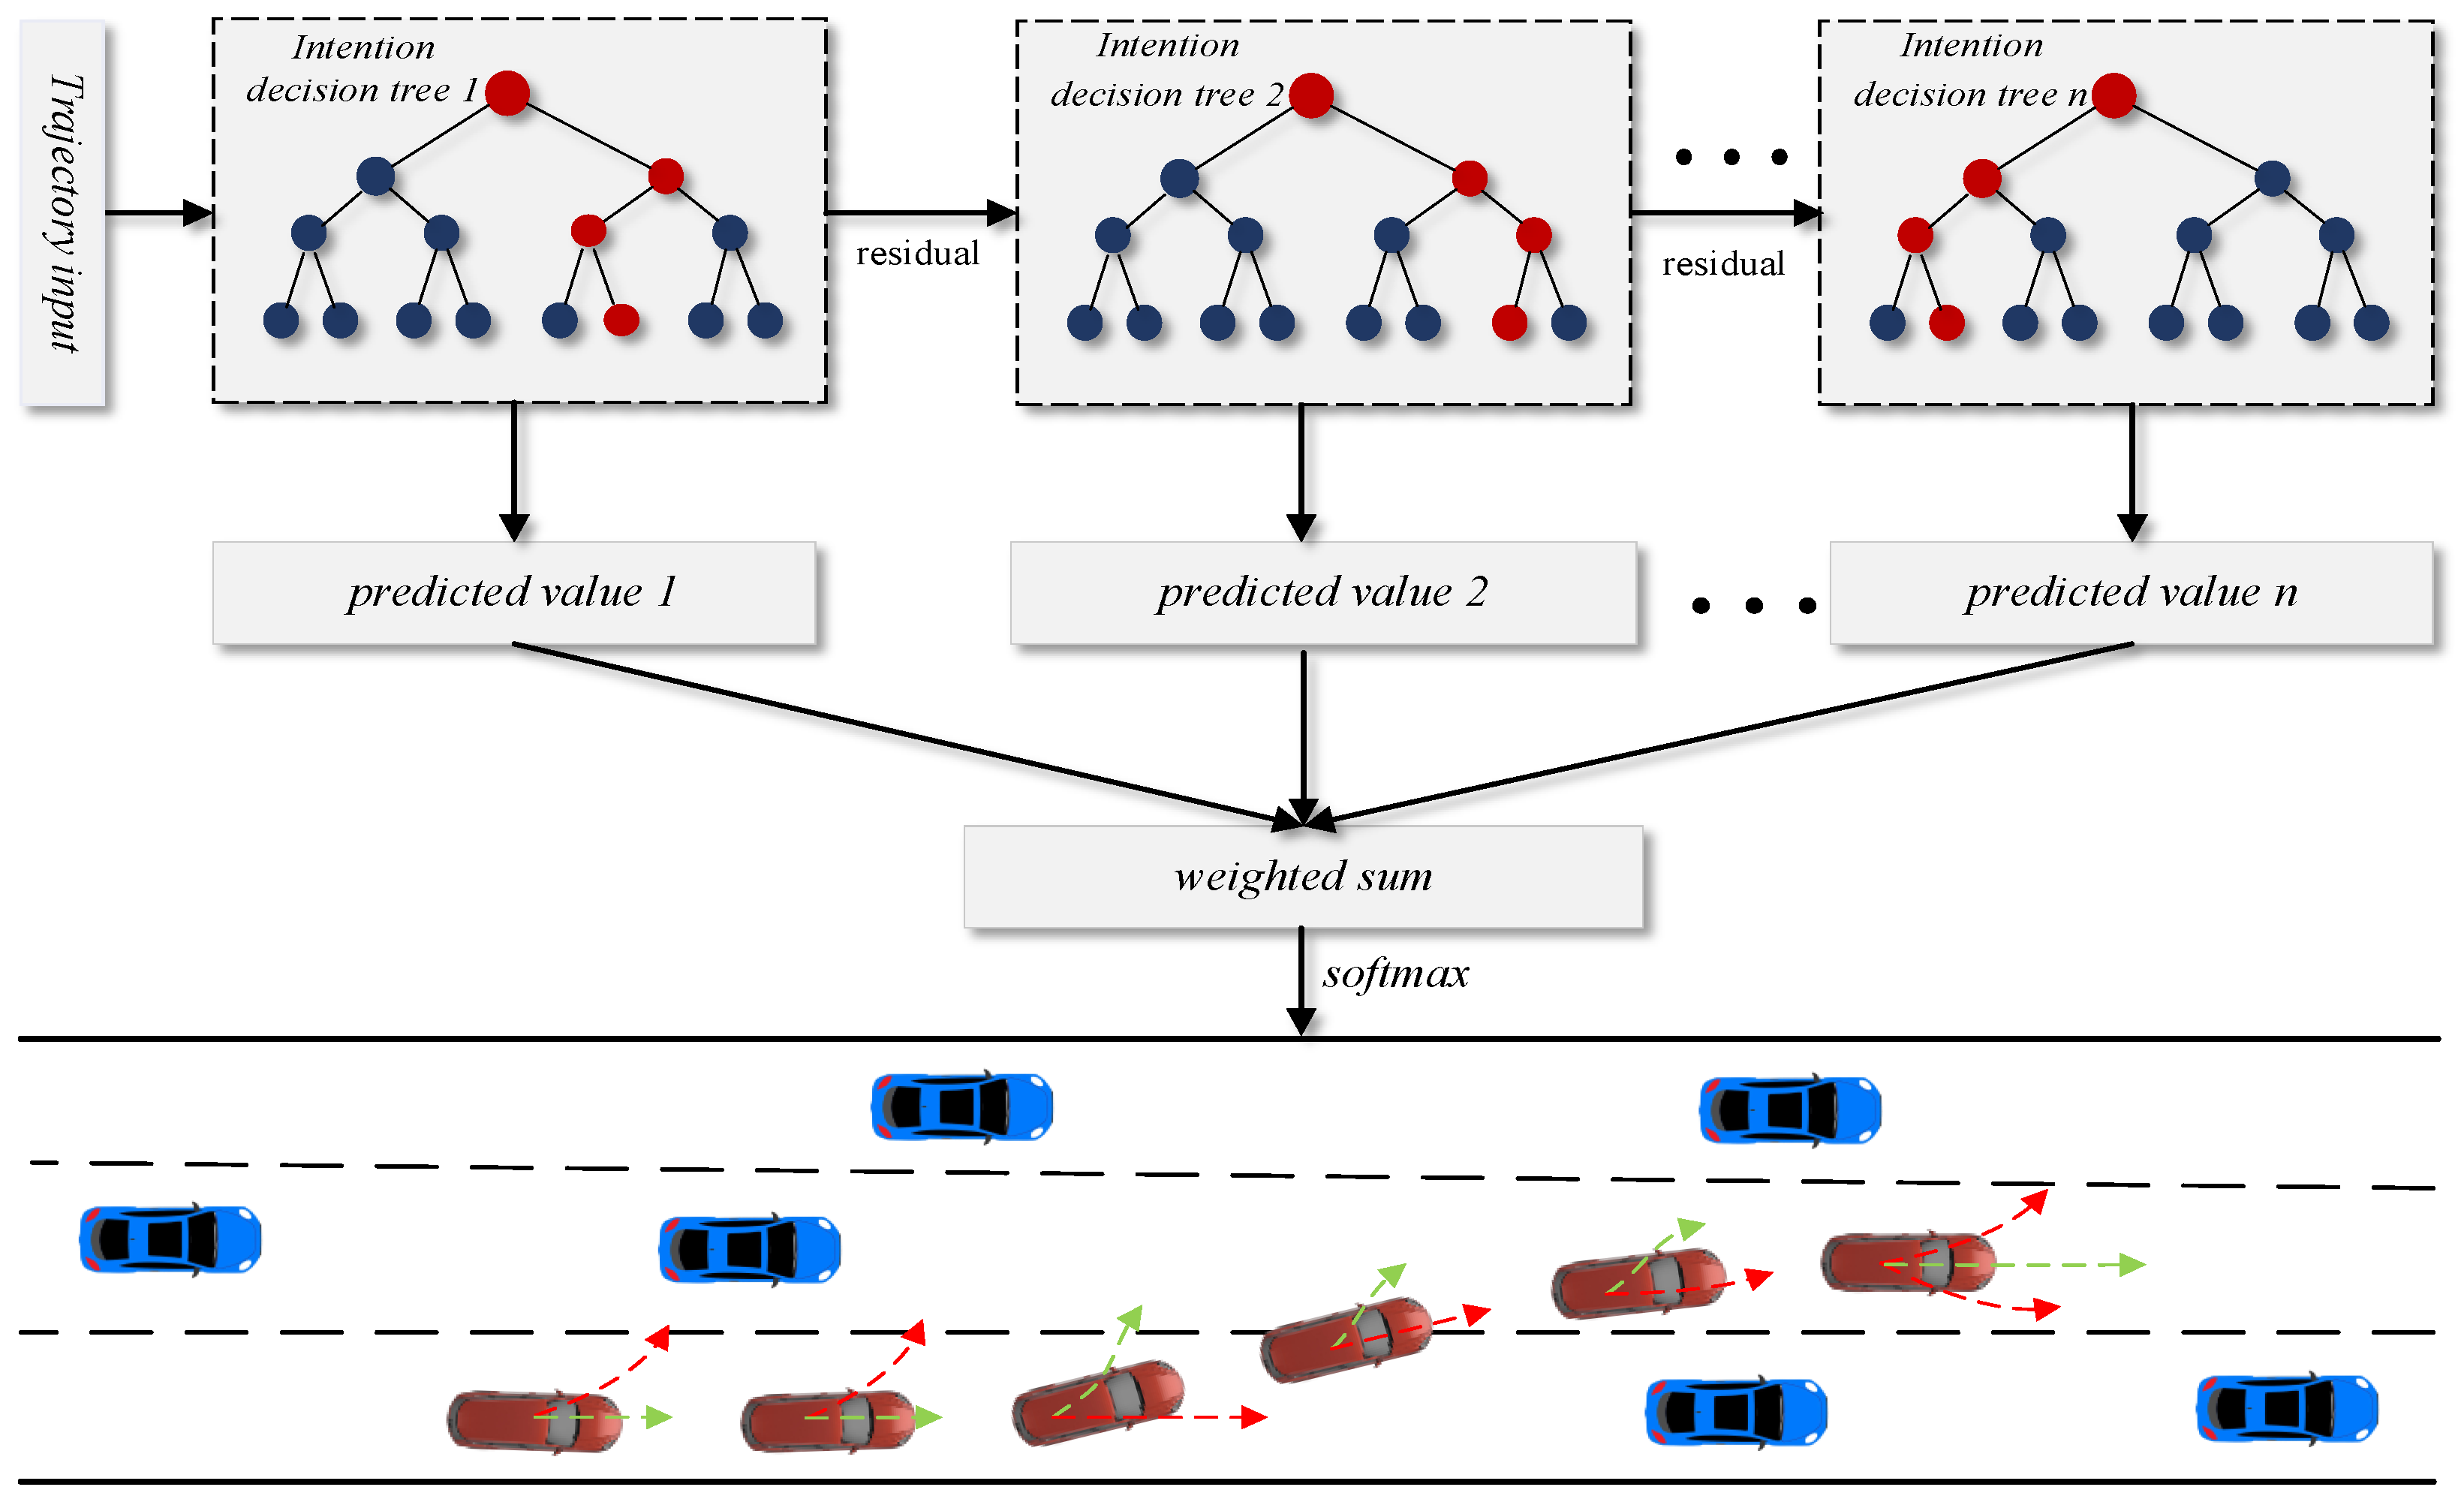
  • First, the GWO-XGBoost model further processes the trajectory prediction results generated by the Bilayer-GRU-Att model to extract the key features. Then, the feature splicing module fuses vehicle trajectory data in different prediction time-domains to generate input feature sets. Furthermore, the eXtreme Gradient Boosting model (XGBoost) [15] is optimized by the Grey Wolf Optimization model (GWO) [16], which is used to decode and judge these feature sets, so as to achieve the accurate identification of vehicle lane-changing intention. GWO optimization is used to improve the effectiveness of feature selection and the optimization of XGBoost parameters, thus enhancing the accuracy and robustness of recognition.

3. Data Preprocessing and Fragment Extraction

3.1. Data Source and Preprocessing

HighD is a natural vehicle trajectory dataset under the highway scenario [17], which is suitable for research about vehicle trajectory prediction, driving behavior analysis, and autonomous driving decision planning. Figure 2 is a schematic diagram of a collection section [17]. The total length of the collection section is 420 m, the sampling frequency is 25 Hz, and the collection includes vehicle ID information, vehicle external dimensions, vehicle coordinates, running speed, horizontal/longitudinal vehicle acceleration, and vehicle lane. The origin of the coordinate system of HighD data starts from the upper left, and the position of the vehicle is marked by the upper left end of the bounding box rather than the center point.
The traffic data recorded by the HighD dataset is captured by drones or other high-altitude equipment, which may include positioning errors, trajectory errors, measurement errors, etc. These errors may take on non-Gaussian characteristics due to the performance of the equipment, environmental factors (such as weather, changes in lighting) and dynamic blurring caused by vehicles moving at high speeds. In particular, in dynamic events such as vehicle acceleration or deceleration, emergency lane-changing, the noise of the data does not follow the standard Gaussian distribution but shows a complex long-tail or multi-modal distribution. Therefore, it is advisable to adopt non-Gaussian and nonlinear methods to process non-Gaussian dynamic noise in the HighD dataset. In this case, the particle filter [18] can better deal with the nonlinear and non-Gaussian characteristics of the data. The particle filter captures and estimates complex dynamic system states effectively by using a set of random samples to represent possible system states, and by resampling to adapt to actual observations. After processing the HighD dataset with the particle filter, the noise of the vehicle speed and acceleration data, which originally had high frequency characteristics, was obviously overcome, as shown in Figure 3.

3.2. Data Filtering

In order to obtain high quality data to train the model and exclude the interference of different types of vehicles to the model training, the data screening should follow the following principles.
  • The types of vehicles collected in the HighD data include cars and trucks. Because trucks are always on the right lane of the road during driving and the frequency of lane-changing is far less than that of cars, in order to truly reflect the lane-changing decision-making behavior of vehicles on the highway, the driving information of cars in the dataset is selected.
  • A total of 4191 sets of vehicle trajectory data are screened from the HighD dataset, including 2123 sets of lane-changing trajectories and 2068 sets of non-lane-changing trajectories. The selected data are collated and the vehicle driving information is recorded as discrete points, where the ordinate direction is the same as the driving direction of the vehicle. Table 1 shows some processed vehicle trajectory data from the HighD dataset, for the fourth vehicle driving in the positive direction of the y-axis, which changed lanes from the middle to the right, starting at 9:20 a.m. on Monday, October 2017.

3.3. Data Fragment Extraction

To further improve the accuracy of the lane-changing intention prediction, it is necessary to focus on the information of the starting and ending points of the vehicle trajectory. For a single lane-changing trajectory in the HighD dataset, the starting point of the lane-changing and the corresponding characterization parameters at the starting point need to be extracted. To avoid misjudgment and interference caused by small lateral displacements of the vehicle or continuous lane-changing on the starting point of the trajectory, the lateral displacement and trajectory curvature are used as criteria to determine whether the vehicle is changing lanes. For a single complete lane-changing process, the lateral displacement and trajectory curvature at the starting and ending points of the lane-changing should satisfy Equation (1).
L D y ( t + c t ) y ( t ) L + D k ( t + c t ) = k ( t ) k t 0
In Equation (1), y ( t ) is the lateral position of the vehicle at moment t ; c t is the lane-changing time; L is lane width; D is the lateral displacement offset; k ( t ) is the slope of the vehicle trajectory at time t ; and k t 0 is the slope threshold of the starting point of lane-changing.
It is necessary to divide the extracted trajectory fragments into three types and label them in terms of three classifications: “turning left”, “going straight”, and “turning right”. The method of determining the starting and end point of lane-changing in this paper is as follows: Firstly, the intersection point of the vehicle trajectory and lane line is defined as the lane-changing point; then, the slope k t = y t y t 4 x t x t 4 between the moment t , position ( x , y ) , and the moment t 4 position ( x t 4 , y t 4 ) on the vehicle trajectory is calculated. This calculation method can eliminate the problem that the slope difference between near points is not obvious due to the dense sampling frame number of the HighD dataset and the influence of noise; finally, the slope k j of each sampling point is traversed from the lane-changing point to the time axis in both positive and negative directions. If the trajectory sequence k j k t 0 has four consecutive sampling points, the position that reaches the threshold k n 0 for the first time is positioned as the starting point of the lane-changing, and the end point of the lane-changing is determined in the same way. Here, the continuous four-point confirmation is to avoid misjudgment caused by noise. The points between the start point and the end point of lane-changing are defined as the trajectory point of lane-changing, as shown in Figure 4.
At the same time, the sliding time window method is utilized to extract the trajectory sequence of the specified length, and 15 sampling nodes are updated forward each time, that is, the time step is 0.6 s. Let the length of the intercepted sequence be n sampling points; in this case, the information of ( n 15 ) sampling nodes in the adjacent two sequences is the same. The sliding time window method can maximize the use of data. The sampling frequency is 25 Hz, so if the time-domain of the input sequence is the length of the sliding time window, then the length of the trajectory sequence is 25 T L . If a trajectory sequence includes points of the lane-changing process, it is labeled as a lane-changing trajectory sequence; otherwise, it is labeled as a “going straight” trajectory sequence. The “turning left” or “turning right” trajectory sequence is determined by the horizontal coordinates of the starting and end point of the sequence. All trajectories are processed in above manner.

4. Vehicle Trajectory Prediction Model

In the context of human–machine hybrid driving traffic flow scenarios, AVs must autonomously perceive the driving information of surrounding vehicles, particularly key characteristics such as position, speed, acceleration, and heading angle. This perception is crucial for accurately and rapidly calculating the driving path of surrounding vehicles within a specific future prediction time-domain. By doing so, AVs can effectively anticipate potential risk factors in complex traffic environments, ultimately achieving the desired driving goals of safety, economy, and comfort.

4.1. Model Structure

Skilled drivers can adaptively pay attention to the key information of vehicles in the environment and adopt reasonable lane-changing decision-making behaviors. However, if the driving system of AVs solely relies on the encoder, it is difficult to provide microscopic lane-changing characteristics, and some high-value key information will be omitted, resulting in the inaccurate prediction of the lane-changing model for the trajectory sequence. In view of this, based on the Seq2Seq (sequence-to-sequence) sequence generation framework, this paper proposes the Bilayer-GRU-Att model for vehicle trajectory prediction, to simulate the behavioral characteristics of human drivers using limited attention resources to quickly focus on key target information, to capture and predict the nonlinear feature information of environmental vehicles in mixed traffic environments. The model consists of four parts: input layer, Bilayer-GRU network structure layer, Att structure layer, and trajectory output layer. The model logic is shown in Figure 5.

4.2. Bilayer-GRU-Att Model Mechanism

The input of the model is a series of continuous vehicle state vectors after pre-processing. Each state vector P r ( t ) represents vehicle dynamic information in time step t , including seven parameters: horizontal coordinate x ( t ) , longitudinal coordinate y ( t ) , lateral velocity v x ( t ) , longitudinal velocity v y ( t ) , lateral acceleration a x ( t ) , longitudinal acceleration a y ( t ) , and vehicle heading Angle C phi ( t ) ; the definition of P r ( t ) is shown in Equation (2).
P r ( t ) = [ x ( t ) , y ( t ) , v x ( t ) , v y ( t ) , a x ( t ) , a y ( t ) , C phi ( t ) ]

4.2.1. Coding Process

The first layer GRU network ( G R U ( 1 ) ) is responsible for the initial processing of the input sequence, which involves capturing the basic timing dependencies of the vehicle state. The output P r ( t ) of the extracted data preprocessing module is passed to G R U ( 1 ) . In this layer, G R U ( 1 ) is responsible for processing the feature tensor of each time step in the sequence and updating its internal hidden state in real-time. For each time step in the feature vector, G R U ( 1 ) will receive the input features of the current time step as well as the hidden state of the previous time step as joint inputs, and the update gate z t , i ( 1 ) , reset gate r t , i ( 1 ) , and candidate hidden layer state h ˜ t , i ( 1 ) are used to calculate and update the hidden state h t , i ( 1 ) of the current time step, so as to capture the timing dependence in the feature tensor and extract the lane-changing hierarchical relationship. Finally, the coding vector of a single time step P r ( t ) = [ x ( t ) , y ( t ) , v x ( t ) , v y ( t ) , a x ( t ) , a y ( t ) , C phi ( t ) ] is obtained; then, the h i ( 1 ) ( i = 1 , 2 , , t ) of G R U ( 1 ) output is obtained. The aforementioned calculation and iteration process is formulated as Equations (1)–(7) below.
z t , i ( 1 ) = σ ( W z ( 1 ) [ h t 1 , i ( 1 ) , P r ( t ) ] )
r t , i ( 1 ) = σ ( W r ( 1 ) [ h t 1 , i ( 1 ) , P r ( t ) ] )
h ˜ t , i ( 1 ) = tanh ( W h ( 1 ) [ r t , i ( 1 ) h t 1 , i ( 1 ) , P r ( t ) ] )
h t , i ( 1 ) = ( 1 z t , i ( 1 ) ) h t 1 , i ( 1 ) + z t , i ( 1 ) h ˜ t , i ( 1 )
In Equations (3)–(7), z t , i ( 1 ) is the update gate, which is used to control the inflow of information; r t , i ( 1 ) is the reset gate; for the candidate hiding state h ˜ t , i ( 1 ) , the input information P r ( t ) of the current moment is reserved for the hidden state h t 1 , i ( 1 ) of the previous moment; h t , i ( 1 ) is the hidden state of the current moment; W z ( 1 ) , W r ( 1 ) , W h ( 1 ) refer to the weight matrix; σ is a sigmoid function that changes the data to a value in the 0–1 range; and the tanh function changes the data to a value in the range [−1,1]. In order to improve the expression and generalization ability of the model, the nonlinear activation function LeakReLU is used to map the vehicle timing feature information extracted by the encoder to the deeper hidden feature space.

4.2.2. Att Model Mechanism

The Att structural layer is located between two layers of the GRU network, and is used to dynamically adjust the hidden state of the output of G R U ( 1 ) network. The Att model can “focus” on the correlation degree between the high-value key information in the vehicle feature at each historical moment and the current vehicle trajectory in real-time, so that the encoder hidden layer state with high correlation has a larger weight value, and the encoder hidden layer state with low correlation has a lower weight value.
Specifically, the degree of association between vehicle feature information and lane-changing trajectory at historical moments is analyzed to identify the feature that significantly contributes to trajectory prediction among vehicle features. Firstly, h t 1 , i ( 1 ) is weighted with h t , i ( 1 ) and the importance vector p t , i of specific parameters are calculated. The influence coefficient matrix e t , i of different vehicle feature attributes is obtained. Among them, the vector p t , i of the key feature attributes that have a great impact on the vehicle trajectory will be set to a higher value, and in this paper, it is considered that x ( t ) , y ( t ) , and C phi ( t ) have the greatest impact on vehicle trajectory. Then, softmax function normalization is used to obtain the influence coefficient matrix α t , i reflecting the different vehicle feature attributes, so as to achieve the accurate capture and effective use of the key vehicle features. Finally, the context vector C t of the current time step is calculated by the weighted summation of the attention weight α t , i and the hidden state h t , i ( 1 ) . The process of calculating is shown in Equations (8)–(10).
e t , i = V a tanh W a h t , i ( 1 ) + U a h t 1 , i ( 1 ) + W p a r a m p t , i + b a
α t , i = exp ( e t , i ) j = 1 k exp ( e t , k )
C t = α t , i h t , i ( 1 )
where e t , i is the influence coefficient; W p a r a m is the weight matrix, which is used to emphasize the importance of specific parameters (such as x ( t ) , y ( t ) , C phi ( t ) , etc.), to adjust the impact of p t , i . V a , W a , and U a refer to the feature weight matrix; b a is the network bias parameter; and k is the number of vehicle features.

4.2.3. Decoding Process

The second layer GRU network ( G R U ( 2 ) ) further processes timing information and integrates high-level features, firstly receiving a context vector C t as input from the A tt structure layer, which has fused G R U ( 1 ) ’s output and the adjustment of the attention mechanism, and containing rich timing and weighted feature information. The vehicle feature vector continues to be processed by G R U ( 2 ) in the order of time steps, and at each time step, it receives the hidden state from G R U ( 1 ) as an external input. Based on this input and its own hidden state of the previous time step, G R U ( 2 ) is able to capture higher-level time dependencies and patterns by updating the hidden state of the current time step through its internal control mechanism, which can capture higher levels of time dependencies and patterns. The process of calculating is shown in Equations (11)–(15).
R t , i ( 2 ) = h t , i ( 1 ) δ dropout ( 1 )
z t ( 2 ) = σ ( W z ( 2 ) [ h t 1 ( 2 ) , R t , i ( 2 ) ] )
r t , i ( 2 ) = σ ( W r ( 2 ) [ h t 1 , i ( 2 ) , R t , i ( 2 ) ] )
h ˜ t , i ( 2 ) = tanh ( W h ( 2 ) [ r t , i ( 2 ) h t 1 , i ( 2 ) , R t , i ( 2 ) ] )
h t , i ( 2 ) = ( 1 z t , i ( 2 ) ) h t 1 , i ( 2 ) + z t , i ( 2 ) h ˜ t , i ( 2 )
where δ dropout ( 1 ) is dropoutlayerz and is used to randomly discard the output of some GRU layer neurons in each training iteration to prevent overfitting and improve the generalization performance of the model. The definition of related parameters such as z t , i ( 2 ) , r t , i ( 2 ) , h ˜ t , i ( 2 ) , h t 1 , i ( 2 ) , h t , i ( 2 ) , W z ( 2 ) , and W h ( 2 ) are the same as that of G R U ( 1 ) .

4.2.4. Trajectory Output

In order to further improve the accuracy and flexibility of the trajectory prediction model, the nonlinear transformation is used to capture the complex mapping relationship, improve the prediction accuracy, and adjust the output dimension. In this paper, a fully connected layer (FCL) is located to the end of the G R U ( 2 ) to output the vehicle final trajectory prediction. Based on the information features of the G R U ( 2 ) output, the FCL contains seven input neurons, a single-layer hidden layer with 256 neurons, and seven output neurons. The ReLU function is adopted to enhance the nonlinear expression ability of the model. To further optimize the performance of the model, the root mean square error (RMSE) is selected as the main loss function, and the average displacement error (ADE) and final displacement error (FDE) are used as evaluation indexes to quantify the difference between the predicted and the actual trajectory, thereby improving the prediction accuracy and ensuring the robustness of the model.

5. Lane-Changing Intention Identification Model

5.1. Model Structure

Lane-changing intention prediction can significantly improve the driving safety and efficiency of AVs in complex traffic environments. By predicting the dynamic behavior of other vehicles, AVs can make corresponding driving strategy adjustments to avoid potential collision risks and improve road traffic capacity. The lane-changing intention prediction model, based on vehicle trajectory prediction data, will significantly enhance the perception and decision-making ability of AVs in the human–machine mixed traffic flow; for example, it can greatly improve the ability to predict the lane-changing intention of surrounding vehicles, accurately evaluate potential road safety risks, and adjust driving strategy and path planning in real-time. In this paper, a GWO-XGBoost model based on the combination of Grey Wolf Optimization model (GWO) and eXtreme Gradient Boosting model (XGBoost) is proposed to accurately predict vehicle lane-changing intentions. Specifically, the future vehicle trajectory output by the Bilayer-GRU-Att network I is combined with the original vehicle trajectory data (such as speed, position, acceleration, heading angle, etc.) to form the input feature set of the model. GWO is used to optimize and select the concatenated feature vector set, and the parameter configuration of XGBoost is adjusted to improve the prediction performance. In the model training stage, the model learns the mapping relationship between features and lane-changing behaviors through historical and predicted trajectory data. In the model prediction stage, the model assesses the current trajectory state of the vehicle according to the feature set, and outputs the prediction result of lane-changing intention.

5.2. Mechanism of GWO-XGBoost Model

XGBoost is an ensemble model of the Boosting class, which is trained by the superposition of several weak learners and has the characteristics of strong stability and excellent prediction performance. Its principle is to continuously fit the residual difference between the predicted result and the true value and iterate step by step until it meets the stop condition; finally, the weighted sum of all tree fitting results is obtained.
In this paper, integer coding is used to encode the lane-changing intention, which stipulates that the “turning left” driving behavior is “1”, the “going straight” driving behavior is “2”, and the “turning right” driving behavior is “3”. Then, in the probability distribution vector of the real lane-changing intention, the probability distribution of “turning left” can be defined as [1,0,0], “going straight” can be defined as [0,1,0], and “turning right” can be defined as [0,0,1].
XGBoost is utilized to train a decision tree for each lane-changing class. Take the training “turning left” lane-changing intention prediction as an example: the probability distribution of the initial prediction is y ^ ( 0 ) = [ 0 , 0 , 0 ] ; when the feature set I is entered into the first intent decision tree, the output which corresponds to the initial intent probability distribution is Ξ 1 = [ ξ 1 ( 1 ) , ξ 2 ( 1 ) , ξ 3 ( 1 ) ] , wherein, ξ 1 , ξ 2 , ξ 3 is the probability of “turning left”, “going straight”, and “turning right”, respectively. The first residual R ( 1 ) = [ 1 ξ 1 ( 1 ) , 0 ξ 2 ( 1 ) , 0 ξ 3 ( 1 ) ] of the probability distribution of the “turning left” lane-changing intention and Ξ 1 is calculated as the input to the second intention decision tree, to output the second residual prediction of intention probability Ξ 2 ; then, the residual R ( 2 ) of R ( 1 ) and Ξ 2 is calculated as the input of the third intention decision tree, to output the third residual prediction of intention probability Ξ 3 , and so on. Iterations are gradually produced until the maximum number of iterations is reached or the stopping conditions are met. The logical structure of the GWO-XGBoost model is shown in Figure 6.
In order to achieve better results in each iteration of the intention prediction model, the k-th intention probability residual is used as the objective function O b j k and the regular term is added to slow down the overfitting of the model. Let the number T of leaf nodes and the score of each leaf node be w j 2 ; then, the regular term is as follows:
Ω ( Ξ k ) = λ T + 1 2 γ j = 1 T w j 2
In Equation (16), λ and γ are the hyperparameters; in this case, the objective function is expressed as follows:
O b j k = arg min { i = 1 N C E l o s s y i , y ^ i ( k 1 ) + Ξ k ( x i ) + j = 1 k 1 Ω ( Ξ j ) + Ω ( Ξ k ) } = a r g min { i = 1 T i = 1 S j g i w x i + 1 2 ( i = 1 S j h i + γ ) w x j 2 2 + λ T }
In Equation (17), N is the total number of vehicle features and C E l o s s is the cross entropy loss function. Ξ k ( x i ) is the prediction result of lane-changing probability of the k t h intention decision tree and j = 1 k 1 W ( X j ) is the complexity of the ( k 1 ) t h tree, which is a constant. g i = y ^ i ( k 1 ) ( C E l o s s ( y i , y ^ i ( k 1 ) ) ) is the Taylor first-order expansion of the intent probability distribution y ^ i ( k 1 ) of order k 1 ; g i = y ^ i ( k 1 ) 2 ( C E l o s s ( y i , y ^ i ( k 1 ) ) ) is the Taylor second-order expansion of the intent probability distribution y ^ i ( k 1 ) of order k 1 ; and s j is the total number of vehicle features contained in leaf j . The results predicted by the intent prediction model are converted to 1 by the soft max function, and the probability values of the three types of lane-changing intentions are compared. The maximum value is the vehicle lane-changing intention.
When the XGBoost model is used for vehicle intent prediction, improper parameter settings will have a great impact on the model’s intent prediction results. Therefore, GWO, which has the advantages of fast search speed, ease of finding the global optimal solution, and strong stability, is selected to optimize the parameters of the XGBoost model. However, the XGBoost model is prone to falling into local optimal solutions. By using GWO to optimize hyperparameters such as the maximum number of iterations, tree depth, and learning rate of XGBoost, the accuracy of prediction results can be further improved.
Firstly, GWO model parameters a, A, and C are initialized, wherein a is the convergence factor and the initial value is 2 and A and C are cooperation coefficient vectors; the Wolf pack position is initialized, and the three wolves with the greatest fitness are denoted as α , β , and δ , respectively. Secondly, the position D and distance X of α , β , and δ are updated as follows:
D α t D β t D δ t = C α t X α t X t C β t X β t X t C δ t X δ t X t
X α t + 1 X β t + 1 X δ t + 1 = X α t X β t X δ t A α t A β t A δ t T D α t D β t D δ t
In Equations (18) and (19), C = 2 r 2 ; A = 2 a r 1 a ; and r 1 and r 2 are random numbers evenly distributed between [0,1].
Finally, according to the updated distance of α , β , and δ , the optimal value X t = X α t + X β t + X δ t 3 of the XGboost parameter at time t is updated, and the optimal solution is iteratively calculated until the requirements are met or the maximum number of iterations is reached.

6. Experiment and Analysis

6.1. Experimental Environment Configuration

The prediction model of this paper is trained on Windows 11, using MATLAB R2023b and the Deep Learning Toolbox 23.2 as the learning framework. The CPU is an Intel Xeon W-2295 and the GPU is an NVIDIA RTX A2000. The Adam optimizer is used, with a learning rate of 0.001, a dropout rate of 0.2, a batch size of 64, and the training is set for 500 epochs. In the total data used in this paper, there are 8133 sets of feature data for “turning left” driving behaviors, 80,666 sets of feature data for “going straight” driving behaviors, and 8389 sets of feature data for “turning right” driving behaviors.

6.2. Comparative Analysis of Models

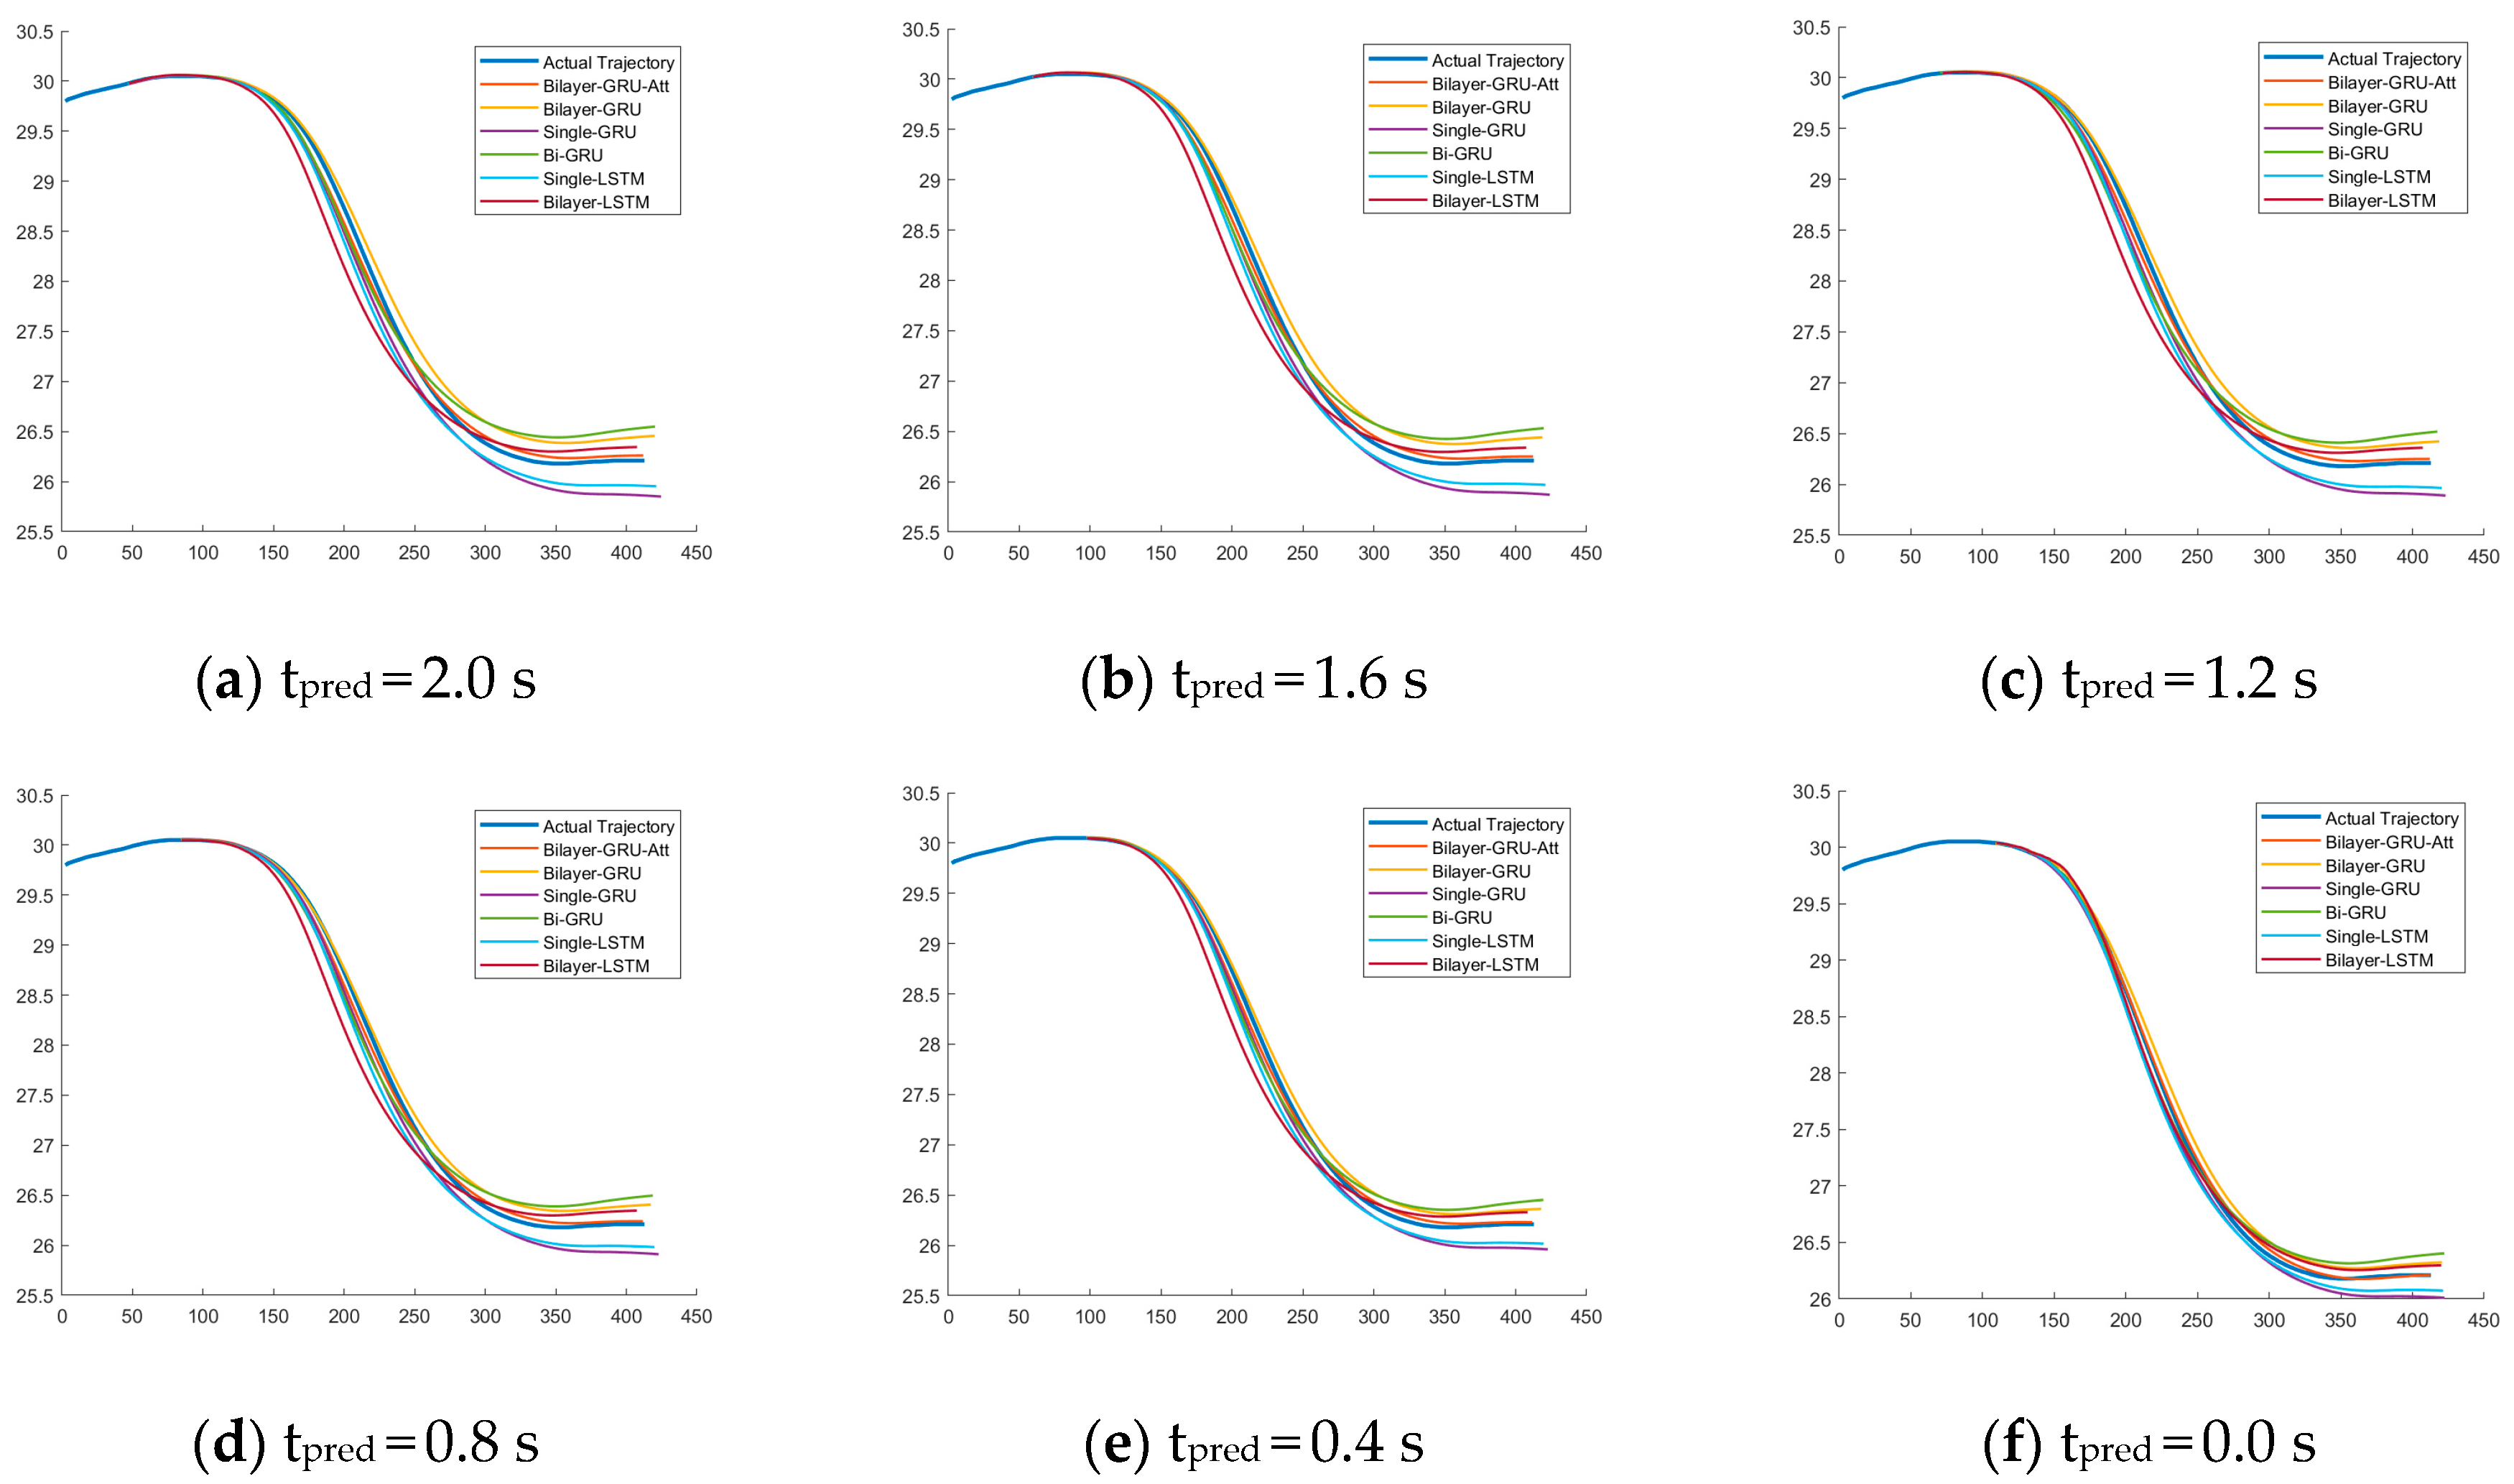
6.2.1. Comparison of Trajectory Prediction Models

To comprehensively evaluate the performance of the proposed Bilayer-GRU-Att model in vehicle trajectory prediction, we adopted longitudinal and lateral comparative validation methods. In the longitudinal comparative validation of this paper, taking the lane-changing point as the reference point, six different prediction time-domains (referred to as tpred in this paper) of 2.0 s, 1.6 s, 1.2 s, 0.8 s, 0.4 s, and 0.0 s were selected in reverse order of the vehicle’s travel direction to observe the prediction effects of the model at different tpred. In the lateral comparison, five mainstream trajectory prediction models were selected: Single-GRU [19], Bilayer-GRU [20], Bi-GRU [21], Single-LSTM [22], and Bilayer-LSTM [23]. A comparative analysis was conducted with the Bilayer-GRU-Att model using RMSE, ADE, and FDE as evaluation metrics.
In practical applications, the trajectory prediction module of AVs needs to have the ability to predict the future trajectory distribution of the target vehicle in real-time. To this end, the proposed Bilayer-GRU-Att model adopts a dynamic adjustment mechanism, which updates the input historical trajectory information at each sampling node to adaptively adjust the latest prediction results. To visualize this dynamic adjustment process, a typical “turning left” lane-changing trajectory sequence from the test set was selected. Figure 7 shows the trajectory distribution prediction and real-time changes in RMSE/ADE for the target vehicle by each comparison model at the six tpred (2.0 s, 1.6 s, 1.2 s, 0.8 s, 0.4 s, 0.0 s), which can intuitively reflect the real-time positional relationship between the true trajectory and the predicted trajectory of the target vehicle. Based on the intuitive comparison and analysis of six tpred graphs, we can clearly observe that the Bilayer-GRU-Att model predicted curve has the best fit with the true historical trajectory of the vehicle, reflecting that the model’s prediction results are closest to the actual situation.
In the evaluation indexes of real-time trajectory prediction, both the RMSE and ADE are used to measure the average difference between the predicted and the real trajectory; the results show that they are essentially equivalent. The error information and prediction time information of various predicting models under different tpred are shown in Table 2 and Figure 8. The RMSE, ADE, and FDE indexes of each prediction model in different time-domains are compared, which is helpful for comprehensively evaluating the performance of the model, and the prediction time consuming (referred to as PTC in this paper) indexes are helpful to make a balance between accuracy and efficiency.
As can be seen from Table 2 and Figure 8, the RMSE, ADE, and FDE index values of all trajectory predicting models show an upward trend with the increase in tpred value, indicating that the prediction difficulty increases with the increase in time. However, the Bilayer-GRU-Att model demonstrated significant superiority across different tpred values. Specifically, within a shorter tpred (e.g., tpred = 0.0 s), the Bilayer-GRU-Att model exhibited the lowest RMSE, ADE, and FDE, reflecting remarkable prediction accuracy. Even during a longer tpred (e.g., tpred = 0.4 s), this model maintained relatively low error values with a more gradual increase, showcasing impressive prediction stability. In contrast, other models, particularly the single-layer structures of the Single-GRU and Single-LSTM models, showed a steeper error escalation as the prediction time extended. In summary, the Bilayer-GRU-Att model stands out for its evident precision and stability advantages in vehicle trajectory prediction.
Among the six predictive models, the Bilayer-GRU-Att and BiLayer-GRU models exhibit superior performance, significantly outperforming the other four models in various metrics, balancing excellent prediction accuracy with a relatively low PTC index. The advantages of the Bilayer-GRU-Att model are more pronounced: Firstly, its PTC falls between the 25th and 50th percentiles of these six models and is close to the median, indicating the good computational efficiency of the model. Secondly, the model combines lane-changing intention prediction results with the Att model, making it the most outstanding in vehicle trajectory prediction tasks. With its high prediction accuracy and low prediction deviation, it most vividly “reconstructs” the actual driving trajectory of the target vehicle in a real traffic flow, enhancing the driving safety of AVs in high-speed traffic flow environments.

6.2.2. Comparison of Lane-Changing Decision Models

Early traditional research on lane-changing intention prediction mainly focused on the use of physical or rule-based models [24], hypothesized the applicability of physical models, and used the Kalman filter [25], Bayes [26], decision tree [27], support vector machine [28], random forest [29], and other models to predict vehicle lane-changing intention. These methods estimate the future motion state of the target vehicle through its dynamic behavior changes over time. However, in long time-domain predictions, the error of vehicle lane-changing intention prediction based on physical or rule models will increase because the uncertainty of the vehicle trajectory will be greatly increased.
The performance of the lane-changing intention prediction module directly impacts the quality of trajectory prediction. To evaluate the performance of the proposed GWO-XGBoost model, this paper compared it with two commonly used benchmark models: the Extreme Learning Machine (ELM) [30] and the Back Propagation Neural Network (BP) models [31]. The comparison was conducted based on their performance metrics, including precision rate (the ratio of correctly classified positive samples to the total samples classified as positive by the classifier), recall rate (the ratio of correctly classified positive samples to the total actual positive samples), F1 score (the harmonic mean of precision and recall), and accuracy rate (the ratio of correctly classified samples to the total number of samples). Taking a sliding time window of TL = 3 s as an example, this paper conducted a comparative analysis of the lane-changing intention performance of the three models: GWO-XGBoost, ELM, and BP. Table 3 presents the confusion matrix for intention recognition, and Table 4 shows the performance test results of these three intention recognition models.
As can be seen from Table 3, the lane-changing intention recognition module GWO-XGBoost presents better prediction performance than the traditional ELM and BP models in terms of the prediction of three types of lane-changing intentions: “turning left”, “going straight”, and “turning right”. Through a comparative analysis, the GWO-XGBoost model is superior to the comparison models in key evaluation index values such as precision rate, recall rate, F1 score, and accuracy rate.
  • Prediction of “turning left” driving intention: GWO-XGBoost also performed well in identifying “turning left” driving intentions. The precision rate, recall rate, F1 score improved by 31.69%, 4.48%, and 18.55%, respectively, compared with ELM. Compared with the BP model, these indexes are also significantly improved by 18.44%, 3.40%, and 11.17%, respectively.
  • Prediction of “going straight” driving intention: GWO-XGBoost has excellent performance in “going straight” driving intention prediction. Compared with ELM, its precision rate is improved by 0.91%, recall rate is improved by 3.08%, and F1 score is improved by 1.99%. Compared with BP, the precision rate, recall rate, and F1 score also increased by 0.30%, 1.79%, and 1.05%, respectively.
  • Prediction of “turning right” driving intention: The GWO-XGBoost also demonstrated excellent performance in “turing right” driving intent prediction. The precision rate, recall rate, and F1 score improved by 11.66%, 9.38%, and 10.52%, respectively, compared with ELM. Compared with BP, the improvement of these indicators also reached 6.53%, 3.46%, and 5.00%, respectively.
Through a comparative analysis, GWO-XGBoost has excellent performance in the prediction of three types of intentions: “turning left”, “going straight”, and “turning right”, and its performance is significantly better than the traditional ELM and BP models. Therefore, in practical applications, GWO-XGBoost is expected to significantly improve the accuracy and robustness of vehicle intent recognition, thereby enhancing the quality and efficiency of driving behavior decision-making for AVs.
According to the relevant literature, the lane-changing time in the expressway environment is generally between 3.5 s and 6.5 s, and a complete lane-changing process can be realized in 5 s on average [32]. The intention recognition model can “observe” the road condition and “understand” the changing law of the traffic environment from the point of view of the target vehicle and make a reasonable prediction in advance. Now, a representative complete trajectory sequence of the left transition lane is selected from the test set (the 9th vehicle in the positive direction of the Y axis starting at 16:18 on Thursday, September 2017), and the lane-changing intention prediction model proposed in this paper is applied to conduct the real-time dynamic recognition of the driving behavior of the target vehicle, as shown in Figure 9. When the target vehicle drives to the position 3.5 s away from the lane-changing point, the GWO-XGBoost model predicts that the vehicle will take the “turning left” driving behavior. At this time, the probability of the “turning left” ξ 1 starts to rise rapidly, but it does not reach 85% of the conviction threshold, so only the three types of probabilities obtained Ξ = ( ξ 1 , ξ 2 , ξ 3 ) by the layer Softmax are output. When the target vehicle travels to the position 3 s away from the lane-changing point, the model recognizes that the probability of “turning left” has exceeded 85% and adjusts the corresponding probability to 1. At this time, the probabilities of “turning left”, “going straight”, and “turning right” of the output of GWO-XGBoost are Ξ = ( 1 , 0 , 0 ) , and the trajectory output module only outputs one type of position distribution. When the target vehicle reaches the end of lane-changing, the prediction of the “turning left” intention decreases rapidly to 0, the probability ξ 1 of “going straight” intention increases rapidly to 1, and the probability returns to the initial state Ξ = ( 0 , 1 , 0 ) .

7. Summary

This paper presents a novel hybrid prediction model that seamlessly integrates a vehicle trajectory prediction module (Bilayer-GRU-Att) and a lane-changing intention recognition module (GWO-XGboost). Specifically, this model helps AVs identify potential risk factors in advance, making more reasonable driving decisions and reducing the occurrence of collision accidents. Meanwhile, by optimizing the driving path of vehicles, the traffic capacity of roads can be improved, and traffic congestion can be alleviated. Several key findings and conclusions can be drawn from this study.
  • The Bilayer-GRU-Att module proposed here exhibits a remarkable ability to capture and analyze the dynamic evolution of the traffic environment in real-time. This capability enables the system to accurately predict the driving state of the target vehicle across different tpred. The module demonstrates superior performance in trajectory prediction, achieving the best prediction error evaluation when compared to benchmarking models.
  • The GWO-XGboost module significantly enhances the predictability and accuracy of lane-changing intention recognition. By incorporating information from the Bilayer-GRU-Att module, the GWO-XGboost model effectively decodes and judges feature sets, resulting in the accurate identification of vehicle lane-changing intentions. This integrated approach not only improves the effectiveness of feature selection but also optimizes XGBoost parameters, thereby enhancing the overall accuracy and robustness of the recognition system.
  • The experimental results obtained using the real-world HighD dataset further validate the effectiveness of the proposed hybrid prediction model. The models’ performance in mixed human–machine traffic scenarios is particularly noteworthy, highlighting its potential for enhancing system safety in complex driving environments.
However, it is important to acknowledge the limitations of this study. The model was trained primarily on driving data from straight highway segments, which inherently restricts its applicability to a wider range of road conditions and traffic scenarios. Future research efforts will be directed towards exploring diverse traffic settings and incorporating the dynamic characteristics of both commercial and passenger vehicles. By expanding the scope of the training dataset and refining the model’s structure and parameters, we aim to enhance its generalization ability and adaptability, ultimately leading to safer and more efficient autonomous driving systems.

Author Contributions

Conceptualization, L.W. and Z.G.; methodology, L.W.; software, J.L.; validation, J.Z. and L.W.; formal analysis, L.W.; investigation, J.L.; resources, Z.G.; writing—original draft preparation, L.W.; writing—review and editing, Z.G.; visualization, J.L.; project administration, J.Z.; funding acquisition, L.W. All authors have read and agreed to the published version of the manuscript.

Funding

This research was funded by Tianjin Transportation Technology Development Plan Project grant number 2022-32 and 2023-7.

Data Availability Statement

The original contributions presented in the study are included in the article, further inquiries can be directed to the corresponding author.

Conflicts of Interest

The authors declare no conflict of interest.

References

  1. Andreotti, E.; Boyraz, P.; Selpi, S. Mathematical definitions of scene and scenario for analysis of automated driving systems in mixed-traffic simulations. IEEE Trans. Intell. Veh. 2020, 6, 366–375. [Google Scholar] [CrossRef]
  2. Singh, H.; Kathuria, A. Analyzing driver behavior under naturalistic driving conditions: A review. Accid. Anal. Prev. 2021, 150, 105908. [Google Scholar] [CrossRef] [PubMed]
  3. Jing, L.; Shan, W.; Zhang, Y. Risk preference, risk perception as predictors of risky driving behaviors: The moderating effects of gender, age, and driving experience. J. Transp. Saf. Secur. 2023, 15, 467–492. [Google Scholar] [CrossRef]
  4. Yi, B.; Bender, P.; Bonarens, F.; Stiller, C. Model predictive trajectory planning for automated driving. IEEE Trans. Intell. Veh. 2018, 4, 24–38. [Google Scholar] [CrossRef]
  5. Peng, Y.H.; Jiang, M.; Ma, Z.Y.; Zhong, C. Research progress of key technologies of automobile automatic driving. J. Fuzhou Univ. 2021, 49, 691–693. [Google Scholar]
  6. Ding, H.; Xingxing, S.; Lai, L. Study on lane change trajectory prediction considering driving intention. Agric. Equip. Veh. Eng. 2023, 61, 1–6. [Google Scholar]
  7. Moridpour, S.; Sarvi, M.; Rose, G.; Mazloumi, E. Lane-changing decision model for heavy vehicle drivers. J. Intell. Transp. Syst. 2012, 16, 24–35. [Google Scholar] [CrossRef]
  8. Messaoud, K.; Yahiaoui, I.; Verroust-Blondet, A.; Nashashibi, F. Attention based vehicle trajectory prediction. IEEE Trans. Intell. Veh. 2020, 6, 175–185. [Google Scholar] [CrossRef]
  9. Do, J.; Han, K.; Choi, S.B. Lane change–intention inference and trajectory prediction of surrounding vehicles on highways. IEEE Trans. Intell. Veh. 2023, 8, 3813–3825. [Google Scholar] [CrossRef]
  10. Wang, Y.; Wang, C.; Zhao, W.; Xu, C. Decision-Making and Planning Method for Autonomous Vehicles Based on Motivation and Risk Assessment. IEEE Trans. Veh. Technol. 2021, 70, 107–120. [Google Scholar] [CrossRef]
  11. Jeong, Y. Predictive lane change decision making using bIDirectional long shot-term memory for autonomous driving on highways. IEEE Access 2021, 9, 144985–144998. [Google Scholar] [CrossRef]
  12. Zhao, S.; Su, T.; Zhao, D. Interactive vehicle driving intention recognition and trajectory prediction based on graph neural network. Automob. Technol. 2023, 7, 24–30. [Google Scholar]
  13. Yang, Y.; Gao, K.; Cui, S.; Xue, Y.; Najafi, A.; Andric, J. Data-driven rolling eco-speed optimization for autonomous vehicles. Front. Eng. Manag. 2024, 1–13. [Google Scholar] [CrossRef]
  14. Niu, Z.; Zhong, G.; Yu, H. A review on the attention mechanism of deep learning. Neurocomputing 2021, 452, 48–62. [Google Scholar] [CrossRef]
  15. Chen, T.; Guestrin, C. Xgboost: A scalable tree boosting system. In Proceedings of the 22nd ACM Sigkdd International Conference on Knowledge Discovery and Data Mining, San Francisco, CA, USA, 13–17 August 2016; pp. 785–794. [Google Scholar]
  16. Zhang, X.; Wang, X. Research Review of Grey Wolf Optimization Algorithm. Comput. Sci. 2019, 46, 30–38. [Google Scholar]
  17. Krajewski, R.; Bock, J.; Kloeker, L.; Eckstein, L. The highd dataset: A drone dataset of naturalistic vehicle trajectories on german highways for valIDation of highly automated driving systems. In Proceedings of the 2018 21st IEEE International Conference on Intelligent Transportation Systems (ITSC), Maui, HI, USA, 4–7 November 2018; pp. 2118–2125. [Google Scholar]
  18. Hu, S.Q.; Jing, Z.L. A Survey of Particle Filter Algorithms. Control Decis. Mak. 2005, 20, 361–365. [Google Scholar]
  19. Tang, R.; Yang, Z.; Lu, J.; Liu, H.; Zhang, H. Real-time trajectory prediction of unmanned aircraft vehicles based on gated recurrent unit. In Green Connected Automated Transportation and Safety, Proceedings of the 11th International Conference on Green Intelligent Transportation Systems and Safety; Springer: Singapore, 2021; pp. 585–596. [Google Scholar]
  20. Wu, J.; Zheng, X.; Wang, J.; Wu, J.; Wang, J. AB-GRU: An attention-based bidirectional GRU model for multimodal sentiment fusion and analysis. Math. Biosci. Eng. 2023, 20, 18523–18544. [Google Scholar] [CrossRef] [PubMed]
  21. Zhu, Z.; Dai, W.; Hu, Y.; Li, J. Speech emotion recognition model based on Bi-GRU and Focal Loss. Pattern Recognit. Lett. 2020, 140, 358–365. [Google Scholar] [CrossRef]
  22. Alonso, A.M.; Nogales, F.J.; Ruiz, C. A single scalable LSTM model for short-term forecasting of massive electricity time series. Energies 2020, 13, 5328. [Google Scholar] [CrossRef]
  23. Yuan, R.; Li, H. An Image Captioning Model Based on SE-ResNest and EMSA. In Proceedings of the 2023 IEEE 6th International Conference on Pattern Recognition and Artificial Intelligence (PRAI), Haikou, China, 18–20 August 2023; pp. 681–686. [Google Scholar]
  24. Schubert, R.; Adam, C.; Obst, M.; Mattern, N.; Leonhardt, V.; Wanielik, G. Empirical evaluation of vehicular models for ego motion estimation. In Proceedings of the 2011 IEEE Intelligent Vehicles Symposium (IV), Baden-Baden, Germany, 5–9 June 2011. [Google Scholar]
  25. Qiao, S.J.; Han, N.; Zhu, X.W.; Shu, H.; Zheng, J.; Yuan, C. Dynamic trajectory prediction algorithm based on Kalman filter. J. Electron. 2018, 46, 6. [Google Scholar]
  26. Hartigan, J.A. Bayes Theory; Springer Science & Business Media: Berlin/Heidelberg, Germany, 2012. [Google Scholar]
  27. Charbuty, B.; Abdulazeez, A. Classification based on decision tree algorithm for machine learning. J. Appl. Sci. Technol. Trends 2021, 2, 20–28. [Google Scholar] [CrossRef]
  28. Abdullah, D.M.; Abdulazeez, A.M. Machine learning applications based on SVM classification a review. Qubahan Acad. J. 2021, 1, 81–90. [Google Scholar] [CrossRef]
  29. Rigatti, S.J. Random forest. J. Insur. Med. 2017, 47, 31–39. [Google Scholar] [CrossRef] [PubMed]
  30. Manoharan, J.S. Study of variants of extreme learning machine (ELM) brands and its performance measure on classification algorithm. J. Soft Comput. Paradig. (JSCP) 2021, 3, 83–95. [Google Scholar]
  31. Chen, J.; Liu, Z.X.; Yin, Z.T.; Liu, X.; Li, X.L.; Yin, L.R.; Zheng, W.F. Predict the effect of meteorological factors on haze using BP neural network. Urban Clim. 2023, 51, 101630. [Google Scholar] [CrossRef]
  32. Markoulidakis, I.; Kopsiaftis, G.; Rallis, I.; Georgoulas, I. Multi-class confusion matrix reduction method and its application on net promoter score classification problem. In Proceedings of the 14th Pervasive Technologies Related to Assistive Environments Conference, Corfu, Greece, 29 June–2 July 2021; pp. 412–419. [Google Scholar]
Figure 1. Logical structure diagram of hybrid model.
Wevj 15 00333 g001
Figure 2. Schematic diagram of road section for vehicle data collection.
Wevj 15 00333 g002
Figure 3. Particle filtering results of the 261st vehicle feature data. (a) The result of vehicle speed filtering. (b) Vehicle acceleration filtering results.
Wevj 15 00333 g003
Figure 4. Schematic diagram of the starting point and end point of the trajectory during lane-changing process.
Wevj 15 00333 g004
Figure 5. Logical structure of Bilayer-GRU-Att model for vehicle trajectory prediction.
Wevj 15 00333 g005
Figure 6. Logical structure of GWO-XGBoost model for lane-changing prediction of vehicles.
Wevj 15 00333 g006
Figure 7. Dispersion of trajectory under different tpred.
Wevj 15 00333 g007
Figure 8. Distribution of trajectory prediction error indexes of different models.
Wevj 15 00333 g008
Figure 9. Probability conversion diagram of three types of lane-changing intent.
Wevj 15 00333 g009
Table 1. Processed partial HighD dataset vehicle trajectory data.
FrameIDXYX VelocityY VelocityX AccelerationY AccelerationTheta
13522193.80025.120019.88000.1600−0.1100−0.02000.0080
13532194.590025.120019.87000.1600−0.1100−0.03000.0080
13542195.380025.130019.87000.1500−0.1100−0.03000.0075
13552196.180025.140019.86000.1500−0.1200−0.04000.0075
13562196.980025.140019.86000.1500−0.1200−0.04000.0075
13572197.780025.150019.86000.1400−0.1300−0.04000.0070
13582198.570025.150019.85000.1400−0.1400−0.05000.0070
13592199.380025.160019.85000.1300−0.1400−0.05000.0065
136021910.170025.160019.84000.1300−0.1500−0.05000.0065
136121910.970025.160019.83000.1200−0.1600−0.05000.0060
Table 2. Trajectory prediction index data of different models.
Advance Prediction Time-DomainEvaluation IndexVehicle Trajectory Prediction Model
Bilayer-GRU-AttBilayer-GRUSingle-GRUBi-GRUSingle-LSTMBilayer-LSTM
tpred = 0.0 sRMSE/m3.95354.63585.08595.17515.09075.6122
ADE/m3.03053.96834.41524.46724.38264.9689
FDE/m5.54027.75399.44789.31428.50487.2470
PTC/ms29.952627.673126.504630.325735.476338.5224
tpred = 0.4 sRMSE/m4.06224.79145.24725.34305.26325.9603
ADE/m3.11784.13324.52904.59974.49505.2644
FDE/m5.76998.09219.82099.68748.83247.5189
PTC/ms30.750828.575626.914431.393236.857440.4592
tpred = 0.8 sRMSE/m4.20054.94025.37145.45465.39086.1985
ADE/m3.22194.29014.63754.68074.56485.4640
FDE/m5.98628.481710.04239.88758.96107.5816
PTC/ms31.685229.305127.494532.761838.437142.7675
tpred = 1.2 sRMSE/m4.27055.07455.47945.53545.49666.3727
ADE/m3.26544.43024.73754.72974.61815.6077
FDE/m6.17778.754810.219810.01869.01377.5324
PTC/ms32.393130.177727.932433.667440.276945.0985
tpred = 1.6 sRMSE/m4.27955.19005.62765.64875.64616.5487
ADE/m3.24444.55374.88264.79594.71445.7618
FDE/m6.37148.975110.469610.21729.15747.5723
PTC/ms33.995230.975128.607734.437642.843648.2981
tpred = 2.0 sRMSE/m4.29655.29765.79885.79005.82406.7437
ADE/m3.21124.66445.04994.88034.85885.9391
FDE/m6.58089.240210.785910.50399.39987.7354
PTC/ms34.437131.763529.024835.115345.292151.0654
Table 3. Intention recognition confusion matrices.
Predictive IntentTurning LeftGoing StraightTurning Right
ELMBPGWO-XGBoostELMBPGWO-XGBoostELMBPGWO-XGBoost
Real intentionTurning left571763577529231216275981041496
Going straight1861786579,84380,32680,56663716235
Turning right12295079546245747278328344
Table 4. Performance Measures for Intent Recognition.
Precision RateRecall RateF1 ScoreAccuracy Rate
Evaluation IndexELMBPGWO-XGBoostELMBPGWO-XGBoostELMBPGWO-XGBoostELMBPGWO-XGBoost
Turning left0.70290.78160.92570.94890.95880.99140.80760.86120.95740.95720.97250.9923
Going straight0.98980.99580.99880.96250.97470.99210.97600.98510.9954
Turning right0.89070.93360.99460.90980.96180.99510.90010.94750.9948
Disclaimer/Publisher’s Note: The statements, opinions and data contained in all publications are solely those of the individual author(s) and contributor(s) and not of MDPI and/or the editor(s). MDPI and/or the editor(s) disclaim responsibility for any injury to people or property resulting from any ideas, methods, instructions or products referred to in the content.

