Article

Design and Application of Experience Management Tools from the Perspective of Customer Perceived Value: A Study on the Electric Vehicle Market

by
Yuanyuan Xu
1,*,
Xinyang Shan
1,
Mingcheng Guo
2,
Weiting Gao
2 and
Yin-Shan Lin
3
1
College of Design and Innovation, Tongji University, Shanghai 200092, China
2
Integrated Innovation Institute and Human-Computer Interaction Institute, Carnegie Mellon University, Pittsburgh, PA 15213, USA
3
Khoury College of Computer Sciences, Northeastern University, Boston, MA 02115, USA
*
Author to whom correspondence should be addressed.
World Electr. Veh. J. 2024, 15(8), 378; https://doi.org/10.3390/wevj15080378
Submission received: 16 July 2024 / Revised: 5 August 2024 / Accepted: 15 August 2024 / Published: 20 August 2024

Abstract

:
The electric vehicle (EV) market is expanding rapidly, highlighting the need for enhanced customer perceived value to foster loyalty and competitive differentiation. This study investigates how experience management tools can improve customer experience management in the EV sector with an emphasis on sustainable business practices and environmental sustainability. The research explores existing customer experience management methods, the necessary functions of these tools, and their effectiveness in enhancing management capabilities from the perspective of customer perceived value. A thorough literature review and empirical analysis were conducted to design and evaluate tailored experience management tools. The findings suggest that these tools can enhance customer satisfaction and loyalty by addressing key elements of perceived value, such as price perception, quality perception, and brand image. Additionally, improved customer experience management may encourage sustainable consumer behaviors by making eco-friendly EVs more appealing, supporting environmental sustainability. This research aims to bridge the gap between customer perceived value theory and its practical application in the EV industry. It offers insights for manufacturers and marketers seeking to create more engaging and sustainable customer experiences. The implications extend beyond the EV market, providing a potential framework for various industries to enhance customer perceived value through effective and sustainable experience management.

1. Introduction

1.1. Background

Recently, customer perceived value has gained significant attention in experience management, which is driven by economic growth and technological advances [1]. It is defined as the customer’s evaluation of the benefits and costs of a product or service [2,3], influencing purchasing decisions, loyalty, and satisfaction [4]. Enhancing perceived value is crucial for companies seeking to stand out in a competitive market [5].
The electric vehicle (EV) market exemplifies a rapidly expanding and competitive industry. As consumer environmental awareness increases, so does the demand for EVs, which are pivotal in reducing greenhouse gas emissions and enhancing energy efficiency. Integrating EVs in supply chains can improve energy efficiency by 40%, reducing GHG emissions by up to 30% [6]. These benefits make EVs essential to global strategies for reducing carbon footprints and increasing energy independence.

1.2. Research Gap

Despite technological advancements in the EV sector, the success of EV brands depends not only on product superiority but also on the overall customer experience [7,8]. A positive customer experience enhances perceived value, driving purchase intentions and brand loyalty [9]. However, there is a lack of comprehensive tools and frameworks to systematically enhance customer perceived value in the EV industry. This gap highlights the need for research on developing and applying experience management tools that prioritize customer perceived value.

1.3. Objectives

This study aims to explore the design and application of experience management tools that enhance customer perceived value in the EV market. The primary objectives are to identify the key elements of customer perceived value, design tools tailored to these elements, and evaluate their effectiveness in improving customer satisfaction and loyalty. By focusing on customer experiences, companies can gain a deeper understanding of the factors that contribute to perceived value and develop strategies to enhance these experiences. This approach is particularly pertinent in the EV market, where consumers have high expectations for innovation and sustainability.

1.4. Methodology

Through a comprehensive literature review and empirical analysis, this study endeavors to bridge the gap between customer perceived value theory and its practical applications in the EV industry. The methodology includes identifying key value elements through literature and empirical research, designing tailored management tools, and evaluating their impact through case studies and user feedback.

1.5. Significance

The insights gleaned from this research are expected to provide valuable guidance for EV manufacturers and marketers, enabling them to cultivate more engaging and meaningful customer experiences. By aligning management strategies with customer perceived value, this study offers practical solutions to enhance competitive advantage in the evolving EV market.

2. Literature Review

2.1. Customer Perceived Value

Research on customer perceived value began in the 1980s and is now crucial in marketing [10]. It suggests that the purchasing behavior is driven by multiple values, including functional, social, emotional, epistemic, and conditional values [4,11]. A multidimensional scale was developed to measure customer perceived value, evaluating the overall product or service assessments [12].
Zeithaml (1988) defined perceived value as the consumer’s overall assessment of a product’s utility based on received versus given perceptions [13], including tangible and intangible elements like product quality, emotional benefits, and brand reputation. Holbrook (1999) categorized consumer value into intrinsic vs. extrinsic and active vs. reactive, highlighting its multifaceted nature [14].
In the EV sector, perceived value significantly shapes consumer behavior. Chen’s research indicates that EV purchase intentions are influenced by price perception, quality perception, and brand image [15]. Price perception includes initial cost and long-term cost-effectiveness, such as fuel savings and maintenance [16,17]. Quality perception covers reliability, performance, and safety features, while brand image concerns the manufacturer’s reputation and innovativeness [18].
Chen et al. also examined cultural influences like frugality and face consciousness on EV purchasing decisions [16]. In frugal markets, long-term cost–benefits of EVs are emphasized [19], whereas in cultures valuing social status, brand prestige and modernity play larger roles [20].

2.2. Customer Experience Management

Customer experience management (CEM) involves designing and managing customer journey touchpoints to enhance satisfaction and loyalty [21]. Pine and Gilmore introduced experience management in “The Experience Economy”, highlighting the importance of transforming interactions into engaging experiences.
In the EV market, managing customer experience is crucial as technological advances raise expectations for usage experiences [22]. Ullah et al. (2023) found that besides performance and price, customers highly value convenience and comfort, with features like fast-charging, user-friendly infotainment, and smart device integration enhancing satisfaction [23,24].
To meet these expectations, companies should implement comprehensive CEM strategies that include the personalization of interactions to meet customer preferences, ensuring consistency in delivering a uniform experience across touchpoints, and providing responsiveness through timely replies to inquiries. Additionally, continuous innovation is essential for improving products and services, while fostering engagement creates meaningful customer interactions.
Effective CEM tools, such as digital platforms offering detailed EV information, aid in informed decision making [25,26]. Post-purchase, apps providing real-time updates and maintenance reminders enhance the ownership experience [27]. Integrating customer feedback mechanisms enables companies to refine offerings and address issues, fostering loyalty and satisfaction [28].

2.3. Customer Experience Management in the Automotive Industry

Customer experience management (CEM) is crucial for automotive brands to stand out in a competitive market. It encompasses all interactions with a company, from initial contact to post-purchase support, as noted by Meyer and Schwager (2007) [29]. Brands like Tesla, BMW, and Toyota have enhanced customer experience by using digital tools and personalized services.
Effective CEM strategies foster loyalty and positive word-of-mouth, utilizing Customer Relationship Management (CRM) systems and digital engagement platforms. According to Lemon and Verhoef (2016), these platforms improve satisfaction through real-time responses and personalized services [30]. CRM systems enable data collection and analysis, allowing companies to tailor services to individual needs.
In the automotive industry, CEM strategies must be comprehensive and adaptable to evolving consumer expectations. As technology advances, customers demand more from their interactions with brands. Ng et al. (2007) emphasize that customers value not only vehicle performance and price [31]. Thus, automotive brands must implement CEM tools that enhance experiences across the customer journey from awareness to post-purchase loyalty [32].
By leveraging these frameworks, brands can enhance each stage of the journey, ensuring a rewarding experience that boosts satisfaction, loyalty, and brand perception (Table 1). Robust CEM strategies aim not only to meet but to exceed expectations, fostering lasting relationships and competitive advantage.

2.4. Experience Management Tools

Experience management tools use various methods and technologies to collect, analyze, and optimize customer experiences [33]. These tools help companies understand customer needs, identify issues, and develop improvement strategies [34]. By leveraging them, companies can meet expectations and deliver high-quality experiences that enhance satisfaction and loyalty [35,36].
There is a wide range of experience management tools, each with core functions such as data collection, analysis, feedback management, and experience optimization. The User Experience Questionnaire (UEQ) evaluates satisfaction and experience quality by measuring aspects like attractiveness, efficiency, and novelty [37]. Another key tool is the customer relationship management (CRM) system, which integrates customer information to offer personalized services [38]. CRM systems collect data from various touchpoints to provide a holistic view of customers, allowing tailored communications and enhancing the overall experience [38].

2.5. Research Gap in Customer Experience Management Tools for Electric Vehicles

Despite advancements in customer experience management (CEM), tools for managing experiences in the electric vehicle (EV) market remain underdeveloped [39]. While existing CEM processes address some needs, comprehensive systems for the entire EV customer lifecycle are lacking, often focusing on isolated aspects rather than meeting the industry’s unique demands [40].
The automotive market’s lengthy decision making and infrequent purchases can cause customers to choose other brands or become impatient with the experience [23]. Thus, it is crucial to reassess and redesign CEM tools for the EV sector [41]. This includes reevaluating customer touchpoint design, service quality, and satisfaction management [42] along with identifying data management platforms to collect feedback and enable timely company responses.
Focusing on customer needs and feedback is vital for continuously optimizing CEM tools. By integrating insights, companies can refine strategies to meet evolving market demands [43,44,45]. This holistic approach is essential for creating an effective CEM system that enhances the overall customer experience in the EV sector.

3. Methodology

This study employs a comprehensive methodological approach to develop and evaluate a customer experience management (CEM) tool tailored for the electric vehicle (EV) industry. By integrating multiple research methods, the study ensures thorough exploration and validation of the proposed tool.

3.1. Research through Design (RtD)

The Research through Design (RtD) methodology serves as the overarching framework for this study, using design practice as a research tool to explore complex problems. Iterative design and prototyping across disciplines like engineering and human–computer interaction enable the continuous refinement and validation of solutions. This approach enhances understanding and leads to innovative prototype designs, effectively addressing practical issues in CEM tool development.

3.2. Empirical Research and Factor Analysis

Empirical research combined with factor analysis identifies key dimensions of customer perceived value critical to EV purchase decisions. Using SPSS Statistics 26.0, factor analysis statistically determines core dimensions such as price perception, quality, and brand image. This process reduces data complexity and informs the design by pinpointing primary consumer behavior factors.

3.3. Fuzzy-Set Qualitative Comparative Analysis (fsQCA)

Fuzzy-Set Qualitative Comparative Analysis (fsQCA) explores complex causal relationships between identified factors and consumer behavior. Using fsQCA 2.0 software, the method models causal configurations to provide nuanced insights into how factors interact, enhancing the understanding of consumer decision making in the EV market.

3.4. Semi-Structured Interviews

Semi-structured interviews are conducted to gather in-depth insights into user experiences and workflows with CEM tools. NVivo 14 is used for analyzing qualitative data from these interviews, which helps identify user needs and challenges, informing tool design.

3.5. Expert Reviews and the Delphi Method

The Delphi method facilitates structured feedback and consensus building among experts, ensuring rigorous validation of research findings and prototype designs. Multiple rounds of expert reviews refine and validate the tool, achieving consensus on its feasibility and effectiveness.

3.6. Usability Testing with the System Usability Scale (SUS)

Usability testing evaluates the tool’s usability, learnability, and user satisfaction. The System Usability Scale (SUS) provides standardized metrics from structured testing sessions with EV brand participants. These metrics guide iterative design optimization, identifying strengths and weaknesses.

3.7. Overview of Case Studies

The study comprises four interrelated case studies, each contributing to the research objectives (Table 2):
Case Study 1: Identified key factors influencing EV purchase decisions using surveys and fsQCA, pinpointing primary factors like price perception, quality perception, and brand image.
Case Study 2: Employed semi-structured interviews to understand work scenarios and workflows of CEM tool users, providing data to support tool design.
Case Study 3: Involved expert reviews to validate research findings and prototype designs, using the Delphi method to ensure tool feasibility and effectiveness.
Case Study 4: Conducted usability testing using SUS to evaluate the tool’s effectiveness in real-world settings, guiding further design optimization.
Through these case studies, the research demonstrates how RtD and complementary scientific methods can be employed to deeply investigate and solve practical problems, offering significant theoretical and practical insights for designing CEM tools in the EV industry. Detailed discussions of each case study are presented in the following sections.

4. Case Study 1: Identifying Key Factors Influencing Electric Vehicle Purchase Decisions

4.1. Hypotheses

In today’s competitive market, understanding consumer purchasing behavior is crucial for businesses. Perceived customer value significantly influences purchase intentions and includes dimensions such as price value, use value, social value, and emotional value. Price value considers the fairness of the product’s price relative to its quality. Use value evaluates the product’s functionality and performance in meeting consumer needs. Social value relates to the product’s impact within social contexts, affecting recognition and approval. Emotional value involves the emotional responses a product elicits, fostering consumer engagement. These aspects are depicted in the research structure diagram (Figure 1), highlighting their influence on consumer behavior.
Based on relevant domestic and international research and competitive product analysis, the following hypotheses were proposed:
Hypothesis 1 (H1). 
Any one of the four factors can be considered unnecessary for the purchase intention of electric vehicles (EVs).
Hypothesis 2 (H2). 
The purchase intention of EVs is the result of the interaction of multiple factors with the four dimensions working together.
Hypothesis 3 (H3). 
Various combinations of factors can lead to the purchase intention of EVs, which is a phenomenon caused by multiple concurrent paths.
The proposed hypotheses are supported by the existing literature, which emphasizes the multifaceted nature of consumer purchase intentions for electric vehicles. According to Zhao et al. (2024), perceived green value plays a crucial role in promoting purchase intentions toward EVs. Their study shows that perceived green value significantly enhances consumers’ environmental responsibility and self-efficacy, which in turn increases their purchase intentions [46,47].
Social Information Processing Theory (SIPT) suggests that social cues and environmental contexts significantly influence consumer behavior, including EV purchase decisions. This theory aligns with Hypothesis 2, which posits that the interaction of various dimensions such as social and emotional values collectively influences EV purchase intentions [48].
Moreover, the research highlights the role of perceived competence and self-efficacy in shaping consumer attitudes toward adopting EVs. Consumers with higher perceived competence and self-efficacy are more likely to engage in pro-environmental behaviors, supporting Hypothesis 3, which suggests that multiple paths and combinations of factors can lead to EV purchase intentions [49,50].
By integrating these insights from the literature, the research model adopts a comprehensive view of how different dimensions of perceived value contribute to the purchase intentions of electric vehicles. This approach confirms that the research structure is well grounded in existing theoretical frameworks and empirical findings.

4.2. Methodology

This study utilizes Fuzzy-Set Qualitative Comparative Analysis (fsQCA) to test the hypotheses and identify key factors influencing electric vehicle (EV) purchase decisions [51,52]. A survey questionnaire was designed around four dimensions: price value, use value, social value, and emotional value. Data were collected using both electronic and paper-based questionnaires via the Wenjuanxing platform. The questionnaire items and sources are detailed in the Appendix A (Table A1).
The sample comprised respondents from offline EV experience centers and participants recruited through social media platforms such as Weibo and WeChat, which were collected from 1 October 2021 to 1 February 2022. Out of the 500 questionnaires distributed, 320 were returned, with 300 deemed valid, yielding an effective recovery rate of 93.75%. The survey included demographic questions on gender, age, occupation, monthly income, EV purchase intention, and annual mileage, alongside 20 items on a five-point Likert scale. Detailed demographics are available in the Appendix A (Table A2).
Data analysis involved calibrating survey data into fuzzy membership scores (0–1) using fsQCA software. The calibration process used fully non-member and fully member percentiles and the median as the crossover point based on data distribution. The analysis included necessity analysis, truth table analysis, coding, and standardization. Fs/QCA 2.0 software was used for necessity and sufficiency analyses to pinpoint key factors influencing purchase intentions.

4.3. Results

4.3.1. Reliability and Validity of the Sample

Cronbach’s alpha measures internal consistency. Higher values indicate better reliability. Table 3 shows that the coefficients for purchase intention, use value, price value, emotional value, and social value are 0.921, 0.894, 0.873, 0.898, and 0.971, respectively, indicating high reliability for assessing intentions regarding new energy vehicles.
Table 4 presents the KMO and Bartlett’s test results. A KMO value of 0.983 indicates excellent sampling adequacy. Bartlett’s test yields a chi-square value of 7412.743 with 531 degrees of freedom (p-value = 0.000), confirming the sample’s suitability for factor analysis.

4.3.2. Descriptive Statistics and Correlations

Descriptive statistics and correlations are shown in Table 5. The “mean” reflects average values, and “standard deviation” shows data dispersion. Correlations indicate relationships between variables with positive values showing positive relationships. Key findings include positive correlations between quality value and purchase intention and between price value and purchase intention.

4.3.3. fsQCA Factor Combination Analysis

Necessity analysis (Table 6) shows that no single antecedent (use value, price value, emotional value, social value) is necessary for purchase intention, supporting Hypothesis 1. Sufficiency analysis (Table 7) identifies four configurations enhancing purchase intention, supporting Hypotheses 2 and 3. Key configurations involve use value, price value, and emotional value as core conditions. Consistency thresholds were set at 0.80.

4.3.4. Hypothesis Testing and Analysis Results

This study uses Fuzzy-Set Qualitative Comparative Analysis (fsQCA) to test hypotheses about electric vehicle (EV) purchase intentions. FsQCA combines qualitative and quantitative strengths, which are suitable for complex multidimensional interactions.
Hypothesis 4 (H4). 
EV purchase intention does not depend on a single factor. Necessity analysis showed no single factor (price, use, social, emotional value) is necessary, supporting H1.
Hypothesis 5 (H5). 
EV purchase intention results from combined effects of multiple factors. Sufficiency analysis revealed configurations with price, use, and emotional values as core conditions, confirming H2.
Hypothesis 6 (H6). 
Multiple factor combinations can lead to purchase intention. Truth table analysis identified diverse paths with different core and peripheral factor combinations, validating H3.

4.4. Conclusions

Based on the research findings, this study draws the following conclusions:
  • User willingness to purchase new energy vehicles (NEVs) does not require any prerequisite conditions. Previous research, such as Kowalska-Pyzalska et al. (2021), identified significant positive impacts and the absence of negative impacts as influencing purchase intention [53,54]. However, our study shows that no single factor is absolute; negative factors can persist, and positive factors may disappear. This suggests that automotive companies can focus on market breakthrough strategies to optimize resource use in NEV design and sales.
  • Quality value is a key factor influencing users’ willingness to purchase NEVs. Using the fsQCA method, we identified four configurations that enhance purchase intentions, emphasizing quality value. These insights guide the design and planning of offline experience spaces, optimizing R&D investment. Future research should include additional indicators like vehicle models and brand recognition to enrich the model’s complexity.

4.5. Discussion

This study investigates factors based on perceived customer value that influence NEV purchasing decisions. Considering NEVs as durable goods, the selected subvalues were use value, price value, emotional value, and social value. The fsQCA method explains how these values jointly influence purchase intentions through various combinations, leading to multipath effects. The findings highlight the complex interplay of these dimensions in shaping consumer decisions.

5. Case Study 2: In-Depth Interview Analysis of Customer Experience Management Tool Users

5.1. Methodology

This study employs fsQCA to examine the impact of customer experience perceived value on automotive brands and proposes four configurations to enhance purchase intention for new energy vehicles (NEVs). Building on these findings, this section refines design strategies for customer experience management tools based on over 20 subitems within the four main directions.
The interview study aims to understand work scenarios and workflows of users of customer experience management tools, identify user personas, and map customer experiences. By exploring how participants manage tasks, communicate, and interact with customers, the study aims to uncover needs and expectations for the tools as well as pain points in design.
From 187 NEV employees with relevant experience, 10 participants were selected for interviews. These individuals come from sales, after-sales service, and technical support areas. Interviews were conducted in groups to gain insights into their work experiences. Multiple interviews ensured comprehensive data collection. Table 8 provides demographic details of the participants.
Interviews were conducted as one-on-one semi-structured sessions, recorded for later analysis, each lasting 60–90 min. This method balances free conversation with standardized questions, mixing open-ended and targeted queries Table 9.
The interviews followed four stages:
1. **Ice breaking**: Introduced the research topic and ethical principles, establishing trust with participants.
2. **Background Collection**: Gathered personal background, education, and work experience to understand interviewee profiles and tool use.
3. **Workflow Understanding**: Explored job responsibilities, tool usage, and daily challenges to assess tool fit and improvement areas.
4. **In-depth Insights**: Focused on pain points in time management, communication, and task handling to identify needs and expectations for tool development.
These stages provided a comprehensive understanding of interviewees’ profiles, work environments, and customer experience management tool usage.

5.2. Result

After the interviews, the recordings were transcribed using the iFLYTEK transcription platform. The input format was mono WAV files with a sample rate of 16 KHz, and the output format was JSON strings encoded in UTF-8 TXT documents. Preliminary reading and correction of transcription errors were conducted to understand the interviewees’ work patterns and pain points in the experience management process. These findings validated the conclusions of the preliminary empirical research, confirming the impact of these aspects on customer purchase decisions. Through the division and organization of information, 150 key pieces of information were extracted, and six main design points were summarized.
Easily Constructed Customer Experience Maps: Nine interviewees (S1, C1, C2, T1, T2, M1, M2, O1, O2) highlighted challenges in managing customer experience maps. These maps, often abstract and multidimensional, become difficult to implement and adjust in real-world settings. Timely data collection and analysis are essential to identify and address issues, and continuous updates and improvements are necessary. A representative quote from O1: “Planning on paper is ideal, but in actual offline spaces, the experience map changes significantly, making it hard to provide timely feedback”.
Collaboration and Visualization of Customer Footprints and Profiles: Nine interviewees (S1, S2, C1, C2, T1, T2, M1, O1, O2) mentioned the need for better recording and collaboration of customer footprints. Current methods are basic and lack effective utilization. Specialized software is needed to extract key information and provide visualized, actionable insights. A representative quote from S1: “Current customer profiles are basic and not visualized, making it hard to understand and act upon key points”.
Editable and Customizable Component Libraries: Eight interviewees (C1, C2, T1, T2, M1, M2, O1, O2) emphasized the need for customizable component libraries in customer experience management systems. Current tools are difficult to customize without technical expertise, hindering their effectiveness. A representative quote from C1: “Tools like Tableau are still challenging for designers without technical background, making it hard to gather and use customer experience information”.
Comprehensive Multi-Channel Experience Surveys: Seven interviewees (C1, C2, T1, T2, M1, O1, O2) discussed the need for better tools to link operational data with experience surveys. Current methods using third-party tools often yield biased results and fail to integrate data across channels. A representative quote from M1: “Third-party surveys like Wenjuanxing often lead to biased results and don’t integrate well with other channels, creating data silos”.
Clear Metrics for Customer Journey Segmentation: Seven interviewees (S1, S2, C1, T1, T2, M1, O2) pointed out the lack of standardized metrics for customer journey segmentation, leading to misleading results. Clear definitions of metrics for each segment are necessary. A representative quote from O2: “Clear definitions of metrics for each segment are necessary to avoid misguidance”.
Integration and Tracking of Operational Metrics: Seven interviewees (S1, S2, C1, C2, T1, T2, M1, M2, O1, O2) stressed the importance of integrating and tracking operational metrics in experience management. Some departments lack clear KPIs, making accountability difficult. Displaying operational metrics on dashboards and breaking them down into actionable steps is crucial. A representative quote from M1: “Displaying operational metrics on dashboards and breaking them down into actionable steps helps monitor and adjust strategies timely”.

5.3. Conclusions and Discussion

This study, through corporate user interviews, identified six pain points in managing offline experience spaces and proposed corresponding design features. These pain points impact customer experience management efficiency, affecting customer satisfaction and loyalty. The proposed design features include online experience maps, the visualization of customer footprints and profiles, customizable component libraries, multi-channel survey deployment, clear customer journey metrics, and integrated operational tracking. Implementing these features can enhance customer experience management and increase customer satisfaction. Table 10 outlines the identified pain points and innovation opportunities.

6. Case Study 3: Validation and Optimization of the Prototype

6.1. Methodology

6.1.1. Research Objectives and Participants

This study conducted pre-experiment testing to assess the usability and ease of use of the product prototype, identifying areas for improvement. Ten employees from electric vehicle brands, experienced in customer experience management, served as test subjects. The testing aimed to evaluate the functionality and usability of the customer experience management tool, identify user challenges, gather feedback for design improvements, compare with similar products, and explore user scenarios and purposes.
Participants included two experience experts, two designers, two developers, two product managers, and two end-users. The System Usability Scale (SUS), developed by Brooke in 1986, was used to quantify usability across learnability, usability, and satisfaction, utilizing 10 questions. The SUS has proven effective even with small sample sizes, providing reliable usability feedback.
The tests provided a comprehensive understanding of the tool’s functionality, offering valuable insights for future design and development. They also deepened understanding of user needs, inspiring improvements to the tool.

6.1.2. Testing Process

Usability tests were conducted in a quiet studio environment to minimize distractions and ensure participants could focus on the customer experience management tool. The tests evaluated key functions, such as user registration, data entry, and real-time analytics. Participants, selected for their design or technical background, ensured a diverse sample.
Testing steps included setting up the environment, providing operational guidance, and having participants perform tasks as outlined in Table 11. Actions and feedback were recorded, noting the time taken, errors, and task success rates. Metrics included task completion success, efficiency, error frequency, user satisfaction, and overall usability. Sessions lasted 2–3 h on weekdays, covering preparation, execution, and data analysis.
During the tasks, participants could ask questions and provide feedback at any time. After completing the tasks, they filled out the SUS questionnaire and provided feedback on issues or obstacles encountered. The entire test process took approximately 20–30 min with researchers recording the screen throughout. Researchers did not interrupt unless assistance was requested.
Following empirical research and prototype iteration, industry experts reviewed the research findings and prototype design to ensure rigor and validity [53]. The expert walkthrough used the Delphi method, achieving consensus through multiple rounds of feedback and evaluation. This approach provided comprehensive and scientific expert advice, enhancing the tool’s design.
Statistical analysis and result presentation were conducted using Excel 2019 and SPSS Statistics 26.0 To ensure the tool’s effectiveness and user-friendliness, a cognitive walkthrough was conducted. This method involved experts simulating user interactions to evaluate usability and design ease [54,55]. Selecting the right experts is crucial; they should have relevant knowledge in customer experience design, interaction design, and human–computer interaction. Internal experts or external professionals were invited to participate (Table 12). During the walkthrough, experts focused on interface design and interaction issues, providing improvement suggestions. After the evaluation, results were summarized, including identified issues and proposed improvements.

6.2. Results

6.2.1. On-Site Observation Analysis

Observing participants during the usability test, we recorded the time, steps, and success rates for each task. The overall usability was found to be good, with participants generally performing tasks smoothly without needing assistance, indicating a high level of usability. However, some difficulties were noted:
  • Three users experienced hesitation during Task 5 when saving and locating the user journey map in data analysis.
  • Two users had difficulty finding the data dissection button for perceived value analysis during Task 7.

6.2.2. SUS Scores and User Feedback Analysis

As shown in Table 13, seven participants scored above 54, with an average score of 72.4, indicating the system’s usability is above average, outperforming 50% of similar products. All eight participants found the new tool easier and more efficient than previous methods. The SUS subscores for usability, learnability, and satisfaction averaged 74.4, 70.4, and 72.4, respectively.
During the expert cognitive walkthrough, the positive feedback from the four experts reflected the success of the product’s design and development. The product performed well in meeting user needs with experts giving high praise for its functionality, interface, and interaction design.
At the same time, they provided valuable suggestions and recommendations that will guide future improvements. For example, the experts suggested that the transitions in the user profile interface should be smoother, allowing users to navigate to the dashboard immediately after editing a user profile. They also recommended that the design of visualized information icons should focus more on readability and retrieval efficiency. Furthermore, the experts emphasized the importance of data interpretability, real-time data, data granularity, and the diverse needs of different users. These are critical factors that the product team should consider for future enhancements.

7. Case Study 4: Usability Testing and Optimization of the Customer Experience Management Tool

7.1. Methodology

7.1.1. Testing Methods and Objectives

After testing the usability of the design prototype and iterating on the design, a comparative test will be conducted to assess the effectiveness and usability of the experience management tool versus a competitor product, Beisite. The steps are as follows:
Recruit Test Participants: Twenty employees from electric vehicle brands will be recruited: ten using the experience management tool and the other ten using Beisite.
Design Test Scenarios: Porsche Taycan’s offline experience space will be used as a case study, offering EV display and test drive services. Participants will manage experiences using their respective tools, including tracking customer footprints, editing experience maps, managing perceived value, and dispatching work orders.
Data Collection: Time spent, task accuracy, and satisfaction data will be recorded, and participants will fill out feedback questionnaires.
Data Analysis: Comparative analysis of the two groups’ data will evaluate the effectiveness and usability of the tools.

7.1.2. Test Participants

Nineteen participants related to customer experience management were selected, as shown in Table 14. To avoid significant industry differences, all participants came from tech companies in the smart mobility industry, including sales, design, and product managers from related software companies, and internet mobility companies. Participants were randomly divided into two groups, each using the proposed customer experience management tool to complete identical tasks, which was followed by a survey.
Participants were divided into an experimental group using the proposed tool and a control group using Beisite’s Experience Management (XM) tool. Table 15 shows the gender and age distribution of both groups with no significant differences (p > 0.05).

7.1.3. Testing Procedures and Content

Experimental Tools: The experiment requires a desktop or laptop computer, mouse, keyboard, and monitor (resolution 1920 × 1080 or higher). The operating system should be Windows 10 or macOS 10.15 or higher, with Google Chrome (92.0.4515.107) and OBS Studio (27.0.1) for screen recording.
Data Package: Customer experience data from the company P’s experience space at Elements were used, including user feedback, behavior data (clicks, dwell time, bounce rates), and logs (marketing, error, performance). Data were anonymized for ethical compliance.
Experimental Tasks: Tasks were based on high-frequency office scenarios identified in user interviews, divided into three stages with 15 tasks (Table 16), covering data collection (Figure 2), annotation (Figure 3), and action improvement (Figure 4). They were scored on a Likert scale from 1 to 5, evaluating usability, understandability, efficiency, effectiveness, and aesthetics.

7.1.4. Experimental Procedures

As shown in Table 17, both groups participated in a 25–45 min experiment. Pre-experiment introductions and post-experiment questionnaires and interviews were conducted.

7.2. Results

SPSS Statistics 26.0 was used to analyze the usability, understandability, efficiency, effectiveness, and aesthetics.
Baseline Data Comparison: Table 18 compares job functions between groups. Chi-square tests showed no significant differences (p > 0.05).
Usability Data Analysis: Tasks were scored on usability metrics using paired sample t-tests to compare groups. The usability tests of 16 tasks across three phases showed that the proposed tool outperformed Beisite XM in many aspects, such as usability, effectiveness, and aesthetics. Table 19, Table 20 and Table 21 illustrate that the experimental group consistently scored higher than the control group.

7.3. Conclusions

In conclusion, Case Study 4 confirms that the newly designed customer experience management tool offers substantial improvements over existing solutions. The tool’s enhanced usability, efficiency, and effectiveness make it a valuable asset for businesses in the electric vehicle industry. By addressing common pain points and incorporating user and expert feedback, the tool is well positioned to enhance customer experience management practices, ultimately leading to higher customer satisfaction and loyalty. The findings from this study underscore the commercial potential of the tool and its capability to transform customer experience management in the EV sector.

8. Discussion

This study provides significant insights into customer experience management (CEM) within the electric vehicle (EV) industry. Using a comprehensive methodology, including empirical research, prototype iteration, and expert reviews, we identified key factors influencing purchase intentions and developed a validated CEM tool.
EV brands employ various methods to manage customer experiences, focusing on price perception, quality perception, brand image, and emotional value. Detailed surveys and interviews help shape effective customer experience strategies. The iterative design and testing process ensures that the developed CEM tools are user-friendly and address customer needs. Usability testing refines these tools to enhance efficiency and user satisfaction. Engaging industry experts in reviewing findings and prototype designs ensures practical applicability and scientific rigor. This comprehensive approach improves customer understanding, tool effectiveness, and customer satisfaction.
From the perspective of perceived customer value, CEM tools should include features such as online experience mapping, customer data visualization, customizable component libraries, multi-channel experience surveys, and clear metrics for tracking. These functionalities provide actionable insights and facilitate real-time adjustments, ensuring a personalized customer experience.
To establish effective CEM tools, companies should conduct thorough empirical research to understand customer perceived value. Developing and refining prototypes through usability testing ensures alignment with user needs. Expert reviews using the Delphi method provide scientific validation. Flexible tools that integrate with existing systems enhance utility. Robust statistical methods guide improvements and ensure usability standards. This structured approach allows companies to develop tools that significantly enhance customer experience management.
The newly developed CEM tool improves companies’ capabilities in managing customer experiences, achieving higher System Usability Scale (SUS) scores than existing tools. Participants using the new tool completed tasks more efficiently, demonstrating superior functionality and usability. Expert reviews confirmed its strengths, with recommendations for further enhancements. These findings show that the CEM tool exceeds existing standards, making it a valuable asset for enhancing customer experience management.

9. Conclusions

This study developed and evaluated a customer experience management (CEM) tool for the EV industry using the Research through Design (RtD) methodology. RtD facilitated an iterative design process, integrating empirical testing and feedback to ensure the tool met user needs and industry standards.
Using Fuzzy-Set Qualitative Comparative Analysis (fsQCA), the study identified key factors influencing customer perceived value, such as price perception, quality, brand image, and emotional value. This method provided insights into the causal relationships shaping purchase intentions in the EV market.
The tool underwent usability testing with the System Usability Scale (SUS), highlighting its superior performance compared to existing solutions in terms of usability, efficiency, and effectiveness. Expert reviews using the Delphi method aligned the tool’s design with industry standards and validated its applicability.
The study emphasizes user-centered design and iterative development, ensuring the tool’s responsiveness to user needs and market demands. The findings highlight the tool’s commercial viability and potential to transform CEM practices, leading to higher customer satisfaction and loyalty.
Future research should focus on refining the tool and exploring additional features to enhance functionality. Incorporating ongoing user and expert feedback will allow the tool to adapt to the dynamic EV market. Expanding research to include diverse demographics and market segments can provide further insights into consumer preferences and enhance adaptability across industries.

Author Contributions

Conceptualization, Y.X. and X.S.; methodology, Y.X. and X.S.; software, Y.X. and X.S.; validation, Y.X., X.S., M.G. and W.G.; formal analysis, Y.X., X.S., M.G. and W.G.; investigation, Y.X., X.S., M.G. and W.G.; resources, Y.X. and Y.-S.L.; data curation, Y.X., M.G., W.G. and Y.-S.L.; writing—original draft preparation, Y.X. and Y.-S.L.; writing—review and editing, Y.X., M.G., W.G. and Y.-S.L.; visualization, Y.X., M.G., W.G. and Y.-S.L.; supervision, Y.X. and Y.-S.L.; project administration, Y.X. and X.S.; funding acquisition, Y.X. and Y.-S.L. All authors have read and agreed to the published version of the manuscript.

Funding

This research received no external funding.

Institutional Review Board Statement

The study has been approved by the Institutional Review Board (IRB) of Tongji University, with the approval number NO. tjdxsr 012 and the approval date of 27 March 2022.

Informed Consent Statement

Informed consent was obtained from all subjects involved in the study.

Data Availability Statement

Because all interviews involved subjects’ positions and key personal information, we do not disclose the study’s data.

Conflicts of Interest

The authors declare no conflicts of interest.

Appendix A

Table A1. Questionnaire items and sources.
VariableItemSource
Use ValueTravel efficiencySheth et al. (1991) [56,57]
Driving mileage
Structural safety
Good performance
Easy operation
Stability and comfort
Price ValuePolicy subsidiesSweeney and Soutar (2001) [14]
Loan discounts
Low cost
Affordable maintenance
Cost performance
Emotional ValuePleasant moodChen Jie (2015) [58]
Fashionable and trendy
Green and environmentally friendly
Environmental contribution
Social recognition
Social ValueLow carbon and dual reductionChen et al. (2019) [59]
Petroleum consumption
Environmental protection
Social responsibility
Purchase IntentionDesire to purchaseDodds et al. (1991) [60]; Ng et al. (2018) [61]
Priority purchase
Recommend purchase
Table A2. Demographic characteristics of participants.
CharacteristicCategoryFrequencyPercentage (%)
GenderMale16555.00
Female13545.00
AgeUnder 18113.66
19–2810434.67
29–459331.00
46–597224.00
Over 60206.67
EducationMiddle school or below124.00
High school or technical school289.33
Junior college7625.33
Bachelor’s degree15852.67
Master’s degree or above268.67
OccupationOrdinary workers or service personnel5819.33
Staff of government organizations, institutions, and state-owned enterprises9230.67
Staff in education, research, and healthcare5618.67
Private enterprise owners or employees5016.67
Self-employed3210.66
Student124.00
Monthly IncomeLess than 3000 RMB155.00
3000–5500 RMB10133.67
5501–8000 RMB9230.66
8001–10,000 RMB5117.00
More than 10,000 RMB4113.67
Household RegistrationUrban household15852.67
Rural household14247.33
Have you purchased a new energy vehicle?Yes3612.00
No26488.00
Car Ownership06120.33
119765.67
23812.67
341.33
Annual MileageLess than 15,000 km8026.67
15,000–30,000 km6220.66
30,001–40,000 km9230.67
More than 40,001 km6622.00
Awareness of New Energy VehiclesNever heard of it00.00
Heard only in the news or other channels3010.00
Slightly familiar12943.00
Quite familiar10133.67
Very familiar4013.33
Do you own any new energy vehicles?Yes11538.33
No18561.67

Appendix B. Questionnaire

EXPLORING THE INFLUENCE OF USER-PERCEIVED VALUE ON AUTOMOBILE ENTERPRISES USING AN EMPIRICAL COMPUTER MODEL
Dear Madam/Sir,
This is a research questionnaire on the influence path of purchasing intention of new energy vehicles based on users’ perceived value. First, thank you for your participation and support. We hope you can answer objectively and truthfully according to your own situation after reading the questions. Your answers are of great significance to my research. This survey is conducted anonymously, and the information collected is only for research purposes. We will keep your information confidential. Finally, thank you again for your participation and help.
PART ONE: BASIC INFORMATION
  • Gender: [single choice]
    • Male
    • Female
  • Age: [single choice]
    • Under the age of 18
    • 19 to 28 years old
    • 29 to 45 years old
    • 46 to 59 years old
    • Over 60 years old
  • Educational background: [single choice]
    • Junior high school and below
    • High school or technical secondary school
    • Junior college
    • Undergraduate
    • Master’s degree or above
  • Occupation [single choice]
    • General workers or service personnel
    • Staff of government organizations, institutions, and state-owned enterprises
    • Staff in the fields of education, scientific research, or health
    • Owners or employees of private enterprises
    • Self-employed person
    • Student
  • Monthly income [single choice]
    • Below CNY 3000
    • CNY 3000–5500
    • CNY 5501–8000
    • CNY 8001–10,000
    • Over CNY 10,000
  • Your household registration type is [single choice]
    • Urban
    • Rural
  • Have you bought a vehicle [single choice]
    • Purchased
    • Not purchased
  • The number of vehicles you own is [single choice]
    • 0
    • 1
    • 2
    • 3
  • Your annual mileage is approximately (km/year) [single choice]
    • Less than 15,000 km
    • 15,000–30,000 km
    • 30,001–40,000 km
    • Longer than 40,001 km
  • Do you know or hear about new energy vehicles [single choice]
    • Never heard of
    • Only heard of it over the news or by other means
    • Know a little
    • Better understanding
    • Very well
  • Do you own any NEVs? [single choice]
    • Yes
    • No
PART TWO: PURCHASE INTENTION SURVEY
  • New energy vehicles can improve driving efficiency
  • The driving range of new energy vehicles can meet the requirements of driving distance
  • The design and body structure of new energy vehicles are safer
  • The power performance of new energy vehicles is good and the speed is fast
  • The driving and operation of new energy vehicles are simple and convenient
  • New energy vehicles have low driving noise and are stable and comfortable when driving
  • Large subsidies for new energy vehicles
  • New energy vehicles have preferential loan and tax policies
  • Low use cost of new energy vehicles (electricity price lower than oil price)
  • The late maintenance of new energy vehicles is economical and practical
  • The purchase of new energy vehicles is cost effective
  • Buying or driving new energy cars can make me happy
  • Buying or driving a new energy car fits my fashionable image
  • Buying or driving a new energy car fits my green image
  • Buying or driving a new energy car makes me feel like I’m contributing to the environment
  • Buying or driving new energy vehicles can gain more social recognition
  • Buying or driving new energy vehicles is in response to the country’s low-carbon double reduction policy
  • Buying or driving new energy vehicles reduces oil consumption in the long run
  • Buying or driving new energy vehicles helps protect the environment
  • Buying or driving new energy vehicles is a socially responsible act
  • I want to buy a new energy car
  • When buying a car, I will give priority to new energy vehicles
  • I would like to recommend my friends to buy new energy vehicles
[Rating scale for all questions above: 1—Strongly Disagree, 2—Disagree, 3—Neutral, 4—Agree, 5—Strongly Agree]

References

  1. Zauner, A.; Koller, M.; Hatak, I. Customer perceived value—Conceptualization and avenues for future research. Cogent Psychol. 2015, 2, 1061782. [Google Scholar] [CrossRef]
  2. Aulia, S.A.; Sukati, I.; Sulaiman, Z. A review: Customer perceived value and its dimension. Asian J. Soc. Sci. Manag. Stud. 2016, 3, 150–162. [Google Scholar] [CrossRef]
  3. Chang, C.; Dibb, S. Reviewing and conceptualising customer-perceived value. Mark. Rev. 2012, 12, 253–274. [Google Scholar] [CrossRef]
  4. Yang, Z.; Peterson, R.T. Customer perceived value, satisfaction, and loyalty: The role of switching costs. Psychol. Mark. 2004, 21, 799–822. [Google Scholar] [CrossRef]
  5. Eggert, A.; Ulaga, W. Customer perceived value: A substitute for satisfaction in business markets? J. Bus. Ind. Mark. 2002, 17, 107–118. [Google Scholar]
  6. Miao, R.; Xu, F.; Zhang, K.; Jiang, Z. Development of a multi-scale model for customer perceived value of electric vehicles. Int. J. Prod. Res. 2014, 52, 4820–4834. [Google Scholar] [CrossRef]
  7. He, X.; Hu, Y. Understanding the role of emotions in consumer adoption of electric vehicles: The mediating effect of perceived value. J. Environ. Plan. Manag. 2022, 65, 84–104. [Google Scholar] [CrossRef]
  8. Kim, M.K.; Oh, J.; Park, J.H.; Joo, K. Perceived value and adoption intention for electric vehicles in Korea: Moderating effects of environmental traits and government supports. Energy 2018, 159, 799–809. [Google Scholar] [CrossRef]
  9. Bányai, Á. Energy-Efficiency and Sustainability in Cross-Docking Supply Using E-Vehicles. Acta Electrotech. Inform. 2023, 8, 1–7. [Google Scholar] [CrossRef]
  10. Zeithaml, V.A. Consumer perceptions of price, quality, and value: A means-end model and synthesis of evidence. J. Mark. 1988, 52, 2–22. [Google Scholar]
  11. Lapierre, J. Customer-perceived value in industrial contexts. J. Bus. Ind. Mark. 2000, 15, 122–145. [Google Scholar] [CrossRef]
  12. Petrick, J.F. Development of a multi-dimensional scale for measuring the perceived value of a service. J. Leis. Res. 2002, 34, 119–134. [Google Scholar] [CrossRef]
  13. Sweeney, J.C.; Soutar, G.N. Consumer perceived value: The development of a multiple item scale. J. Retail. 2001, 77, 203–220. [Google Scholar] [CrossRef]
  14. Holbrook, M.B. Consumer Value: A Framework for Analysis and Research; Routledge: London, UK, 1999. [Google Scholar]
  15. Chen, Z.; Dubinsky, A.J. A conceptual model of perceived customer value in e-commerce: A preliminary investigation. Psychol. Mark. 2003, 20, 323–347. [Google Scholar] [CrossRef]
  16. Chen, P.T.; Hu, H.H. The effect of relational benefits on perceived value in relation to customer loyalty: An empirical study in the Australian coffee outlets industry. Int. J. Hosp. Manag. 2010, 29, 405–412. [Google Scholar] [CrossRef]
  17. Chen, C.F. Investigating structural relationships between service quality, perceived value, satisfaction, and behavioral intentions for air passengers: Evidence from Taiwan. Transp. Res. Part A Policy Pract. 2008, 42, 709–717. [Google Scholar] [CrossRef]
  18. Tu, Y.T.; Chih, H.C. An empirical study of corporate brand image, customer perceived value and satisfaction on loyalty in shoe industry. J. Econ. Behav. Stud. 2013, 5, 469–483. [Google Scholar] [CrossRef]
  19. Chen, C.F.; Chen, F.S. Experience quality, perceived value, satisfaction and behavioral intentions for heritage tourists. Tour. Manag. 2010, 31, 29–35. [Google Scholar] [CrossRef]
  20. Homburg, C.; Jozić, D.; Kuehnl, C. Customer experience management: Toward implementing an evolving marketing concept. J. Acad. Mark. Sci. 2017, 45, 377–401. [Google Scholar] [CrossRef]
  21. Pine, B.J.; Gilmore, J.H. The Experience Economy; Harvard Business Press: Boston, MA, USA, 2011. [Google Scholar]
  22. Jauhiainen, S. Investigating Customer Experiences of a Public Limited Company Brand in a B2B Context: A Case Study of the EV Charging Industry. 2023. Available online: https://jyx.jyu.fi/handle/123456789/87514 (accessed on 2 January 2024).
  23. Ullah, A.; Aimin, W.; Ahmed, M. Smart automation, customer experience and customer engagement in electric vehicles. Sustainability 2018, 10, 1350. [Google Scholar] [CrossRef]
  24. Al-Saadi, M.; Patkowski, B.; Zaremba, M.; Karwat, A.; Pol, M.; Chełchowski, Ł.; Mierlo, J.V.; Berecibar, M. Slow and fast charging solutions for li-ion batteries of electric heavy-duty vehicles with fleet management strategies. Sustainability 2021, 13, 10639. [Google Scholar] [CrossRef]
  25. Alexander, O.; Sloan, D.; Hughes, K.; Ashby, S. Engaging with quality via the CEM model: Enhancing the content and performance management of postgraduate in-sessional academic skills provision. J. Engl. Acad. Purp. 2017, 27, 56–70. [Google Scholar] [CrossRef]
  26. Arineli, A.; Quintella, H.L.M.M. CEM: Increasing productivity through the management and monitoring of experiences provided to customers. Cogent Bus. Manag. 2015, 2, 1023015. [Google Scholar] [CrossRef]
  27. Mert, ˙I.S.; Rihab, G.; Cem, ¸S.E.N. Understanding the Cognitive Dissonance on Women Post-Purchase Behavior. J. Int. Trade Logist. Law 2024, 10, 245–272. [Google Scholar]
  28. Lindholm, A.L.; Nenonen, S. A conceptual framework of CREM performance measurement tools. J. Corp. Real Estate 2006, 8, 108–119. [Google Scholar] [CrossRef]
  29. Meyer, C.; Schwager, A. Understanding customer experience. Harv. Bus. Rev. 2007, 85, 116. [Google Scholar]
  30. Lemon, K.N.; Verhoef, P.C. Understanding customer experience throughout the customer journey. J. Mark. 2016, 80, 69–96. [Google Scholar] [CrossRef]
  31. Ng, S.; Russell-Bennett, R.; Dagger, T. A typology of mass services: The role of service delivery and consumption purpose in classifying service experiences. J. Serv. Mark. 2007, 21, 471–480. [Google Scholar] [CrossRef]
  32. Hu, L.; Basiglio, A. A multiple-case study on the adoption of customer relationship management and big data analytics in the automotive industry. TQM J. 2023, 36, 1–21. [Google Scholar] [CrossRef]
  33. Bamford, D.R.; Greatbanks, R.W. The use of quality management tools and techniques: A study of application in everyday situations. Int. J. Qual. Reliab. Manag. 2005, 22, 376–392. [Google Scholar] [CrossRef]
  34. Rao, M. Knowledge Management Tools and Techniques; Routledge: Abingdon, UK, 2012. [Google Scholar]
  35. Ahmed, T.M.; Bezemer, C.P.; Chen, T.H.; Hassan, A.E.; Shang, W. Studying the effectiveness of application performance management (APM) tools for detecting performance regressions for web applications: An experience report. In Proceedings of the 13th International Conference on Mining Software Repositories, Austin, TX, USA, 14–15 May 2016; pp. 1–12. [Google Scholar]
  36. Laugwitz, B.; Held, T.; Schrepp, M. Construction and evaluation of a user experience questionnaire. In Proceedings of the HCI and Usability for Education and Work: 4th Symposium of the Workgroup Human-Computer Interaction and Usability Engineering of the Austrian Computer Society, USAB 2008, Graz, Austria, 20–21 November 2008; pp. 63–76. [Google Scholar]
  37. Rababah, K.; Mohd, H.; Ibrahim, H. Customer relationship management (CRM) processes from theory to practice: The pre-implementation plan of CRM system. Int. J. E-Educ. E-Bus. E-Manag. E-Learn. 2011, 1, 22–27. [Google Scholar]
  38. Wilson, H.; Daniel, E.; McDonald, M. Factors for success in customer relationship management (CRM) systems. J. Mark. Manag. 2002, 18, 193–219. [Google Scholar] [CrossRef]
  39. Kumar, V.; Reinartz, W. Customer Relationship Management; Springer: New York, NY, USA, 2018. [Google Scholar]
  40. Secinaro, S.; Calandra, D.; Lanzalonga, F.; Ferraris, A. Electric vehicles’ consumer behaviours: Mapping the field and providing a research agenda. J. Bus. Res. 2022, 150, 399–416. [Google Scholar] [CrossRef]
  41. Onat, N.C.; Kucukvar, M. A systematic review on sustainability assessment of electric vehicles: Knowledge gaps and future perspectives. Environ. Impact Assess. Rev. 2022, 97, 106867. [Google Scholar] [CrossRef]
  42. Weiller, C.; Neely, A. Using electric vehicles for energy services: Industry perspectives. Energy 2014, 77, 194–200. [Google Scholar] [CrossRef]
  43. Li, B.; Kisacikoglu, M.C.; Liu, C.; Singh, N.; Erol-Kantarci, M. Big data analytics for electric vehicle integration in green smart cities. IEEE Commun. Mag. 2017, 55, 19–25. [Google Scholar] [CrossRef]
  44. Zimmerman, J.; Forlizzi, J.; Evenson, S. Research through design as a method for interaction design research in HCI. In Proceedings of the SIGCHI Conference on Human Factors in Computing Systems, San Jose, CA, USA, 28 April–3 May 2007; pp. 493–502. [Google Scholar]
  45. Gaver, W. What should we expect from research through design? In Proceedings of the SIGCHI Conference on Human Factors in Computing Systems, Austin, TX, USA, 5–10 May 2012; pp. 937–946. [Google Scholar]
  46. Stappers, P.J.; Giaccardi, E. Research through design. In The Encyclopedia of Human-Computer Interaction; The Interaction Design Foundation: Aarhus, Denmark, 2017; pp. 1–94. [Google Scholar]
  47. Zimmerman, J.; Forlizzi, J. Research through design in HCI. In Ways of Knowing in HCI; Springer: New York, NY, USA, 2014; pp. 167–189. [Google Scholar]
  48. Desmet, P.; Overbeeke, K.; Tax, S. Designing products with added emotional value: Development and application of an approach for research through design. Des. J. 2001, 4, 32–47. [Google Scholar] [CrossRef]
  49. Zhao, H.; Furuoka, F.; Rasiah, R. The Influence of Psychological Factors on Consumer Purchase Intention for Electric Vehicles: Case Study from China: Integrating the Necessary Condition Analysis Methodology from the Perspective of Self-Determination Theory. World Electr. Veh. J. 2024, 15, 331. [Google Scholar] [CrossRef]
  50. Zhao, H.; Furuoka, F.; Rasiah, R.A.; Shen, E. Consumers’ Purchase Intention toward Electric Vehicles from the Perspective of Perceived Green Value: An Empirical Survey from China. World Electr. Veh. J. 2024, 15, 267. [Google Scholar] [CrossRef]
  51. Kraus, S.; Ribeiro-Soriano, D.; Schüssler, M. Fuzzy-set qualitative comparative analysis (fsQCA) in entrepreneurship and innovation research–the rise of a method. Int. Entrep. Manag. J. 2018, 14, 15–33. [Google Scholar] [CrossRef]
  52. Douglas, E.J.; Shepherd, D.A.; Prentice, C. Using fuzzy-set qualitative comparative analysis for a finer-grained understanding of entrepreneurship. J. Bus. Ventur. 2020, 35, 105970. [Google Scholar] [CrossRef]
  53. Geras, A.; Smith, M.; Miller, J. A prototype empirical evaluation of test driven development. In Proceedings of the 10th International Symposium on Software Metrics, Washington, DC, USA, 11–17 September 2004; pp. 405–416. [Google Scholar]
  54. Mahatody, T.; Sagar, M.; Kolski, C. State of the art on the cognitive walkthrough method, its variants and evolutions. Int. J. Hum.-Comput. Interact. 2010, 26, 741–785. [Google Scholar] [CrossRef]
  55. Blackmon, M.H.; Polson, P.G.; Kitajima, M.; Lewis, C. Cognitive walkthrough for the web. In Proceedings of the SIGCHI Conference on Human Factors in Computing Systems, Minneapolis, MN, USA, 20–25 April 2002; pp. 463–470. [Google Scholar]
  56. Kowalska-Pyzalska, A.; Michalski, R.; Kott, M.; Skowrońska-Szmer, A.; Kott, J. Consumer preferences towards alternative fuel vehicles. Results from the conjoint analysis. Renew. Sustain. Energy Rev. 2022, 155, 111776. [Google Scholar] [CrossRef]
  57. Sheth, J.N.; Newman, B.I.; Gross, B.L. Why we buy what we buy: A theory of consumption values. J. Bus. Res. 1991, 22, 159–170. [Google Scholar] [CrossRef]
  58. Chen, J. The Influence of Customer Perceived Value on Purchase Intention of New Energy Vehicles. Ph.D. Thesis, Donghua University, Shanghai, China, 2015. [Google Scholar]
  59. Chen, K.; Ren, C.; Gu, R.; Zhang, P. Exploring purchase intentions of new energy vehicles: From the perspective of frugality and the concept of “mianzi”. J. Clean. Prod. 2019, 230, 700–708. [Google Scholar] [CrossRef]
  60. Dodds, W.B.; Monroe, K.B.; Grewal, D. Effects of price, brand, and store information on buyers’ product evaluations. J. Mark. Res. 1991, 28, 307–319. [Google Scholar]
  61. Ng, M.; Law, M.; Zhang, S. Predicting purchase intention of electric vehicles in Hong Kong. Australas. Mark. J. (AMJ) 2018, 26, 272–280. [Google Scholar] [CrossRef]
Figure 1. Research structure.
Wevj 15 00378 g001
Figure 2. Data collection interface used in the experiment (translated from original).
Wevj 15 00378 g002
Figure 3. Annotation interface used in the experiment (translated from original).
Wevj 15 00378 g003
Figure 4. Action improvement interface used in the experiment (translated from original).
Wevj 15 00378 g004
Table 1. Customer experience management framework in the automotive industry.
StagesActivitiesObjectives
AwarenessMarketing, Social Media EngagementIncrease Brand Awareness, Educate Customers
ConsiderationTest Drives, Product ComparisonsProvide Information, Build Trust
PurchaseSales Process, Financing OptionsEnsure Smooth Purchase Experience, Close Sales
ServiceMaintenance, Customer SupportProvide Excellent Service, Address Issues
LoyaltyFeedback, Loyalty ProgramsFoster Loyalty, Encourage Repeat Purchases
Table 2. Summary of case studies. This table provides an overview of the objectives, methods, and results of the four case studies conducted in this research.
Case StudyPurposeObjectiveMethodResults
Case Study 1Identifying Factors Influencing EV PurchasesIdentify key factors influencing EV purchase decisionsSurveys analyzed with fsQCAIdentified price, quality, and brand image as key factors
Case Study 2Interview Analysis of CEM Tool UsersUnderstand workflows of CEM tool usersSemi-structured interviewsIdentified issues in time management and communication
Case Study 3Prototype Validation through Expert ReviewsValidate research findings and prototype designExpert reviews using Delphi methodValidated hypotheses and suggested prototype improvements
Case Study 4Usability Testing of CEM ToolEvaluate effectiveness of CEM toolUsability testing with SUSIdentified strengths and weaknesses, guiding optimization
Table 3. Cronbach’s alpha coefficients for various variables.
VariableCronbach’s α
Purchase Intention0.921
Use Value0.894
Price Value0.873
Emotional Value0.898
Social Value0.971
Table 4. KMO and Bartlett’s test results.
MeasureValue
Kaiser–Meyer–Olkin Measure0.983
Bartlett’s Test of Sphericity
Approx. Chi-Square7412.743
Degrees of Freedom (df)531
Significance (p-value)0.000
Table 5. Descriptive statistics and correlations.
VariableMeanStd. DevQuality ValuePrice ValueEmotional ValueSocial ValuePurchase Intention
Quality Value3.78550.781230.815
Price Value3.89680.772340.432 **0.873
Emotional Value3.88720.76532−0.012−0.0350.781
Social Value3.67120.82134−0.051−0.0390.497 **0.769
Purchase Intention3.65150.824670.435 **0.548 **−0.232 **−0.1140.812
Note: ** indicates significance at the 0.01 level (two-tailed).
Table 6. Necessity analysis of each antecedent condition.
Antecedent ConditionPurchase IntentionNon-Purchase Intention
ConsistencyCoverageConsistency Coverage
Use Value0.7597950.7536300.4691210.615996
 -Use Value0.6128220.4667250.8147640.819815
Price Value0.7319320.7234920.4847740.633137
 -Price Value0.6286110.4799890.7910010.799102
Emotional Value0.6210320.4861470.7290220.753901
 -Emotional Value0.6704530.6529230.5029910.637035
Social Value0.6486110.6589020.6547740.746269
 -Social Value0.7029320.6047660.6152690.699869
Table 7. Configurations leading to purchase intention.
ConditionConfig 1Config 2Config 3Config 4
Use ValueOO O
Price ValueOO
Emotional Value
Social Valuex x
Original Coverage0.4514060.5554530.4175590.398906
Unique Coverage0.05242690.04103220.07466380.0713743
Consistency0.8697560.9189450.9395750.882943
Overall Solution Coverage0.710585
Overall Solution Consistency0.837724
Note: O indicates core conditions, • indicates peripheral conditions, and x indicates absence or low level of the condition.
Table 8. Demographic characteristics of interview participants.
No.PositionLocationGenderAgeJob Responsibilities
S1SalesBeijingMale28Communicate with potential customers, understand their needs, and provide product information. Maintain a professional image to ensure customer trust.
S2SalesShanghaiMale25
C1UX DesignerBeijingFemale25Design user interfaces and experiences to enhance customer satisfaction.
C2UX DesignerShenzhenMale32
T1Product ManagerShanghaiFemale35Develop product strategies, plan roadmaps, and collaborate with teams to improve product quality.
T2Product ManagerChengduMale28
M1MarketingShanghaiFemale25Develop marketing strategies and conduct market analysis to ensure product market entry and recognition.
M2MarketingShanghaiFemale29
O1Service SupervisorNanjingMale30Ensure efficient operation and high service quality of the customer service team.
O2Service SupervisorShanghaiFemale37
Table 9. Phases of semi-structured interviews.
Interview PhaseInterview Content
Phase 1Action: Ice breaking, introduction to the study background, and ethical principles based on the Helsinki Declaration.
Goal: Establish trust and rapport with the interviewees and ensure they understand the importance of the research.
Phase 2Action: Collect basic information about the interviewees, such as age, gender, education, occupation, etc.
Goal: Better understand the interviewees’ backgrounds and personal characteristics.
Phase 3Action: Understand the current customer experience management tools used by the interviewees and how they use these tools to manage customer relationships.
Goal: Identify the problems and challenges faced by the interviewees in using these tools to better understand their needs and expectations.
Phase 4Action: Explore the interviewees’ work experiences, such as how they manage time, communicate with colleagues, handle tasks, and interact with customers.
Goal: Gain a deeper understanding of the interviewees’ work scenarios, workflows, and work requirements.
Table 10. Innovation design opportunities.
Pain PointsImpact on Perceived Customer ValueInnovation Design Opportunities
1. Limited offline experience mapsReduces use and emotional value due to lack of reuse and coordinationImplement online experience map creation
2. No visualization of customer footprintsLowers emotional and social value, causing dissatisfactionAdd visualization of customer footprints and profiles
3. Absence of component librariesComplicates design, affecting use and emotional valueIntroduce customizable component libraries
4. No multi-channel surveysMisses changes in emotional value, reducing loyaltyDeploy multi-channel experience surveys
5. Undefined customer journey metricsHinders understanding of product valueDefine clear customer journey metrics
6. Inconsistent metrics across departmentsVaries service quality, impacting perceived valueIntegrate operational metrics tracking
Table 11. User usability testing task table.
Task NumberTask Content
1Find and enter the workstation to select and open a recent project.
2Locate the most recent project in project management and open the user profile.
3Edit the user’s name, age, and notes in the profile and save the changes.
4Find and open the user’s journey map to edit user tags.
5Save the user journey map and find it in data analysis.
6Locate and open multidimensional data analysis in the data analysis section.
7Open the user perceived value analysis, dissect the data, and find the source file.
8Use the data annotation function to upload a test file and perform data annotation.
9Free exploration phase, allowing participants to explore the prototype as they wish.
Table 12. Expert evaluation details.
Expert NamePositionCompanyResponsible ProductIndustry Experience
Zhang KaiSenior Customer Experience ResearcherShanghai Automotive GroupElectric Vehicle Intelligent Connectivity SystemOver 10 years in EV customer experience, specializing in user research, needs analysis, and experience design.
Li MingSenior Interaction DesignerBeijing Automotive GroupEV Infotainment SystemOver 7 years in EV customer experience design, experienced in user research, interaction design, and usability testing.
Wang QiangSenior Systems EngineerGuangzhou Tesla CenterEV Intelligent Driving Assistance SystemExtensive experience in EV customer experience management tools, specializing in systems engineering design and intelligent control algorithms.
Chen JingSenior Software EngineerShenzhen BYDEV Intelligent Charging SystemOver 10 years in EV customer experience management tools, specializing in software development, experience design, and testing.
Table 13. SUS questionnaire scores.
ParticipantQ1Q2Q3Q4Q5Q6Q7Q8Q9Q10Total ScoreSUS Score
153425434453978
242354355343876
334434453443876
442324224343060
554445444354284
635554253333876
743434534543978
822222424522754
933333335233162
1044344554344080
Average43.23.53.33.93.63.743.53.836.272.4
Table 14. Participant demographics.
No.NameCompanyRole
1Karen LeeNSales
2Michael ChenNUX Designer
3Michelle WangNProduct Manager
4Sophie LiuPService Manager
5John WuPMarketing
6Jessica ZhangSB2B UX Designer
7Alex WangSB2B Product Manager
8Jane LiSMarketing
9Eric LiCService Manager
10Emily WangCMarketing
11Kevin ChenBB2B UX Designer
12Lily ZhangBB2B Product Manager
13Tony ChenBOperations
14Grace ZhouAService Manager
15Michael LiuAMarketing
16Sarah WuAB2B UX Designer
17Jason ChenDProduct Manager
18Steven ZhangDService Manager
Table 15. Gender and age distribution of experimental and control groups.
CategoryExperimental GroupControl GroupX2p-Value
Age 0.0830.773
25 and under7 (70%)6 (67%)
26–352 (20%)2 (22%)
36 and over1 (10%)1 (11%)
Gender 0.0001.000
Male6 (60%)5 (56%)
Female4 (40%)4 (44%)
Table 16. Experimental task design.
Task StageTask Details
Data CollectionTask 1: Open the questionnaire collection feature
Task 2: Find and view data from the “Metaverse Virtual Space” survey
Task 3: Publish the completed “Experience Design Questionnaire A”
Task 4: Select the app delivery method for the questionnaire
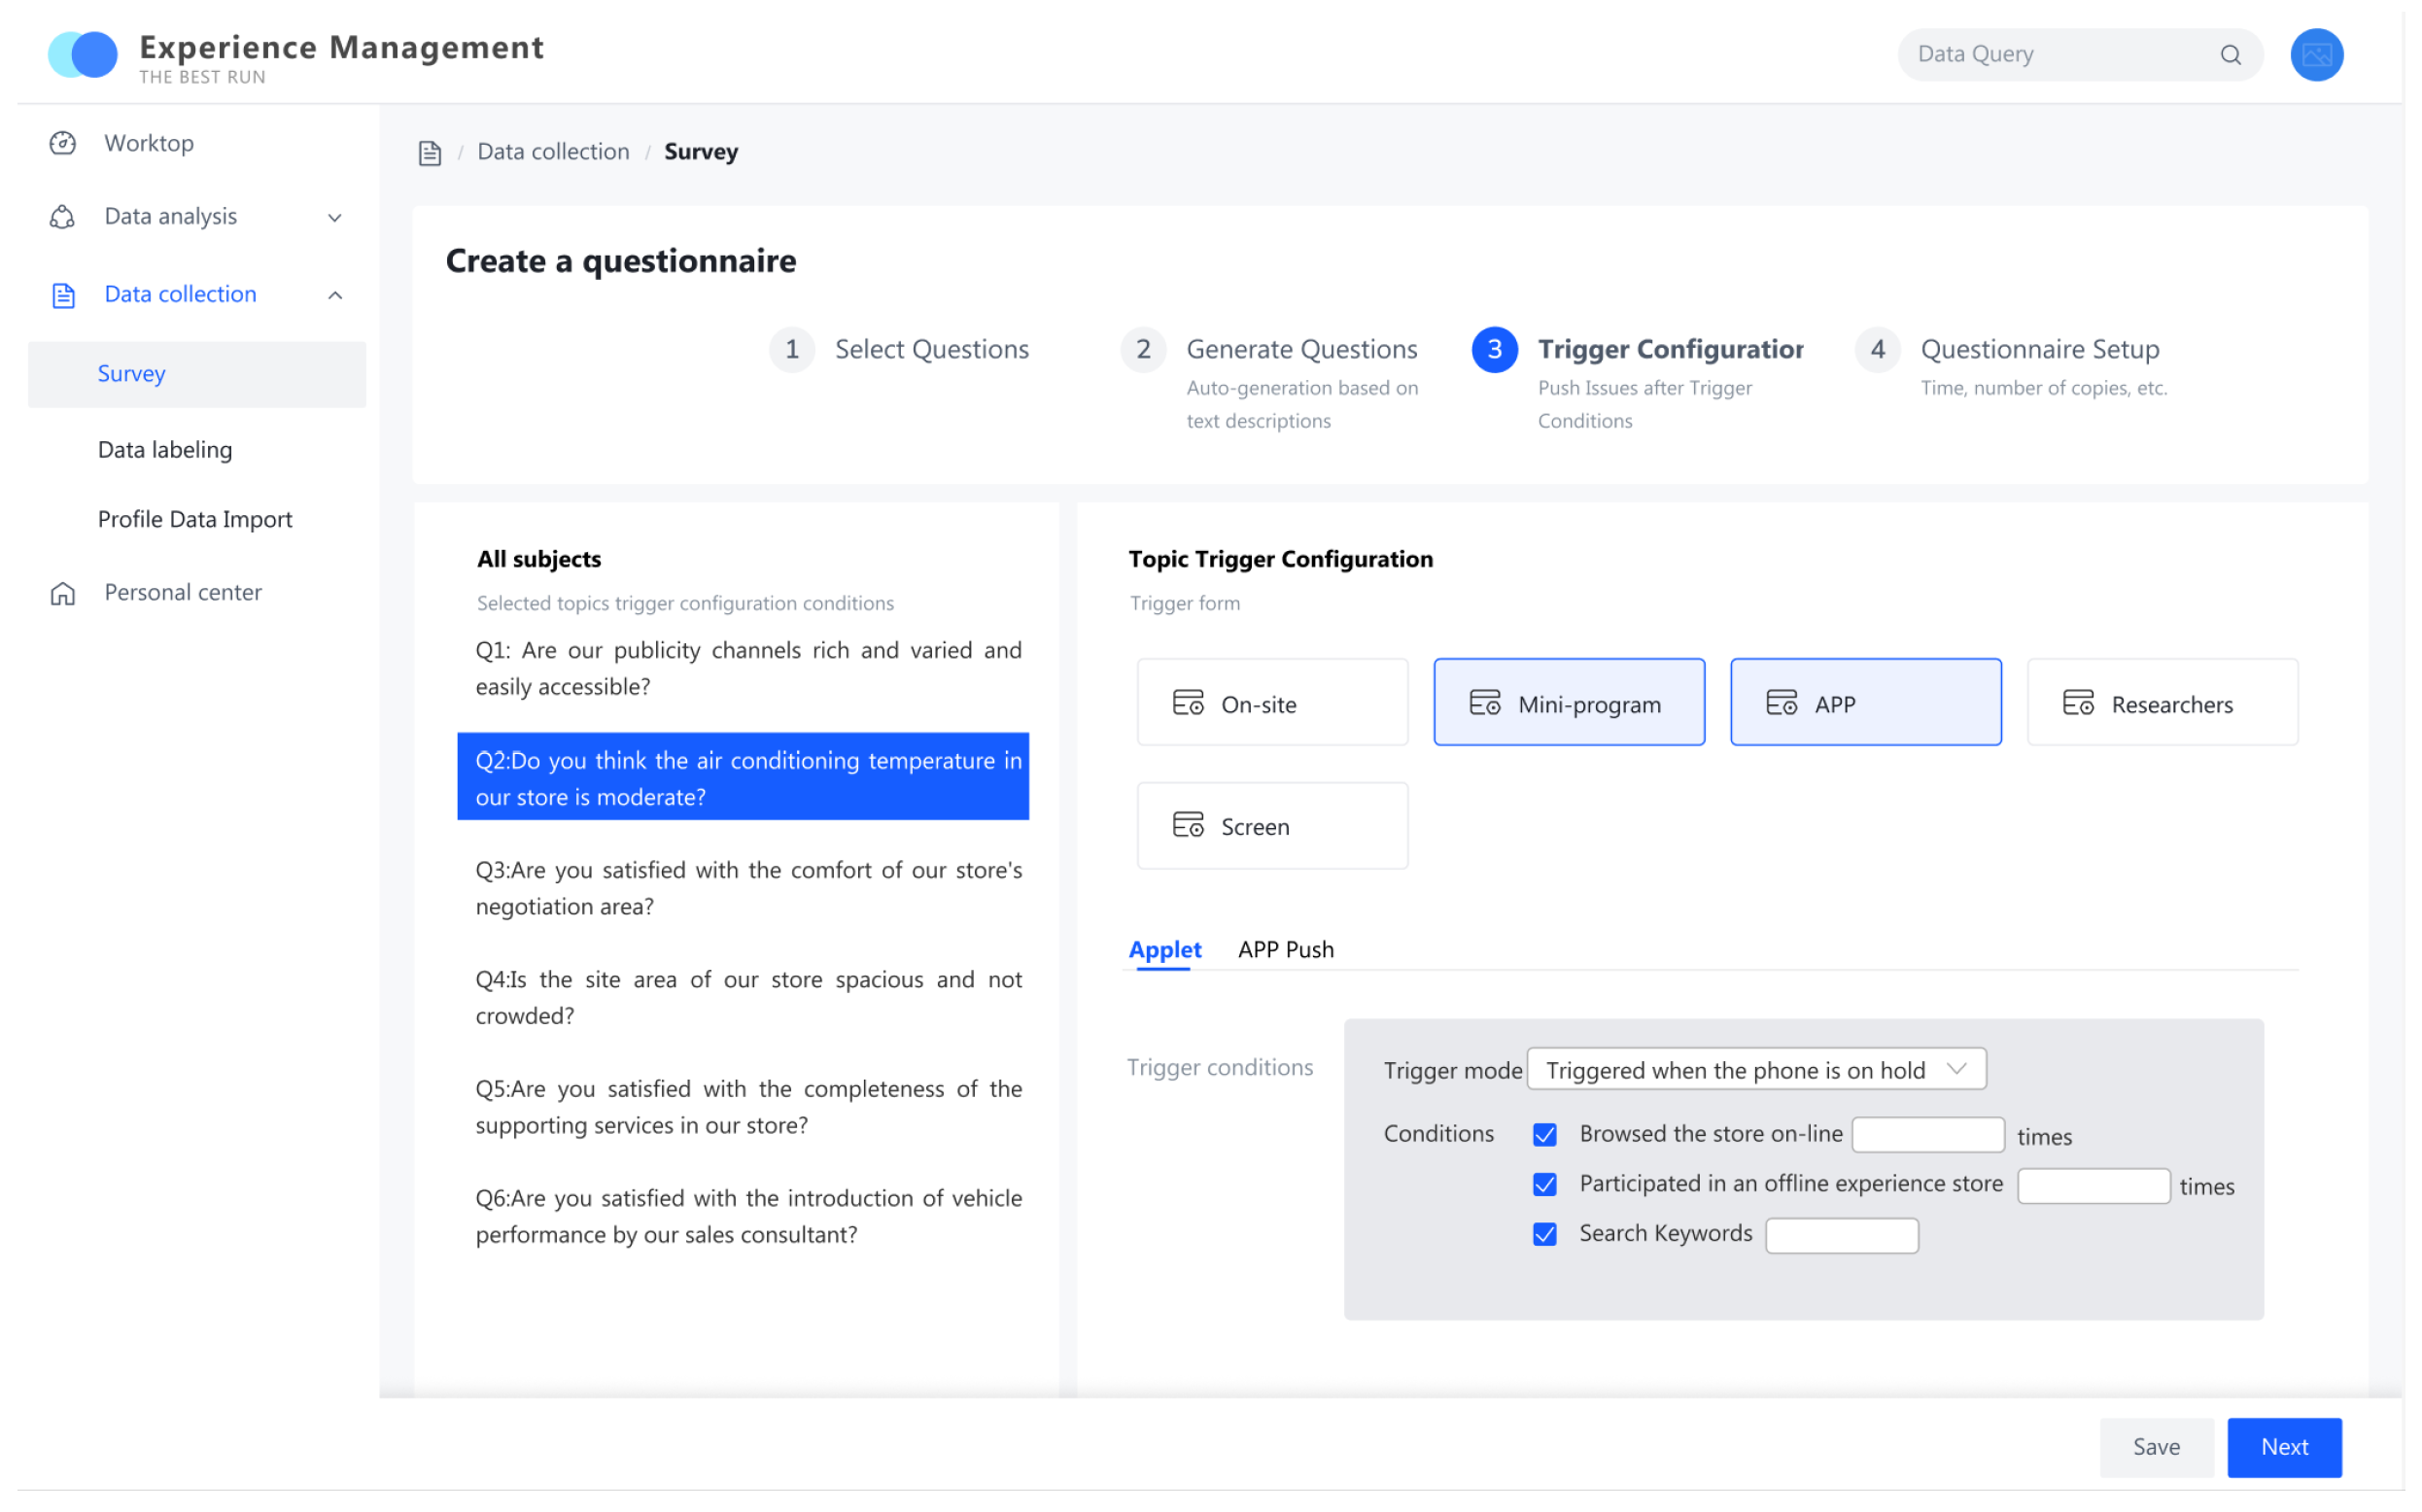
Task 5: Change Q2 trigger to “phone screen off”
Task 6: Save and send the questionnaire
Action ImprovementTask 7: Open the welcome page of the workstation
Task 8: Search for the warning center in the search box
Task 9: View the warnings in the warning center
Task 10: Track a low-score experience
Task 11: Trace the customer journey to find issues
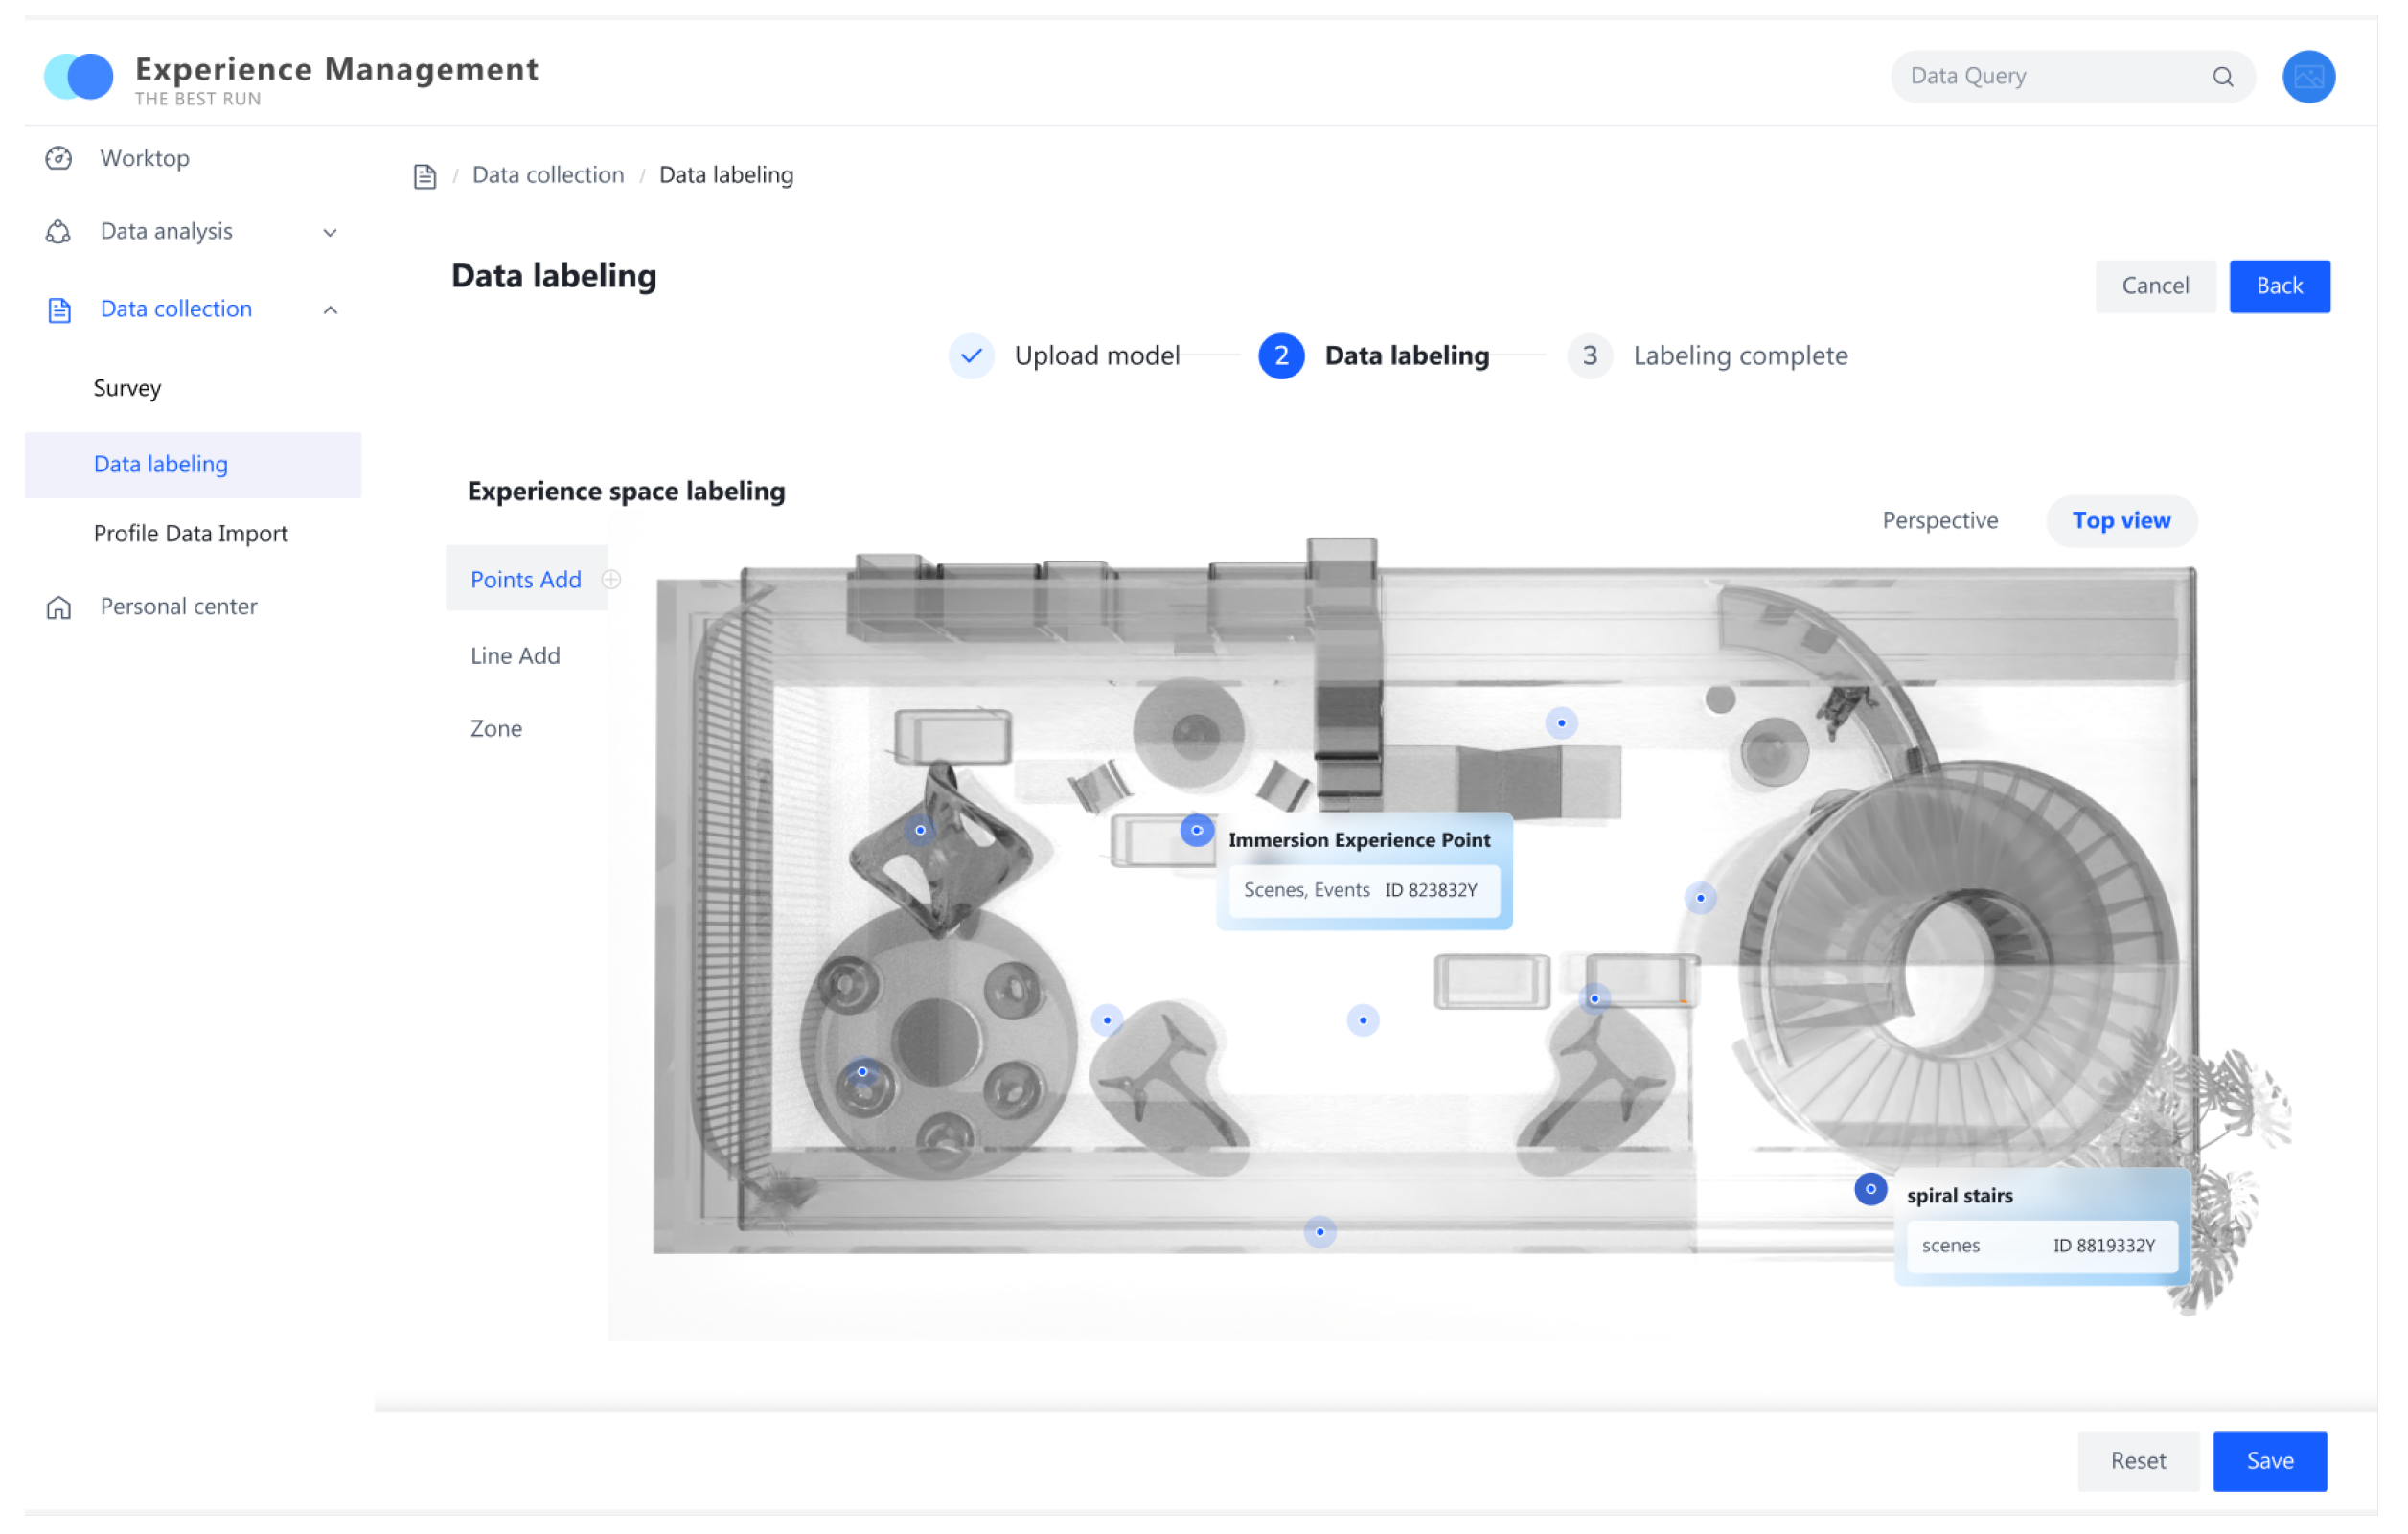
Data AnnotationTask 12: Upload “demo.3ds” model to the annotation interface
Task 13: Add and rename a point of interest (POI)
Task 14: Add paths between POI A and B
Task 15: View and delete POI C in the global view
Task 16: Save the model annotations
Table 17. Control group experiment flow.
StepTimeExperimental GroupControl Group
Pre-experiment10 minIntroduce objectives, background, and methodsFill out basic information
Sign informed consent
Experiment20 minIntroduce prototype and usageIntroduce Beisite XM and usage
Complete tasks using prototypeComplete tasks using Beisite XM
Post-experiment10 minFill out questionnaire
Participant interviews
End of experiment, gift distribution
Table 18. Job function comparison.
Job FunctionExperimental GroupControl Group
Marketing21
Service Manager22
Product Manager22
Sales22
UX Design22
X20.500
p>0.05
Table 19. Data collection usability scores.
MetricExperimental GroupControl GroupDifferencetp
Usability4.2 ± 0.33.7 ± 0.30.5 ± 0.42.330.033
Understandability3.5 ± 0.23.0 ± 0.20.5 ± 0.282.830.012
Efficiency4.0 ± 0.33.7 ± 0.30.3 ± 0.41.500.148
Effectiveness4.1 ± 0.23.8 ± 0.20.3 ± 0.31.740.096
Aesthetics3.25 ± 0.272.75 ± 0.270.50 ± 0.385.1110.002
Table 20. Data annotation usability scores.
MetricExperimental GroupControl GroupDifferencetp
Usability3.5 ± 0.23.0 ± 0.20.5 ± 0.42.830.012
Understandability3.2 ± 0.32.8 ± 0.30.4 ± 0.42.330.033
Efficiency3.2 ± 0.23.6 ± 0.20.4 ± 0.32.830.012
Effectiveness3.8 ± 0.33.5 ± 0.30.3 ± 0.41.740.096
Aesthetics3.7 ± 0.33.3 ± 0.30.4 ± 0.42.330.033
Table 21. Action improvement usability scores.
MetricExperimental GroupControl GroupDifferencetp
Usability3.2 ± 0.32.8 ± 0.30.4 ± 0.42.330.003 **
Understandability3.0 ± 0.23.5 ± 0.20.5 ± 0.32.830.004 **
Efficiency3.1 ± 0.32.8±0.30.3 ± 0.42.330.029
Effectiveness3.7 ± 0.23.3±0.20.4 ± 0.32.830.045
Aesthetics3.4 ± 0.32.8 ± 0.30.6 ± 0.42.330.001 **
Note: ** p < 0.01.
Disclaimer/Publisher’s Note: The statements, opinions and data contained in all publications are solely those of the individual author(s) and contributor(s) and not of MDPI and/or the editor(s). MDPI and/or the editor(s) disclaim responsibility for any injury to people or property resulting from any ideas, methods, instructions or products referred to in the content.

