Abstract
Charge management, which lowers charging costs for fleets and prevents straining the electrical grid, is critical to the successful deployment of medium- and heavy-duty battery-electric trucks (MHD BETs). This study introduces an energy demand and cost management framework that optimizes depot charging for MHD BETs by combining an energy consumption machine learning model and a linear program optimization model. The framework considers key factors impacting real-world MHD BET operations, including vehicle and charger configurations, duty cycles, use cases, geographic and climate conditions, operation schedules, and utilities’ time-of-use (TOU) rates and demand charges. The framework was applied to a hypothetical fleet of 100 MHD BETs in California under three different utilities for 365 days, with results compared to unmanaged charging. The optimized charging solution avoided more than 90% of on-peak charging, reduced fleet charging peak load by 64–75%, and lowered fleet energy variable costs by 54–64%. This study concluded that the proposed charge management framework significantly reduces energy costs and peak loads for MHD BET fleets while making recommendations for fleet electrification infrastructure planning and the design of utility TOU rates and demand charges.
1. Introduction
Medium- and heavy-duty (MHD) battery electric trucks (BETs) have experienced accelerated adoption in real-world operations, driven by greenhouse gas (GHG) emissions reduction plans at state- and nation-level, promoted by electric vehicle (EV) sales and adoption regulations, demonstration projects, and incentives and tax credits programs from leading states. Reducing GHG emissions from the transportation sector through fleet electrification was highlighted in the President’s Long-Term Strategy of the United States to reach net zero by 2050 [1]. Many states in the U.S. have adopted state-level GHG emission reduction goals to protect climate resiliency and environmental benefits and emphasized the big potential of emission reduction from transitioning to zero-emission transportation [2,3,4]. A total of 1851 federal and state laws, regulations, and funding opportunities for EVs have been established, with 686 entries applicable to commercial users [5] to promote achieving the commitment. As part of many efforts [6] to reach its air quality and climate targets of reducing GHG emissions by 40% by 2030 and 80% by 2050, California sets zero-emission truck (ZET) sales target for MHD truck or chassis manufacturers in the Advanced Clean Truck (ACT) Regulation [7]. Specifically, by 2035, zero-emission truck or chassis sales would reach 55% for Class 2b–3 truck sales, 75% of Class 4–8 straight truck sales, and 40% of truck tractor sales in California annually [7]. In a similar position that aims to reduce GHG emissions and improve air quality and climate resiliency, many states in the United States have adopted ACT to set targets of zero-emission MHD truck sales by 2035, including Oregon [8], Washington [9], Maryland [10], New York [11], New Jersey [12], Vermont [13], Massachusetts [14], Rhode Island [15], Colorado [16], and New Mexico [17]. As a result, the ZETs population has been growing rapidly. As of December 2023, more than 30,000 ZETs have been deployed in the US, with approximately 25,378 ZETs deployed in 2023 alone [18]. While EVs only represent a small portion of the nationally registered trucks of 12.95 million in 2023, more than 10 states had doubled or even increased by five-fold the deployments of ZETs from 2022 to 2023 [18], indicating a strong year-over-year growth in the ZET market.
MHD BETs fulfill certain fleets’ duty cycle requirements for operations and serve as a cleaner and more cost-effective solution than alternative fuel trucks. California Air Resources Board has funded several pilot projects in preparation for transportation electrification to support large-scale fleet adoption of MHD ZEVs and to deploy MHD BETs and electric vehicle supply equipment (EVSE) at freight facilities near disadvantaged communities endangered by local air pollution. These pilot projects have revealed that MHD BETs can meet a fleet’s required duty cycle on shorter regional haul routes while significantly reducing its greenhouse gas emissions and operational costs [19,20]. Heavy-duty BETs also generate fewer life cycle emissions, costs, and externalities than other alternative fuel heavy-duty trucks, including biodiesel B20, compressed natural gas, and hybrid-electric [21], making them more effective in reducing GHG emissions and reaching net zero targets.
To reach federal and state net-zero GHG emission goals and remediate climate change, many fleets currently using diesel vehicles will either be mandated or incentivized to adopt BETs soon [6], which urges all stakeholders to prepare for the significant transition. As an influx of MHD BET fleets begins charging their vehicles, utilities responsible for providing communities with electricity need to prepare for the demand from such large-scale transportation electrification. Unmanaged charging events—where EV users plug in their vehicles without regard for grid conditions—present a challenge for utilities to improve grid resilience or the ability of the grid system to prevent, mitigate, and recover from wide-area, long-duration outages [22]. There are multiple strategies utilities use to influence users’ electricity usage and incentivize the management of peak loads. The time-of-use (TOU) rate plans encourage users to shift their electricity usage to the times of day when demand is lower by setting up lower electricity rates during those times [23,24]. Utilities also employ demand charges that are based on a customer’s maximum power draw over a time interval to recover the costs of providing sufficient generation and distribution capacity [25]. These new utility policies, in turn, add an additional layer of complexity for diesel fleets transitioning to electric fleets. Under a utility rate structure that incorporates both TOU rates and demand charges, an electric truck fleet can possibly incur high TOU costs with high demand charges if the entire fleet of EVs converged to recharge energy simultaneously at times of high electricity rates to meet operation requirements [26]. This undesirable situation could be averted and transformed into substantial operational cost savings by implementing proactive charging management strategies within fleets.
With the constantly evolving utility policy landscape, fleets must understand how to manage charging effectively to maximize their operational cost savings when electrifying a diesel fleet. Charging limitations can complicate the deployment of BETs and create a challenge for fleets to sustain their daily operations [27]. Data on real-world MHD freight trucks are new and scarce, and the industry is still learning best practices to transition to BET operations [28]. Without the adequate resources needed to develop a fleet electrification strategy, fleets switching from diesel vehicles—who have never had to consider electricity TOU rates, electricity demand management, EVSE procurement, or infrastructure installation as part of their operations—may encounter difficulty scaling and choosing the proper configuration of chargers for their BETs and may default to unmanaged charging schedules, which can lead to higher operational costs for fleets.
Past EV deployment projects have demonstrated that fleets may reduce their energy variable costs while improving the reliability of their electrical infrastructure through the adoption of charge management strategies. Prohaska et al. (2016) [29] reported that at Frito–Lay North America’s Federal Way facility, the fleet reduced their peak demand by up to 23% with the addition of a tuning parameter in their managed charging system, thus reducing their opportunity charging power demand from 138 kilowatts (kW) to 106 kW and their energy bills by 6–12%. Similarly, simulated managed charging scenarios for Stockton Unified School District’s electric buses flattened power demand to 689 kW, which saved the bus fleet more than $11,000 each month [30]. As part of the Goodwill Industries Electric Vehicle project, the fleet developed a staggered charging schedule where a maximum of three chargers ran at any one time based on their evaluation of utility-rate options for their facilities to estimate their energy variable costs, demonstrating that fleet understanding of utility pricing is integral to develop successful charge management strategies [31]. Opportunity charging, a charging pattern where vehicles are plugged in and charged whenever they are not in use, is a common strategy for fleets—particularly for off-road EVs such as yard tractors that are in use around the clock during daily operations [29,32]. However, as a strategy, it is not always cost-efficient or accommodating of on-road EV schedules [33].
The current research focused on EV charge management has yielded several sophisticated optimization models to address the financial and environmental impacts of unmanaged charging schedules. Liu et al. (2021) [34] took on the issue of scheduling EVs with a limited number of chargers for cost reduction while supplying energy demand for each vehicle. They used a bilevel programming model where the upper level determines the available charging time of EVs through a mixed nonlinear integer program, and the lower level solves the charging power by responding to the charging window and TOU rates through a linear program. Zhou et al. (2019) [35] used game theory to design a distribution scheduling scheme for EV charging where charging cost was reduced by 44.2% compared with a baseline scheduling algorithm. Apart from most research that adopted algorithm-based models, Shah et al. (2014) [36] combined machine learning models for load profile prediction on building and EV loads with traditional load control techniques.
Charge management algorithms were developed for electric buses to optimize both depot and route charging schedules and infrastructure deployment. Jahic et al. (2019) [37] developed an optimization model for large-scale electric bus depot charging scheduling to minimize peak load. Their optimization framework proposes a greedy-logic algorithm and a heuristic algorithm that iteratively minimizes peak demand to choose charging intervals for each electric bus. The greedy schedule reduced peak load from unmanaged charging scheduling by 24.4–37.7%, while the heuristic schedule reduced peak load by 27.1–42.6%. In their model, however, they do not consider utility TOU rates and operational costs for bus fleets. He et al. (2020) [38] used linear programming to optimize bus scheduling for multiple bus lines, considering partial charging, demand charges, TOU rate structure, and smart charge management. They identified the strong potential of linear programming in real-world applications and concluded that the model could reduce total charging costs by 33.8–66.2% in comparison to unmanaged charging. He et al. (2023) [39] then developed a more comprehensive optimization framework modeling electric bus trip scheduling using both enroute and depot charging, vehicle battery state of charge (SOC), managed charging scenarios with peak demand control, and chargers equipped with multiple outlets to minimize a bus fleet’s total cost of ownership. They used a tailored genetic algorithm-based solution approach with nonlinear constraints in vehicle scheduling and linear constraints in the charging scheduling modeling. Alternative scenarios were found to have a higher total amortized daily cost of ownership by 5.5–24.9% than the optimized scenario. Though comprehensive, their framework is limited to electric buses and cannot be applied adequately to other MHD EVs.
Most of the current literature on charge management was based on electric light-duty passenger vehicles or transit vehicles such as buses and vans. Electric light-duty passenger vehicles or transit vehicles have use cases distinct from drayage and freight movement applications [37,39], given (1) that buses generally operate on more fixed routes than trucks and (2) the complexity of real-world vehicle efficiencies and energy consumption. The distinct use cases of vehicle models, along with geographic and climate factors, can result in variations in vehicle energy efficiencies and consumption in operations [40]. Drayage, short-haul, and mid-haul freight operations are leading the electrification in MHD freight transportation, as vehicles under these use cases regularly return to the fleet depot and recharge during dwelling hours using onsite chargers [41]. Installing depot chargers mitigates the risk of operational delay caused by long wait times at public charging stations, as low-power depot charging is identified as the main charging solution for MHD BETs [42]. Therefore, effective energy consumption estimation and infrastructure and charging management at fleet facilities are crucial for appropriately scaling charger capacities to meet vehicle operational requirements while optimizing fleet operational costs and controlling the impact of depot high peak load [26] on the national grid.
Given that existing depot charging optimization models for MHD BET fleets in the current literature tend to oversimply the estimation of vehicle energy consumption on a daily basis, and considering the importance of depot charging to fleets leading the electrification transition, this study establishes a framework to predict the energy consumption requirements of an MHD BET fleet and optimize its depot charging schedules. Section 2.1 elaborates on the framework, detailing the machine learning model trained on real-world operational data from MHD BETs in the US, as well as the linear programming model that minimizes energy costs and fleetwide peak load. To assess its feasibility and impact, the optimization framework was applied to a hypothetical freight movement fleet under three different electricity utilities in California, as described in Section 2.2. Section 3.1 provides a detailed examination of the optimized charging schedule on an example day to illustrate how the algorithm approaches depot charging optimization. Section 3.2 compares the fleetwide charging load profile, while Section 3.3 analyzes the differences in fleet energy variable costs between managed and unmanaged charging scenarios. Section 3.4 emphasizes the importance of utility demand charges for effective fleet energy demand management. The paper closes with Section 4, which concludes the scale of cost savings and peak load reduction by adopting fleet depot charging optimization, the benefits and implications to fleet operators, electricity utilities, and policymakers, along with suggestions for future studies.
2. Materials and Methods
2.1. Optimizing Truck Fleet Depot Charging to Minimize Fleetwide Charging Cost
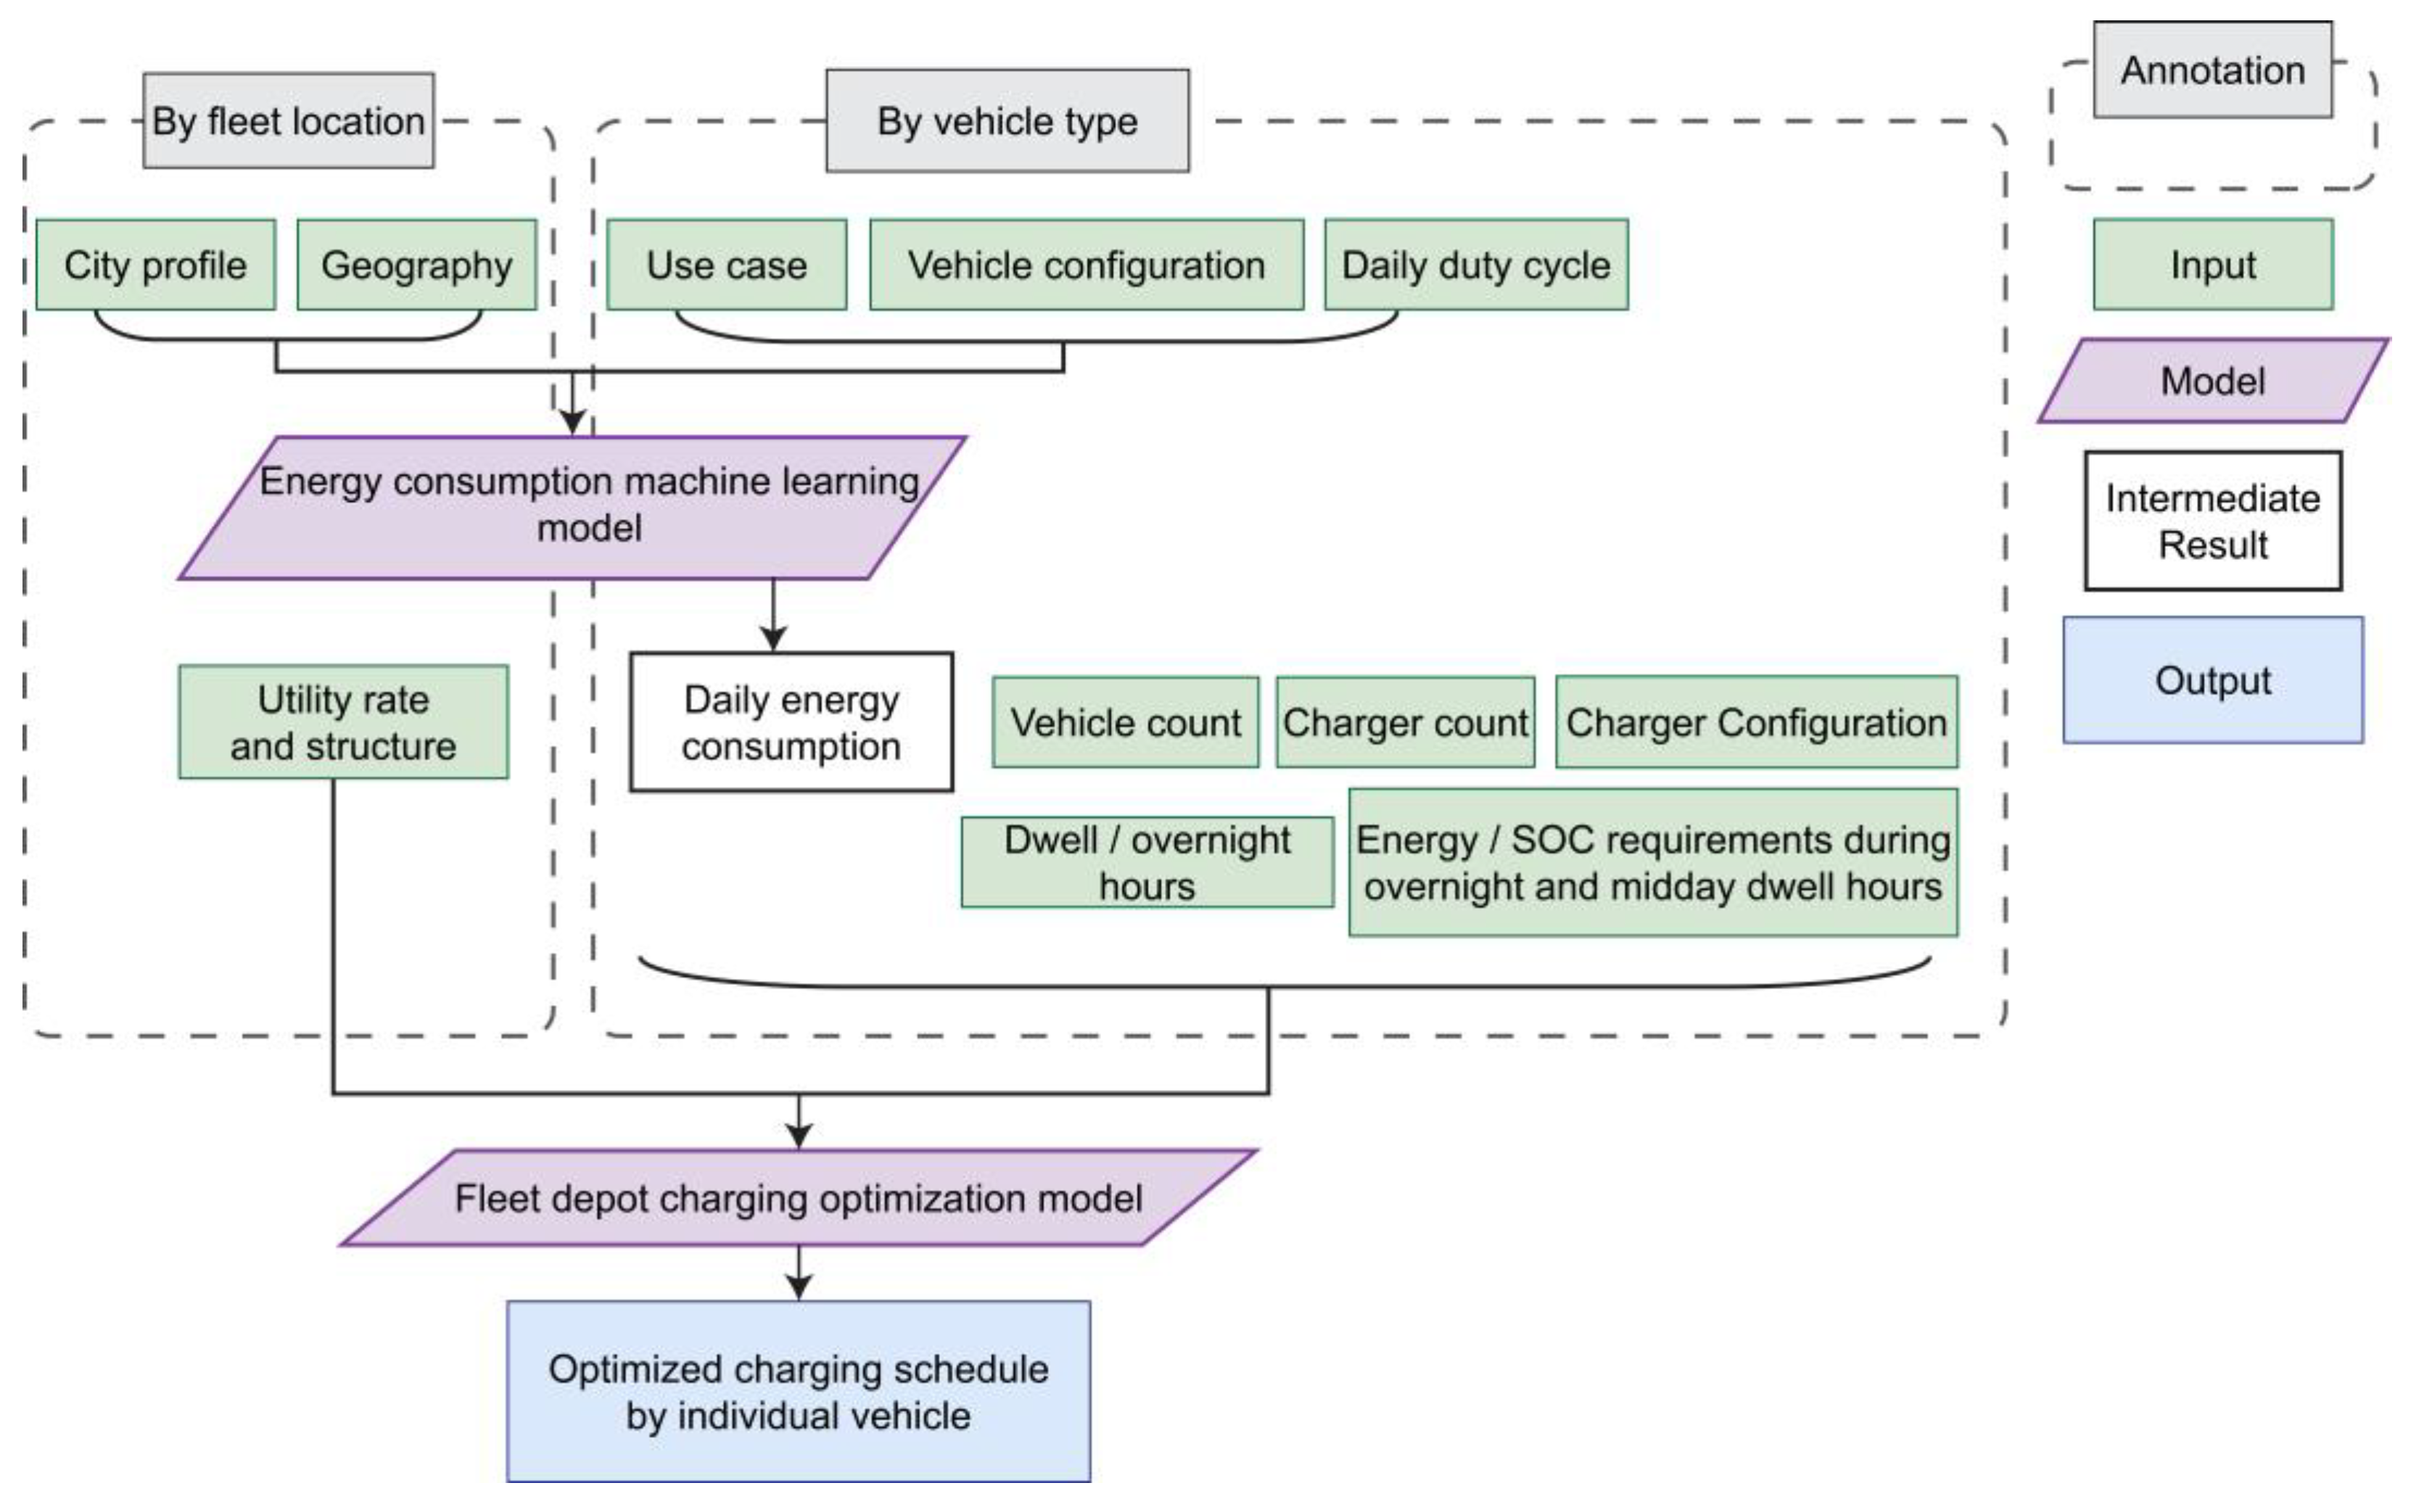
The developed modeling framework consists of two models: an energy consumption machine learning model and a fleet depot charging optimization model (Figure 1). The machine learning model predicts the daily energy consumption of an MHD BET given data on vehicle operation [40], which is then used in the optimization model with data on vehicles, chargers, and electricity utility rates used by the fleet to optimize charging schedules at the individual vehicle level, with the objective of minimizing fleetwide energy peak demand and variable costs. Various operational factors are considered in the framework, including vehicle configurations, use cases, duty cycles, dwell hours, energy and SOC requirements, charger configurations, fleet locations, utility TOU rate, and demand charges.
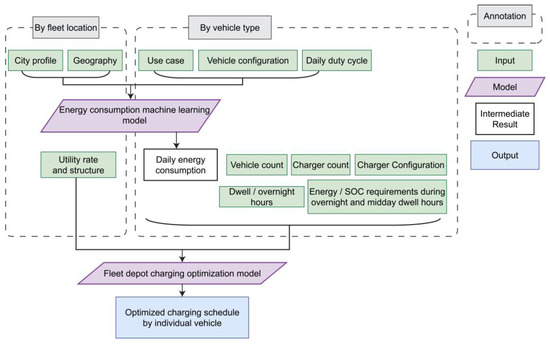
Figure 1.
Flow chart of optimization framework (Input, Intermediate Result, Output).
2.1.1. Energy Consumption Machine Learning Model
The machine learning model developed by Qiu et al. (2023) [40] was applied using supervised machine learning to predict the daily energy efficiency of a selected vehicle model in a selected city, which the result is then converted to daily energy consumption through multiplication to daily distance traveled by the vehicle. The energy efficiency model was built on a gradient boosting algorithm (R2 = 0.77) and trained on 26,724 vehicle days of real-world MHD EV performance data collected through the U.S. Department of Energy’s (DOE) Medium- and Heavy-Duty EV Deployment: Data Collection project [43]. It considered over 20 real-world predictors (Table 1) that can influence vehicle efficiency, such as duty cycle, climate, road grade, congestion, vehicle configurations, use cases, and geographies. Some features, such as driving speed, congestion, ambient temperature, and total distance, are found in the machine learning model to be more important than others in determining vehicle energy efficiency. That indicated the importance of simulating the more realistic energy consumption using various combinations of duty cycles and climates in the selected localities throughout a year of 365 days.

Table 1.
Input features used in the energy consumption machine learning model.
2.1.2. Fleet Depot Charging Optimization Model
This section unfolds the optimization model for fleet depot charging to minimize fleetwide peak demand and electricity variable cost, including TOU and demand charge. The objectives and constraints of linear programming are unfolded and explained. An iterative process used to find the minimal feasible fleetwide peak load is elaborated.
Let variable vct denote a non-negative hourly charging duration for vehicle vk charger type and dwell hour , where denotes a set of vehicles that can be classified into vehicle type . Thus, variable kct denotes the hourly charging duration for all vehicles in a vehicle type . Let denote overnight dwell hours and denote midday break hours. Let c denote charger efficiency, and ρc denote the charger’s rated maximum power of charger type . Charger efficiency c accounts for the energy loss between energy drawn from the grid and energy received by a vehicle. Let Ek denote the predicted daily energy consumption of vehicle type . Let αk denote the maximum percentage of daily energy to be replenished during midday break for the prior shift for vehicle type . Let Bk denote the battery capacity of vehicle with vehicle type . To return a charging schedule that can prevent using 100% SOC of a vehicle’s batteries during operation to maintain battery health, the optimization algorithm employed variable βk, the minimum SOC before overnight charging, into modeling. Let rt denote the utility TOU rate at dwell hour and γ denote the monthly facility demand charge rate.
The following linear program (LP1) is used to find the minimal viable TOU cost of the fleet when absent of controlling demand:
subject to
The objective (1) of LP1 is set to find the hourly charging duration vct for each vehicle in each dwell hour that minimizes the total TOU cost of the fleet by summing the product of charging duration vct, the charger’s rated maximum power ρc and the utility TOU rate rt across all vehicles and all dwell hours. Constraint (2) ensures that each vehicle charges no more than one hour from all possible chargers in a dwell hour. Constraint (3) ensures that the total charging time of all vehicles in any vehicle type cannot exceed the charger counts of the corresponding charger types in a dwell hour. Constraint (4) ensures that each vehicle charges the predicted daily energy consumption from all chargers and through all dwell hours after accounting for charger efficiency. Constraint (5) sets the maximum energy to be charged from all chargers during overnight dwell hours for each vehicle. Constraint (6) regulates the maximum energy to be charged from all chargers during midday break hours for each vehicle.
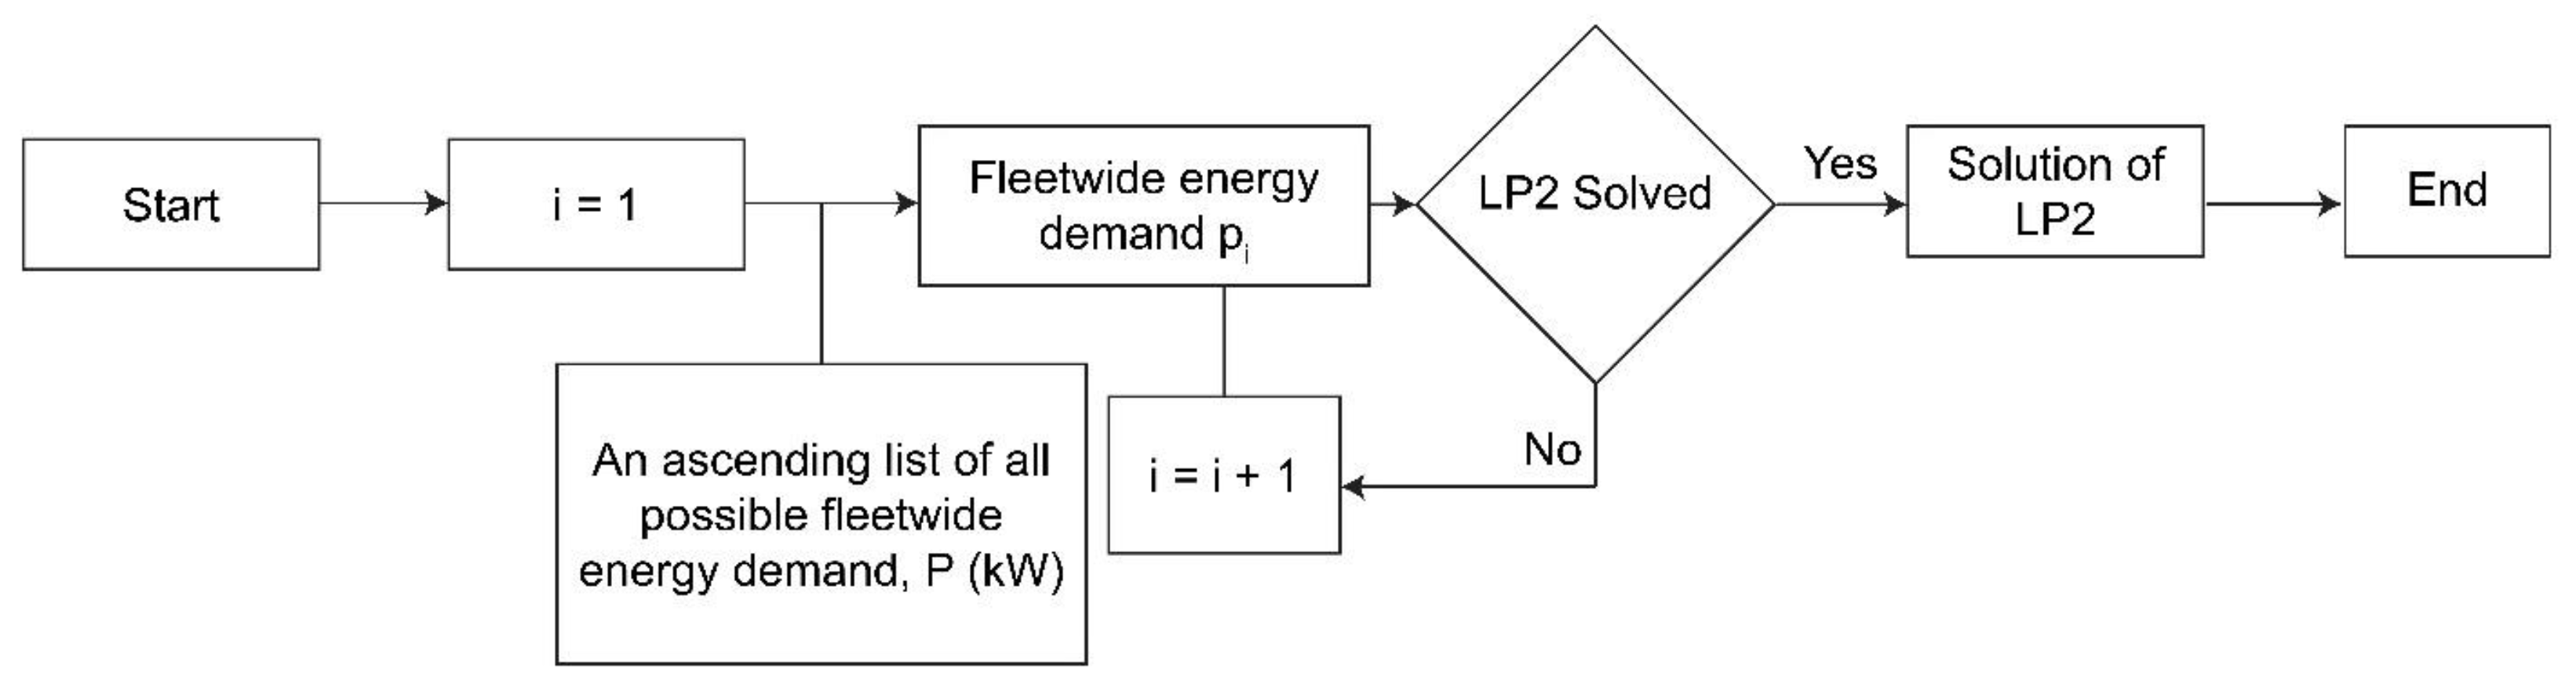
The objective value of LP1 (Objval1) is computed and used in a second linear program (LP2) coupled with iterations to find charging scenarios that minimize the overall maximum hourly energy demand of the fleet (Figure 2). A list of all possible fleetwide charging power—created given charger-rated maximum power and number of vehicles—is filtered to all values equal to or above the fleet flat charging rate f, calculated by dividing the fleet daily total energy consumption by the total dwell hour. The filtered list, coupled with the ceiling of rate f, is sorted in ascending order to form a list of all possible fleetwide hourly energy demands of the fleet, denoted as list P. The iteration starts from the first element in list P, running LP2, until finding the ith element pi in list P, given which LP2 could have a valid solution.
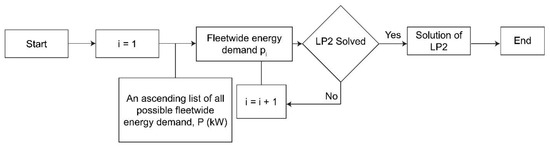
Figure 2.
Iteration process in the second linear program (LP2). Energy demand, P, is measured in kilowatts (kW).
LP2 inherits all constraints from LP1 and has the following objective (7) and the new constraints (8) and (9):
subject to
Objective (7) is set to find the charging duration of all vehicles in the last dwell hour tT that minimizes its hourly energy demand. Constraint (8) sets the new TOU cost to be no greater than the minimized TOU cost found by LP1 plus the daily demand charge under the fleet flat charging rate. Constraint (9) regulates hourly energy demand to be no more than the ith element in the ascending list of all possible fleetwide energy demand for each dwell hour.
2.2. Scenario Case Study in Ontario, San Diego, and San Jose
To demonstrate the methodology and solutions of the developed optimization framework, this section first predicts 365-day energy consumption for a hypothetical fleet of 100 trucks in three California cities: Ontario (ON), San Diego (SD), and San Jose (SJ). Each city is served by a different utility with its own TOU rate and demand charge policy. With the predicted energy consumption, an optimized charging schedule was created at the truck level. Finally, this section compares the optimized electricity demand and costs to unmanaged charging. The scenario case study captures temporal and spatial variations in fleet operation and different utility rate designs of the three major providers in California.
2.2.1. Unmanaged Charging
Without charge management in place, truck fleets tend to charge on a predetermined schedule when the dwell time begins. As the baseline scenario in this study, unmanaged charging is defined as a charging method in which an EV is plugged in and starts to charge immediately after operation. The vehicle keeps charging as fast as it can until it reaches 100% SOC or until the new operating shift begins [37,44].
2.2.2. Hypothetical Fleet Profile
The hypothetical fleet operates three types of electric trucks: 20 Class-8 day-cab tractors, 50 Class-7 box trucks, and 30 Class-6 step vans (Table 2). Real-world truck models and chargers were selected for each vehicle type. The step vans were coupled with both Level 2 alternate current chargers and direct current fast chargers (DCFCs). Charging efficiency accounts for the disparity between energy drawn from the grid being recorded by the utility meter and energy received by the battery. The vehicle-to-charger ratio was purposely chosen between 1:1 and 2:1, which was a range found to support future charging needs of MHD ZEVs in California [45]. In addition, assuming chargers have a maximum of two ports per station, this configuration allows operators to plug all trucks into chargers at the same time and complete charging by configuring charging management software. When two vehicles are charging simultaneously, the optimization model assumes that the maximum charging rate per port will be equal to half of the maximum charging rate. A vehicle-to-charger ratio larger than the number of ports per charger would require a standby worker to disconnect and reconnect trucks, thus increasing labor costs and making charging plans during overnight hours less efficient.
Table 2.
Composition of trucks and charging infrastructure.
Each truck type was planned to have slightly different midday dwell hours for opportunity charging, while overnight dwell hours were the same across all types: between 6 p.m. and 5 a.m. of the next day (Table 3). Trucks would start operation with 100% SOC, recharge the predicted energy consumption fully for that day during the midday and overnight dwell hours, and start operation at 5 a.m. on the next day with a full battery. The minimum battery SOC at the beginning of overnight charging (Table 2) was set to protect the battery from over-discharging. If a vehicle were modeled to deplete SOC lower than the pre-set percentage, opportunity charging during the midday break would replenish it. Midday opportunity charging was also capped by a percentage of the predicted daily energy consumption. The cap prevents the framework from proposing charging plans where predicted energy was fully recharged during the midday break while a certain portion of it was consumed during the afternoon shift.
Table 3.
Fleet vehicle operation and dwell schedules.
2.2.3. Predicting Daily Energy Consumption
Compared with a simple constant assumption of energy consumption rate from the previous literature, the energy consumption machine learning model explained in Section 2.1.1 provides a more realistic and scrutinized estimation of energy demand as a key input to the optimization model [39]. Given their importance in the energy consumption machine learning model [40], data on climate [46,47,48], congestion level [49], and road grade [50,51,52] were collected for 365 days in 2023 in each city (Table 4). Duty cycles were simulated for 365 days in 2023 by vehicle types based on real-world data from DOE’s Medium- and Heavy-Duty EV Deployment: Data Collection project and reports on MHD trucks [40,53,54] (Table 5).
Table 4.
City profiles of Ontario, San Diego, and San Jose (for climate data: mean and 95% confidence interval (CI)).
Table 5.
Duty cycles for each vehicle model.
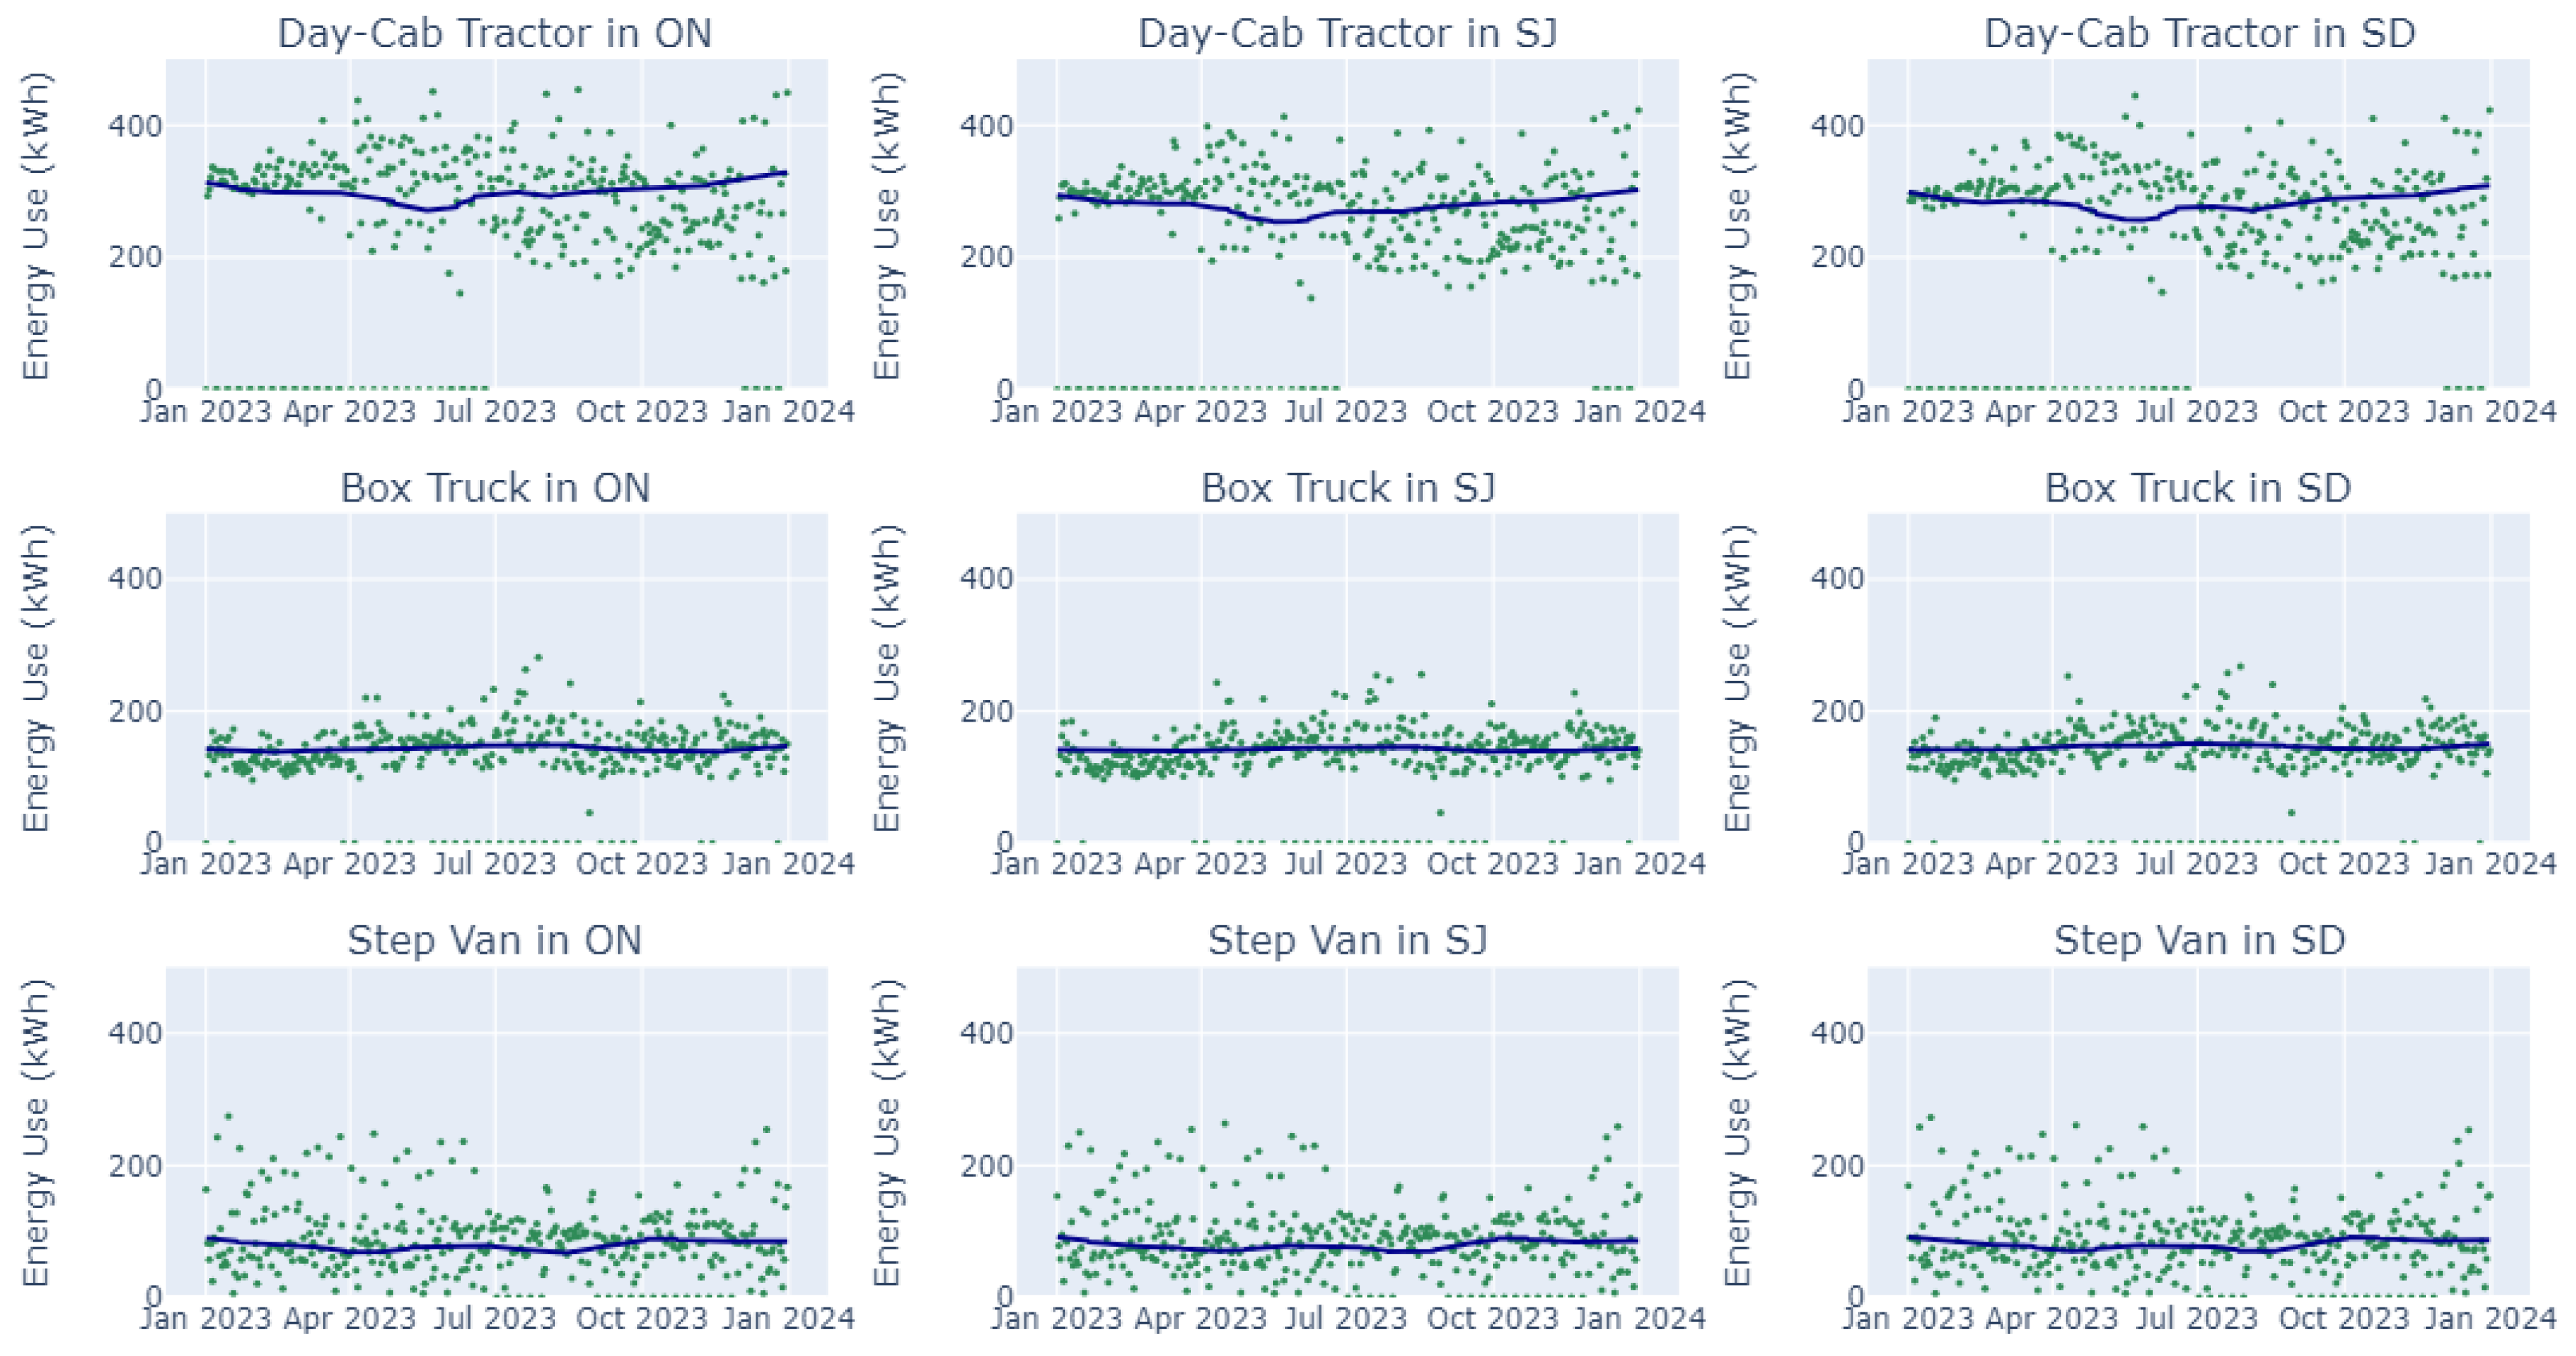
Using the city profiles, geography of fleet locations, and truck duty cycles, energy consumption was estimated by truck type and day throughout 2023 in the three California cities (Figure 3). A Loess line was fitted to each plot to show the annual trend. Energy use estimates were zero on some days when the trucks were not operated, such as during weekends or holidays. Though the predicted energy use for each vehicle type did not vary substantially across cities overall, it captured the impacts of climate variations over the year, as well as congestion and road-grade level differences across cities.
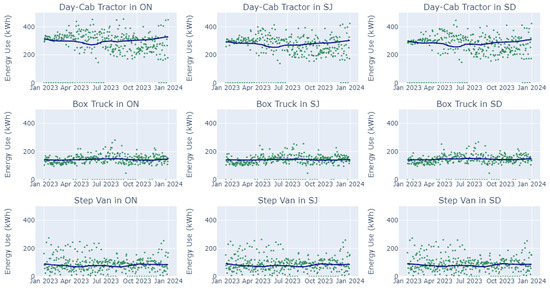
Figure 3.
Predicted energy use of Class-8 day-cab tractor, Class-7 box truck, and Class-6 step van in Ontario (ON), San Jose (SJ), and San Diego (SD).
2.2.4. Utility Rate Structure in Three Service Territories
The value of demand-side flexibility has been increasingly recognized to support evolving power system planning and operation. Utilities in Europe and the United States have developed numerous demand response programs to have energy demand match supply, which can be more cost-effective as opposed to traditional supply match demand [55]. Energy shifting pricing schemes such as TOU and demand charges can help address the challenges of balancing energy load over various timescales and improve grid resilience when an increasing volume of electrified fleets plug into the grid to power their day-to-day operations.
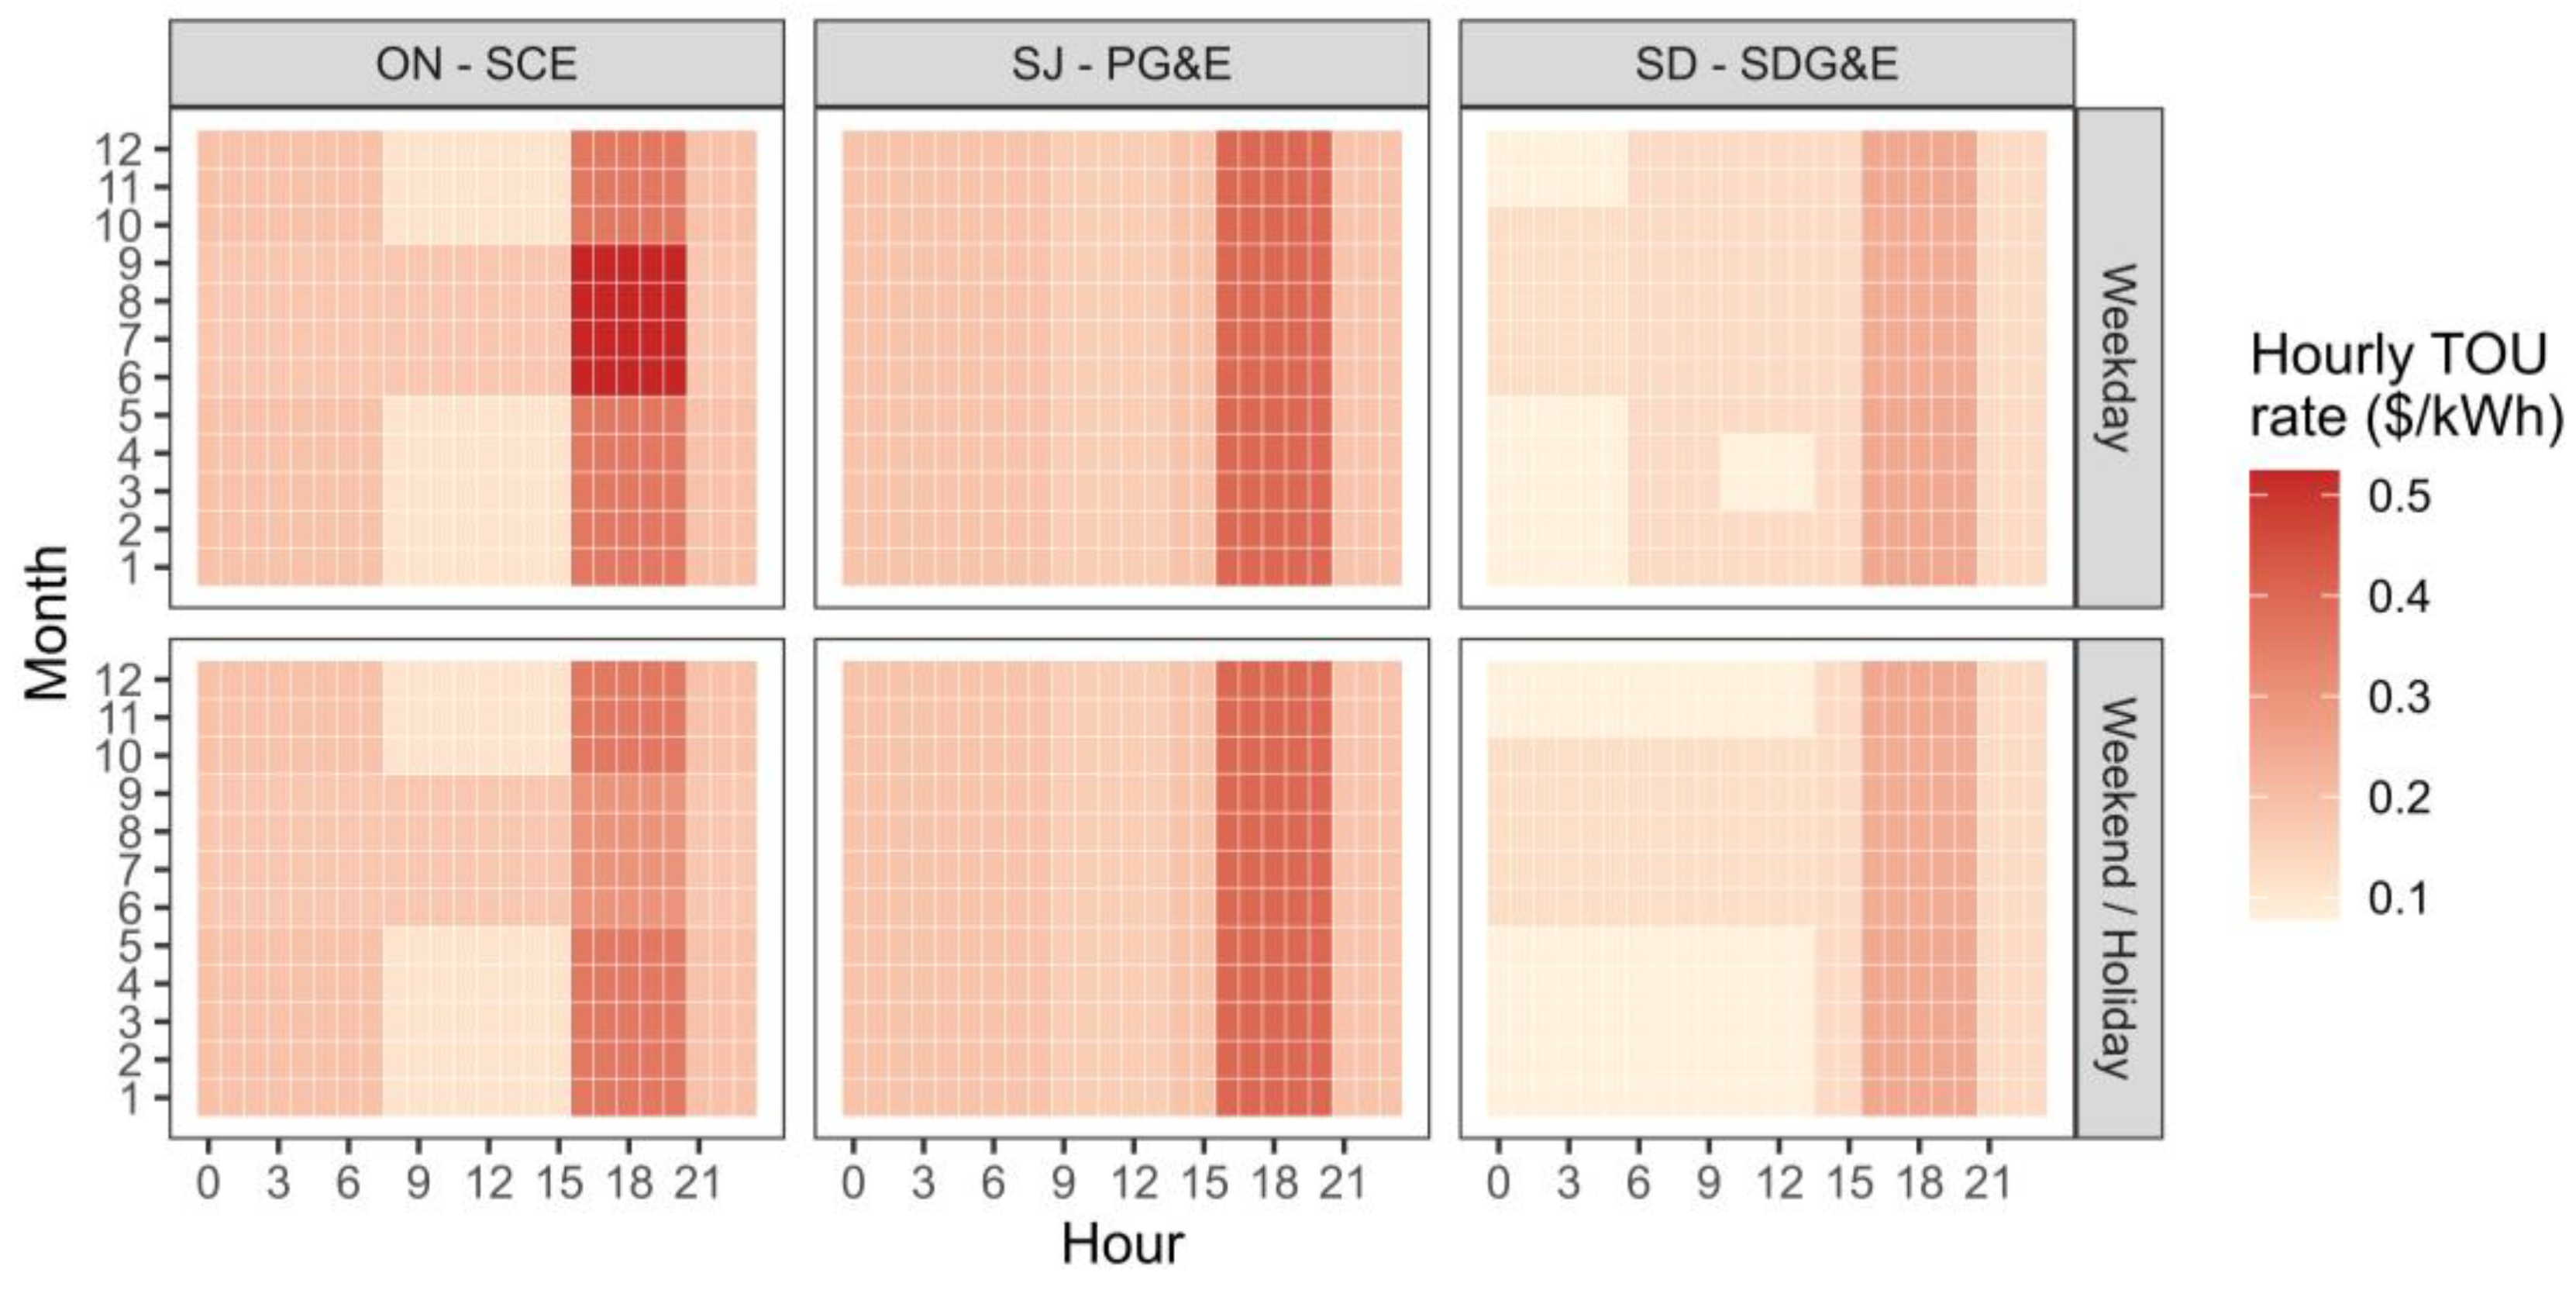
ON, SJ, and SD fall under the service territories of three major utility providers in California, namely Southern California Edison (SCE), Pacific Gas and Electric (PG&E), and San Diego Gas & Electric (SDG&E). Each utility has a distinct rate structure. Table 6 summarizes the TOU rate plans that apply for commercial fleet charging with maximum demand above 500 kW in 2023 [56,57,58]. All three utilities set peak and on-peak hours between 4 p.m. and 9 p.m. when energy demand in the system is highest. SCE and SDG&E differentiate rates in summer and winter and on weekdays and weekends/holidays to adapt to load demand in the predefined peak hours, while PG&E uses the same across months and days of the week (Figure 4). SCE has the highest TOU rates among the three, even doubling that of SDG&E, while it exempts demand charges for customers under its TOU-EV-9 rate plan until 2026 (Table 7). In contrast, SDG&E has the lowest TOU rates and the highest demand charge rates. Both PG&E and SDG&E have adopted subscription-based demand charge policies as of 2023.
Table 6.
TOU rates for three main Californian utilities (2023).

Figure 4.
Hourly time-of-use (TOU) rates by weekday and weekend/holiday for Southern California Edison (SCE), Pacific Gas and Electric (PG&E), and San Diego Gas & Electric (SDG&E) in each month of 2023. Rates are measured in dollars per kilowatt-hour (kWh).
Table 7.
Demand charge policies for three main Californian utilities (2023).
Demand charges were employed to lower customers’ concentrated energy use. Understanding demand charge rates can be less straightforward than TOU rates. SDG&E has a higher tolerance for bumps in energy demand and will allow customers to exceed the current level for three consecutive months before they adjust the subscription level. They use additional summer on-peak demand charges to encourage customers to control energy demand between 4 p.m. and 9 p.m. PG&E, however, applies lower price levels than SDG&E in demand charges—less than $2/kW—but has relatively larger increments of subscription blocks compared with SDG&E.
3. Results and Discussion
This section presents the results of the scenario case study for the hypothetical fleet regarding charging schedule, fleet energy demand, and costs. With inputs of fleet profile, predicted daily energy consumption, and utility rate structure as described in Section 2.2, unmanaged and managed vehicle-level charging schedules were computed for 100 trucks in 365 days in the three cities. The run time of the optimization model was averaged at 3.75 h for each city, equivalent to 0.370 s/vehicle-day algorithm processing speed. This section first demonstrates how the charging load was spread throughout an example day by the optimization model, then compares fleetwide energy demand and cost of optimized charging with unmanaged charging, and finally ends the discussion with insights on utility rate design.
3.1. Optimized Charging Schedule in an Example Day
The fleet depot charging optimization model allocates the charging time of each vehicle to lower TOU costs and meet the requirements of minimum SOC at the start of overnight charging while balancing fleetwide energy demand. Charging optimization was achieved by utilizing opportunity charging during midday breaks, staggering charging among different truck types, and controlling the number of trucks charging simultaneously.
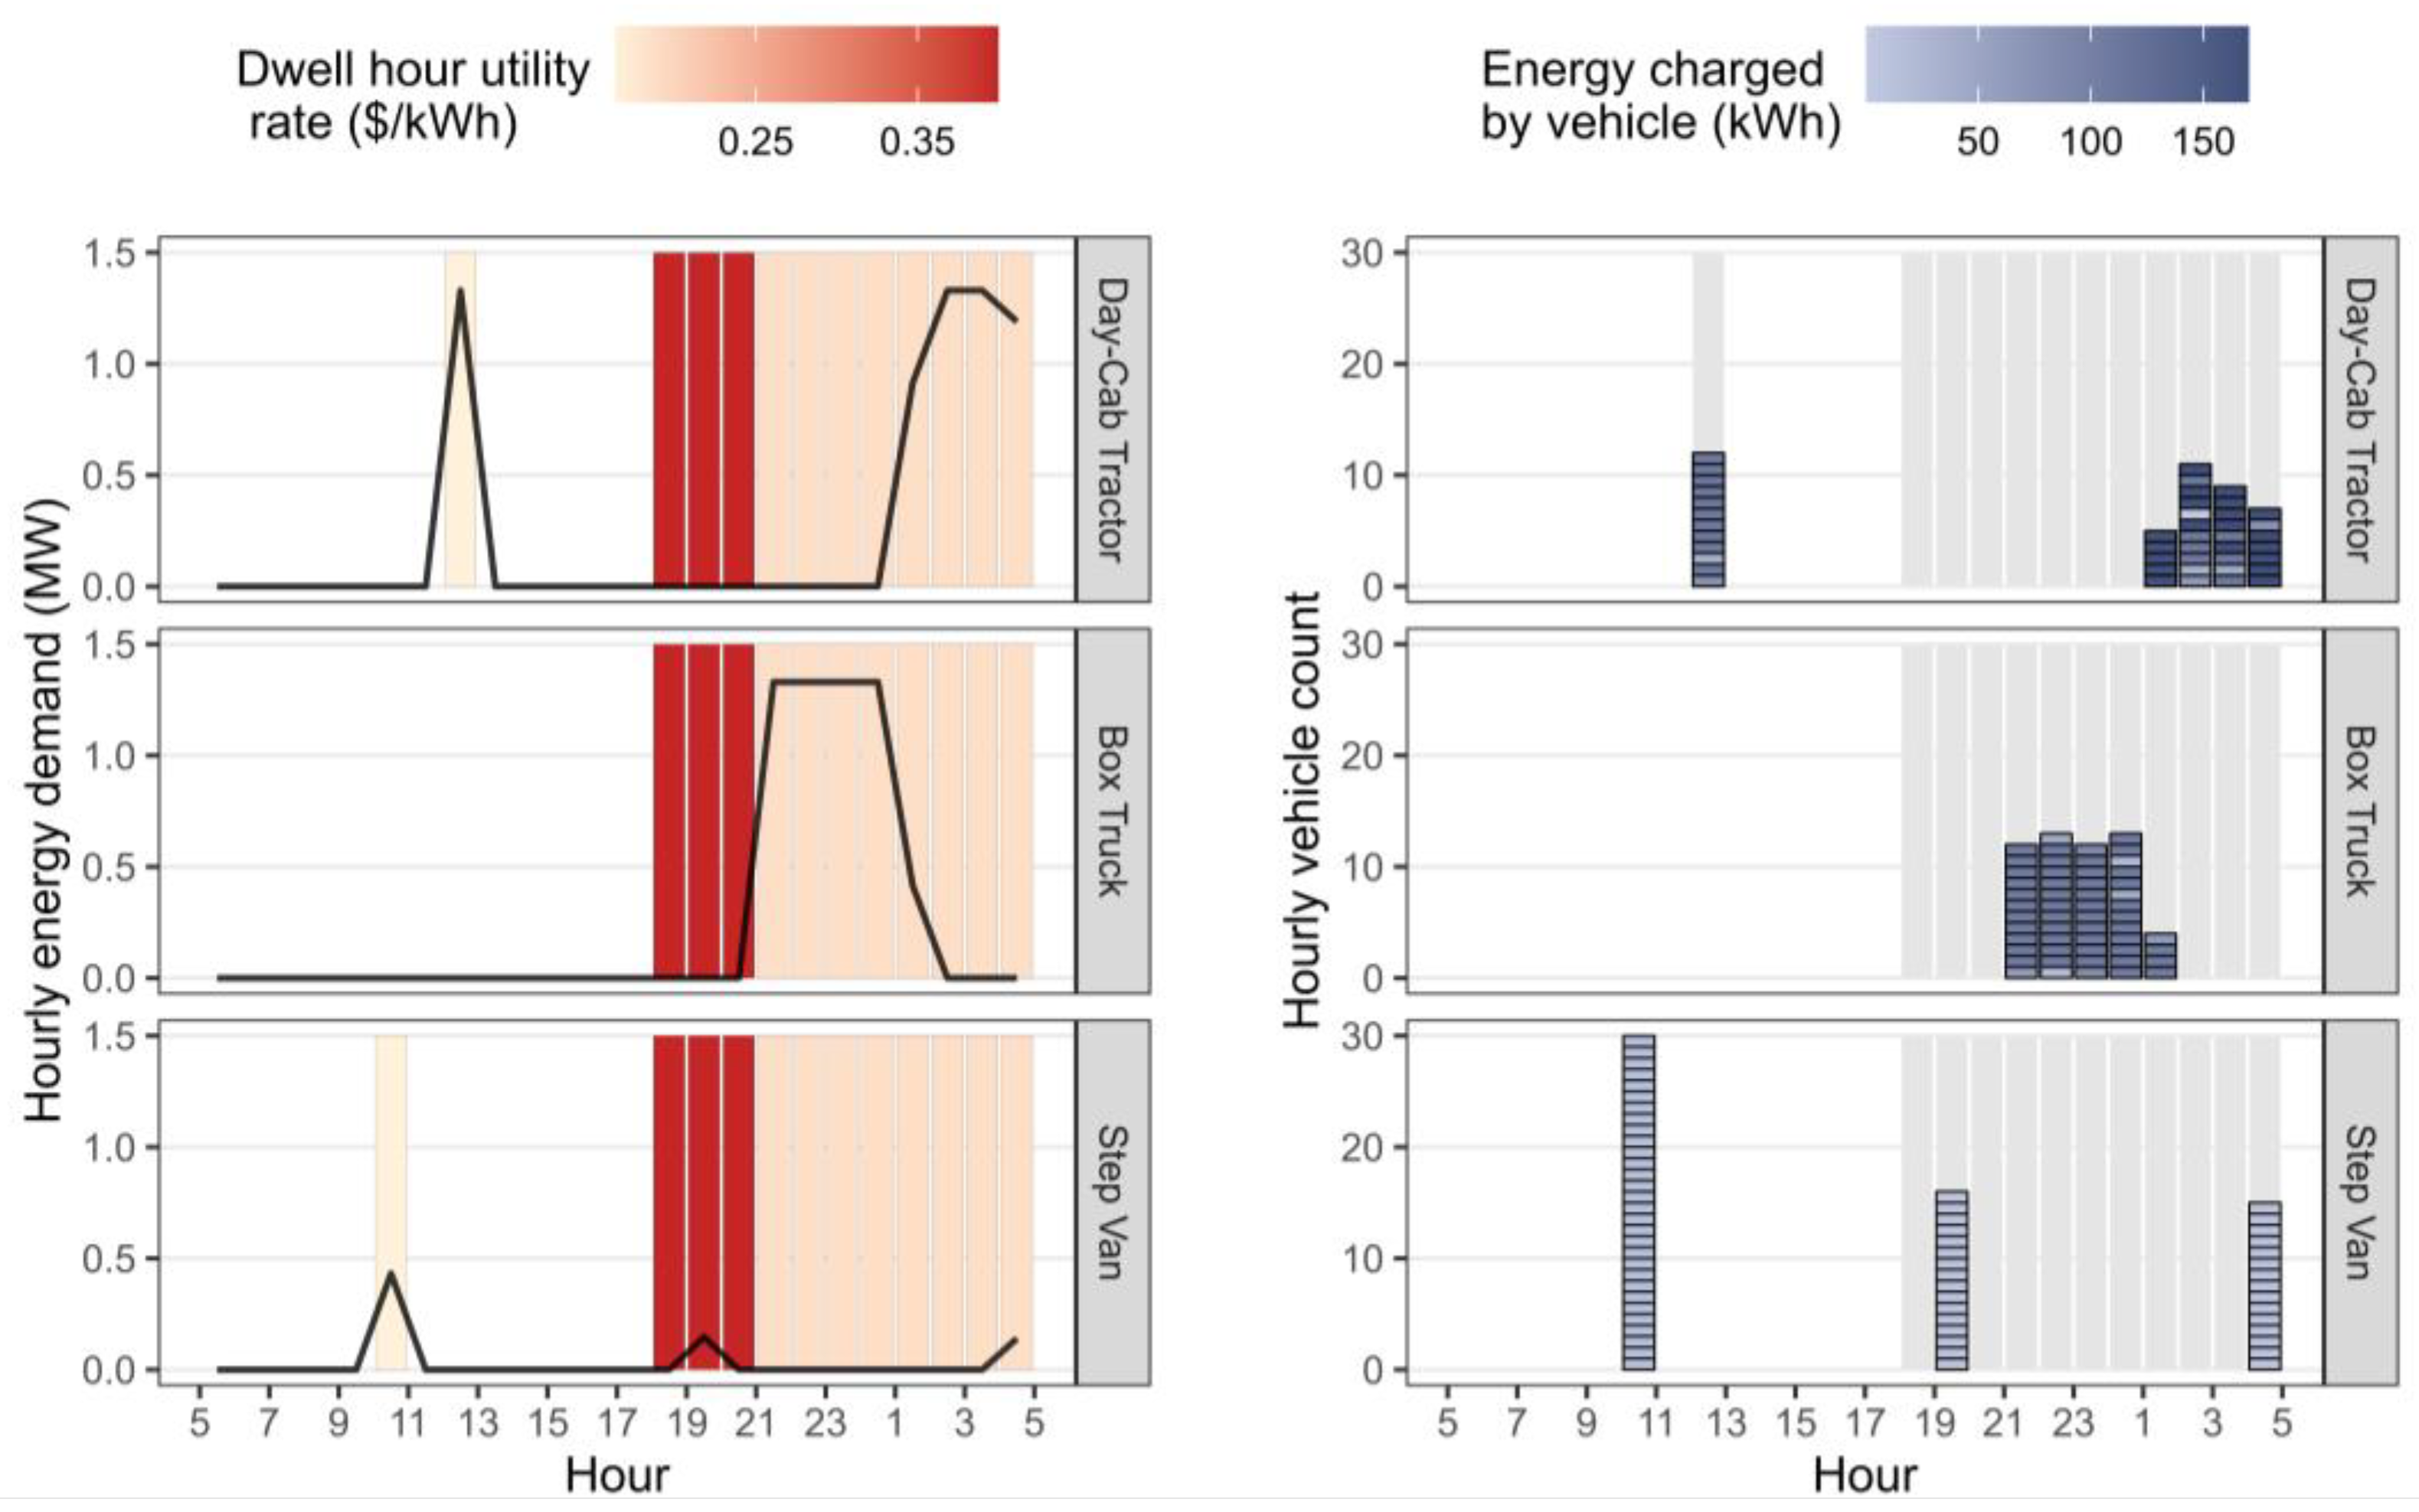
The hypothetical fleet starts operation at 5 a.m. and ends operation at 6 p.m. each day, leaving trucks to dwell between 6 p.m. and the 5 a.m. next day available for overnight charging. Taking an example day in SJ, trucks were optimized to charge during different time periods between 5 a.m. and 4:59 a.m. the next day to replenish energy use during the day (Figure 5). First, opportunity charging during midday breaks was found to be an important contribution to the optimized charging plan. In the example day, day-cab tractors and step vans utilized midday charging to fulfill up to 40% and 60%, respectively, of the predicted energy use for the day (Table A1). Among all scenarios modeled for 2023, day-cab tractors spent 67–81% of vehicle days charging 29–38% of total energy use during midday breaks, while step vans spent 69–95% of total vehicle days charging 32–43% of total energy use. Midday opportunity charging also ensured that all trucks started charging overnight with an SOC equal to or greater than 34% and met the minimum SOC requirements to protect the batteries (Table A2).
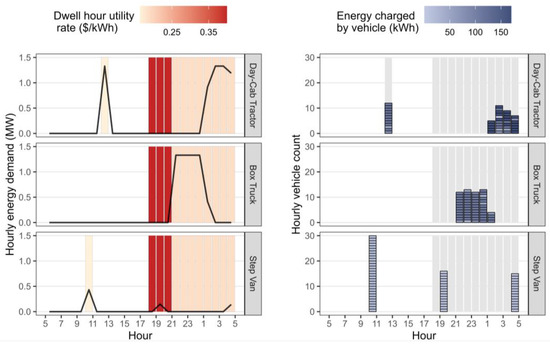
Figure 5.
Optimized vehicle charging plan on an example day in San Jose. (Left): Line plot of hourly energy demand aggregated by vehicle type. (Right): Vehicle level hourly energy charged. Each block represents a vehicle with a darker color, indicating higher energy charged. Gray/colored bars in the background represented all dwell hours available for charging. For colored bars, darker colors indicate more expensive hourly TOU rates. Energy demand is measured in megawatts (MW), dwell hour utility rates are measured in dollars per kilowatt-hour (kWh), and energy charged by vehicles is measured in kWh.
Second, charging was staggered by truck type during overnight dwell hours to lower fleetwide electricity load. During overnight dwell hours between 6 p.m. and 5 a.m. of the next day, day-cab tractors and step vans were charged between 7 p.m. and 8 p.m. or 1 a.m. and 5 a.m. Between the time gap, all box trucks were charged from 9 p.m. to 2 a.m. when no other truck types were drawing energy from the grid (Figure 5, left). The fleetwide peak load was controlled to 1.33 megawatts (MW), which matched the peak energy demand of all day-cab tractors or all box trucks.
Last, the number of vehicles charged simultaneously was controlled, especially for vehicles using DCFCs. No more than 13 box trucks out of 50 and no more than 12 day-cab tractors out of 20 would charge in the same hour (Figure 5, right). The number of trucks charging simultaneously was always no more than the number of chargers installed in the depot, with charging rates not exceeding the capacities of chargers. On the example day, all day-cab tractors charged at a maximum rate of 170.2 kW, box trucks at 106.7 kW, and step vans at 13.7 kW at the maximum, all lower than the chargers’ maximum discharge rates. Overall, the three types of trucks had charging shifted to different hours to meet their charging demand, effectively avoiding higher TOU cost, meeting minimum SOC requirements for battery protection, and balancing fleetwide energy demand over time.
3.2. Fleetwide Charging Load Comparison with Unmanaged Charging Scenario
This section took an example of a week of fleet energy demand under managed and unmanaged charging scenarios to compare its fleetwide hourly electricity load profiles. Monthly peak demands were then compared between managed and unmanaged scenarios in the three cities to demonstrate the scale of peak load reduction. The optimization model effectively balanced the fleetwide charging load profile and lowered the monthly peak demand for the hypothetical fleet in comparison with unmanaged charging. Unlike optimized charging, unmanaged charging was unable to respond to local utility rate structures, providing the same charging plan across three locations that almost tripled the optimized peak energy demand.
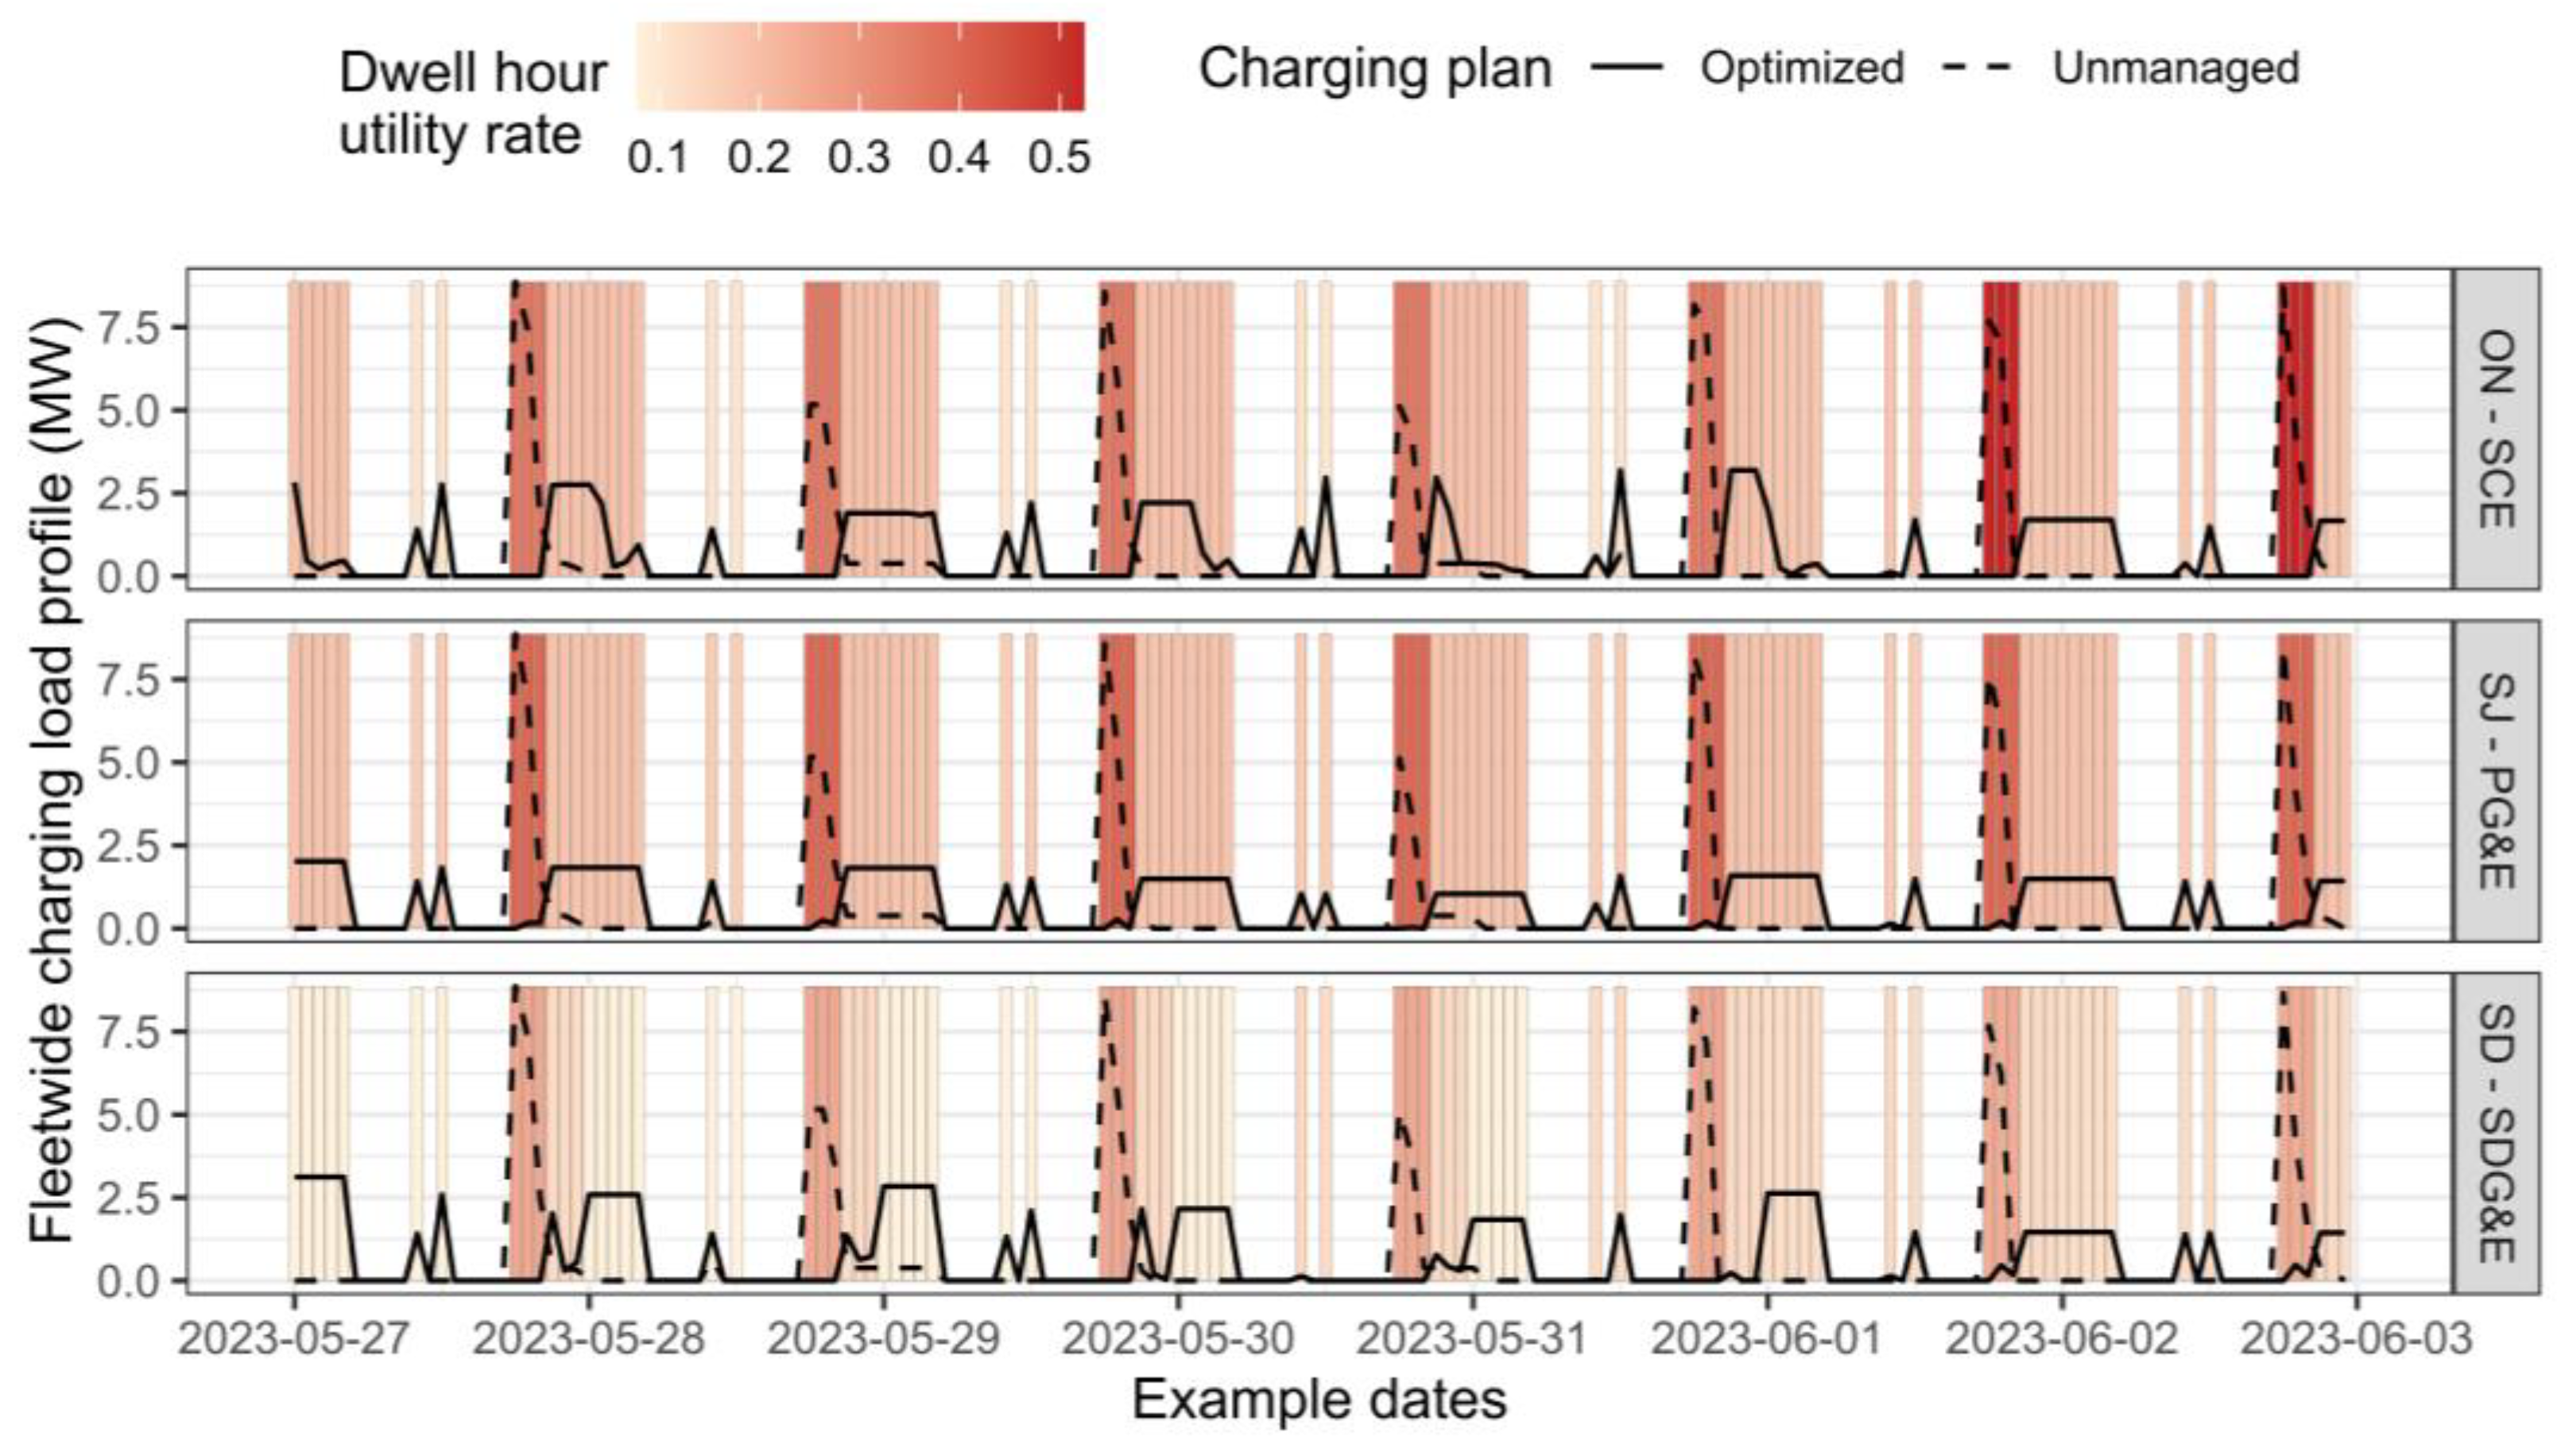
Compared with the unmanaged charging plan in an example week, optimized charging was evenly spread across the dwell hours and lowered fleetwide maximum hourly energy demand (Figure 6). Daily peak demands ranging from 5.11–8.86 MW in the example week under the unmanaged scenario were lowered to 1.70–3.19 MW in ON, 1.49–2.02 MW in SJ, and 1.46–3.12 MW in SD. In the absence of charging management, all BETs were plugged in to charge immediately upon returning to the fleet depot at the end of the operational day. A load spike occurred every night at 6 p.m. when all BETs charged at their maximum rate. Without regulation of charging rates or the number of vehicles charging simultaneously, BETs consumed a considerable amount of energy in a short time, leading to a high fleetwide peak load drawn from the grid each day. The range of daily peak demands in the example week was also reduced under a managed scenario, making energy use from the grid more stabilized and consistent. Moreover, optimized charging reduced energy use between 6 p.m. and 9 p.m. because of the high on-peak TOU rates in comparison to off-peak or super off-peak hours.

Figure 6.
Optimized fleetwide charging load profile compared with an unmanaged scenario in a week. Solid lines are optimized for charging load. Dashed lines are unmanaged charging loads. Dwell hour blocks colored in red with darker colors indicate higher TOU rates. The fleetwide charging load profile for the three utilities is measured in megawatts (MW).
Over the course of the year, the proposed charging optimization model lowered fleetwide monthly peak energy demand. The average and standard deviation of monthly peak demand of the 12 months were summarized for optimized and unmanaged charging scenarios (Figure 7). Unmanaged charging returned 8.86 MW of monthly peak demand across all months and locations, as vehicles were charged whenever chargers were available, using maximum charging rates regardless of energy consumption patterns or variations in utility rates among different months and locations. In contrast, in response to these variations in energy use and utility rates, optimized charging reduced monthly peak demand to an average of 3.16 MW in ON, 2.18 MW in SJ, and 2.89 MW in SD, removing 64% (ON), 75% (SJ), and 67% (SD) of peak demand from the unmanaged charging scenario.
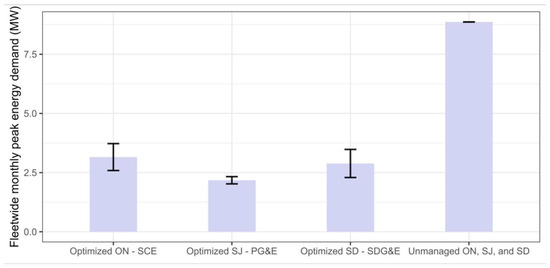
Figure 7.
Fleetwide monthly peak energy demand under optimized and unmanaged scenarios. Error bars show one standard deviation above or below the averages. Demand is measured in megawatts (MW) for the three utilities.
Given the significant fleetwide electricity load reduction, fleets switching from diesel fuel trucks to MHD BETs could benefit from charging management immensely during the infrastructure evaluation and upgrade process. Infrastructure in-site evaluation, construction, and installation have been identified as difficulties because of complications with electrical upgrades during real-world demonstrations of MHD BETs [59]. Fleets commonly experience significant delays in installing EVSE—particularly when sites require evaluation from electrical contractors and engineers who deem utility upgrades necessary for operation [60]. Fleets are also advised to plan their infrastructure and prepare for any necessary upgrades to accommodate future scenarios in which more trucks are electrified. Unmanaged solutions may lead to ultraconservative planning or approval of new site interconnections. With consideration of optimized and managed charging as the preferred scenario, fleets could choose an incremental plan for their infrastructure upgrade in their transition to electrify the entire fleet fully, saving both permitting time and upgrade costs from building infrastructure.
3.3. Fleetwide Cost Comparison with Unmanaged Scenario
This section examines the results of the fleet’s energy variable cost in the scenario case study under optimized and unmanaged scenarios, evaluating the economic benefit of the developed charging optimization algorithm.
Electric trucks could create significant energy cost savings in comparison to diesel counterparts under the current utility rate policies in the scenario case studies, making electric trucks a more appealing option. Charging energy costs per mile in all three locations were lower than the counterpart diesel cost of $1.10 per mile for MHD trucks in California, regardless of charge management strategies [61,62,63]. Switching from diesel to electric trucks could save a fleet 14.5–29.4% of energy variable costs without charge management or 63.5–74.3% with optimized charging. Fleets could benefit from savings on energy variable costs by electrifying their diesel fleet regardless of whether they implement charging optimization onsite or not. To accommodate the paradigm shift from diesel vehicle operation, some fleets might need to adjust a vehicle’s operational schedules or the number of vehicles serving a route [64] in order to gain huge operating cost savings and environmental benefits. However, whether the total cost of ownership of electrifying the fleet would be competitive, the diesel scenario needs to be assessed separately with additional considerations of factors including but not limited to vehicle and charger upfront cost, infrastructure upgrade cost, vehicle and charger maintenance cost, incentive opportunities, opportunity costs, and environmental benefits.
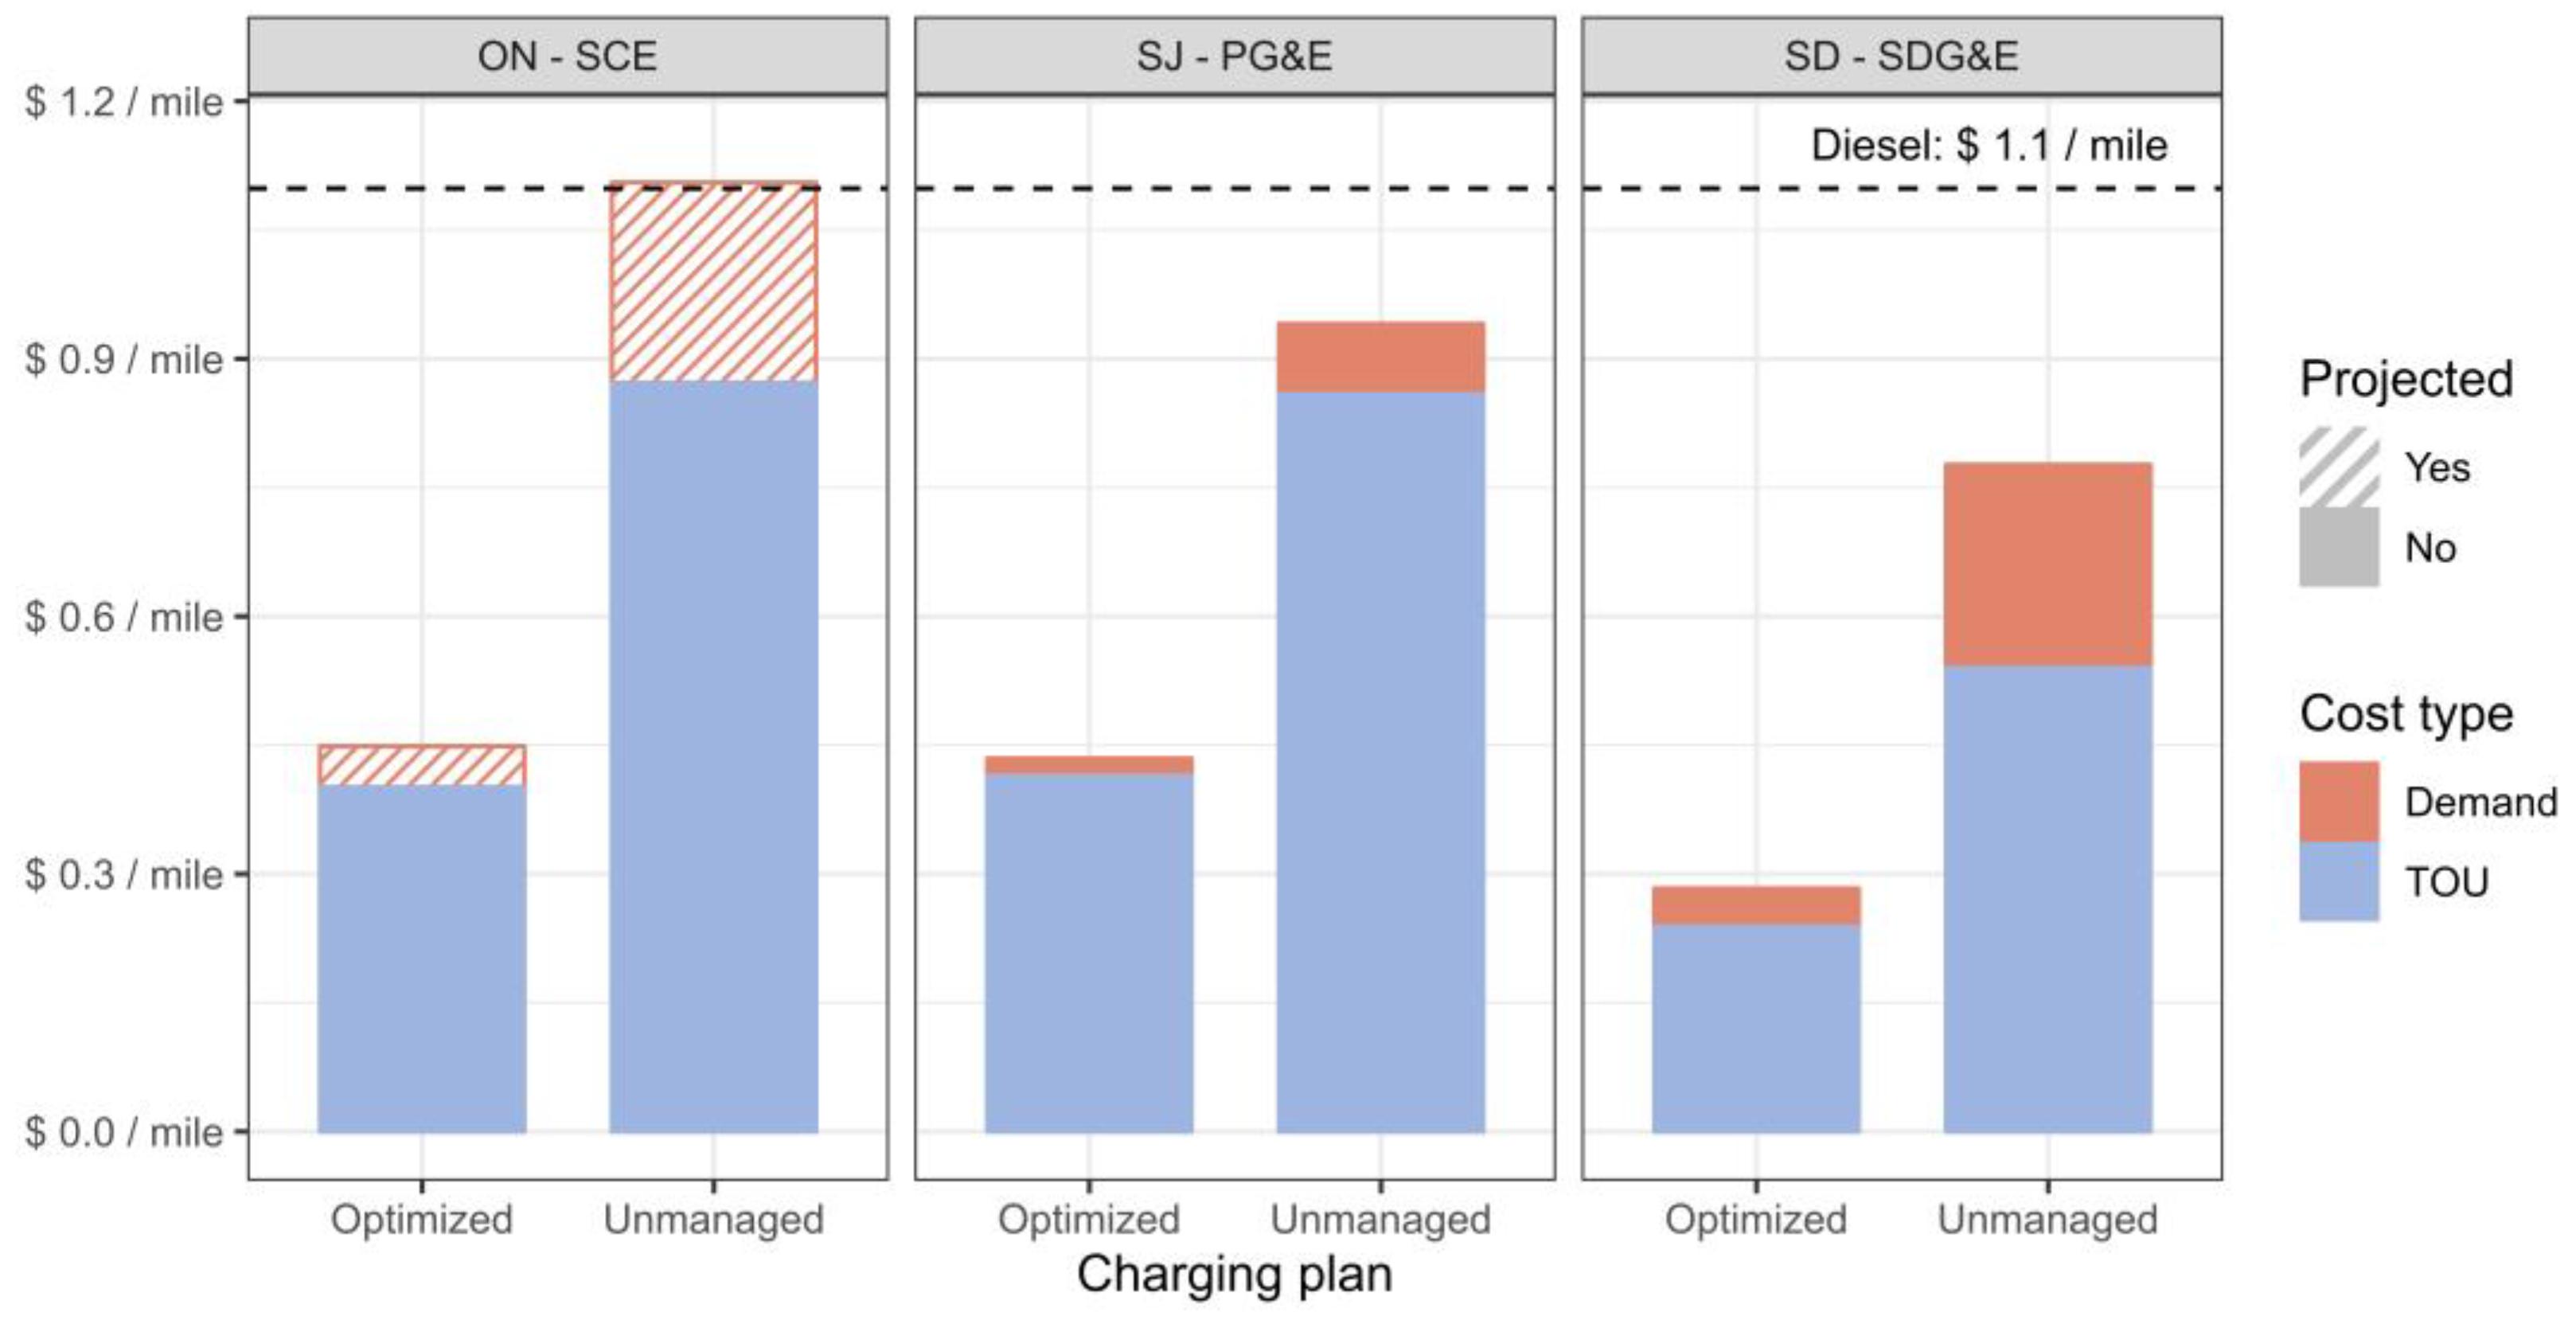
To inform energy cost outlook in SCE, ON, where demand charge is waived for fleets under rate plan TOU-EV-9 until 2026, demand charge was projected under unmanaged and optimized charging scenarios, respectively, based on the average proportion between demand charges and TOU costs in the other two utilities. Total energy variable cost increased to $1.11/mile without managed charging and $0.45/mile with optimized charging scenarios where the cost is less than half of the counterpart diesel cost (Figure 8). To maintain the energy cost benefits of MHD BETs in SCE’s service territory, the utility might need to design its demand charge and adjust TOU rates carefully, responding to both diesel costs and grid demand regulation needs in 2026. Demand cost rate needs to encourage fleet owners to manage charging for maximizing operation cost savings but also leave room for cost benefits of any electric fleets that have limited capacities to strictly optimize and manage charging of large volumes of vehicles with sophisticated operation requirements. The design of utility TOU rates and demand charges should work together to keep BETs cost-competitive with diesel vehicles and motivate fleets to manage and charge effectively for stable grid energy consumption.

Figure 8.
Annual energy cost per mile in Ontario (ON), San Jose (SJ), and San Diego (SD) comparing optimized and unmanaged charging. Orange bars represent demand charges. Blue bars represent time-of-use (TOU) costs. Solid bars represent modeled costs in 2023. Bars with white stripes (i.e., SCE demand charge) represent projected costs that include demand charge.
Looking at electricity cost in all three locations, the fleet depot charging optimization model could create significant TOU and demand charge savings compared with unmanaged charging. In addition to the significantly high fleetwide peak load, unmanaged charging results in the hypothetical fleet charging BETs predominantly during on-peak hours, when TOU rates are highest in a day (Figure 6). Under a managed charging scenario, the hypothetical fleet lowered its fleetwide peak load and charged BETs in dwell hours with lower TOU rates, saving $1.17–1.26 million in energy variable cost each year ($0.47–0.51/mile), equivalent to 53.8–63.5% of energy variable cost reductions (Table 8). Specifically, the demand charge was reduced by 75.3–81.1% because of the 64–75% reductions in monthly peak energy demand, saving the fleet $0.15–0.48 million each year, or $0.06–0.19/mile (Table 9). On the other hand, managing TOU cost alone could save the hypothetical fleet $0.75–1.17 million annually ($0.30–0.47/mile). The 51.8–55.8% TOU cost reduction was achieved when the model shifted more than 98% of total energy consumption to lower-rate dwell hours.
Table 8.
Fleet annual operation costs and savings between optimized and unmanaged charging.
Table 9.
Fleet annual costs and unit costs in the case study by charging management scenarios.
On-peak charging was not eliminated when the demand charge was implemented by utilities. In ON, with the demand charge exempted, optimized charging reduced the proportion of yearly energy consumption occurring during on-peak or mid-peak hours from 93.7% under unmanaged charging scenario to nearly 0%. In SJ and SD, with demand charges in place, the proportion reductions were from 94% to 1.6% and 93.9% to 1.9%, respectively. A tradeoff between raising monthly demand charges or TOU costs was evaluated during the process of moving on-peak charging to off-peak or super off-peak charging to achieve the monthly minimal energy use cost of the fleet.
Given the huge cost savings from implementing charge optimization, establishing a charge management strategy earlier in the EV deployment planning process is important for fleets to recover their costs. The cost of a DCFC unit can range from $10,000 to $40,000 depending on the features included with the hardware, such as software enabling energy consumption monitoring and data analysis [65]. The cost of this software is typically included in the EVSE hardware cost, and though there are several options for a fleet to procure and integrate a charge management software package with their EVSE, there are few significant savings opportunities associated with purchasing the software separately [66]. Fleet owners with networked EVSE units, or units that can be accessed and controlled remotely via an Internet connection, will pay a fee ranging from $100 to $900 annually, depending on the type of EVSE unit, to cover the cost of network communications [65]. The cost savings from charge management over time, which is more than $1,000,000 annually for the hypothetical fleet of 100 BETs, are much higher than the initial hardware and network service investments.
Implementing charge management since the early stages of MHD BET deployment creates millions of energy cost savings within a vehicle’s lifetime, avoids surprisingly high energy bills, and opens funding opportunities to government funding for freight movement fleets. Assuming a 10-year lifetime and 4% discount rate, the hypothetical fleet could save a net present value of $9.88–10.62 million in lifetime energy variable cost by switching from unmanaged charging to optimized charging. To achieve the management transition, fleets may need to train fleet managers on using charging management software and educate drivers on the habit of plugging in vehicles for midday charging, raising staff awareness of the importance of keeping electric trucks properly charged. While implementing and enforcing charging optimization needs additional actions, it, in the long-term, benefits fleets under all kinds of time-variable pricing utility rate plans by programmatically planning charging schedules in response to utility rates to minimize total energy variable costs [67,68]. Given that demand charge policies are quickly evolving, it would be wise for fleets to consider charge management earlier in their planning process to maximize cost savings in the long term. By stabilizing sitewide peak energy demand, fleets could be prepared and avoid the surprisingly expensive energy bill when the demand charge policies become enforced, causing changes in the utility rate landscape. In addition, fleets that are open to charge management also open their doors to government funding opportunities. The Energy Infrastructure Incentives for Zero-Emission (EnergIIZE) Commercial Vehicles Project requires EVSE for MHD BET DCFCs to have a certain level of charge management capability [69]. This requirement indicates that having charge management in place is necessary to unlock government funding opportunities in early deployment for faster cost recovery.
3.4. The Importance of Utility Demand Charge for Energy Demand Management
From the utilities’ perspective, to regulate the burden of load surges, they should carefully design rate structures and demand charge policies as price levers to motivate customers to manage energy demand actively. Otherwise, as a spill-over effect, fleets and other large customers who are unwilling to manage charging may choose to build future depots in areas where pricing does not motivate charge management, making those local grids more vulnerable.
TOU rate alone as the price lever is not sufficient. It can encourage fleets to switch charging time to off-peak hours but has little effect on regulating fleetwide peak demand in the absence of a demand charge policy [23,34]. For example, running only LP1 for the hypothetical fleet in the ON site in 2023, which minimizes TOU cost but not fleetwide peak demand, could reduce its TOU cost from $0.87/mile (unmanaged charging) to $0.40/mile by charging during off-peak or super off-peak hours. However, it would still incur a daily fleetwide peak energy demand as high as 6.65 MW (standard deviation = 1.36 MW) on average. The demand charge acts as a balancer that discourages customers from simply bumping up their charging load during off-peak hours, which can make off-peak hours soon become peak hours if adapted EV charging could work out for the business owner’s operation. Alternatively, adopting a charge management strategy to charge more evenly during all charging windows could make the energy demand of each operator from the grid stable and consistent throughout the day. Therefore, utilities should effectively use demand charges to incentivize customers to manage charging peak load, which would further reduce the burden of load surges and improve grid stability and resilience.
4. Conclusions
The fleet depot charging optimization framework described in this paper combined a machine learning model trained on real-world MHD BET data and a linear program optimization algorithm to guide fleets on real-world charging management and infrastructure planning. The framework demonstration used a mix of real-world vehicle and charger models with predicted daily energy use by truck type in three different utility territories for 365 days, accounting for seasonal and regional duty cycle variations and providing fleets and utilities with insights on energy load management in an extent rarely found in other literature.
The scenario case study concluded that MHD BETs have cheaper energy variable costs than their diesel counterparts, regardless of charge management, even with the inclusion of demand charges in all three fleet locations. Electrification with charging optimization could save fleets 64–74% of their energy costs in comparison to diesel energy costs. Compared with the unmanaged charging scenario, the optimized charging solution managed to avoid more than 90% of on-peak charging, reduce fleet charging peak load by 64–75%, and lower fleet energy variable costs by 54–64%, supplemented by a fast algorithm runtime of 0.370 s/vehicle-day.
Managed charging presents several benefits for multiple entities, including fleets, policymakers, and utilities. Fleets are encouraged to manage charging and include optimized charging scenarios during the infrastructure planning phase as it benefits them greatly in terms of reducing demand load and charging costs, creating large lifetime energy cost savings, and opening doors to government funding opportunities that benefit total cost of ownership of MHD BETs. Policymakers could invest in assistance programs that guide fleets on charge management; they could also provide adequate funding for smart charging infrastructure to accelerate the transition to MHD electrification and increase the resilience and stability of the national grid. Utilities are crucial for transportation electrification because their rate policies can impact the economic feasibility of MHD BETs and encourage the management of energy demand surges on the grid. Based on this study, TOU alone would not necessarily incentivize customers to manage and control the magnitude of sitewide peak energy demand. Thus, utilities must set demand charges to motivate customers to balance energy demand overall charging windows. There is a middle ground where demand charge should land—high enough to encourage fleets to manage demand and low enough to keep electric trucks cheaper than diesel. It takes a collaborative effort from all three parties to navigate transportation electrification.
Future studies on charge management could add penalties to inconvenient charging plans in the optimization algorithm. The penalty would discourage the use of two charger types for a vehicle during overnight hours to avoid requiring operators to carry out the switch. It could also allow preferences on using consecutive hours to charge a single vehicle, making it easier to configure the charging management system. Assessment of the level of cost savings across different months in the year and days of the week can provide insights into the specific circumstances under which fleets should focus more on charging management. In addition, scenario case studies with sites outside of California can assess the impact and effectiveness of charging management under more diverse utility landscapes and environmental conditions nationally and globally. An expanded analysis of the total cost of MHD BET ownership with managed charging can provide a more comprehensive view of the economic valuation of the new technologies. Future research can explore real-world implementation of the output charging schedules from the algorithm-based charge management framework. Future work may also employ quantitative analysis on the utility rate design to evaluate the sensitivity of MHD BET economic feasibility and sitewide peak load reduction to the utility landscape nationally and globally. Improvement in enroute charging beyond midday depot charging will also be beneficial to long-haul trucks taking enroute breaks that will use public chargers to recharge and pay at a potentially higher rate. There may be a need to expand the current model to fit trucks running between different depots from day to day, assisting infrastructure planning of multiple depots. Furthermore, modeling a charging management solution alongside onsite renewable energy generation systems could provide a more holistic vision for the energy independence of zero-emission MHD fleets, as well as the significant lifetime emission reductions and environmental benefits the entity could achieve.
Author Contributions
S.S.: Conceptualization, Methodology, Formal analysis, Investigation, Visualization, Writing—original draft, Writing—review and editing. Y.Q.: Methodology, Project administration, Formal analysis, Investigation, Visualization, Writing—original draft. R.L.C.: Writing—original draft, Writing—review and editing. C.M.D.: Data curation. P.S.: Data curation. All authors have read and agreed to the published version of the manuscript.
Funding
This research was funded by the Office of Energy Efficiency and Renewable Energy (“EERE”), an office within the United States Department of Energy, with the grant award No. DE-EE0008891 and the State of California, California Air Resources Board (CARB) with Agreement No. G21-HVIP-01.
Data Availability Statement
Data owned by the U.S. Department of Energy from the Medium- and Heavy-Duty EV Deployment: Data Collection project is publicly accessible on the LiveWire Data Platform site: https://livewire.energy.gov/project/calstart (accessed on 1 May 2023).
Acknowledgments
This research was supported in part by the U.S. Department of Energy and California Air Resources Board. The authors also appreciated the review and comments from several of CALSTART’s staff, including Kevin Leong, Chase LeCroy, Jessie Lund, Michael Joseph, Alyssa Haerle, Emily Varnell, Bill Van Amburg, and Jasna Tomic, during the research and writing of this paper.
Conflicts of Interest
The authors declare that they have no known competing financial interests or personal relationships that could have appeared to influence the work reported in this paper.
Appendix A
The Appendices include summary tables that can provide more information about the main text.
Table A1.
Summary of vehicle-level midday energy charged on the example day 2 February 2023, in SJ-PG&E.
Table A1.
Summary of vehicle-level midday energy charged on the example day 2 February 2023, in SJ-PG&E.
| Vehicle Models | Predicted Energy Consumption (kWh) | Midday Energy Charged, Mean and Range (kWh) | Percentage of Predicted Energy Charged during Midday Break, Mean and Range |
|---|---|---|---|
| BYD 8TT day-cab tractor (Class 8) | 280.29 | 101.97 (37.00–112.12) | 36.38% (13.20–40.00%) |
| XOS SV step van (Class 6) | 22.55 | 13.53 (13.53–13.53) | 60.00% (60.00–60.00%) |
Table A2.
Summary of vehicle-level overnight energy charged on the example day 2 February 2023, in SJ-PG&E.
Table A2.
Summary of vehicle-level overnight energy charged on the example day 2 February 2023, in SJ-PG&E.
| Vehicle Models | Battery Capacity (kWh) | Overnight Energy Charged, Mean and Range (kWh) | Start SOC at the Beginning of Overnight Charging |
|---|---|---|---|
| BYD 8TT day-cab tractor (Class 8) | 422 | 219.11 (168.17–280.29) | 48.08% (33.58–60.15%) |
| Volvo VNR box truck (Class 7) | 565 | 106.69 (121.77–121.77) | 81.11% (81.11–81.11%) |
| XOS SV step van (Class 6) | 280 | 9.02 (9.02–9.02) | 96.78% (96.78–96.78%) |
References
- Kerry, J.; McCarthy, G. The Long-Term Strategy of the United States: Pathways to Net-Zero Greenhouse Gas Emissions by 2050; United States Department of State and the United States Executive Office of the President: Washington, DC, USA, 2021.
- State of California. California Releases World’s First Plan to Achieve Net Zero Carbon Pollution [WWW Document]. California Governor. 2022. Available online: https://www.gov.ca.gov/2022/11/16/california-releases-worlds-first-plan-to-achieve-net-zero-carbon-pollution/ (accessed on 6 May 2023).
- Maryland Department of the Environment. Maryland’s Climate Pollution Reduction Plan; Maryland Department of the Environment: Baltimore, MD, USA, 2023. Available online: https://mde.maryland.gov/programs/air/ClimateChange/Maryland%20Climate%20Reduction%20Plan/Maryland%27s%20Climate%20Pollution%20Reduction%20Plan%20-%20Final%20-%20Dec%2028%202023.pdf (accessed on 12 July 2024).
- State of Washington. Climate Commitment Act—Washington State Department of Ecology [WWW Document]; Department of Ecology State of Washington: Lacey, WA, USA, 2023. Available online: https://ecology.wa.gov/Air-Climate/Climate-Commitment-Act (accessed on 12 July 2024).
- National Renewable Energy Laboratory (NREL). Alternative Fuels Data Center: Federal and State Laws and Incentives [WWW Document]. 2024. Available online: https://afdc.energy.gov/laws (accessed on 2 July 2024).
- California Air Resources Board. Advanced Clean Fleets Regulation Overview | California Air Resources Board [WWW Document]. 2023. Available online: https://ww2.arb.ca.gov/resources/fact-sheets/advanced-clean-fleets-regulation-overview (accessed on 23 August 2023).
- California Air Resources Board. Advanced Clean Trucks Fact Sheet | California Air Resources Board [WWW Document]. 2021. Available online: https://ww2.arb.ca.gov/resources/fact-sheets/advanced-clean-trucks-fact-sheet (accessed on 23 August 2023).
- State of Oregon, Department of Environmental Quality. Clean Truck Rules 2021, Rulemaking at DEQ [WWW Document]. 2021. Available online: https://www.oregon.gov/deq/rulemaking/Pages/ctr2021.aspx (accessed on 5 August 2024).
- Woodward, S. Electric Trucks to Join State’s Clean Transportation Future [WWW Document]; Department of Ecology, State of Washington: Lacey, WA, USA, 2023. Available online: https://ecology.wa.gov/blog/april-2023/electric-trucks-to-join-state-s-clean-transportati (accessed on 5 August 2024).
- Maryland’s Clean Trucks Act of 2023 [WWW Document]. LPDD. 2023. Available online: https://lpdd.org/resources/marylands-clean-trucks-act-of-2023/ (accessed on 5 August 2024).
- Hochul, K. Governor Hochul Announces Adoption of Regulation to Transition to Zero-Emission Trucks [WWW Document]. The Official Website of Governor Kathy Hochul. 2021. Available online: https://www.governor.ny.gov/news/governor-hochul-announces-adoption-regulation-transition-zero-emission-trucks (accessed on 8 August 2024).
- State of New Jersey. Advanced Clean Trucks (ACT) Rule [WWW Document]. Official Site of the State of New Jersey, Department of Environmental Protection, Bureau of Mobile Sources. 2021. Available online: https://dep.nj.gov/stopthesoot/advanced-clean-trucks-rule-fleet-reporting/ (accessed on 8 August 2024).
- Department of Environmental Conservation. Recently Adopted and Proposed Regulations [WWW Document]. An Official Vermont Government Website, Agency of Natural Resources. 2022. Available online: https://dec.vermont.gov/air-quality/laws/recently-adopted-and-proposed-regulations (accessed on 8 August 2024).
- Massachusetts Department of Environmental Protection. MassDEP Files New Regulations to Reduce Emissions, Advance Market for Clean Trucks in the Commonwealth [WWW Document]. 2021. Available online: https://www.mass.gov/news/massdep-files-new-regulations-to-reduce-emissions-advance-market-for-clean-trucks-in-the-commonwealth (accessed on 8 August 2024).
- Rhode Island Department of Environmental Management. Advanced Clean Cars II & Advanced Clean Trucks [WWW Document]; State of Rhode Island, Department of Environmental Management: Providence, RI, USA, 2023. Available online: https://dem.ri.gov/environmental-protection-bureau/air-resources/advanced-clean-cars-ii-advanced-clean-trucks (accessed on 8 August 2024).
- Department of Public Health & Environment. Colorado Clean Trucks [WWW Document]; Colorado Department of Public health & Environment: Denver, CO, USA, 2023. Available online: https://cdphe.colorado.gov/cleantrucking#advancedcleantrucksrule (accessed on 8 August 2024).
- New Mexico Environment Department. Advanced Clean Cars and Advanced Clean Trucks [WWW Document]; New Mexico Environment Department: Albuquerque, NM, USA, 2023. Available online: https://www.env.nm.gov/transportation/ (accessed on 8 August 2024).
- Al-Alawi, B.M.; Richard, J. Zeroing in on Zero-Emission Trucks: May 2024 Market Update. CALSTART. 2024. Available online: https://www.calstart.org/zio-zets/ (accessed on 2 July 2024).
- Volvo Group North America. Volvo LIGHTS Bringing Battery-Electric Freight Trucks to Market from Demonstration to Commercialization Lessons Learned Guidebook. 2022. Available online: https://learn.lightsproject.com/lessons-learned-guidebook (accessed on 24 August 2023).
- Frito-Lay. Frito-Lay Transforms California Facility into Showcase for Sustainability | Frito-Lay [WWW Document]. 2023. Available online: https://www.fritolay.com/frito-lay-transforms-california-facility-into-showcase-for-sustainability (accessed on 23 August 2023).
- Sen, B.; Ercan, T.; Tatari, O. Does a battery-electric truck make a difference?—Life cycle emissions, costs, and externality analysis of alternative fuel-powered Class 8 heavy-duty trucks in the United States. J. Clean. Prod. 2017, 141, 110–121. [Google Scholar] [CrossRef]
- Dyson, M.; Li, B. Reimagining Grid Resilience. Rocky Mountain Institute. 2020. Available online: http://www.rmi.org/insight/reimagining-grid-resilience (accessed on 20 August 2023).
- Davis, B.M.; Bradley, T.H. The Efficacy of Electric Vehicle Time-of-Use Rates in Guiding Plug-in Hybrid Electric Vehicle Charging Behavior. IEEE Trans. Smart Grid 2012, 3, 1679–1686. [Google Scholar] [CrossRef]
- Faruqui, A.; Malko, J. The residential demand for electricity by time-of-use: A survey of twelve experiments with peak load pricing. Energy 1983, 8, 781–795. [Google Scholar] [CrossRef]
- Borlaug, B.; Bennet, J. EV Charging & the Impacts of Electricity Demand Charges. [PowerPoint Presentation]. 2022. Available online: https://www.nrel.gov/docs/fy22osti/82738.pdf (accessed on 23 August 2023).
- Al-Hanahi, B.; Ahmad, I.; Habibi, D.; Masoum, M.A.S. Charging Infrastructure for Commercial Electric Vehicles: Challenges and Future Works. IEEE Access 2021, 9, 121476–121492. [Google Scholar] [CrossRef]
- Giuliano, G.; Dessouky, M.; Dexter, S.; Fang, J.; Hu, S.; Miller, M. Heavy-duty trucks: The challenge of getting to zero. Transp. Res. Part D Transp. Environ. 2021, 93, 102742. [Google Scholar] [CrossRef]
- Yuksel, T.; Michalek, J.J. Effects of Regional Temperature on Electric Vehicle Efficiency, Range, and Emissions in the United States. Environ. Sci. Technol. 2015, 49, 3974–3980. [Google Scholar] [CrossRef] [PubMed]
- Prohaska, R.; Simpson, M.; Ragatz, A.; Kelly, K.; Smith, K.; Walkowicz, K. Field Evaluation of Medium-Duty Plug-in Electric Delivery Trucks (No. NREL/TP–5400-66382, 1337010); National Renewable Energy Lab. (NREL): Golden, CO, USA, 2016. [CrossRef]
- Bigelow, E.; Eudy, L.; Leslie, G. Blueprint for Medium- and Heavy-Duty Zero-Emission Vehicle Infrastructure: Lowest Cost to Charge for Stockton Unified School District. 2023. Available online: https://www.energy.ca.gov/sites/default/files/2023-03/CEC-600-2023-028_0.pdf (accessed on 25 August 2023).
- Bay Area Air Quality Management District. Goodwill Industries Electric Delivery Vehicle Project: A California Air Resources Board Zero Emission Truck and Bus Pilot, Commercial Deployment Project. 2021. Available online: https://ww2.arb.ca.gov/lcti-goodwill-industries-electric-delivery-vehicle-project (accessed on 2 June 2023).
- Teoh, T.; Kunze, O.; Teo, C.-C.; Wong, Y.D. Decarbonisation of Urban Freight Transport Using Electric Vehicles and Opportunity Charging. Sustainability 2018, 10, 3258. [Google Scholar] [CrossRef]
- California Air Resources Board. First of 27 Electric Trucks Coming to Southern California Freight and Rail Yards|California Air Resources Board [WWW Document]. 2017. Available online: https://ww2.arb.ca.gov/news/first-27-electric-trucks-coming-southern-california-freight-and-rail-yards (accessed on 25 August 2023).
- Liu, J.; Lin, G.; Huang, S.; Zhou, Y.; Li, Y.; Rehtanz, C. Optimal EV Charging Scheduling by Considering the Limited Number of Chargers. IEEE Trans. Transp. Electrif. 2021, 7, 1112–1122. [Google Scholar] [CrossRef]
- Zhou, Y.; Kumar, R.; Tang, S. Incentive-Based Distributed Scheduling of Electric Vehicle Charging under Uncertainty. IEEE Trans. Power Syst. 2019, 34, 3–11. [Google Scholar] [CrossRef]
- Shah, J.; Nielsen, M.; Reid, A.; Shane, C.; Mathews, K.; Doerge, D.; Piel, R.; Anderson, R.; Boulanger, A.; Wu, L.; et al. Cost-optimal, robust charging of electrically-fueled commercial vehicle fleets via machine learning. In Proceedings of the 2014 IEEE International Systems Conference Proceedings, Ottawa, ON, Canada, 31 March–3 April 2014; pp. 65–71. [Google Scholar] [CrossRef]
- Jahic, A.; Eskander, M.; Schulz, D. Charging Schedule for Load Peak Minimization on Large-Scale Electric Bus Depots. Appl. Sci. 2019, 9, 1748. [Google Scholar] [CrossRef]
- He, Y.; Liu, Z.; Song, Z. Optimal charging scheduling and management for a fast-charging battery electric bus system. Transp. Res. Part E Logist. Transp. Rev. 2020, 142, 102056. [Google Scholar] [CrossRef]
- He, Y.; Liu, Z.; Song, Z. Joint optimization of electric bus charging infrastructure, vehicle scheduling, and charging management. Transp. Res. Part D Transp. Environ. 2023, 117, 103653. [Google Scholar] [CrossRef]
- Qiu, Y.; Dobbelaere, C.; Song, S. Energy Cost Analysis and Operational Range Prediction Based on Medium- and Heavy-Duty Electric Vehicle Real-World Deployments across the United States. World Electr. Veh. J. 2023, 14, 330. [Google Scholar] [CrossRef]
- Borlaug, B.; Muratori, M.; Gilleran, M.; Woody, D.; Muston, W.; Canada, T.; Ingram, A.; Gresham, H.; McQueen, C. Heavy-duty truck electrification and the impacts of depot charging on electricity distribution systems. Nat. Energy 2021, 6, 673–682. [Google Scholar] [CrossRef]
- Speth, D.; Plötz, P. Depot slow charging is sufficient for most electric trucks in Germany. Transp. Res. Part D Transp. Environ. 2024, 128, 104078. [Google Scholar] [CrossRef]
- CALSTART. MHD EV Data Visualization Version 1.5 [Online]. 2023. Available online: https://calstart.org/projects/medium-heavy-duty-ev-deployment-data/ (accessed on 23 August 2023).
- Zhang, J.; Jorgenson, J.; Markel, T.; Walkowicz, K. Value to the Grid from Managed Charging Based on California’s High Renewables Study. IEEE Trans. Power Syst. 2019, 34, 831–840. [Google Scholar] [CrossRef]
- Alexander, M.; Crisostomo, N.; Krell, W.; Lu, J.; Ramesh, R. Assembly Bill 2127 Electric Vehicle Charging Infrastructure Assessment Analyzing Charging Needs to Support ZEVs in 2030—Commission Report; California Energy Commission: Sacramento, CA, USA, 2021.
- NOAA. Global Historical Climatology Network Daily (GHCNd). Available online: https://www.ncei.noaa.gov/products/land-based-station/global-historical-climatology-network-daily (accessed on 26 October 2022).
- NASA. NLDAS-2: North American Land Data Assimilation System Forcing Fields. Available online: https://developers.google.com/earth-engine/datasets/catalog/NASA_NLDAS_FORA0125_H002 (accessed on 26 October 2022).
- Muñoz Sabater, J. ERA5-Land Monthly Averaged Data from 1981 to Present. 2023. Available online: https://developers.google.com/earth-engine/datasets/catalog/ECMWF_ERA5_LAND_HOURLY (accessed on 6 February 2023).
- Texas A&M Transportation Institute. Urban Mobility Report. 2021. Available online: https://library.ctr.utexas.edu/Presto/content/Detail.aspx?ctID=OWE3NjYzNTktYzJmNC00ZTAwLThmMjItYzhmNzNiYTFmNzdh&rID=MzQwODk=&qrs=RmFsc2U=&q=KGNhdGFsb2cuSUQ6KDM5NDMyKSk=&ph=VHJ1ZQ==&bckToL=VHJ1ZQ==&rrtc=VHJ1ZQ== (accessed on 10 January 2023).
- Lovelace, R.; Felix, R.; Talbot, J. Slopes Package v1.0.0. Available online: https://ropensci.github.io/slopes/index.html (accessed on 13 January 2023).
- OpenStreetMap Data Extracts. Available online: https://download.geofabrik.de/index.html (accessed on 13 January 2023).
- USGS. TNM Download v2.0. Available online: https://apps.nationalmap.gov/downloader/ (accessed on 13 January 2023).
- Khan, M.; Komanduri, A.; Pacheco, K.; Ayvalik, C.; Proussaloglou, K.; Brogan, J.J.; McCourt, M.; Mak, R. Findings from the California Vehicle Inventory and Use Survey. Transp. Res. Rec. J. Transp. Res. Board 2019, 2673, 349–360. [Google Scholar] [CrossRef]
- O’Dea, J. Ready for Work: Now Is the Time for Heavy-Duty Electric Vehicles; Union of Concerned Scientists: Cambridge, MA, USA, 2019; Available online: https://www.ucsusa.org/resources/ready-work (accessed on 23 August 2023).
- Anwar, M.B.; Muratori, M.; Jadun, P.; Hale, E.; Bush, B.; Denholm, P.; Ma, O.; Podkaminer, K. Assessing the value of electric vehicle managed charging: A review of methodologies and results. Energy Environ. Sci. 2022, 15, 466–498. [Google Scholar] [CrossRef]
- Pacific Gas and Electric Corporation. Electric Schedule BEV [WWW Document]. 2023. Available online: https://www.pge.com/tariffs/assets/pdf/tariffbook/ELEC_SCHEDS_BEV.pdf (accessed on 25 August 2023).
- San Diego Gas and Electric Company. Electric Vehicle High Power Rate. [WWW Document]. 2023. Available online: https://tariff.sdge.com/tm2/pdf/tariffs/ELEC_ELEC-SCHEDS_EV-HP.pdf (accessed on 25 August 2023).
- Southern California Edison. Electric Vehicle Charging Rate TOU-EV-7 TOU-EV-8 and TOU-EV-9 Pricing Bundled Service. 2023. Available online: https://www.sce.com/sites/default/files/inline-files/TOU-EV-7_8_9%20Rate%20Fact%20Sheet_WCAG%20(2).pdf (accessed on 25 August 2023).
- South Coast Air Quality Management District. LCTI: California Collaborative Advanced Technology Drayage Truck Demonstration Project. 2022. Available online: https://ww2.arb.ca.gov/lcti-california-collaborative-advanced-technology-drayage-truck-demonstration-project (accessed on 2 June 2023).
- CALSTART. The Green On-Road Linen Delivery Project Final Report. [Internal CALSTART Report] Unpublished. 2020. Available online: https://ww2.arb.ca.gov/lcti-green-road-linen-delivery-project (accessed on 2 June 2023).
- U.S. Department of Energy. State & Alternative Fuel Provider Fleets: Fuel Conversion Factors to Gasoline Gallon Equivalents [WWW Document]; Energy Efficiency & Renewable Energy: Washington, DC, USA, 2023. Available online: https://epact.energy.gov/fuel-conversion-factors (accessed on 4 August 2023).
- U.S. Department of Energy. Alternative Fuels Data Center: Maps and Data—Average Fuel Economy by Major Vehicle Category [WWW Document]; Energy Efficiency & Renewable Energy: Washington, DC, USA, 2023. Available online: https://afdc.energy.gov/data/10310 (accessed on 24 August 2023).
- U.S. Energy Information Administration. California Gasoline and Diesel Retail Prices [WWW Document]. Independent Statistics Analysis. 2023. Available online: https://www.eia.gov/dnav/pet/pet_pri_gnd_dcus_sca_m.htm (accessed on 4 August 2023).
- Smith, D.; Ozpineci, B.; Graves, R.L.; Jones, P.T.; Lustbader, J.; Kelly, K.; Walkowicz, K.; Birky, A.; Payne, G.; Sigler, C.; et al. Medium- and Heavy-Duty Vehicle Electrification: An Assessment of Technology and Knowledge Gaps; Oak Ridge National Lab. (ORNL): Oak Ridge, TN, USA; National Renewable Energy Lab. (NREL): Golden, CO, USA, 2020. [CrossRef]
- Smith, M.; Castellano, J. Costs Associated with Non-Residential Electric Vehicle Supply Equipment [WWW Document]; Energy Efficiency and Renewable Energy, Alternative Fuels Data Center: Washington, DC, USA, 2015. Available online: https://afdc.energy.gov/files/u/publication/evse_cost_report_2015.pdf (accessed on 7 September 2023).
- Nelder, C.; Rogers, E. Reducing EV Charging Infrastructure Costs; Rocky Mountain Institute: Basalt, CO, USA, 2019; Available online: https://rmi.org/ev-charging-costs (accessed on 7 September 2023).
- Samadi, P.; Mohsenian-Rad, A.-H.; Schober, R.; Wong, V.W.S.; Jatskevich, J. Optimal Real-Time Pricing Algorithm Based on Utility Maximization for Smart Grid. In Proceedings of the 2010 First IEEE International Conference on Smart Grid Communications, Gaithersburg, MD, USA, 4–6 October 2010; pp. 415–420. [Google Scholar] [CrossRef]
- Zahr, S.A. Home energy management system considering modular and deferrable electric loads under time-variable pricing scheme. In Proceedings of the 2018 IEEE Middle East and North Africa Communications Conference (MENACOMM), Jounieh, Lebanon, 18–20 April 2018. [Google Scholar] [CrossRef]
- EnergIIZE. Infrastructure [WWW Document]. EnergIIZE. 2023. Available online: https://www.energiize.org/infrastructure (accessed on 7 September 2023).

Disclaimer/Publisher’s Note: The statements, opinions and data contained in all publications are solely those of the individual author(s) and contributor(s) and not of MDPI and/or the editor(s). MDPI and/or the editor(s) disclaim responsibility for any injury to people or property resulting from any ideas, methods, instructions or products referred to in the content. |
© 2024 by the authors. Licensee MDPI, Basel, Switzerland. This article is an open access article distributed under the terms and conditions of the Creative Commons Attribution (CC BY) license (https://creativecommons.org/licenses/by/4.0/).