Abstract
The Arctic presents various challenges for a transition to electric vehicles compared to other regions of the world, including environmental conditions such as colder temperatures, differences in infrastructure, and cultural and economic factors. For this study, academic researchers partnered with three rural communities: Kotzebue, Galena, and Bethel, Alaska, USA. The study followed a co-production process that actively involved community partners to identify 21 typical vehicle use cases that were then empirically modeled to determine changes in fueling costs and greenhouse gas emissions related to a switch from an internal combustion engine to an electric vehicle. While most use cases showed decreases in fueling costs and climate emissions from a transition to electric versions of the vehicles, some common use profiles did not. Specifically, the short distances of typical commutes, when combined with low idling and engine block heater use, led to an increase in both fueling costs and emissions. Arctic communities likely need public investment and additional innovation in incentives, vehicle types, and power systems to fully and equitably participate in the transition to electrified transportation. More research on electric vehicle integration, user behavior, and energy demand at the community level is needed.
1. Introduction
Electric vehicles (EVs) are widely seen as a way to reduce greenhouse gas emissions, particulate matter, and other air pollutants from personal transportation [1,2]. Is the same premise true for isolated, non-grid-connected communities such as those in the Arctic, which generate most of their electricity using diesel generators? Even in the remote parts of the Arctic, EV adoption is increasing (Schmidt et al. in review), yet several fundamental knowledge gaps exist. Analysis is needed to evaluate where, how, and for whom EVs can provide benefits, and how these benefits can be realized [3].
The Arctic presents various challenges for a transition to EVs compared to other regions of the world, including environmental conditions such as colder temperatures, differences in infrastructure, and cultural and economic factors. Cold weather lowers EV efficiency and range, increases energy use, slows charging, and can decrease reliability and damage EV batteries [4,5,6,7]. Higher energy use due to cold weather leads to higher emissions and higher costs of ownership. Even the much smaller regional differences in climate seen within the continental U.S. are considered large enough to affect adoption patterns and energy use with environmental implications [8].
Electrical grids in remote Arctic communities found in Alaska, USA, for example, are fundamentally different from those in most of Europe, China, the contiguous U.S., and other places with high EV uptake. Rural communities in Alaska have less than 6000 inhabitants and are islanded in nature, lack intertie transmission infrastructure, and are generally powered by expensive and polluting diesel fuel-burning generators [9]. Due to the lack of connection to a regional grid, they are referred to as ’isolated’ or ‘islanded microgrids’, or as ‘off-grid’. In the past two decades, these remote communities became more vulnerable to high and volatile fossil fuel prices, particularly during the oil price shock of 2007 and 2008 [10]. Consequently, many rural Alaskan communities transitioned from operating their islanded power grids purely with diesel generators to adding local renewable sources over the past two decades [11].
Alaska’s remote communities are mostly inhabited by Indigenous peoples who to this day practice their culture and traditional lifestyles, including the gathering of wild foods playing a central role in food security and identity [12,13]. In the 20th century, motorized vehicles were adopted to meet personal transport needs that previously were met by human power or dogs [14]. Motorization expanded access to harvestable resources but also created energy dependence, intricately linking food security with fossil fuel use [15,16,17]. Currently, remote rural communities use conventional internal combustion engine (ICE) vehicles such as cars and trucks and off-highway or off-road vehicles such as all-terrain vehicles (ATVs) and snowmobiles (also referred to as snogos or snowmachines) for overland travel.
Currently, little is known about how receptive rural Alaskans are to electric vehicles, how EVs would integrate with current vehicle use patterns, and what the potential barriers to EV adoption are. In addition, little research has been conducted on energy use for personal transportation in remote rural Alaska. Two face-to-face household surveys were conducted in 2010 in three communities in Northwest Alaska [18] and in 2011 in ten communities in Interior Alaska [17]. This research found that energy use is largely driven by vehicle ownership and community-specific cultural factors related to traditional activities such as wild food harvesting [17]. Limited analysis exists on the implications of transportation electrification in the Arctic, including impacts on fueling costs and greenhouse gas emissions [3]. There is much research on the role of policy support and economic incentives on the rates of EV adoption in the global context [19,20,21] and in other northern regions such as Scandinavia [22,23], showing correlations of EV uptake with charging station density, tax incentives, rebates, and other supports. Some of these studies also point to the role of gasoline and electricity prices, subject to taxes and subsidies. This investigation looked into the baseline impacts of existing conditions (use, climate, prices) on the relative benefits of a transition to EVs.
For this study, academic researchers partnered with three rural communities: Kotzebue, Galena, and Bethel, Alaska, USA (Figure 1 and Table 1) to determine EV use cases and how switching from ICE vehicles to EVs will affect fueling costs and greenhouse gas emissions. Specifically, our approach builds on previous work creating an electric vehicle calculator that helps policy makers and consumers identify trade-offs between ICE and EVs operating in cold climates [3]. A co-production process was followed that actively involved community partners in all stages of research, enabling transparency, communication, and trust between researchers and communities [24]. Mixed methods were used to identify typical ICE vehicle use cases that were then modeled in a modified version of the electric vehicle calculator to determine changes in fueling costs and greenhouse gas emissions related to a switch from ICE to EV [3]. The study found that a switch to EVs would result in net reductions in fueling costs in all use cases assuming subsidized electric rates and in 17 of 21 use cases assuming full (not subsidized) electric rates, and result in net reductions in greenhouse gas emissions in 15 of the 21 use cases.
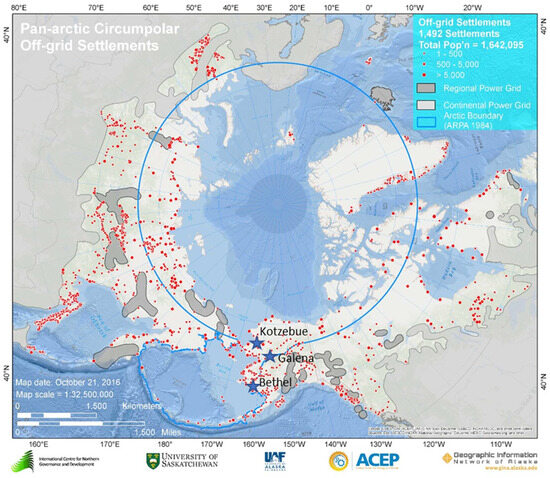
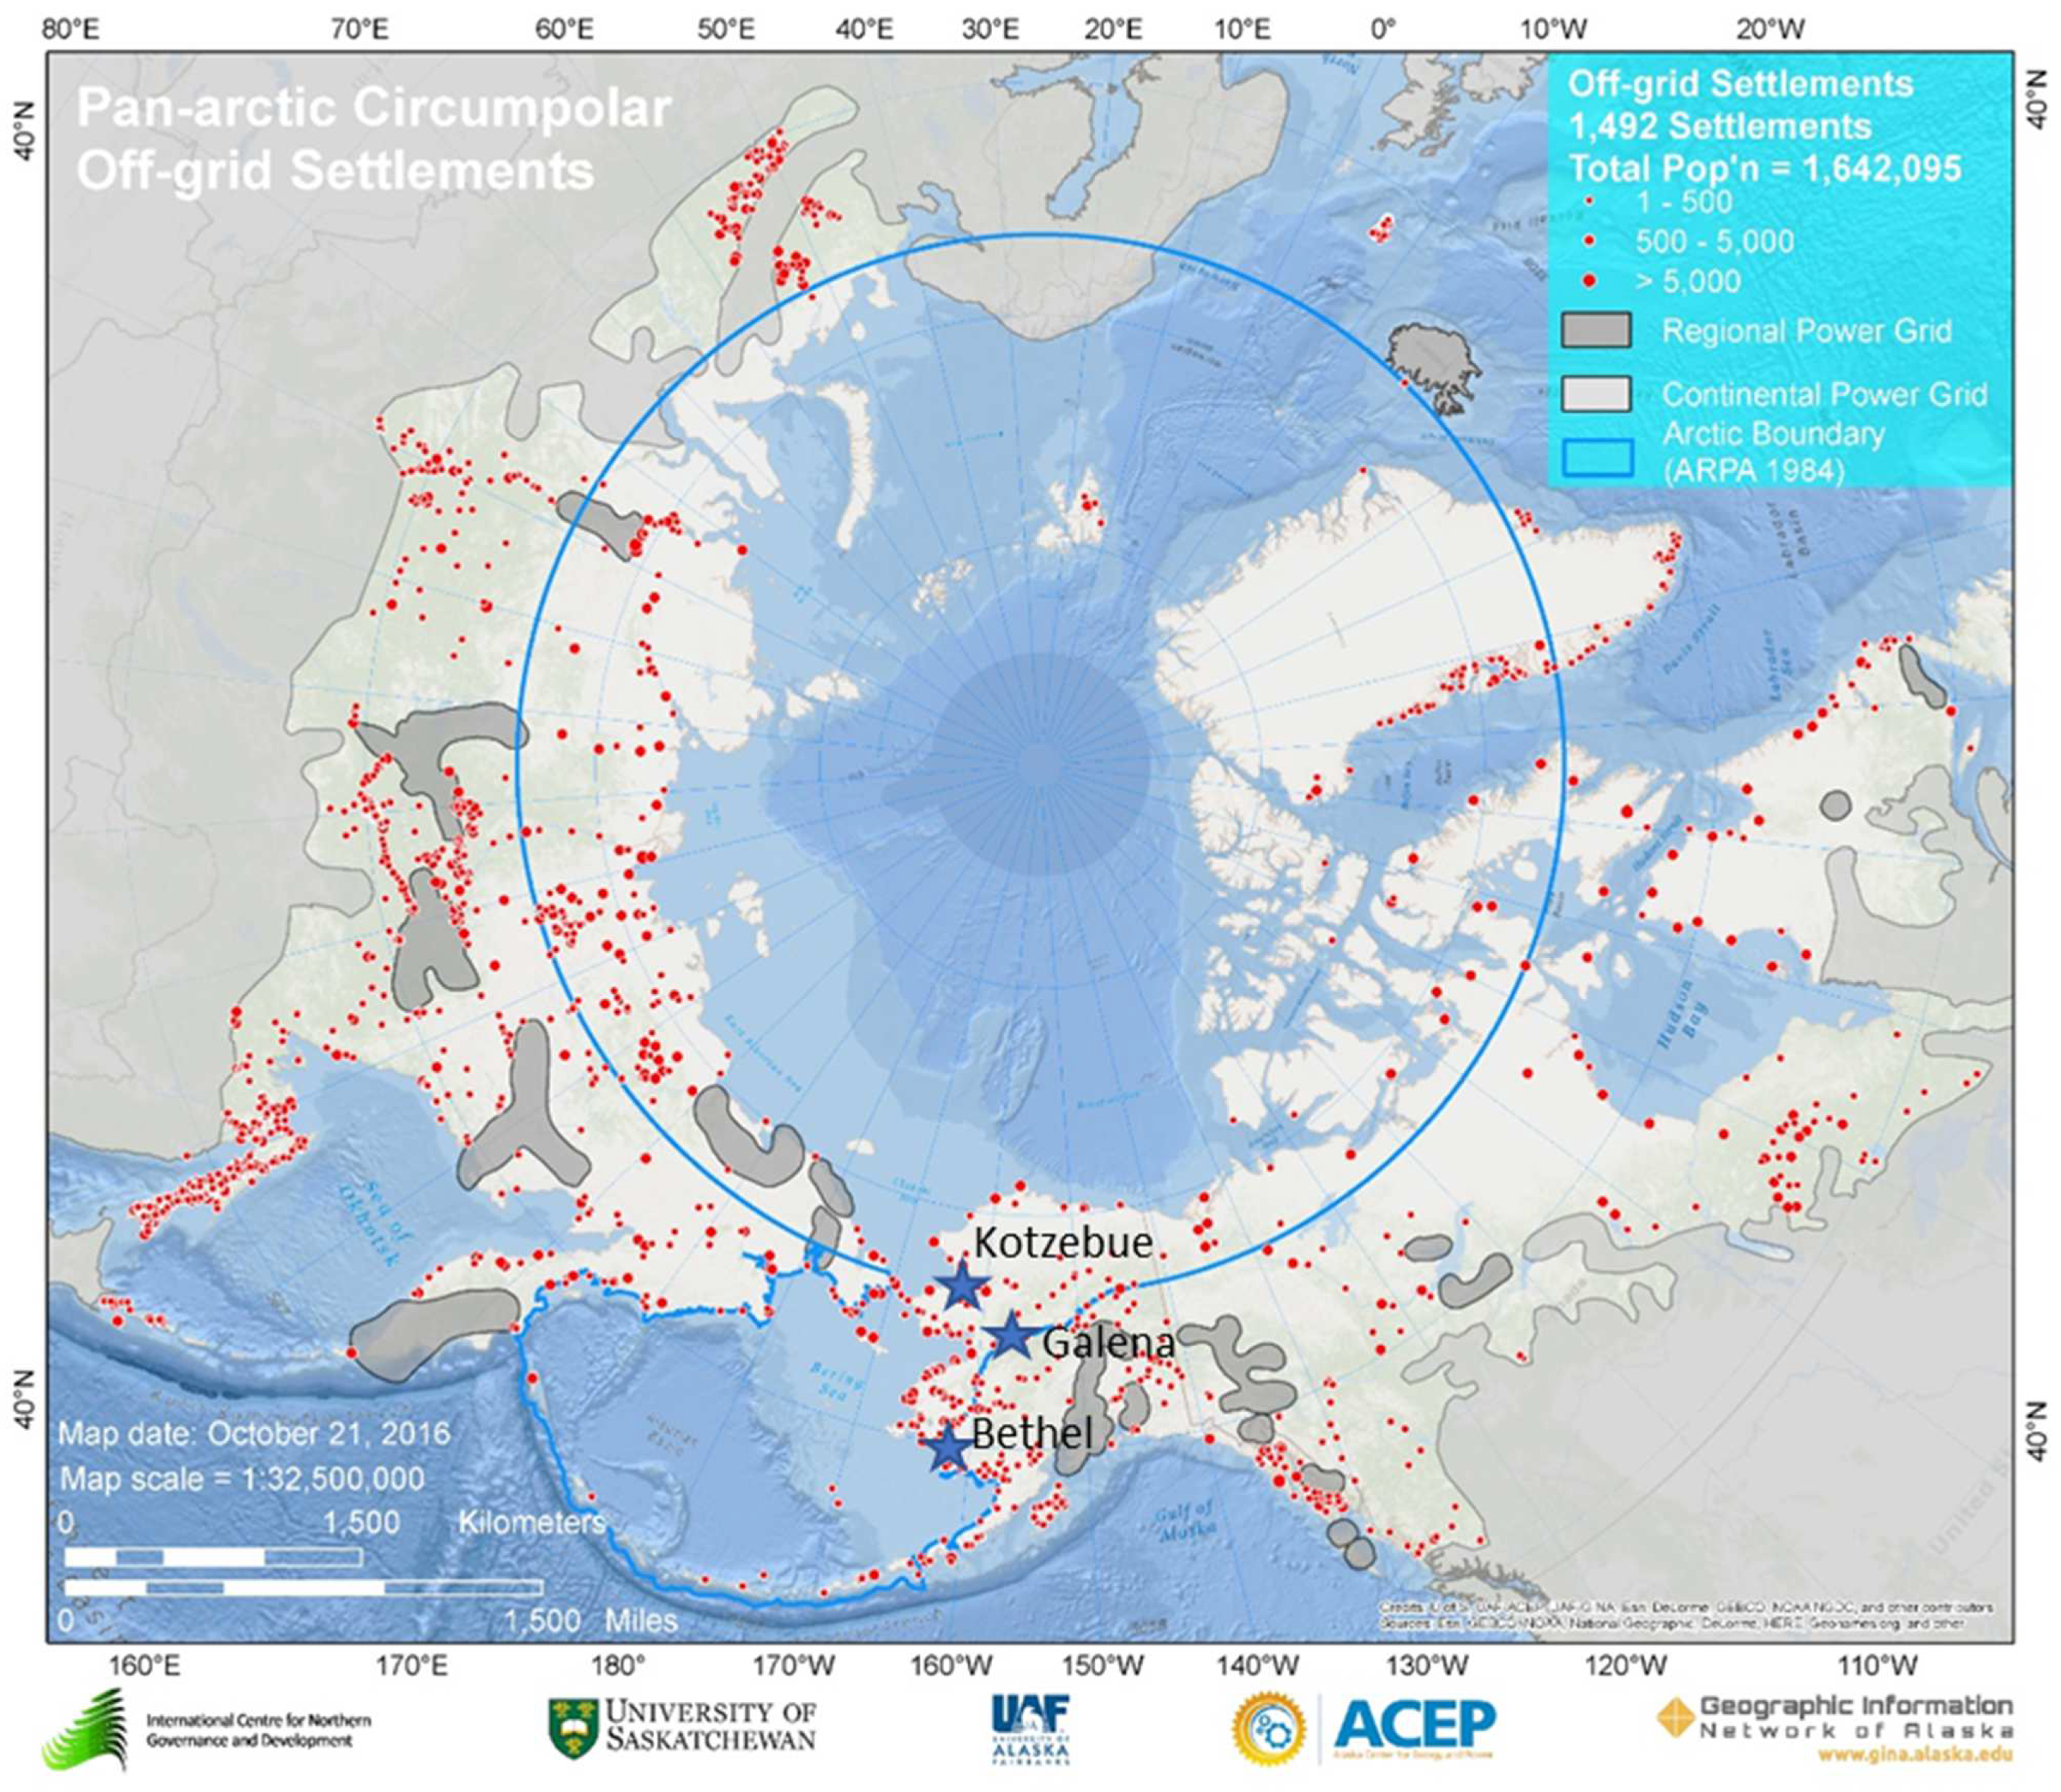
Figure 1.
Pan-Arctic circumpolar communities off the electrical grid system [25]. The off-grid partner communities of Kotzebue, Galena, and Bethel are indicated on the map by labeled blue stars.
2. Materials and Methods
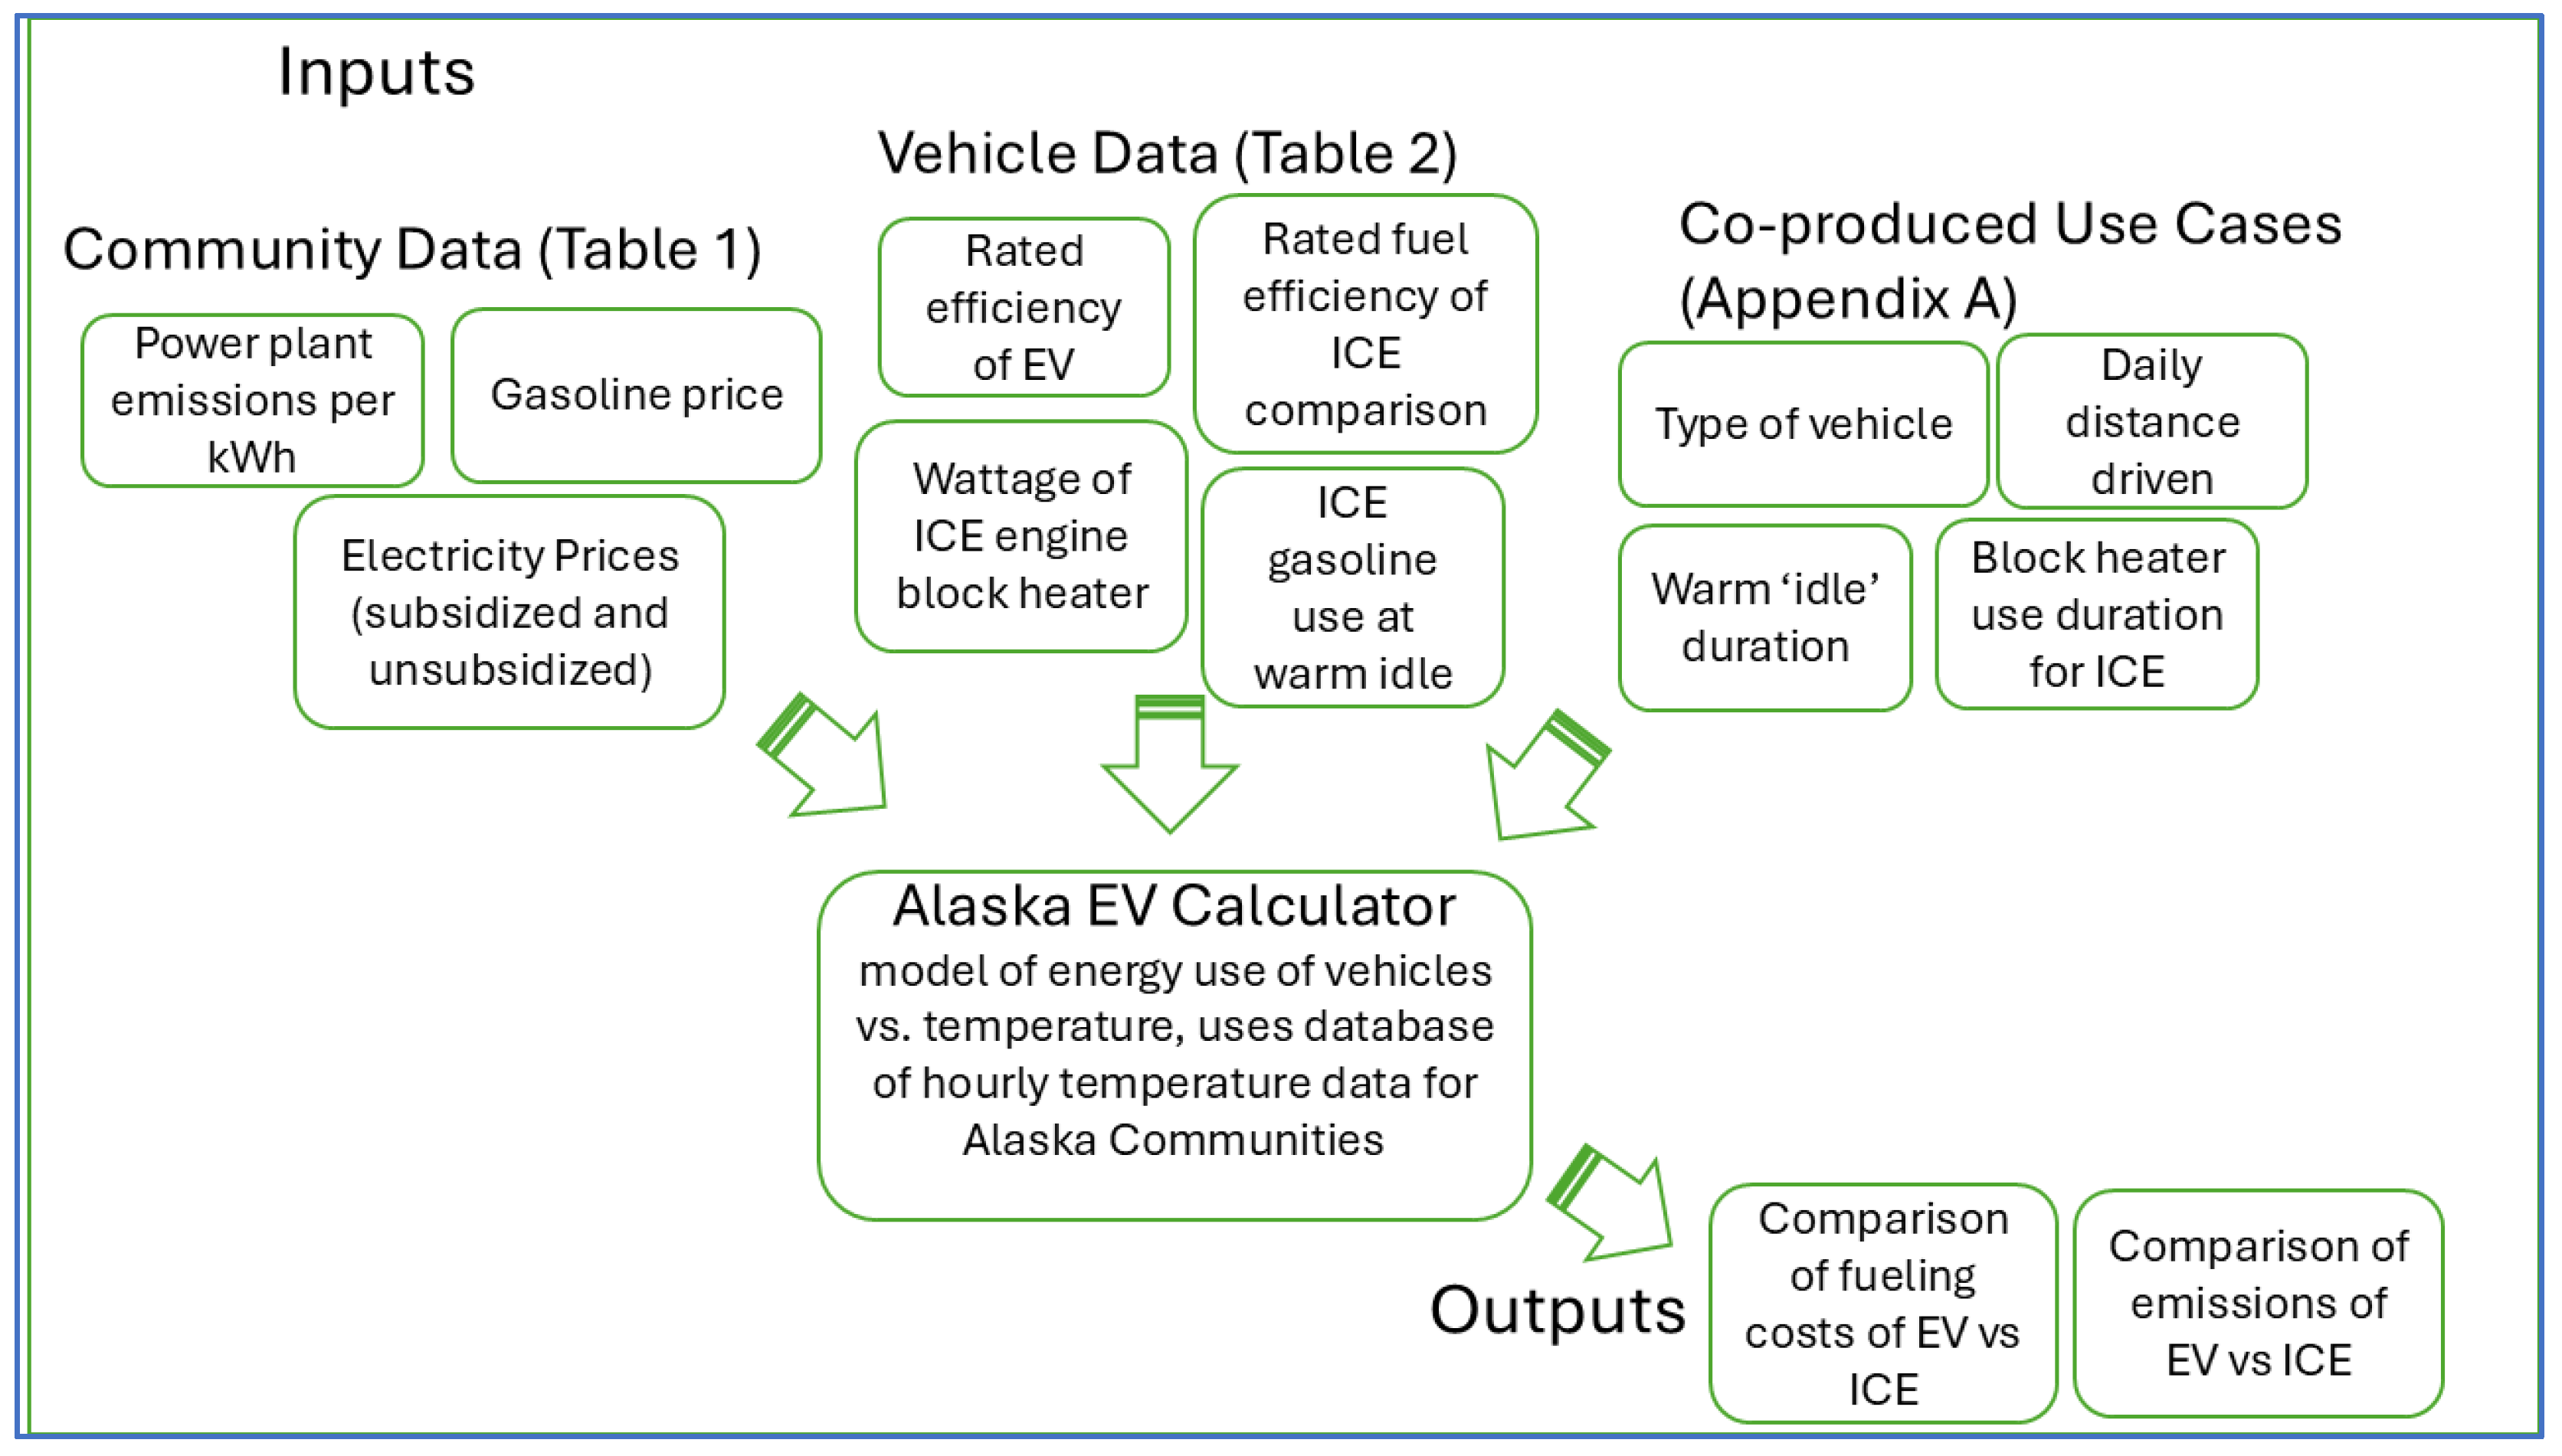
Figure 2 illustrates data sources and components for analysis. Inputs and other important considerations about the partner communities are presented in Section 2.1, vehicle energy use assumptions and modeling in Section 2.2, and use cases in Section 2.3.
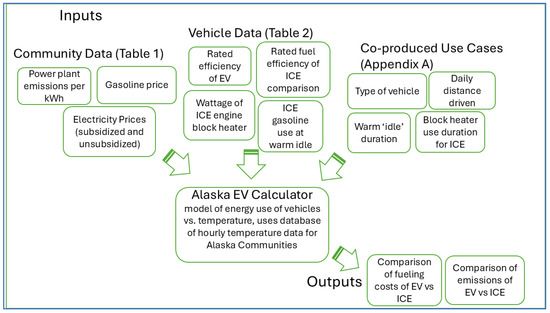
Figure 2.
Methodological workflow summarizing the inputs and outputs of the analysis detailed in this section.
2.1. Partner Communities
Our partner communities represent different geographic and cultural regions and have different population sizes, islanded grid characteristics, and varying access to renewable energy sources [26] (Table 1). While each of the communities is similar in having limited road systems that are not connected to the rest of the state, there are differences as to the geographic spread of the built-up area and total length of the road system in each community. Local roads may extend beyond town to recreational areas, landfills, or military facilities, and may be used less commonly than roads within the built-up area. In winter, communities may extend their summer roads by building temporary ice roads to connect to other communities or road systems. Although not accounted for in this analysis, it is noteworthy that a large amount of transportation is by boat, barge, or airplane due to the lack of connecting roads and local services.
Residential electric utility customers in many rural communities in Alaska, including the study communities, receive a state-funded subsidy that lowers the effective electricity rate for the first 750 kWh of electricity consumed per household per month. This subsidy under Alaska’s Power Cost Equalization (PCE) program adjusts a participating rural electric utility’s residential rate to levels comparable to the electricity rates paid by residential customers of utilities serving the urban parts of Alaska that have intertie transmission [27]. This adjustment is reflected in the PCE-adjusted rate shown in Table 1.
ICE vehicles in Alaska typically are outfitted with engine block heaters, further referred to as block heaters, and may also be outfitted with oil pan heaters and battery thermal blankets. All of these are plugged in during cold weather to allow vehicles to start reliably and reduce air pollutants. There are various ways to control the energy use of block heaters. Block heaters may be plugged into electric timers and only used for a few hours before starting, or they may be on a cycle control that only powers them for a portion of every hour. Many of our respondents told us that power quality in their community quickly damages control devices and that they either manually plug in the block heater a couple of hours before needing the car, or they leave it plugged in overnight or all day.

Table 1.
Partner community characteristics and model inputs from data available during community visits in November 2022.
Table 1.
Partner community characteristics and model inputs from data available during community visits in November 2022.
| Community | Bethel | Kotzebue | Galena | |
|---|---|---|---|---|
| Community, environmental, and utility characteristics | ||||
| Population 1 | 6325 | 3102 | 472 | |
| Households 1 | 2790 | 852 | 266 | |
| Alaska Native 1 | 65.7% | 68.2% | 69.1% | |
| Median household income, 2022 US 1 | $100,168 | $101,071 | $77,813 | |
| Poverty 1 | 12.6% | 13.2% | 12.0% | |
| Wild food harvest, lbs/capita 2 | 165 | 203 | 250 | |
| January minimum temperature 3 | 1.2 °F/−17 °C | −8.4 °F/−22 °C | −16.8 °F/−27 °C | |
| Annual Heating Degree Days, Base 65 °F 4 | 12,233 | 14,455 | 14,212 | |
| Renewable energy, % 5 | <1% | 30% | 0% | |
| Length of local road system, km/mi (paved) | 26/16 (16/10) 6 | 45/28 (11/7) 7 | 72/45 (0) 8 | |
| Mean monthly residential electricity consumption, kWh 5 | 376 | 263 | 253 | |
| Model inputs determined during community visits in 2022 | ||||
| Electric utility emissions, kg CO2/kWh 5 | 0.71 | 0.61 | 0.74 | |
| Residential and commercial electricity rate (subsidized), USD/kWh 9 | $0.51 ($0.23) | $0.39 ($0.19) | $0.72 ($0.45) | |
| Gasoline price, USD/gallon 10 | $6.70 | $8.00 | $9.80 | |
Sources and notes: 1 [28], 2 [29], 3 Average minimum temperatures over the period 1991–2020 [30], 4 Average Heating Degree Days base 65 °F from 1991 to 2020 [31], 5 [32], 6 [33,34], 7 [35], 8 [36]. 9 November 2022 electric rates—Kotzebue from KEA engineer Matt Bergen personal communication; Bethel: AVEC online rates accessed 11 January 2022; Galena rates reported by community members and corroborated with city utility website [37]. Commercial rates in Bethel and Galena are the same as the unsubsidized residential rate. In Kotzebue it is within 1% (0.3 cents). 10 Community gasoline prices read from retail pumps during November 2022 visits. In some cases, the number given is the average of multiple retailers in town. Prices vary little throughout the year due to only one to two fuel deliveries per year.
Idling at the start or between trips is also frequently used in cold weather to warm up or keep warm the engine block and cabin of vehicles, or to make sure vehicles do not fail to start after engines are turned off after a stop. This idling and the use of block heaters can be a significant cause of energy and fuel use on cold days, defined in Section 2.2.
Kotzebue Electric pays the lowest cost per gallon of diesel fuel for power generation of the three communities, has the highest renewable energy penetration, and reports the lowest cost and lowest emissions per kWh, as calculated from the utility’s reported total annual diesel use and energy generation [32]. However, Kotzebue has relatively high retail prices for gasoline at the pump. Bethel has higher electricity rates and emissions, but lower retail gasoline prices. Galena has higher electricity rates and retail gasoline prices than the other two communities and electricity generation emissions per kWh are higher than in Kotzebue, but comparable to Bethel. Heating Degree Days (HDDs), which are an engineering measure of the relative amount of space heating needed in a location, are highly correlated to the temperature-dependent component of EV energy use due to the dominance of cabin heating. Even though Galena has the lowest minimum winter temperature, which affects the maximum range reduction from cold weather, it has nearly the same HDD as Kotzebue, indicating similar annual energy needs for cabin heating. These comparisons help explain the differences in benefits from a switch to EVs for a given vehicle use in each community.
2.2. Fueling Cost and Greenhouse Gas Emissions Calculator
For the analysis of changes in fueling cost and greenhouse gas emissions related to the switch from ICE to EVs, the web-based Alaska EV Calculator (https://www.tinyurl.com/akevcalc, accessed on 23 May 2023) was modified to enable calculations for snowmobiles and ATVs in addition to cars and trucks [3]. This calculator is a model of energy use given hourly temperatures that can be applied to compare annual energy costs and greenhouse gas emissions of EVs to those of ICE vehicles for Alaskan communities. The unmodified calculator draws the following information from frequently updated public databases used as defaults [3]. However, for this modified version, those defaults were replaced with values from the referenced tables in this paper:
The modified calculator includes the following vehicle types: car, truck, ATV, and snowmobile. The use cases developed for this study co-produced the following information together with community members through interviews and workshops (see below):
- Vehicle type (car, truck, snowmobile, ATV);
- Daily driving distance, mi/day;
- Daily duration of block heater use in winter, hours/day;
- Daily duration of warm idle in winter, minutes/day.
Consistent with the default inputs to the EV calculator, in this study it is assumed that vehicles are not parked in a warm space such as a garage and that there are no residential photovoltaics present to offset emissions [3]. Heated garages are rare in rural Alaska and most commonly used for critical heavy diesel equipment. It should be noted that while rooftop solar is not common in rural Alaska due to a lack of net metering by the utilities, rooftop solar is more common in Galena than in the other partner communities. Average daily distance driven is generally assumed to be the same for weekdays (Monday–Friday) and weekends (Saturday and Sunday), but a different value for weekend days can be used [3].
The model assumes that a block heater (on ICE vehicles) is only used on days when the average temperature is less than −7 °C/20 °F, defined as cold days. Similarly, energy use for idling (on ICE vehicles) is only modeled during days when ambient temperatures are below 19 °C/66 °F and additional heating of the cabin is needed for comfort [3]. Block heaters and idling are not assumed to be used for ICE ATVs and snowmobiles. While block heater kits do exist for ICE snowmobiles, they are not reported to be commonly used in the communities. Without a cabin to be warmed up or kept warm, idling is expected to be negligible compared to cars and trucks.
For electric vehicles, battery thermal management systems (BTMSs) [5] work to automatically keep the battery warm enough for operation and to prevent damage. Warming the cabin interior [38] is performed by using electricity to operate cabin heaters, window defrosters, seat heaters, etc. This state is also referred to here as idling, although no engine is actually idling. The EV calculator uses the same relationship of energy use with temperature by the BTMS for electric ATVs and electric snowmobiles as it does for cars [3], except that it scales by the relative battery capacity. Thus, the energy use relationship with temperature is scaled by 20% for ATVs and 48% for snowmobiles [39]. This assumption is made in the absence of published data, and remains to be verified by future data collection and analysis. Snowmobile use was modeled to be limited to wintertime from November 15 through May 1 while ATV use was modeled to occur year-round. While ATV use does happen in the winter, it was reported to be less common in Galena.
Table 2.
Model assumptions by vehicle type, expanded from Wilber and Schmidt, 2024.
Table 2.
Model assumptions by vehicle type, expanded from Wilber and Schmidt, 2024.
| Vehicle Type | EV | Internal Combustion Engine (ICE) Assumptions | ||
|---|---|---|---|---|
| Rated Efficiency, kWh/Mi | Rated Fuel Efficiency, Mi/Gallon | Engine Block Heater, W | Gasoline Used at Warm Idle, Gallons/Hour | |
| Truck/SUV | 0.50 1 | 20 1 | 600 | 0.2 1 |
| Car | 0.28 1 | 27 1 | 400 | 0.4 1 |
| ATV | 0.20 4 | 15 2 | None | None |
| Snowmobile | 0.37 5 | 25 3 | None | None |
Sources and notes: 1 [3], 2 [40], 3 Based on a 4-stroke engine model [41], 4 calculated from range and battery size of some available models [39], 5 Taiga Nomad reported to have 23 kWh battery, 62 mi standard range [40].
2.3. Co-Producing Vehicle Use Cases
For informing use cases for the EV calculator, co-production and community engagement approaches were followed [12,42]. Specifically, data collection techniques were used that are closely related to mediated modeling and participatory modeling [43,44,45]. In each community, a local community research lead was hired for the duration of the study to help in the design, implementation, and documentation of the community engagement and data collection process. This approach allowed the research to be most relevant for local communities and allowed for validation of research methods and results.
The community research leads were instrumental in facilitating interviews and community workshops aimed at developing a set of select vehicle use cases for EVs. The interviews collected information about the use cases of businesses and organizations. The workshops targeted residential households and facilitated co-learning between community members and researchers [46]. Workshop participants, similar to interviewees, were also asked about how they used vehicles and whether they would consider switching to EVs.
2.3.1. Interviews
Semi-structured interviews with local organizations and businesses were conducted in March and November of 2022, with an attempt to interview most organizations in each community and to speak to the owner or lead of each organization. The organizations interviewed included tribes, federal and state agencies, food delivery services, taxis, and automotive repair shops.
Interviewees were asked the following questions about their vehicle use to determine each use case’s daily driving distance, duration of block heater use in winter, and duration of warm idling in winter.
- What vehicles do you use?
- How many mi a day on average do you drive each of your vehicles?
- In winter, do you plug in your vehicles’ block heaters and do you use an electric timer to control their energy use? If so, how many hours do you keep your block heaters turned on?
- How long is the vehicle idled each day when it is cold?
Use cases were developed from interview data as follows: First, use cases were only considered where respondents indicated a likely switch to EVs. These use cases mainly included vehicles used for in-town driving such as cars, trucks, and SUVs, where the latter two were combined into one vehicle class due to similar energy efficiency. Some organizations listed ATVs and snowmobiles in their fleet, but use was generally too infrequent to justify modeling. Other vehicle types, such as buses, front end loaders, and other heavy equipment were also mentioned, but excluded [3]. Second, for use cases where interviewees indicated the use of block heaters without timers or other controls, block heaters were assumed to be turned on for 12 h per day. Many respondents indicated plugging in overnight, which might reasonably be expected to be from 8 to 14 h based on normal work schedules. Third, for respondents less familiar or less certain about an organization’s vehicle use, driving distances were determined using existing data from comparable local organizations. Finally, interview data were combined to form 12 unique use cases (Table A1) of the 21 total use cases listed in Table 3.
Table 3.
Use case analysis and overview of EV calculator results for all 21 use cases, annual reductions in greenhouse gas emissions and fueling costs given subsidized and unsubsidized electricity rates for a switch to an EV from an ICE. Reductions in costs and emissions are shown as positive percentages, indicating that EVs outperformed the ICEs, % reduction = (ICE − EV)/ICE.
2.3.2. Community Workshops
Workshops open to the public were held in each of the partner communities in March of 2022. Workshop participants were recruited with help from community research leads through word of mouth, advertisements (at stores, the post office, and community centers), and radio announcements. Each attendant received USD 20 for participating in the workshop. Through workshop discussions, information was collected on vehicle use patterns including type of vehicle, purpose, and frequency of use.
Participants were asked to list the vehicles they used, with common responses including cars, SUVs, trucks, ATVs, snowmobiles, boats, and airplanes. Participants were also asked about the purpose of vehicle use, with responses including commuting, errands, visiting other communities, search and rescue, joyriding, and other types of use. Then, participants were asked to indicate with dot stickers on poster paper what the top three most common vehicle uses were by vehicle type, use case, and frequency (daily, multiple times a week, a few times a week, occasionally). Participants were then asked to indicate with green, yellow, and red dots which of those uses they were willing, maybe willing, or not willing to consider an EV for. Below, this approach is referred to as the dot exercise and detailed results are presented in Appendix A, Table A2. Each recorded vehicle use from the dot exercise is called a vehicle use record. A subset of the use records was considered for use cases modeled in the EV calculator (Table 3). Each vehicle use case differed in vehicle type used, distance driven, duration of block heater use, and duration of idling by community.
The following process was used to create use cases from the use records in Table A2. First, only use records where workshop participants indicated a willingness to switch to EVs were considered. Second, rare vehicle use reported as “occasional” or “a few times a week” in frequency was eliminated since the EV calculator assumes daily vehicle use [3]. “Multi-day use” was modeled in the EV calculator as daily use on weekdays with no use on weekends, using the stated distances. “Daily use” was modeled as the stated distances occurring on both weekdays and weekends. The daily driving distance for each use case was verified with community research partners who are familiar with travel distances and the informal trail network in partner communities. Third, since the workshops’ dot exercise did not gather information on idling or block heater use, information was borrowed on block heater use and idling times from the most similar use cases observed in the structured interviews. Fourth, the use records for trucks and SUVs were combined into one vehicle class, trucks, due to similar energy efficiency. Fifth, boats, airplanes, and bicycles were excluded from analysis due to data and modeling complexities outside the scope of this study. Finally, the resulting use cases were compared with the use cases developed from the interview data to create 9 unique use cases (Appendix A, Table A3) for a total of 21 use cases listed in Table 3.
The workshops and semi-structured interviews were approved by the University of Alaska Anchorage Institutional Review Board (IRB) under protocol 1780088, ensuring human subjects’ protection. Research participants were made aware that their participation in the study was voluntary, that they could leave the workshop or interviews at any time, and that their names and identities would not be shared.
3. Results
3.1. Use Cases
The workshops had a total of 25 participants (Bethel n = 6, Galena n = 10, Kotzebue n = 9) and a total of 25 interviews with leaders of organizations or businesses were conducted, of which 20 interviewees specified vehicle use. In 60% of all use records developed during the workshops’ dot exercise, participants indicated a willingness to switch to EVs, with 20% a maybe and the remaining 20% indicating no willingness to switch (Appendix A, Table A2). Of the use records where participants reported not being willing to switch to EVs, 30% were related to the use of boats, 20% snowmobiles, and 20% ATVs.
The resulting 21 EV use cases cover a wide range of vehicle use patterns. Six use cases are from Kotzebue, four of which are commercial, six (five commercial) are from Bethel, and eight (two commercial) are from Galena. A total of twelve use cases involved trucks/SUVs, four cars, three snowmobiles, and two ATVs. The distance driven ranged from 6 km to 480 km (4 mi to 300 mi) per day with a median distance across use cases of 13 km/8 mi (mean 59 km/37 mi). In fifteen of the total use cases, driving occurred only on weekdays while six use cases had daily driving. Note that to make this study most accessible to Alaskan communities, the results are presented in mi as well as kilometers.
Table 3 presents fueling costs and greenhouse gas emissions reductions for the 21 use cases obtained from interviewees and workshop participants, full results including modeled costs and emissions are included in Supplementary Materials, Table S1. For comparing the fueling costs of ICE vehicles with EVs, gasoline prices (Table 1) and both subsidized and unsubsidized electric rates (Table 1) were used to illustrate the potential range of additional electric costs a household or business would realize when switching to EVs. Note that the electric cost for block heater use for ICE vehicles was added to the fueling cost of ICE vehicles and the respective electric rate was applied (Table S1). Reductions in net fueling costs associated with a switch from ICE to EVs are shown as positive percentage changes, indicating the EV is favorable compared to the ICE. Reductions in net greenhouse gas emissions are shown, where a positive percentage shows the EV’s reduction in emissions (Table 3).
Our study found that a switch to EVs would result in net reductions in fueling costs in all use cases developed with community partners assuming subsidized electric rates and 17 of 21 use cases assuming full electric rates. Net reductions in greenhouse gas emissions were found in 14 of the 21 use cases (Table 3).
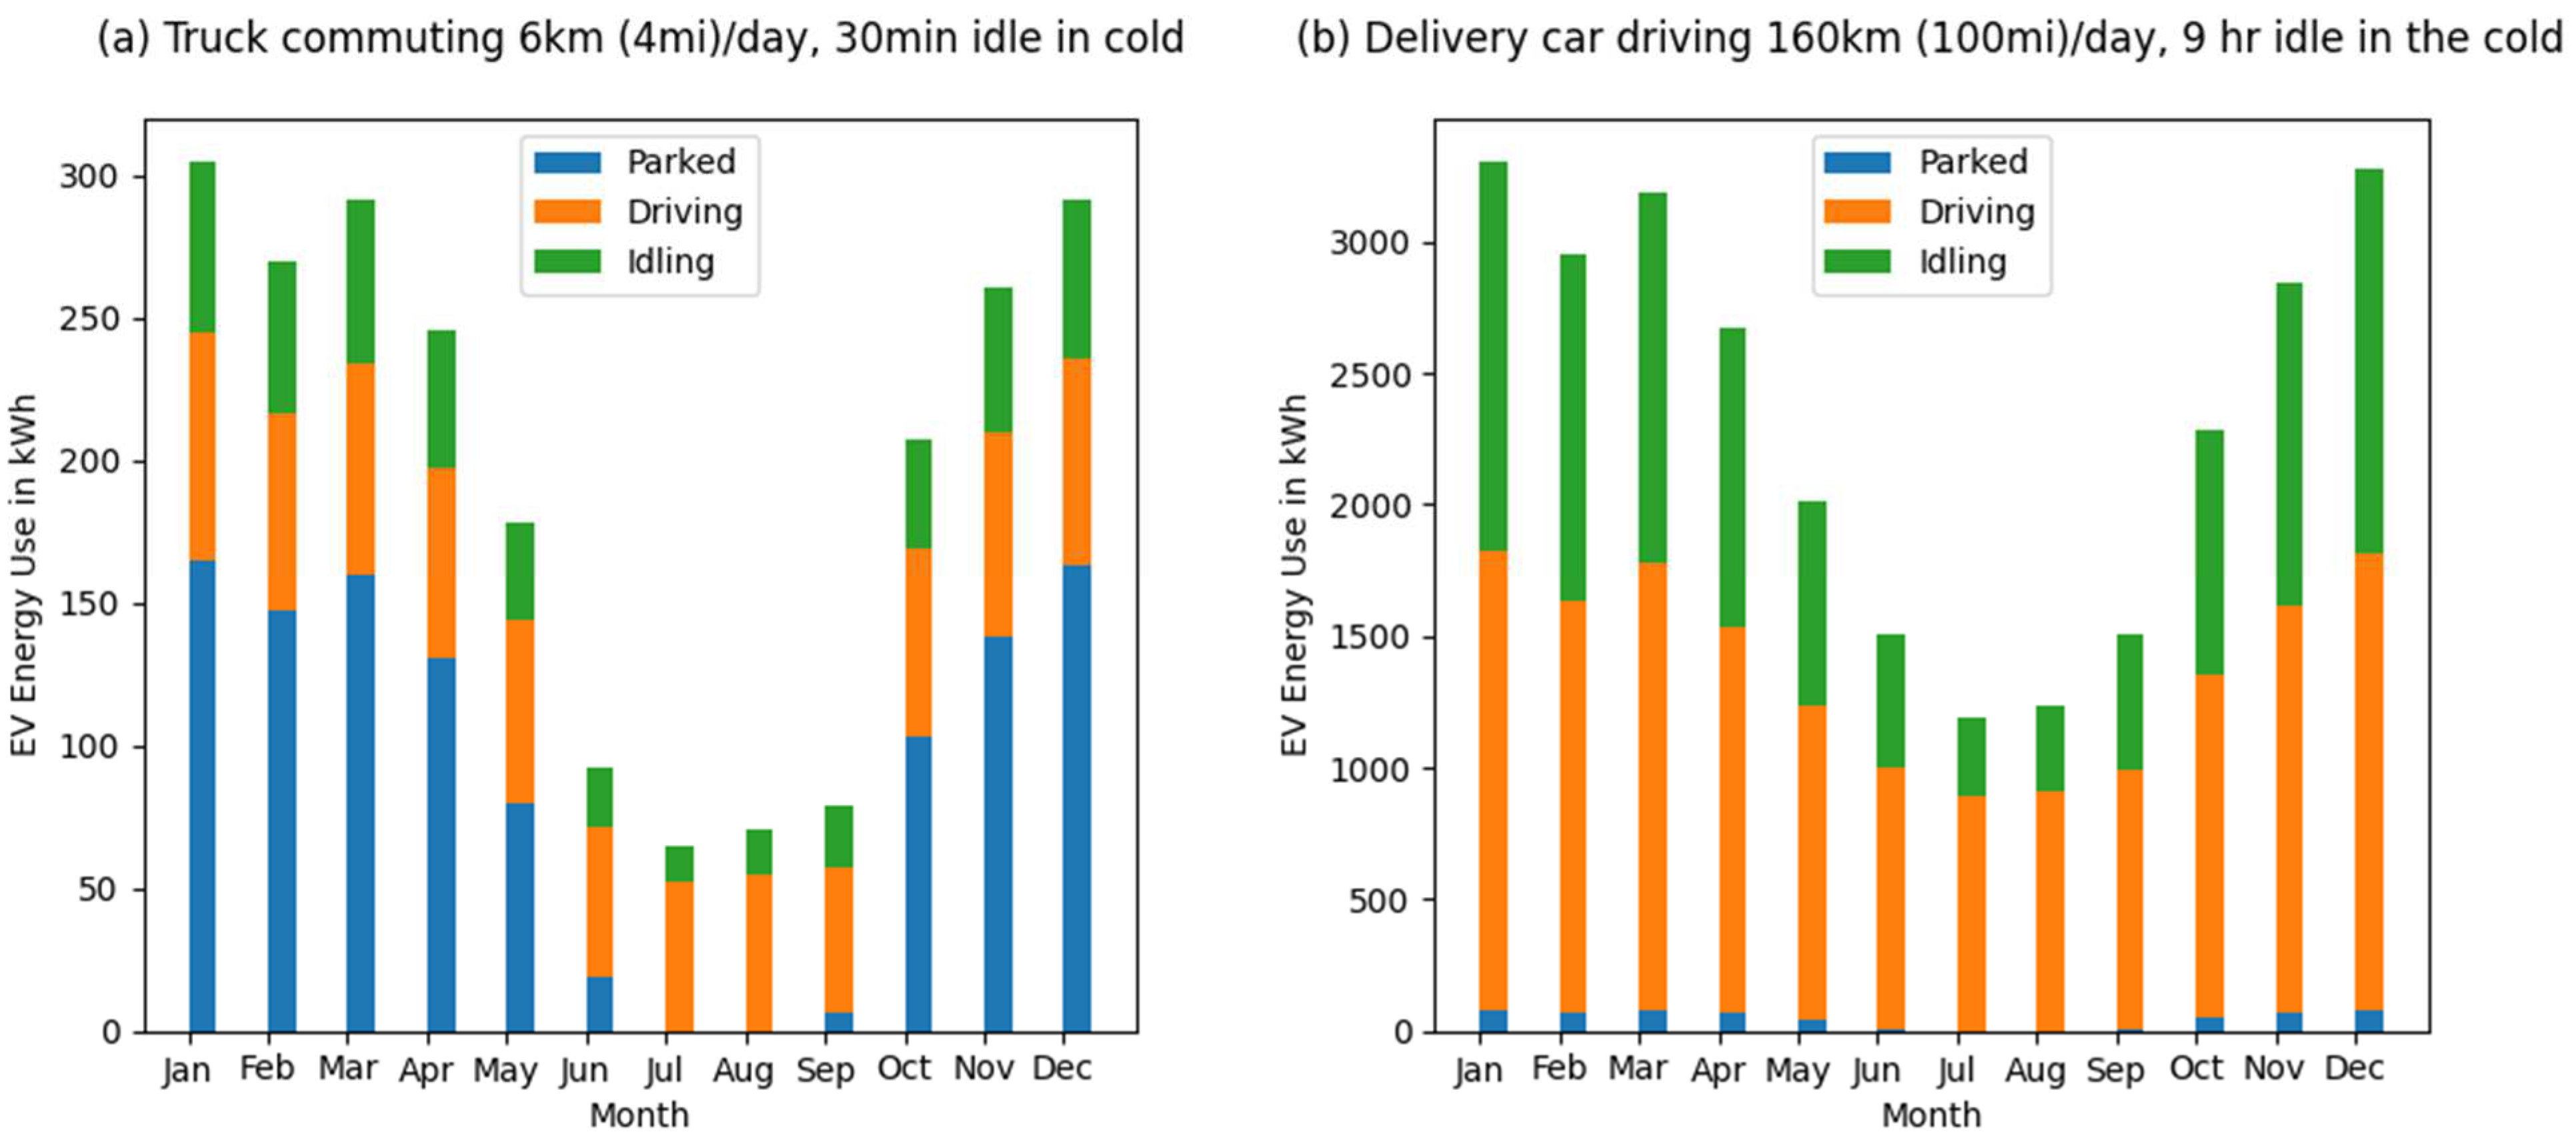
Figure 3 shows the additional monthly electricity consumption that a residential household in Kotzebue could expect throughout the year from adding an EV truck for commuting and other light use (Figure 3a) and a commercial delivery (or taxi) operator could expect from adding an EV car for heavy use such as a delivery service (Figure 3b). The largest percentage (47%, 1112 kWh) of the residential household’s total annual electricity consumption for the EV truck would be used to park the vehicle, 33% (774 kWh) would be allotted for driving, and 20% (472 kWh) would be for idling. In contrast, most (57%, 16,015 kWh) of the commercial delivery operator’s total annual electricity consumption for the EV car would be for driving, 41% (11,375 kWh) would be for idling, and 2% (563 kWh) would be for parking to keep the battery warm in cold temperatures.

Figure 3.
Monthly energy use plots from the Alaska EV calculator for Use Case 1 (a), a residential household driving an electric truck 6 km/day in Kotzebue, and Use Case 3 (b), an electric food delivery car driving 160 km/day and warm ‘idling’ (keeping the heater running while parked) in Kotzebue. Total annual energy use in (a) is 2358 kWh/yr, and in (b) is 27,953 kWh/yr.
Figure 4 illustrates the additional monthly electricity consumption a residential household commuting 11 km (7 mi) each weekday in Galena could expect from adding either an electric truck (Figure 4a), electric car (Figure 4b), electric ATV (Figure 4c), or electric snowmobile (Figure 4d) to their fleet of vehicles. By far the most efficient vehicle is the electric ATV, adding less than 50 kWh of electricity consumption to the household’s monthly electric bill. Considering snowmobiles are not usable for four months in the summer, on average, a snowmobile requires twice the amount of energy monthly, 95 kWh, to cover 11 km on weekdays. Moreover, an electric car requires more than three times the amount of energy compared to the electric ATV, 147 kWh/month on average, and an electric truck would require more than four times the amount of energy, 193 kWh/month on average to cover the 11 km on weekdays (Figure 4). Note that at very short driving distances per day, the energy consumption for each vehicle’s battery’s thermal management is proportionally higher than the energy consumption used for driving during winter months, as illustrated by comparing the blue with the orange bar height (Figure 4). For the electric snowmobile, greenhouse gas emissions are 40% larger in Use Case 20 compared to the ICE snowmobile (Table 3) and are similar between the electric car and the ICE car in Use Case 19 (Table 3). In all other use cases presented in Figure 4, EVs result in reductions in greenhouse emissions.
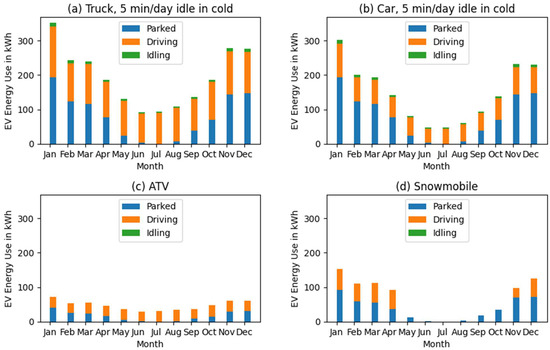
Figure 4.
Monthly energy use plots from the Alaska EV calculator for a residential household in Galena driving 11 km (7 mi)/day on weekdays in either (a) an electric truck, (b) an electric car, (c) an electric ATV, or (d) an electric snowmobile, referenced in Use Cases 14, 19, 18, and 20, respectively. Total annual energy use in (a) is 2317 kWh/yr, in (b) is 1766 kWh/yr, in (c) is 559 kWh/yr, and in (d) is 758 kWh/yr.
3.2. Sensitivity Analysis
A sensitivity analysis was conducted to explore the effects of various EV calculator input assumptions on the reduction in net fueling costs and net greenhouse gas emissions given a switch to EVs. The sensitivity analysis explored all combinations of EV calculator inputs across the three communities including the four vehicle types, daily driving from 6 to 205 km (4 to 128 mi), block heater use for ICE cars and trucks from 0 to 12 h on cold days, and warm idling of ICE cars and trucks from 0 to 160 min on cold days. Some of these combinations are rarely seen in the co-produced use cases, but this expanded search space allows exploration of the disparate contributions to the results.
Sensitivity analyses were not conducted for EV energy use parameters, which are only bounded by published data in the case of electric cars and trucks [3]. If the assumptions on the temperature coefficient of energy use by the electric versions of the vehicles are too low (i.e., if there is more energy used for thermal management at low temperatures than is modeled) the changes will mostly be seen at the lowest daily driving distances, where thermal energy use predominates, and could significantly lower the benefits of the EV at these distances. Similarly, if the estimates of EV energy use for thermal management used in this study are too high, the benefit of an EV will be higher than modeled, especially at lower driving distances.
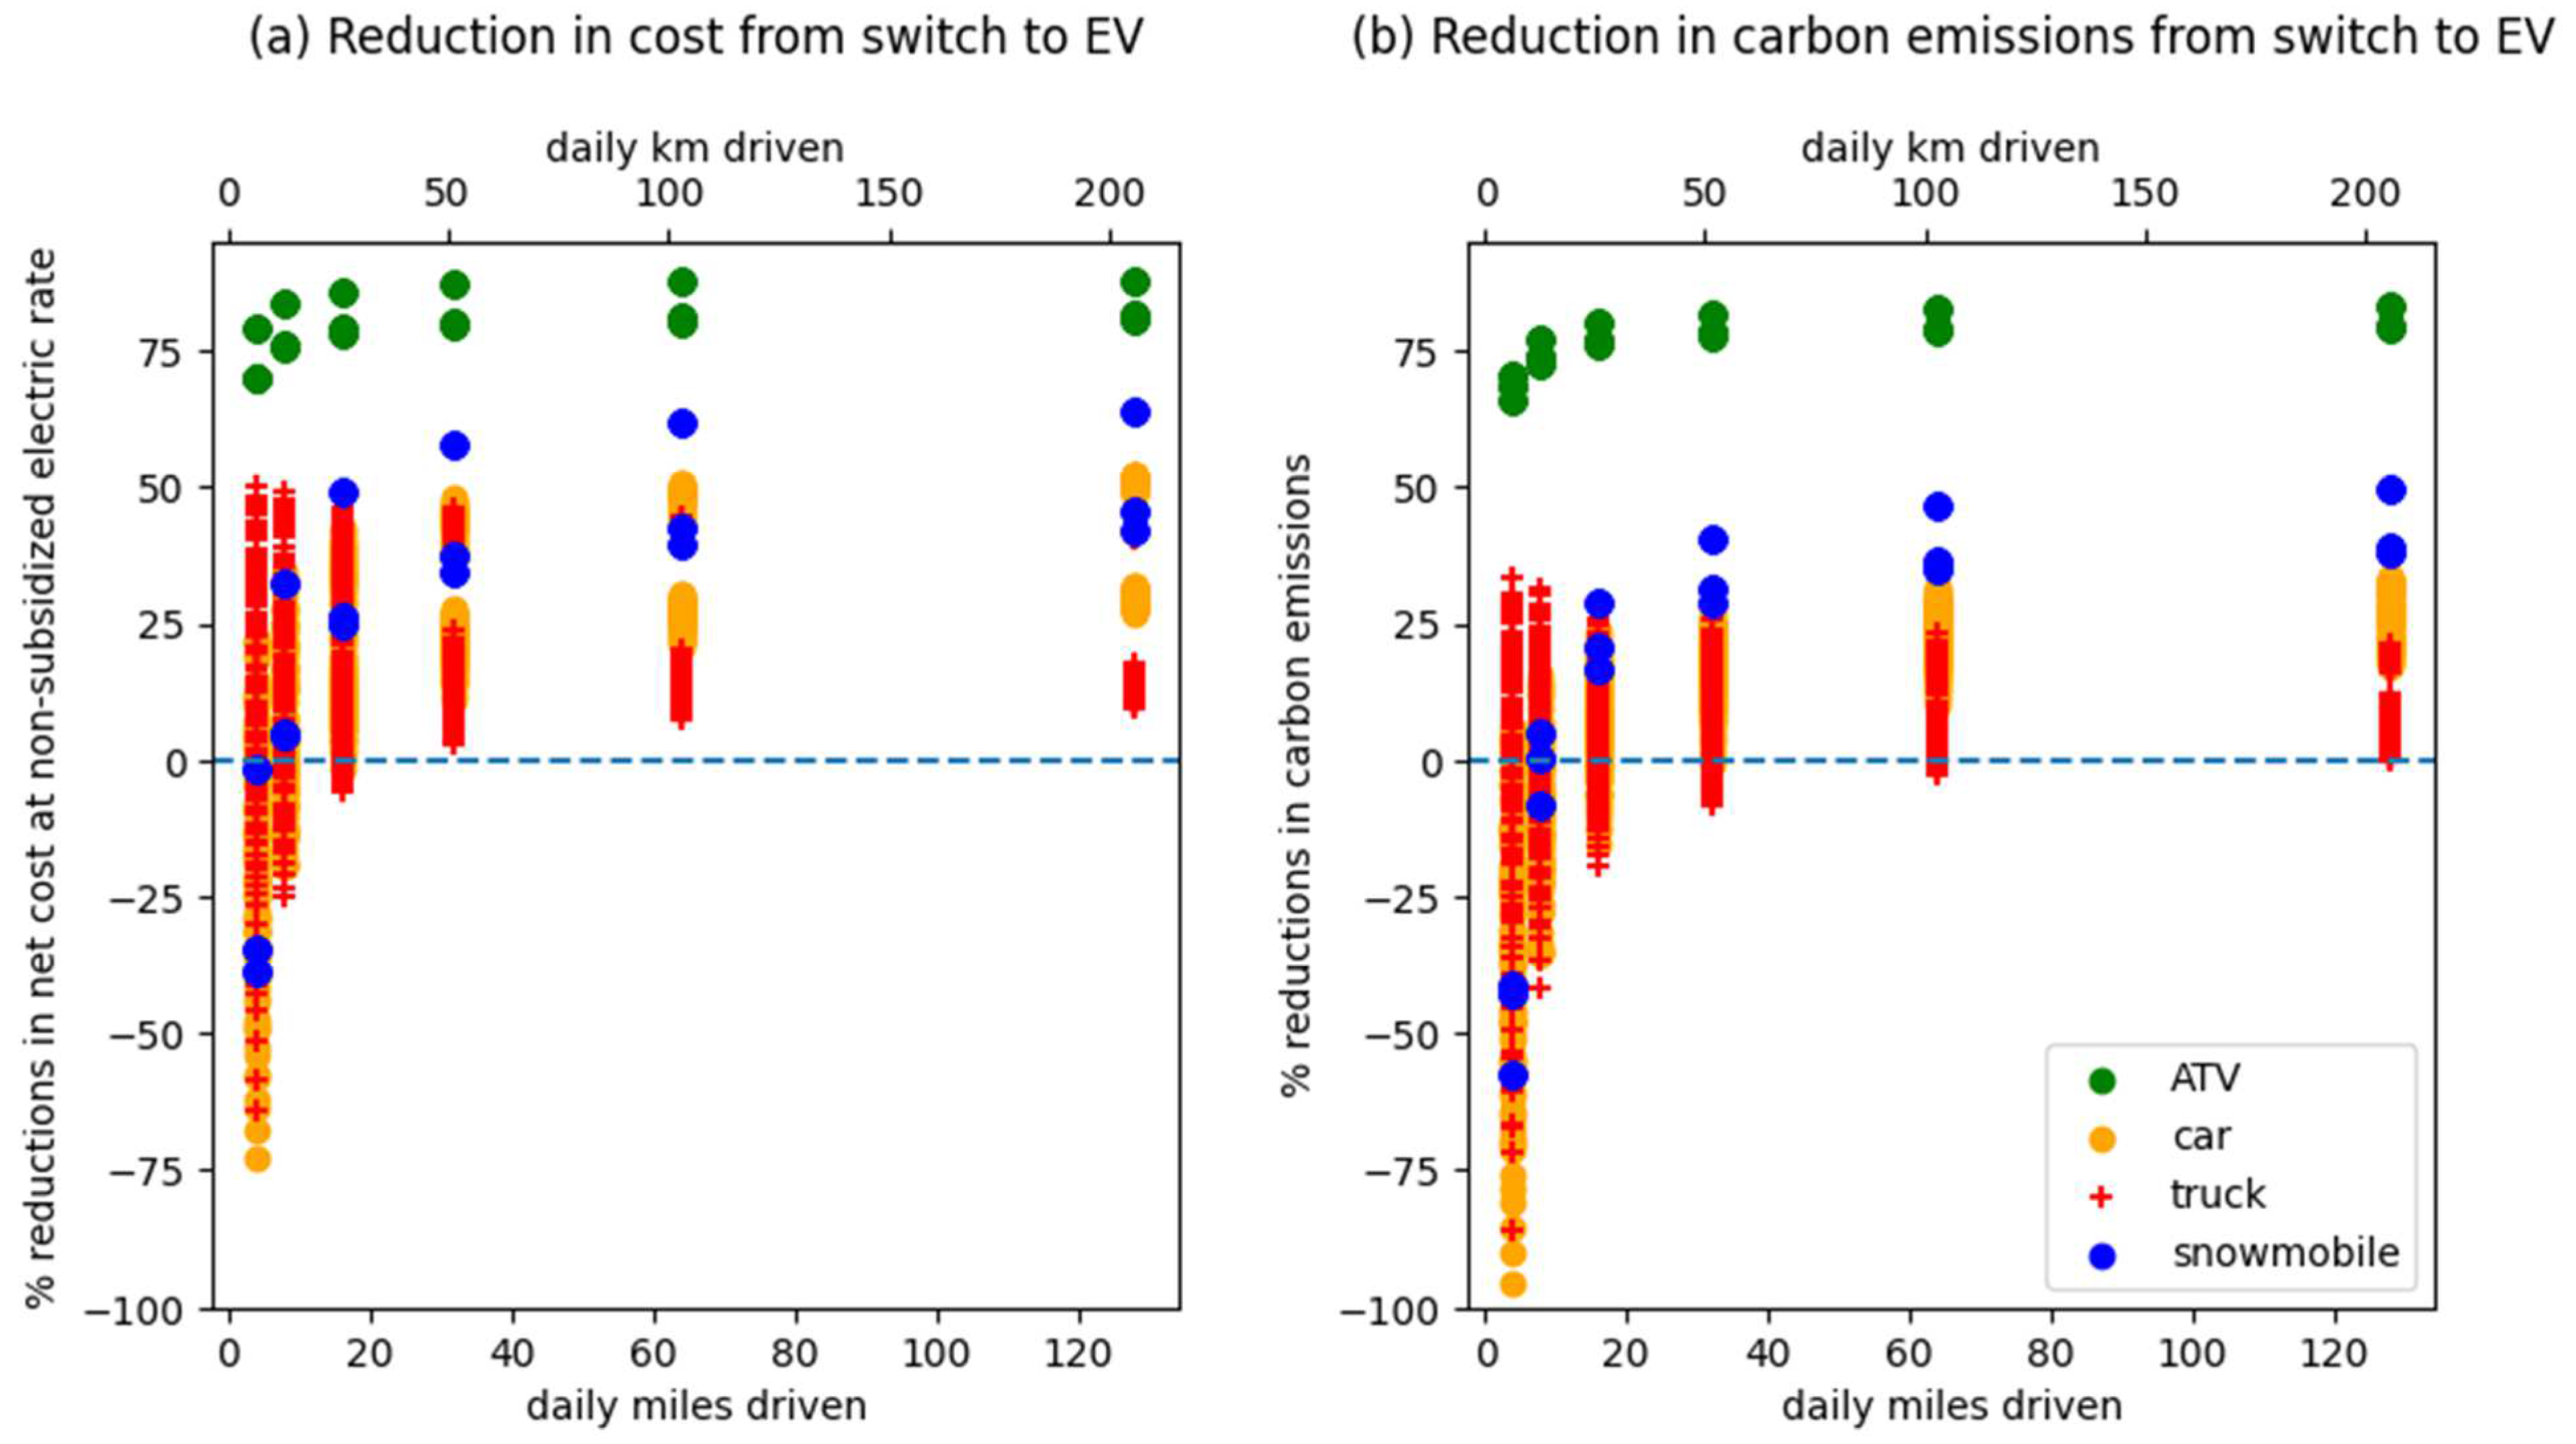
Figure 5 presents the resulting modeled reductions in net fueling costs and greenhouse gas emissions with daily distance driven and vehicle types. To better illustrate the factors that result in large increases in cost and emissions for an EV over an ICE truck (similar to a car), these factors are highlighted in Figure 6. In all modeled combinations of the sensitivity analysis, a switch from ICE ATVs to electric ATVs resulted in the largest net benefits (net cost and net greenhouse gas emission reductions) even at very short daily driving distances. For all other vehicle types, net benefits of switching to an EV were associated with longer driving distances. At distances below 16 km (10 mi) per day, switching from ICE to EV cars, trucks, and snowmobiles ranged from increases of up to 75% to decreases of up to 50% in net fueling costs (Figure 5a). Also at distances below 16 km (10 mi) per day, emissions can double for cars (Figure 5b). Across all communities and vehicle types and assuming non-subsidized electric rates, switching to EVs creates reductions in fueling costs if daily distances driven exceed 32 km (20 mi) (Figure 5). ATVs realized net reductions in fueling costs at any distance, with the assumption of year-round use. Snowmobiles realize net reductions in fueling costs at short distances, exceeding 13 km (8 mi).

Figure 5.
Reductions in net fueling cost at the non-subsidized electric rate (a) and net emissions (b) given daily driving distances by vehicle type. Reductions are shown as percentages comparing EVs to ICEs, where positive numbers (above the dashed line) indicate the EV is favorable to the ICE.
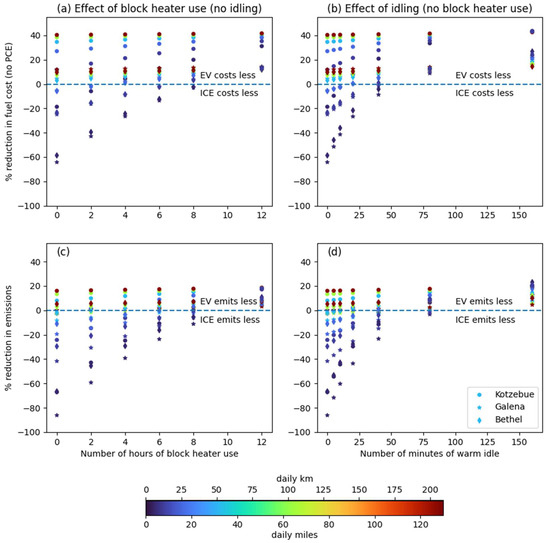
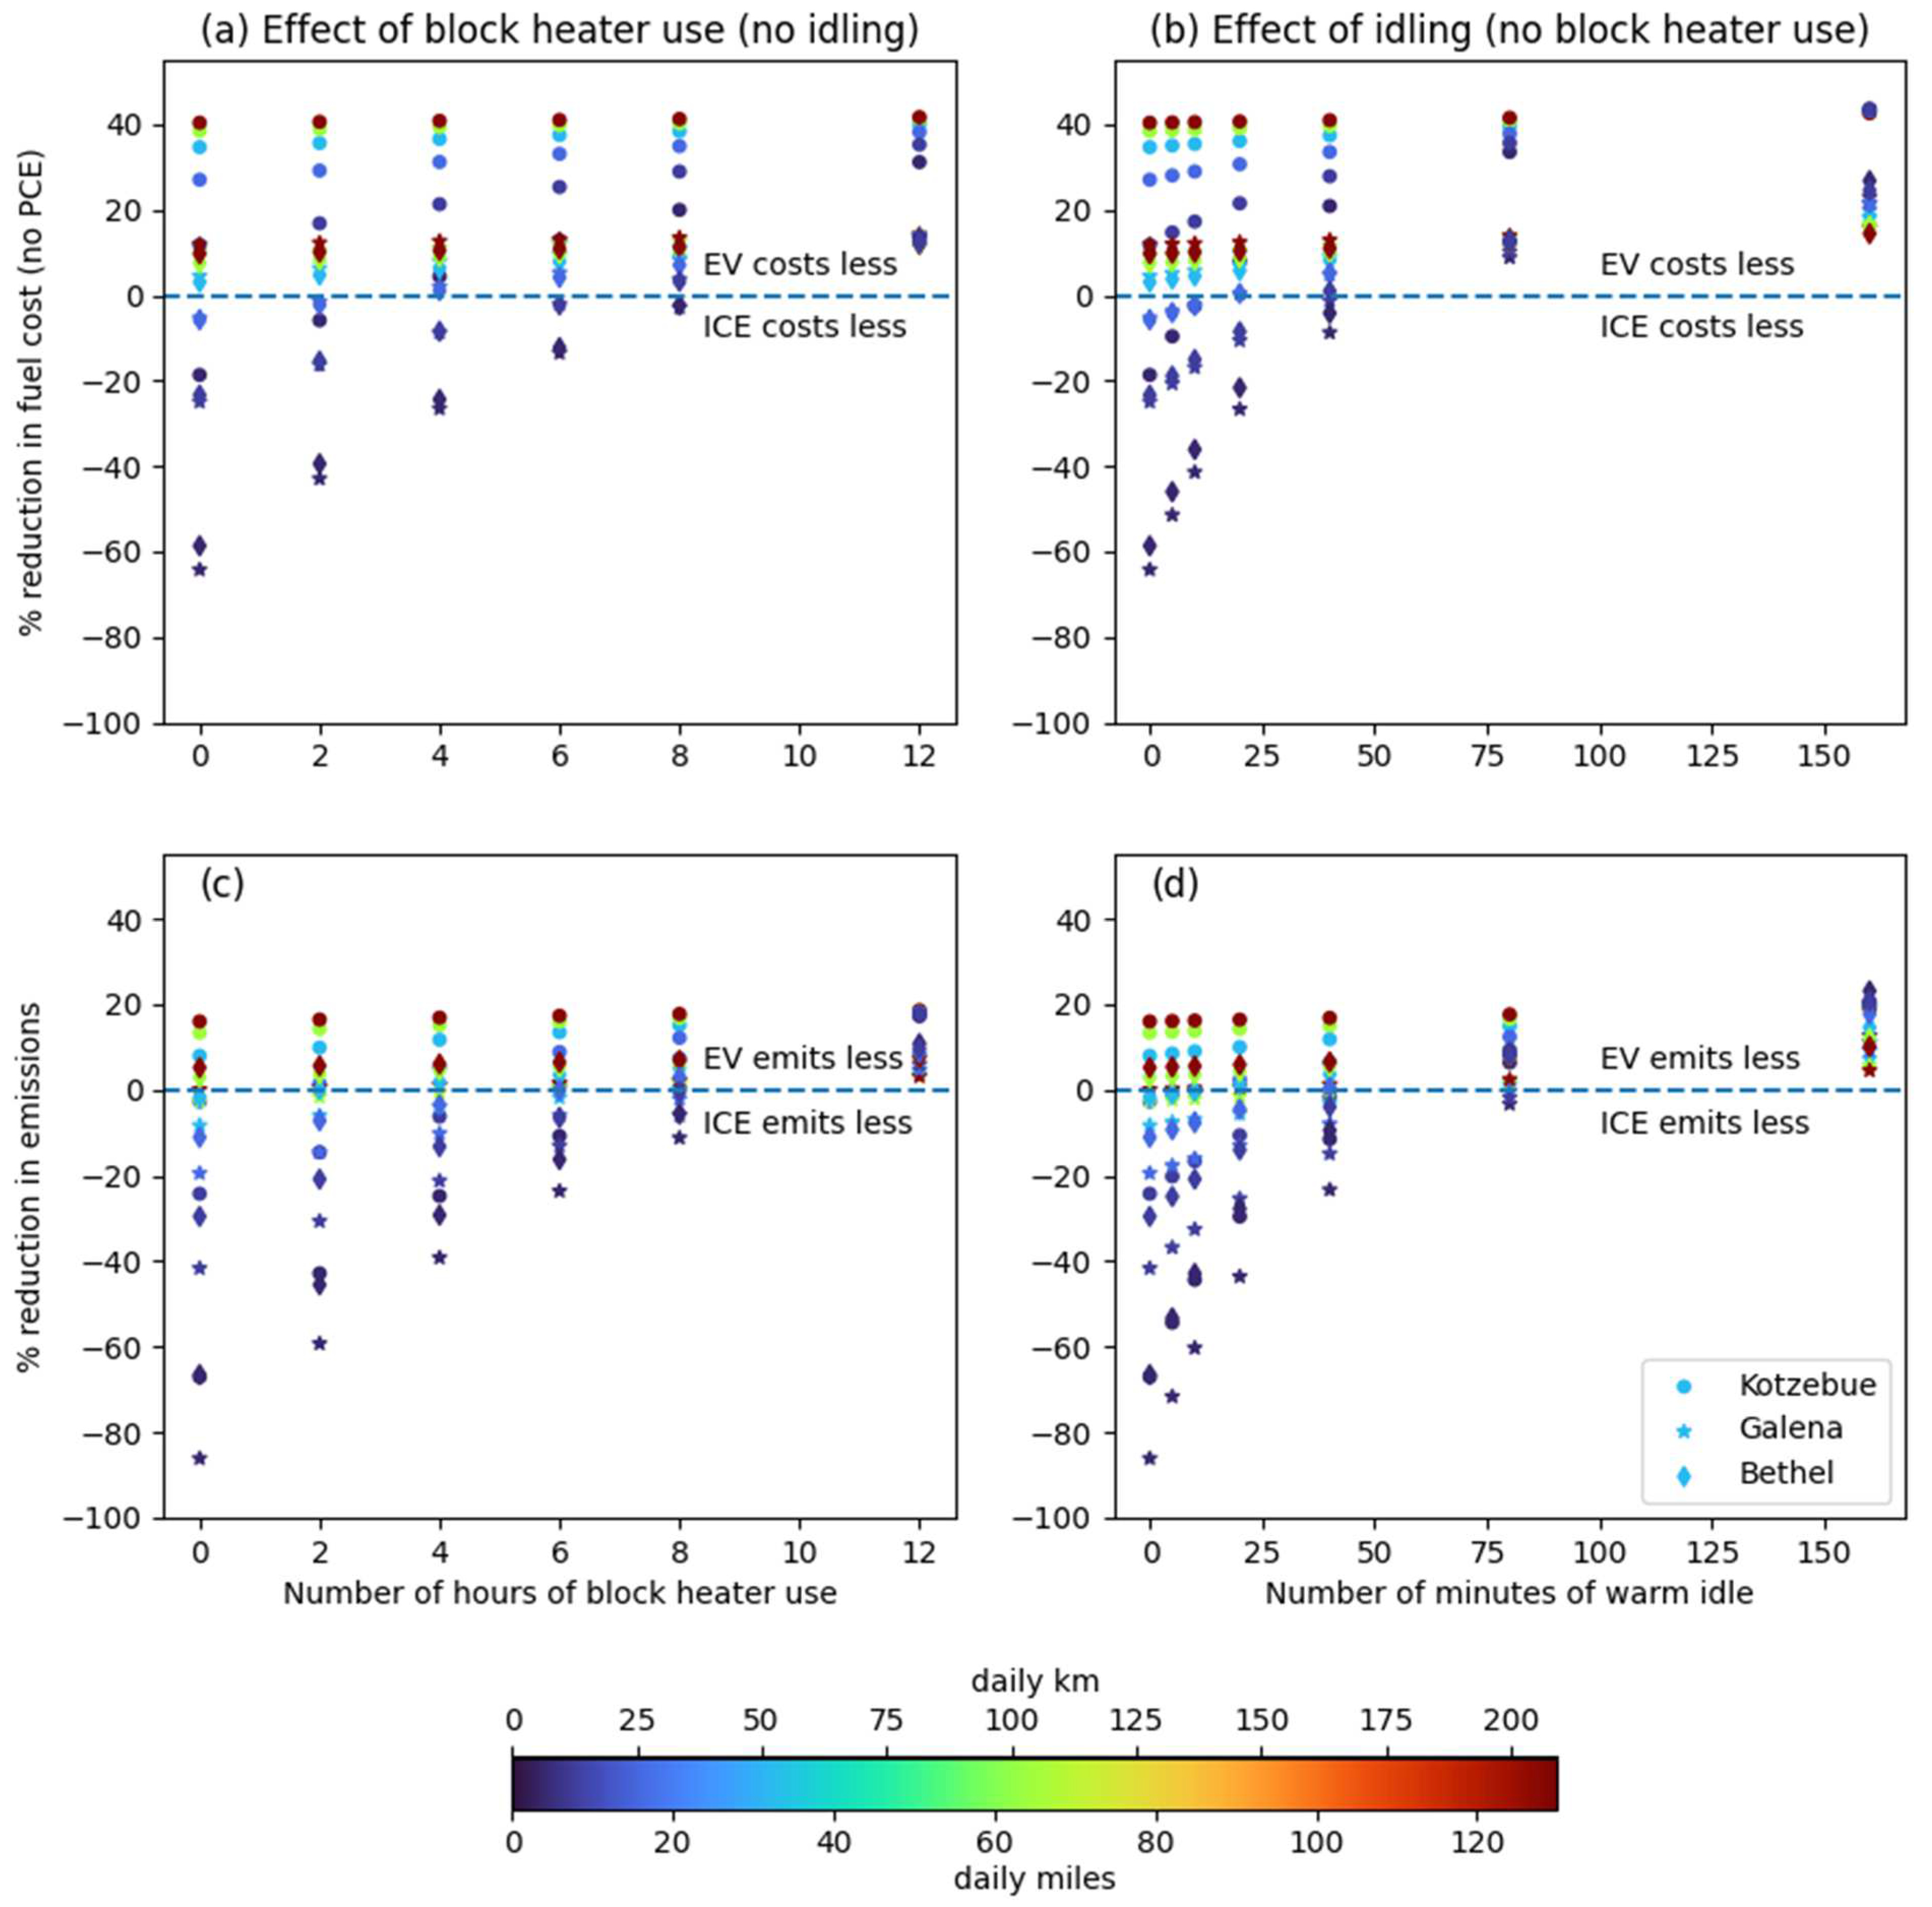
Figure 6.
Reductions in truck net fueling cost (a,b) and net emissions (c,d) from a switch to EV by community, given daily duration of block heater use, daily duration of warm idling, and daily driving distance. Percent reduction is in comparison to the ICE case, where positive numbers (above the dashed line) indicate the EV is favorable to the ICE. Electric rates are not subsidized. Note: teardrop shapes are actually near overlaps of Kotzebue and Bethel results.
Assumptions associated with the daily duration of block heater use and the daily duration of warm idling in wintertime for ICE vehicles can have a significant effect on net reductions in fueling costs and emissions (Figure 6). The electric truck outperforms across all communities and daily distances if block heaters are on average plugged in for more than eight hours/day, leading to up to 40% in net fueling cost reductions (Figure 6a). The realized cost savings (at full electric rates) are higher the longer the ICE trucks are warm idling, achieving fueling cost net savings in all cases beyond 50 min per day (Figure 6b). For daily driving distances beyond 50 km/day (31 mi/day), the duration of daily warm idling does not change the fact that the electric truck outperforms the ICE truck on fueling costs (Figure 6b). This result is robust across all communities. For idling below 50 min/day with no block heater use for trucks operating in Galena and Bethel, ICE trucks are less costly for daily distances under 50 km (31 mi) (Figure 6b).
The changes in greenhouse gas emissions follow a similar pattern where electric trucks across all communities lead to reductions in greenhouse gas emissions of up to 20% for daily driving distances of more than 75 km (50 mi), block heater use beyond 8 h per day (Figure 6c), and idling times of more than 50 min per day (Figure 6d). The electric truck outperforms the ICE above 100 km/day (62 mi/day) in Bethel and Kotzebue, regardless of idling duration, leading to fewer greenhouse gas emissions than the ICE truck. Below this threshold, the opposite is observed across all communities if idling duration is less than 50 min/day. At idling durations above 80 min/day, the electric truck outperforms the ICE truck across all communities, regardless of daily driving distance (Figure 6d).
4. Discussion
This study contributes to a better understanding of the potential for EVs to reduce fueling costs and greenhouse gas emissions for residents in isolated microgrid communities of the Arctic that push the boundaries of EV operational conditions. In partnership with three Arctic communities through a high level of engagement, the study co-produced 21 use cases for transitioning to EVs that are relevant for local communities. The study extends existing analysis tools to determine the feasibility of EVs for off-road vehicles [3] and accounts for the often-ignored electric energy requirements of ICE vehicles operating in extremely cold conditions. These modifications allowed for a comprehensive analysis of the magnitude and direction of energy, cost, and emissions savings related to a switch to EVs.
Many communities in high latitudes of North America remain dependent on the harvesting of wild foods, relying on off-road vehicles such as ATVs and snowmobiles that, due to their small market share, are undergoing a slower transition to electric. This analysis enables these communities to follow data-driven energy transitions and decarbonization that also support fate control over energy production at the local scale [47]. Given the potential for large-scale modernization of U.S. infrastructure and decarbonization of the U.S. energy sector [48], this project assists underserved Indigenous communities to have data and information necessary to achieve just, equitable, and sustainable energy systems of their own [49].
Following past research indicating smaller emission benefits for EVs operating in cold climates [8], this study hypothesized that switching to EVs in the Arctic’s isolated microgrid communities would lead to increased net greenhouse gas emissions. However, our findings suggest a nuanced opposite, with net benefits largely related to vehicle type and driving distances.
When driving any vehicle in extreme cold, a sizable amount of energy is needed to maintain the vehicle’s operability and occupant comfort, energy consumption that has not been accounted for in previous studies [8]. This energy use for ICE vehicles is made up of electricity used for block, oil pan, and battery heaters to keep components warm and operable, and fuel for the engine during parked idling to warm up or keep the engine block and cabin of the vehicle warm. Similarly, EVs require additional energy to keep the cabin comfortable and the battery’s thermal management system operating. Thus, comparing total energy use between ICE and EVs requires accounting for this nuanced energy consumption to correctly assess the relative magnitude and direction of energy, cost, and emissions savings related to a transition to EVs.
Because EVs do not have a large source of waste heat for heating the cabin like ICE vehicles do, the energy required for driving an EV is much more temperature-dependent. This requirement introduces variations in relative cost and emissions between use cases (Table 3 and Table S1). In contrast to our hypothesis, EVs outperformed ICE vehicles in most use cases because of the reported extensive use of engine block heating and idling with existing ICE vehicles in partner communities. In only four of the 21 EV use cases, net fueling costs increased with a switch to EV, mainly in communities with less renewable energy and consequently higher electric rates (not subsidized rate), and for vehicles with short daily driving distances, low block heater use, and short warm idling. Consequently, commercial businesses, who do not qualify for subsidized electric rates, and households who would exceed their subsidized electricity allotment by adding an EV, would not be able to realize net benefits in these use cases.
Among all vehicle types analyzed, ATVs showed the most robust net benefits across all communities (Figure 5). Other vehicle types most likely to have both cost and emission benefits from a switch to an EV are those used daily for more than 48 km (30 mi), have block heaters plugged in without timers when ambient temperatures are below −7 °C/20 °F, and warm idle for more than an hour on cold days. Reductions in net fueling costs are most likely realized in communities with relatively low electricity rates to retail gasoline price ratios and through subsidized electric rates (Table 3 and Figure 6).
High distance use cases such as delivery or taxi services are the most promising for switching to EVs. Many delivery and taxi drivers this study interviewed reported 12 to 17 h of daily vehicle operation with extended warm idling when not driving. In some instances, taxi drivers share vehicles, leading to 24 h of continuous use per vehicle. Since the 21 use cases analyzed in this study did not contain such extreme use, we expect the potential net benefits to exceed the reductions in fueling costs and emissions calculated in Use Cases 4 and 5 in Table 3. On the coldest day of the year, the standard listed range for suitable EVs would need to be at least 800 km (500 mi) to enable continuous operation for 24 h or charging infrastructure would need to be sufficient to allow for EV charging during periods of idling and waiting.
Contrary to high distance, low distance use cases can lead to emission increases, given existing renewable energy portfolios (Table 1), especially if they are combined with little to no block heater use and idling time. For example, driving distances of less than ca. 16 km (10 mi) per day for trucks with little to no block heater use, cars with no block heater use, or snowmobiles, were associated with higher energy use and thus higher emissions compared to their ICE equivalents (Table 3). For EV cars and trucks, at such low daily driving distances, the battery’s thermal management system and the reduced driving efficiency in cold temperatures will end up consuming marginally more energy compared to their ICE equivalents, given the ICE equivalents consume little additional electricity for block heaters. For snowmobiles, the result is similar due to their battery thermal management system, even though no block heaters are used for snowmobiles.
Given the above stated energy requirements, EVs’ automatic battery thermal management systems may allow for less user flexibility and may actually lead to higher fueling costs and emissions in certain boundary cases. For example, the user of an ICE vehicle has a lot of choice about when and how to use energy to keep their car operable. An EV user usually has little choice in how the car maintains its battery health. This is probably wise given the potential for damage to a too-cold battery and the expense of fixing this damage, but it means that the EV may not be able to be as energy-efficient as the ICE vehicle. For instance, with some care given to the starter battery and perhaps some other components like seals, an ICE vehicle may be parked and unused for the winter using no energy at all. In contrast, EVs currently available on the market will continue to use energy while parked in the cold to maintain battery health.
While this study showed that under PCE-subsidized electricity rates (applicable up to 750 kWh/month), all use cases result in a net reduction in fueling costs when switching to EVs (Table 3) [32], realistically not all use cases will be subject to the subsidized rate. Commercial customers, including schools, are subject to the full, unsubsidized rate. Households with above-average monthly electricity consumption, which ranges between 253 and 376 kWh/month across partner communities (Table 1), will also incur the unsubsidized rate for at least some charging. Since the average household consumes electricity below the 750 kWh cap [32], this leaves average households in each community between 374 and 497 kWh/month in electricity at the subsidized rate. Peak electricity consumption for an electric truck in winter (~300 kWh in January) used for commuting 6 km (4 mi/day) would still fall within the subsidized rate structure (Figure 3a). More energy-efficient vehicles such as electric ATVs would even be more cost-efficient at less than 100 kWh per month (Figure 4c).
Lastly, ICE vehicles chosen for comparison to EVs may not have always closely resembled the ICE vehicles that might actually be replaced. While the ICE rated mi per gallon (mpg) default used (Table 2) is for a new model vehicle that is the closest available correlate with the default EV (e.g., a gasoline Ford F150 pickup and a F150 Lightning electric pickup), this may be a more appropriate comparison for fleet or end-of-life vehicle transitions than a mid-life vehicle transition. Many vehicles that could be swapped for an EV may be older or otherwise less fuel-efficient than the comparison vehicle used. In this case, the calculated net benefits are underestimated and likely higher as new vehicles would replace old ones. On the contrary, the calculated net benefits may have been overestimated for those taxi and food delivery businesses who already use non-plug-in hybrids due to their fuel savings, when our analysis assumed less fuel-efficient ICE vehicles (compared to hybrids) to be in use. Similarly, our decision to simplify vehicle classes and combine SUVs with trucks may not be applicable in all cases. For example, there is a wide range of SUVs, some with characteristics closer to cars.
4.1. Policy Implications
High distance use cases such as delivery or taxi services would benefit from expansion of charging infrastructure to overcome range limitations, as mentioned earlier. Fast charging capabilities or ubiquitous Level 2 (240 V, approximately 10 kW) charging stations would allow plugging in during frequent idling and waiting. Any charging infrastructure would need to account for the potentially slower charging speeds in extreme cold temperatures [50], a criterion emphasized by taxi drivers who reported that charging should take no longer than half an hour. Investments into charging stations often have high infrastructure costs that are only covered once EV adoption rates increase to sufficient levels. High investment costs are particularly challenging for Arctic communities with small populations. Thus, broad EV adoption to cover these investment costs is critical. Incentivizing the switch to EVs can play an important role in overcoming economies of scale in small Arctic communities. Adapting electric rate structures to facilitate specific rates for EV charging can contribute to increased EV adoption rates necessary to cover the initial investments.
Other policy solutions include EV sharing fleets (cars or ATVs) that would allow residents to rent or borrow an EV throughout the day, eliminating short distance use cases. In addition, EV sharing fleets provide residents with low-risk options for testing the new technology without the risk of high upfront costs, further promoting trust building and increased EV adoption. The fleets could be owned by electric utilities and made available to utility customers for an additional fee. Electric utilities could incentivize EV charging, during times of excess variable renewable power that otherwise would need to be curtailed to retain grid stability. Such power generation scenarios create potentially negative rates for utilities and underline the value of energy storage and dispatchable loads for enhanced grid stability while at the same time providing consumer incentives at almost no cost to the utility.
Lastly, the increased emissions related to low distance EV use cases can be eliminated by adding more renewable energy sources such as wind and solar to local electrical grids. The location-specific use cases are driven by the location-specific renewable energy portfolios and costs.
4.2. Model Assumptions, Limitations, and Future Research
For validating use case assumptions, the academic researchers followed up with communities in the fall of 2022 and spring of 2023 to present the developed 21 EV use cases and modeling results. Community partners helped by verifying distances, block heater use, and annual seasonal use of snowmobiles. Community feedback indicates that model inputs were generally realistic and analysis results valid. Daily driving distances were within the expected range corresponding with the length of the built environment around communities. Kotzebue is approximately 2 km (1 mi) on its long axis, with Bethel and Galena approximately 10 and 13 km (6 and 8 mi), respectively. Some on-road activities, such as joyriding, more closely track the reported road distances in Table 1, while residents with ATVs and snowmobiles can travel off the limited road system and do so for entertainment and/or subsistence activities. Current subsistence by snowmobile in Galena is reported to be rare, with only a few trappers and hunters active in the winter. Traveling round-trip to camp or one-way to another community by snowmobile could exceed 100 mi. This use case was not considered because workshop participants did not consider it an EV use case.
Assumptions on the use of ICE block heaters are nuanced. Assuming 12 h without the use of a timer is reported to be valid, however the temperature at which most people plug in is likely to be 5 °C colder than assumed in the model. Applying this lower temperature threshold for block heater use in the model results in reduced net benefits of up to 15% in costs and 16% in emissions. In Use Cases 14, 16, and 19, all cases of a car or truck being driven 20 mi/day or less in Galena with 5 min of idling and overnight block heater use, the above calculated net emission reductions would be more than offset by the lower block heater plug-in temperature threshold, leading to a net emissions gain from switching to an EV.
In addition, assumptions about ICE vehicle efficiencies were validated by community partners who shared experiences with vehicles they own and operate. For example, an ICE truck (Toyota Tundra) operating in Kotzebue has an annual average fuel efficiency between 7 and 10 mi per gallon. Using the published fuel efficiency of 15 mi per gallon for a 2021 V8 Tundra [51] as the input for the fuel efficiency of a comparison truck for Use Case 4 in Table 3, the model calculated the annual average fuel efficiency to equal 7.5 mpg, consistent with community partner observation.
The known limitations of this study include a lack of published data on snowmachine and ATV energy use [17]. Future research is needed to collect more data on actual vehicle use for ICEs and EVs in the off-road vehicle class. In addition, more data on the energy use by electric cars and trucks in isolated microgrid communities are needed to further reduce uncertainty in model assumptions. For example, ATVs are a diverse group of vehicles, with popular choices in rural communities including multi-passenger UTVs (or ‘side-by-sides’). UTVs are larger and heavier than ATVs and come with optional cabin heating features, resulting in more energy use. It is important to state that warm idle energy use was not modeled for ATVs and snowmobiles in this study. Thus, this study did not analyze energy use by UTVs that can include heated cabins or as the case with ATVs and snowmobiles, can have heated grips and seats. This limitation results in more energy use than was modeled in use cases involving these vehicles. While all vehicles may be left with engines idling while at a stop in extreme cold to maintain their ability to start, UTVs with heated cabins are more likely to be used like cars and kept idling to keep the cabin warm at a stop.
Future research is needed to collect data through household surveys and vehicle dataloggers, for example, to better understand use patterns of vehicles and electric loads. More data is needed from EVs in extreme cold, including from off-road vehicles, to extend the knowledge of real-world energy use for more types of EVs. These empirical data can then be used to estimate impacts to the microgrid, better assess EV performance, and investigate effects on households and emissions.
4.3. Approach
The process used to develop the EV use cases is closely aligned with participatory technology development, known to increase technology adoption and lead to more user-relevant research outcomes [52]. The co-production approach also resulted in a balanced set of use cases with particular attention to covering the full potential range of daily distances driven and available vehicle types across the three partner communities.
For this study, researchers and community members have worked to respond to and engage with each other from problem definition to analysis and communication in a manner centering reciprocity and equity. Research team members bring the expertise of their respective disciplines and community members bring local knowledge and expertise in finding solutions for communities that can fully take advantage of new technology. Collectively, this two-way approach brings together interactional expertise [53] that is the foundation for knowledge co-production. This study’s academic researchers acknowledge that while actively learning to apply co-production principles, the fundamental inequities within the research process remain addressed incompletely and remain centered on Western world-views (see Ellam Yua, 2022 for important dialog on this [12]). For instance, while ideally the project is equally responsive to direction from community partners, project and community meetings were led by members of the research team.
5. Conclusions
The main factors resulting in EVs reducing emissions and fueling costs for residents in isolated microgrid communities in the Arctic are related to daily driving distances of more than 16 km (10 mi), more than five hours of block heater use, and at least 30 min of daily idling. In addition, the results are also sensitive to renewable energy portfolios and rate structures. Higher renewable energy penetration in local microgrids and incentivized lower EV charging rates can lead to emission reductions and fueling cost savings for use cases below the mentioned thresholds that would otherwise result in higher emissions and fueling costs for EV consumers.
For isolated microgrid communities in the Arctic to overcome the combined challenges of cold weather, unconventional vehicle types and use cases, and low cash incomes, it is likely that innovations in vehicles, power systems, and incentives will be needed to enable Arctic communities to fully and equitably participate in the transition to electrified transportation. Managed or incentivized charging that allowed vehicles to charge during periods of otherwise curtailed renewable energy production could help provide greater cost and emissions benefits. Novel electrification strategies, such as battery swapping and alternative ownership models, could be beneficial.
Supplementary Materials
The following supporting information can be downloaded at: https://www.mdpi.com/article/10.3390/wevj16030128/s1, Table S1: Full Use Case Results.
Author Contributions
Conceptualization, M.W., J.I.S., T.S. and M.B.; methodology, M.W.; software, M.W.; validation, T.B., M.B., J.G., T.A. and L.A.; formal analysis, M.W. and T.S.; investigation, M.W. and J.I.S.; data curation, J.I.S.; writing—original draft preparation, M.W. and T.S.; writing—review and editing, J.S, T.B., M.B., J.G., T.A. and L.A.; funding acquisition, M.W., J.I.S. and T.S. All authors have read and agreed to the published version of the manuscript.
Funding
This research was funded by the National Science Foundation, grant numbers 2127171, 2127172, 2318384 and 2318385.
Institutional Review Board Statement
The study was conducted in accordance with the Declaration of Helsinki, and approved by the Institutional Review Board of the University of Alaska Anchorage under IRBnet project 1780088 approved 28 January 2022.
Informed Consent Statement
Informed consent was obtained from all subjects involved in this study.
Data Availability Statement
The de-identified original contributions presented in this study are included in the Supplementary Materials. Further inquiries can be directed to the corresponding author.
Acknowledgments
This study would not have been possible without the community participation in the three partner communities, including 25 workshop attendants and 20 organization leaders who shared their insights and knowledge of vehicle use with the research team. We thank these individuals for their time. We also thank Steve Colt and Shivani Bhagat for their review of an earlier version of this paper. We are grateful for Brooke Sanderson, Tim Kalke and Chad Nordlum, who helped with data collection and study implementation and shared their local expertise on rural communities’ vehicle use.
Conflicts of Interest
Matt Bergan and Tom Atkinson are employees of Kotzebue Electric Association, Kotzebue, USA. The remaining authors declare that the research was conducted in the absence of any commercial or financial relationships that could be construed as a potential conflict of interest.
Appendix A
The use of miles has been retained for reporting co-produced distances in use cases to make this work most accessible to community partners and relevant policy makers. The conversion to km can easily be made by multiplying by 1.6.
Table A1.
Use cases collected through structured interviews. Similar cases, or responses with incomplete information, are combined into a modeled use case as indicated in the last column.
Table A1.
Use cases collected through structured interviews. Similar cases, or responses with incomplete information, are combined into a modeled use case as indicated in the last column.
| Interview Responses | |||||
|---|---|---|---|---|---|
| Community | Vehicle | Mi Driven | Block Heater Use—h/Day | Idling Time, Minutes | Case # Table 3 |
| Kotzebue | 3 trucks, 1 SUV | Used for errands in town | No timer | 30 | 1 |
| Kotzebue | Trucks/Vans | No timer | 45 | 1 | |
| Kotzebue | Trucks | No timer | “A lot” | 1 | |
| Kotzebue | Trucks | No timer | May be left running or in warm space below 0F | 1 | |
| Kotzebue | 25–30 vehicles, mostly trucks | Longest one way is 5 mi | Overnight (No timer) | 15–30 | 1 |
| Kotzebue | 3 Trucks | No timer | 1 | ||
| Kotzebue | 2 Trucks, 2 SUVs—all 4WD | “Not a lot—sold one truck with 10,000 in 15 yrs” | Timer on at 6 a.m. | 10–30 | 2 |
| Kotzebue | 2 Trucks, I SUV | Sometimes plugged in | 1, 2 | ||
| Kotzebue + nearby communities | ~70 vehicles of all types | 3000–4000/yr in Kotzebue | Some 4 h, some not controlled | 15–20 | 3 |
| Kotzebue | Food delivery car | 3000–4000/yr | 3 | ||
| Kotzebue | food delivery car | 30–40+ mi each for 2 daily shifts. 12–15 h of operation/day except Sunday | 0 | Idles whenever not driving | 4 |
| Kotzebue | SUV taxi | Uses 5 g/day in hybrid SUV, 17 h days. | 0 | Idles whenever not driving | 5 |
| Bethel | trucks/SUVs | Approx. 1000/yr | 5 | 0 | 8 |
| Bethel | Approx. 7 trucks | 3000/yr | Used without controls | Up to 60 | 9 |
| Bethel | trucks | Up to ~7 mi one way | 0–1.5 | 15–30 | 10 |
| Bethel | Trucks and SUVs | 8000 mi in 2.5 yrs | 0 | 20 | 10 |
| Bethel | car | 12/day, 15/day on weekends | 12 | 20 | 11 |
| Bethel | SUV Taxi | 200,000 in 2 years | 0 | Idling whenever not driving during 17 h day | 12 |
| Galena | 8 Trucks | Up to 20/day | No controls, battery blanket + block heater | 5 | 16 |
| Galena | 10–12 Trucks | 200/week | No controls, battery blanket + oil pan and block heater | 240 | 17 |
Table A2.
Use records collected through dot exercise during community workshops.
Table A2.
Use records collected through dot exercise during community workshops.
| Participants Considering EV for Use Case | |||||||
|---|---|---|---|---|---|---|---|
| Use Record | Community | Use | Vehicle | Willing, n | Maybe Willing, n | Not Willing, n | Frequency of Use |
| 1 | Bethel | College/ School/Trade | SUV | 2 | Multi Day | ||
| 2 | Bethel | Commute | Car | 1 | Occasionally | ||
| 3 | Bethel | Commute | SUV | 3 | Multi Day | ||
| 4 | Bethel | Commute | Truck | 1 | Multi Day | ||
| 5 | Bethel | Deliver Food | Heavy Truck | 1 | Daily | ||
| 6 | Bethel | Subsistence | Boat | 2 | Occasionally | ||
| 7 | Bethel | Joy Ride | Snowmachine | 1 | Occasionally | ||
| 8 | Bethel | Car | 1 | Daily | |||
| 9 | Bethel | City Bus | 1 | Few times a week | |||
| 10 | Bethel | SUV | 1 | Multi Day | |||
| 11 | Bethel | SUV | 1 | Few times a week | |||
| 12 | Bethel | Truck | 1 | Few times a week | |||
| 13 | Bethel | Search and Rescue | ATV/UTV | 1 | Multi Day | ||
| 14 | Bethel | Search and Rescue | ATV/UTV | 1 | Few times a week | ||
| 15 | Bethel | Search and Rescue | Boat | 1 | Multi Day | ||
| 16 | Bethel | Search and Rescue | Snowmachine | 1 | Multi Day | ||
| 17 | Bethel | Search and Rescue | SUV | 1 | Multi Day | ||
| 18 | Bethel | Store | Airplane | 1 | Few times a week | ||
| 19 | Bethel | Store | City Bus | 1 | Few times a week | ||
| 20 | Bethel | Store | SUV | 2 | Few times a week | ||
| 21 | Bethel | Store | Truck | 1 | Few times a week | ||
| 22 | Bethel | Transport people/Airport | Bike | 1 | Multi Day | ||
| 23 | Bethel | Transport people/Airport | SUV | 1 | Daily | ||
| 24 | Bethel | Transport people/Airport | SUV | 1 | Few times a week | ||
| 25 | Bethel | Transport people/Airport | Truck | 1 | Occasionally | ||
| 26 | Galena | Boat launch | Truck | 2 | Occasionally | ||
| 27 | Galena | Commute | ATV/UTV | 4 | Multi Day | ||
| 28 | Galena | Commute | Bike | 2 | Daily | ||
| 29 | Galena | Commute | Car | 1 | Multi Day | ||
| 30 | Galena | Commute | Car | 1 | Daily | ||
| 31 | Galena | Commute | Snowmachine | 1 | Multi Day | ||
| 32 | Galena | Commute | Snowmachine | 1 | 1 | Daily | |
| 33 | Galena | Commute | Truck | 2 | Multi Day | ||
| 34 | Galena | Commute | Truck | 2 | Daily | ||
| 35 | Galena | Errands | Car | 1 | Few times a week | ||
| 36 | Galena | Errands | Car | 2 | Occasionally | ||
| 37 | Galena | Errands | Truck | 1 | Multi Day | ||
| 38 | Galena | Errands | Truck | 3 | Few times a week | ||
| 39 | Galena | Hauling stuff | Truck | 2 | Multi Day | ||
| 40 | Galena | Hauling stuff | Truck | 1 | Few times a week | ||
| 41 | Galena | Joy Ride | Car | 1 | Few times a week | ||
| 42 | Galena | Store | ATV/UTV | 1 | Occasionally | ||
| 43 | Galena | Subsistence | Boat | 2 | Daily | ||
| 44 | Galena | Subsistence | Boat | 1 | Few times a week | ||
| 45 | Galena | Subsistence | Boat | 5 | Occasionally | ||
| 46 | Galena | Subsistence | Snowmachine | 3 | 2 | Multi Day | |
| 47 | Galena | Going to village | Boat | 1 | Occasionally | ||
| 48 | Kotzebue | Beach BBQ | ATV/UTV | 1 | Few times a week | ||
| 49 | Kotzebue | Beach BBQ | Truck | 1 | Multi Day | ||
| 50 | Kotzebue | Commute | Car | 1 | Occasionally | ||
| 51 | Kotzebue | Commute | ATV/UTV | 1 | Multi Day | ||
| 52 | Kotzebue | Commute | Truck | 1 | 2 | 1 | Multi Day |
| 53 | Kotzebue | Errands | Car | 1 | 1 | Few times a week | |
| 54 | Kotzebue | Errands | ATV/UTV | 2 | Occasionally | ||
| 55 | Kotzebue | Errands | Snowmachine | 1 | Multi Day | ||
| 56 | Kotzebue | Errands | Truck | 1 | Occasionally | ||
| 57 | Kotzebue | Going to village | Boat | 1 | Occasionally | ||
| 58 | Kotzebue | Hauling stuff | Truck | 1 | Multi Day | ||
| 59 | Kotzebue | Joy Ride | Boat | 1 | Occasionally | ||
| 60 | Kotzebue | Joy Ride | ATV/UTV | 1 | Multi Day | ||
| 61 | Kotzebue | Joy Ride | ATV/UTV | 1 | Daily | ||
| 62 | Kotzebue | Joy Ride | ATV/UTV | 1 | Occasionally | ||
| 63 | Kotzebue | Joy Ride | Snowmachine | 1 | Multi Day | ||
| 64 | Kotzebue | Joy Ride | Snowmachine | 1 | Few times a week | ||
| 65 | Kotzebue | Joy Ride | Snowmachine | 1 | 2 | Occasionally | |
| 66 | Kotzebue | Joy Ride | Truck | 1 | Occasionally | ||
| 67 | Kotzebue | Subsistence | Boat | 1 | Multi Day | ||
| 68 | Kotzebue | Subsistence | ATV/UTV | 1 | Multi Day | ||
| 69 | Kotzebue | Subsistence | ATV/UTV | 1 | 1 | Occasionally | |
| 70 | Kotzebue | Subsistence | Snowmachine | 1 | 1 | Occasionally | |
| 71 | Kotzebue | Trail Staking | Car | 1 | Multi Day | ||
Table A3.
Use cases formed by combining use records from Table A2 and then compared to use cases collected through interviews (Table A1) to form a unique set of use cases. Note that only use records where workshop participants indicated a willingness to switch to EVs are included.
| Table A2 Use Records Combined into Use Case | Community | Distance, Mi | Vehicle | Frequency of Use | Use Case # in Table 3 |
|---|---|---|---|---|---|
| 60 | Kotzebue | Joy Ride—28 | ATV/UTV | Multi Day | Case 6 |
| 63 | Kotzebue | Joy Ride—28 | Snowmachine | Multi Day | Case 7 |
| 8 | Bethel | Mail—4 | Car | Daily | Case 13 |
| 33, 34 * | Galena | Commute—7 | Truck | Multi Day | Case 14 |
| 37,39 | Galena | Errands—8 | Truck | Multi Day | Case 15 |
| 27 | Galena | Commute—7 | ATV/UTV | Multi Day | Case 18 |
| 29, 30 * | Galena | Commute—7 | Car | Multi Day | Case 19 |
| 31, 32 * | Galena | Commute—7 | Snowmachine | Multi Day | Case 20 |
| 46 | Galena | Subsistence—30 | Snowmachine | Multi Day | Case 21 |
| Use cases already covered by use cases listed in Table A1 | |||||
| 52 | Kotzebue | Commute—4 | Truck | Multi Day | Cases 1–2 |
| 23 | Bethel | Transport people/Airport—14 | SUV | Daily | Similar to case 10 |
| 1, 3, 4, 10 | Bethel | Commute—4—8 | Truck/SUV | Multi Day | Cases 8–9 |
* Use records differ in the reported frequency, one multi day and one daily.
References
- Hawkins, T.R.; Singh, B.; Majeau-Bettez, G.; Strømman, A.H. Comparative environmental life cycle assessment of conventional and electric vehicles: LCA of conventional and electric vehicles. J. Ind. Ecol. 2013, 17, 53–64. [Google Scholar] [CrossRef]
- Muratori, M.; Alexander, M.; Arent, D.; Bazilian, M.; Cazzola, P.; Dede, E.M.; Farrell, J.; Gearhart, C.; Greene, D.; Jenn, A.; et al. The rise of electric vehicles—2020 status and future expectations. Prog. Energy 2021, 3, 022002. [Google Scholar] [CrossRef]
- Wilber, M.M.; Schmidt, J.I. Knowledge is power: Electric vehicle calculator for cold climates. Fuel Commun. 2024, 20, 100124. [Google Scholar]
- Lindgren, J.; Lund, P.D. Effect of extreme temperatures on battery charging and performance of electric vehicles. J. Power Sources 2016, 328, 37–45. [Google Scholar]
- Tete, P.R.; Gupta, M.M.; Joshi, S.S. Developments in battery thermal management systems for electric vehicles: A technical review. J. Energy Storage 2021, 35, 102255. [Google Scholar]
- Wilber, M.M.; Whitney, E.; Leach, T.; Pike, C. Cold Weather Issues Electric Vehicles (EVs) Alaska; Alaska Center Energy & Power: Anchorage, AK, USA, 2021. [Google Scholar]
- Al-Wreikat, Y.; Serrano, C.; Sodré, J.R. Effects of ambient temperature and trip characteristics on the energy consumption of an electric vehicle. Energy 2022, 238, 122028. [Google Scholar]
- Yuksel, T.; Michalek, J.J. Effects of Regional Temperature on Electric Vehicle Efficiency, Range, and Emissions in the United States. Environ. Sci. Technol. 2015, 49, 3974–3980. [Google Scholar] [PubMed]
- Holdmann, G.P.; Wies, R.W.; Vandermeer, J.B. Renewable Energy Integration in Alaska’s Remote Islanded Microgrids: Economic Drivers, Technical Strategies, Technological Niche Development, and Policy Implications. Proc. IEEE 2019, 107, 1820–1837. [Google Scholar]
- Hamilton, J. Causes and Consequences of the Oil Shock of 2007–2008; National Bureau of Economic Research: Cambridge, MA, USA, 2009; p. w15002. [Google Scholar]
- Whitney, E.; Schnabel, W.E.; Aggarwal, S.; Huang, D.; Wies, R.W.; Karenzi, J.; Huntington, H.P.; Schmidt, J.I.; Dotson, A.D. MicroFEWs: A Food–Energy–Water Systems Approach to Renewable Energy Decisions in Islanded Microgrid Communities in Rural Alaska. Environ. Eng. Sci. 2019, 36, 843–849. [Google Scholar] [PubMed]
- Yua, E.; Raymond-Yakoubian, J.; Daniel, R.A.; Behe, C. A framework for co-production of knowledge in the context of Arctic research. Ecol. Soc. 2022, 27, 34. [Google Scholar]
- Brown, D.R.N.; Brinkman, T.J.; Neufeld, G.P.; Navarro, L.S.; Brown, C.L.; Cold, H.S.; Woods, B.L.; Ervin, B.L. Geospatial patterns and models of subsistence land use in rural Interior Alaska. Ecol. Soc. 2022, 27, 23. [Google Scholar] [CrossRef]
- Kruse, J. The Subsistence Lifestyle in Alaska Now and in the Future; University of Alaska Fairbanks School of Agricultural and Land Resources Management: Fairbanks, AK, USA, 1979. [Google Scholar]
- Schroeder, R.F.; Andersen, D.B.; Bosworth, R.; Morris, J.M.; Writh, J.M. Subsistence Alaska: Arctic, Interior, Southcentral, Southwest, Western Regional Summaries; Alaska Department of Fish and Game, Division of Subsistence: Juneau, AK, USA, 1987. [Google Scholar]
- Brinkman, T.; Maracle, K.B.; Kelly, J.; Vandyke, M.; Firmin, A.; Springsteen, A. Impact of fuel costs on high-latitude subsistence activities. Ecol. Soc. 2014, 19, 18. [Google Scholar]
- Schwoerer, T.; Schmidt, J.I.; Holen, D. Predicting the Food-Energy Nexus of Wild Food Systems: Informing Energy Transitions for Isolated Indigenous Communities. Ecol. Econ. 2020, 176, 106712. [Google Scholar]
- Colt, S.; Schwoerer, T. The Alaska Village Energy Model: An Integrated Community Energy Planning Tool; University of Alaska Anchorage Institute of Social and Economic Research: Anchorage, AK, USA, 2013. [Google Scholar]
- Wang, N.; Tang, L.; Pan, H. A global comparison and assessment of incentive policy on electric vehicle promotion. Sustain. Cities Soc. 2019, 44, 597–603. [Google Scholar] [CrossRef]
- Liu, X.; Sun, X.; Zheng, H.; Huang, D. Do policy incentives drive electric vehicle adoption? Evidence from China. Transp. Res. Part A Policy Pract. 2021, 150, 49–62. [Google Scholar] [CrossRef]
- Chandra, M. Investigating the impact of policies, socio-demography and national commitments on electric-vehicle demand: Cross-country study. J. Transp. Geogr. 2022, 103, 103410. [Google Scholar] [CrossRef]
- Kester, J.; Noel, L.; de Rubens, G.Z.; Sovacool, B.K. Policy mechanisms to accelerate electric vehicle adoption: A qualitative review from the Nordic region. Renew. Sustain. Energy Rev. 2018, 94, 719–731. [Google Scholar]
- Yang, A.; Liu, C.; Yang, D.; Lu, C. Electric vehicle adoption in a mature market: A case study of Norway. J. Transp. Geogr. 2023, 106, 103489. [Google Scholar]
- Howarth, C.; Monasterolo, I. Opportunities for knowledge co-production across the energy-food-water nexus: Making interdisciplinary approaches work for better climate decision making. Environ. Sci. Policy 2017, 75, 103–110. [Google Scholar]
- Holdmann, G.; Poelzer, G. Pan-Arctic Circumpolar Off-Grid Settlements; University of Alaska Fairbanks; Alaska Center for Energy and Power; University of Saskatchewan: Fairbanks, AK, USA, 2016. [Google Scholar]
- AEA; REAP. Renewable Energy Atlas of Alaska: A Guide to Alaska’s Clean, Local, and Inexhaustible Energy Resources; Alaska Energy Authority and Renewable Energy Alaska Project: Juneau, AK, USA, 2019. [Google Scholar]
- Alaska Energy Authority. 2010 Power Cost Equalization Program Report; Alaska Energy Authority: Anchorage, AK, USA, 2010. [Google Scholar]
- Census Bureau, U.S. American Community Survey 2021 5-Year Estimates. United States Census Bureau; 2021. Available online: https://data.census.gov/table/ACSST5Y2018.S0101?q=Alaska+age+distribution (accessed on 14 November 2023).
- ADF&G. Alaska Department of Fish and Game (ADF&G), Subsistence, Community Subsistence Information System. 2024. Available online: https://www.adfg.alaska.gov/sb/CSIS/index.cfm?ADFG=main.home (accessed on 24 September 2024).
- Alaska Climate Research Center. Temperature Normals—Alaska Climate Research Center. Alaska Climate Research Center—The Alaska State Climate Center. 2024. Available online: https://akclimate.org/data/air-temperature-normals/ (accessed on 16 December 2024).
- Alaska Climate Research Center. Heating Degree Day Normals—Alaska Climate Research Center. Alaska Climate Research Center, The Alaska State Climate Center. 2024. Available online: https://akclimate.org/data/heating-degree-day-normals/ (accessed on 16 December 2024).
- AEA. Alaska Energy Authority—Power Cost Equalization Program. 2023. Available online: https://www.akenergyauthority.org/What-We-Do/Power-Cost-Equalization/PCE-Reports-Publications (accessed on 16 December 2024).
- Courtney. What Life Is Like Inside the Tiny Town in Alaska Where Almost Nobody Owns a Car. OnlyInYourState®. 23 March 2023. Available online: https://www.onlyinyourstate.com/trip-ideas/alaska/town-where-no-one-owns-cars-ak (accessed on 16 December 2024).
- Alaska Department of Law. Bethel—Living and Working in Bethel. 2024. Available online: https://law.alaska.gov/department/jobs/locations/Bethel.html (accessed on 16 December 2024).
- City of Kotzebue. City of Kotzebue Comprehensive Plan; City of Kotzebue: Kotzebue, AK, USA, 2013. [Google Scholar]
- Louden Tribal Council. Galena Community Plan 2023–2028; Louden Tribal Council: Galena, AK, USA, 2023. [Google Scholar]
- City of Galena. The City of Galena, Alaska. 2024. Available online: https://www.ci.galena.ak.us/ (accessed on 16 December 2024).
- Lajunen, A.; Yang, Y.; Emadi, A. Review of cabin thermal management for electrified passenger vehicles. IEEE Trans. Veh. Technol. 2020, 69, 6025–6040. [Google Scholar]
- Thompson, M. Best Electric ATVs for Adventure Seekers: Features and Performance. SigmaEarth. 18 December 2024. Available online: https://sigmaearth.com/best-electric-atvs-for-adventure-seekers-features-and-performance/ (accessed on 20 January 2024).
- Broudy, B. Electric Snowmobile Revolution: Taiga Nomad Review. GearJunkie. 13 May 2022. Available online: https://gearjunkie.com/motors/electric-snowmobile-taiga-nomad-review (accessed on 16 December 2024).
- Sports, P.G. How Much Fuel Does a Snowmobile Use? [Snowmobile MPG Chart] 17 August 2020. Available online: https://powersportsguide.com/snowmobile-fuel-consumption/ (accessed on 16 December 2024).
- Norström, A.V.; Cvitanovic, C.; Löf, M.F.; West, S.; Wyborn, C.; Balvanera, P.; Bednarek, A.T.; Bennett, E.M.; Biggs, R.; de Bremond, A.; et al. Principles for knowledge co-production in sustainability research. Nat. Sustain. 2020, 3, 182–190. [Google Scholar]
- van den Belt, M. Mediated Modeling—A Systems Dynamics Approach to Environmental Consensus Building; Island Press: London, UK, 2004. [Google Scholar]
- Voinov, A.; Jenni, K.; Gray, S.; Kolagani, N.; Glynn, P.D.; Bommel, P.; Prell, C.; Zellner, M.; Paolisso, M.; Jordan, R.; et al. Tools and methods in participatory modeling: Selecting the right tool for the job. Environ. Model. Softw. 2018, 109, 232–255. [Google Scholar]
- O’Fallon, L.R.; Dearry, A. Community-Based participatory research as a tool to advance environmental health sciences. Environ. Health Perspect. 2002, 110 (Suppl. S2), 155–159. [Google Scholar] [PubMed]
- Bartlett, C.; Marshall, M.; Marshall, A. Two-Eyed Seeing and other lessons learned within a co-learning journey of bringing together indigenous and mainstream knowledges and ways of knowing. J. Environ. Stud. Sci. 2012, 2, 331–340. [Google Scholar]
- Kuzemko, C. Re-Scaling IPE: Local government, sustainable energy and change. Rev. Int. Political Econ. 2019, 26, 80–103. [Google Scholar]
- NAS. Accelerating Decarbonization of the U.S. Energy System. National Academies of Sciences Engineering and Medicine. 2021. Available online: https://nap.nationalacademies.org/resource/25932/interactive/index.html#tech (accessed on 7 December 2024).
- Bridge, G.; Özkaynak, B.; Turhan, E. Energy infrastructure and the fate of the nation: Introduction to special issue. Energy Res. Soc. Sci. 2018, 41, 1–11. [Google Scholar]
- Motoaki, Y.; Yi, W.; Salisbury, S. Empirical analysis of electric vehicle fast charging under cold temperatures. Energy Policy 2018, 122, 162–168. [Google Scholar]
- USDOE; EPA. Fueleconomy.gov—The Official U.S. Government Source for Fuel Economy Information; 2023. Available online: https://www.fueleconomy.gov/ (accessed on 16 December 2024).
- Lucas-Healey, K.; Jones, L.; Sturmberg, B.C.P.; Ransan-Cooper, H. Participation and sensemaking in electric vehicle field trials: A study of fleet vehicle-to-grid in Australia. Energy Res. Soc. Sci. 2024, 107, 103343. [Google Scholar]
- Carolan, M.S. Sustainable agriculture, science and the co-production of ‘expert’ knowledge: The value of interactional expertise. Local Environ. 2006, 11, 421–431. [Google Scholar] [CrossRef]

Disclaimer/Publisher’s Note: The statements, opinions and data contained in all publications are solely those of the individual author(s) and contributor(s) and not of MDPI and/or the editor(s). MDPI and/or the editor(s) disclaim responsibility for any injury to people or property resulting from any ideas, methods, instructions or products referred to in the content. |
© 2025 by the authors. Published by MDPI on behalf of the World Electric Vehicle Association. Licensee MDPI, Basel, Switzerland. This article is an open access article distributed under the terms and conditions of the Creative Commons Attribution (CC BY) license (https://creativecommons.org/licenses/by/4.0/).