Article

Study on Long-Distance Electric Mobility on a Multinational Route

Department Transport, University of Ruse “Angel Kanchev”, 8 Studentska Str., 7017 Ruse, Bulgaria
*
Author to whom correspondence should be addressed.
World Electr. Veh. J. 2025, 16(4), 204; https://doi.org/10.3390/wevj16040204
Submission received: 13 February 2025 / Revised: 25 March 2025 / Accepted: 28 March 2025 / Published: 1 April 2025

Abstract

:
This study explores the challenges associated with long-distance travel exceeding 2000 km using an electric vehicle (EV) on a route spanning multiple countries, from Bulgaria to France. A dedicated research methodology was developed, selecting a specific route and EV for analysis. The findings indicate that the energy consumption along the entire route averaged approximately 0.18 kWh/km under a load of around 240 kg. Furthermore, the study identified key challenges faced by EV drivers, particularly in locating charging stations and securing electric energy supply. Based on the results, several recommendations are proposed to enhance charging infrastructure conditions and mitigate driver uncertainty.

1. Introduction

In contemporary society, individual mobility remains heavily dependent on internal combustion engine (ICE) vehicles, which significantly contribute to climate change. However, in recent years, one of the most transformative shifts in the mobility sector has been the growing integration of electric vehicles (EVs) into daily life. Market data and numerous studies indicate that the public acceptance of EVs will continue to rise [1].
Electric vehicles represent a promising technology for achieving a sustainable transport sector due to their near-zero carbon emissions, low noise levels, high efficiency, and operational flexibility, including grid integration capabilities [1,2,3,4,5]. Encouraging EV adoption aligns with the European Union’s ambition to become the first climate-neutral continent by 2050, necessitating ambitious transport-sector changes to achieve a 90% reduction in transport-related greenhouse gas emissions by 2050. While EV usage is already widespread in urban environments for short-distance commuting [3], their deployment for long-distance travel remains constrained by factors such as limited range per charge [1], prolonged battery charging times (30–40 min to reach 80% capacity), and inadequate charging infrastructure [6]. Cross-border travel with EVs presents additional complications, given the disparities in charging infrastructure across different countries.
Research in this field primarily focuses on two key areas: determining the power requirements of EVs—where models such as VSP [7] and VT-CPEM [8] are assessed using simulations and real-world data from vehicles like the Nissan Leaf [9]—and analyzing actual energy consumption and its forecasting under various conditions [10,11].
For instance, a study in Denmark analyzed data from over 230,000 EV trips using models like the Citroën C-Zero, Peugeot Ion, and Mitsubishi i-MiEV [10]. These trips were predominantly short-distance commutes, revealing an average energy consumption of 18.3 kWh/100 km and an optimal speed range of 52–60 km/h at an ambient temperature of 14 °C. Moreover, it was observed that winter energy consumption increased by 34% compared to summer, reaching 22.5 kWh/100 km [10]. Another study [11] confirmed that EVs are more energy-efficient in urban settings compared to highway driving. The studies were mainly conducted over short distances, but were conducted over a period of 5 months with a converted Nissan D21 electric vehicle and confirm the results obtained by other authors.
The present research builds upon these studies by conducting a real-world experiment to highlight key challenges in utilizing EVs for long-distance travel across multiple countries. The study also provides recommendations for policymakers in designing a more comprehensive European electric mobility system.
Through this study, the novelty that is proposed is related to the fact that, based on a real experiment, the main problems in the use of electric vehicles (EVs) for long-distance travel, passing through several countries, have been highlighted, and recommendations have been made to policymakers for future work in designing a comprehensive (broad) electric mobility system in Europe.

2. Literature Review

The existing literature contains multiple studies on long-distance EV travel, yet most are confined to single-country assessments. A simulation-based study along the Paris-Lyon highway (France) [12] yielded insights useful for vehicle manufacturers, policymakers, and charging infrastructure planners. According to the International Energy Agency (IEA) [13], current limitations in battery capacity and charging times remain the primary obstacles to long-distance EV travel. However, significant advancements in ultra-fast charging stations and battery technologies are anticipated over the next decade.
The issue of routing in electric vehicles, as discussed in [14], is regarded as one of the principal focal points of contemporary scientific research. Numerous studies closely examine the challenges associated with the adoption of electromobility. Particular attention is warranted for cross-border travel, as it entails a multitude of complexities, including disparities in charging infrastructure, standardization of charging protocols, variations in pricing models and payment methods, administrative and regulatory barriers, as well as constraints related to driving range and charging duration.
The distribution of charging stations for electric vehicles varies significantly across different countries. While nations such as Germany, France, and the Netherlands have established well-developed networks of fast-charging stations, others, including Bulgaria, Romania, and Greece, exhibit substantial gaps in infrastructure. Accessibility remains particularly limited in rural and remote areas.
The existence of diverse connector standards leads to interoperability issues between networks. Furthermore, different operators require distinct access cards or mobile applications, complicating user convenience.
A standardized payment system is lacking—some charging stations accept credit cards, whereas others operate exclusively on a subscription basis. Disparities in charging costs between countries further complicate expense planning for electric vehicle users.
Each nation enforces distinct regulations governing the operation of charging stations. Moreover, varying policies on electric vehicle incentives contribute to the uneven development of charging infrastructure.
Most electric vehicles have a range of approximately 300–500 km, necessitating frequent charging stops. Even at fast-charging stations, the time required to recharge remains considerably longer than refueling with conventional fuels, particularly given the inherent power limitations of battery technology.
All these factors underscore the necessity of identifying optimal routing solutions for electric vehicle travel, as examined in [14], alongside a broader analysis of the challenges associated with the adoption of electromobility.
Numerous authors have proposed models addressing specific challenges and their corresponding solutions. In [15], a routing framework for electric vehicles is presented, wherein the primary objective is to determine the fastest route with recharging stops while accounting for dynamic road conditions and battery capacity constraints. The authors propose an efficient algorithm that integrates classical routing techniques with adaptive real-time data processing methods. The study includes an analysis of computational complexity, simulation results, and comparisons with alternative methodologies.
The minimization of the maximum travel distance for electric vehicles, considering battery limitations and charging station availability, is examined in [16]. Numerical investigations have been conducted using randomly generated datasets for fleet routing, incorporating certain modifications from existing literature. The effectiveness of the proposed methods is assessed through extensive computational experiments.
Optimization strategies for routing are explored in light of technological advancements, particularly the potential integration of mobile energy diffusers for on-the-go recharging of electric vehicles [17].
In [18], a strategy for “Route Optimization Related to Vehicle Propulsion” is proposed, wherein the dynamics of vehicle propulsion are incorporated into the route optimization process.
The shortest path problem in the context of optimal electric vehicle (EV) routing is analyzed in [19]. The authors consider constraints such as battery capacity and the necessity of recharging, which complicate the classical shortest path problem. They propose an extended routing model that accounts for both route length and energy consumption, incorporating recharging possibilities along the way. Algorithms are formulated to compute optimal routes that minimize travel time while factoring in variables such as topography, traffic conditions, and charging station availability. The proposed methods enhance route planning efficiency for electric vehicles compared to traditional shortest path algorithms.
The issue of identifying energy-optimal routes for electric vehicles is addressed in [20]. The primary aim is to develop algorithms that minimize energy consumption during travel, rather than merely identifying the shortest or fastest route. The proposed algorithms employ preprocessing of cartographic data and dynamic route recalculations to ensure optimal outcomes.
Although still a relatively new field, research on electric vehicles and charging infrastructure has already produced numerous well-regarded studies [21,22]. At the same time, there remain many areas for further investigation.
As highlighted in [23], changes in human mobility are not solely driven by technological innovations such as autonomous and electric vehicles or advancements in connectivity and data communication. Instead, they are often shaped by social behaviors. Other researchers emphasize the necessity of interdisciplinary research to address the multifaceted challenges of electromobility. For instance, [24] calls for a deeper exploration of the social, economic, and political dimensions of electric vehicle adoption, including issues of equity and access to charging infrastructure. The assessment of consumer preferences regarding electric vehicles represents a dynamic and evolving area of literature.
Several studies have focused on electric buses in urban environments, developing models [25] and predicting energy consumption using real-world data processed through machine learning-based mathematical models [26]. These studies reveal that energy consumption in urban conditions increases with rising ambient temperatures, high-intensity traffic flow, and frequent stops at intersections. Conversely, it can decrease under sunny weather conditions and during travel at higher speeds. However, the authors acknowledge that many of these findings are derived primarily from simulations and computational analyses rather than empirical testing. Real-world studies involving 12 m electric buses have been conducted in [27], where researchers found no strong correlation between average speed and energy consumption, suggesting the need for further investigation due to the simultaneous influence of multiple factors. This highlights a predominant research focus on electric buses, which are becoming increasingly integrated into public transportation systems. Meanwhile, data on long-distance electric vehicle travel remains scarce or insufficiently documented.
Empirical studies conducted under real-world conditions can follow two primary approaches. The first involves determining the energy-economy characteristics of electric vehicles, assessing energy consumption under sustained travel at various constant speeds and across different road inclinations. The second approach consists of conducting real-world travel experiments along routes traditionally used by internal combustion engine vehicles.
A review of the existing literature reveals that while many crucial aspects of electric vehicle adoption have been explored, there is a noticeable lack of documented real-world experiments on cross-border travel in Europe. This is particularly significant, as such studies are essential for the development of charging infrastructure and the seamless integration of electric vehicles into the continent’s transportation network. A real-world experiment could provide valuable insights into how infrastructure heterogeneity affects travel experiences, the specific challenges that arise when driving through different countries, and how electric vehicle users navigate these obstacles.
Real-world factors—including road characteristics, climatic conditions, traffic congestion, and vehicle load—can significantly impact energy consumption and driving range. Conducting experiments under actual conditions would yield critical data for optimizing routes and charging strategies during long-distance travel, ultimately improving energy efficiency. Empirical data from such experiments could also illustrate how electric vehicles contribute to reducing carbon emissions on long journeys.
Given that recharging electric vehicles takes considerably longer than refueling at conventional petrol stations, a real-world study could assess the time consumers spend at charging stations during extended trips and evaluate its impact on route planning and travel duration. Additionally, such an experiment could serve as a testing ground for emerging charging technologies—such as ultra-fast chargers and wireless charging—assessing their compatibility with various electric vehicle models and their potential role in shaping future infrastructure developments. Europe hosts a diverse array of payment platforms and applications for charging, varying by region and operator. A real-world experiment could offer crucial insights into the obstacles and inefficiencies associated with payment systems during cross-border travel—an essential factor for improving system integration. Furthermore, conducting a real-world study would provide valuable data for assessing the effectiveness of existing European mobility and decarbonization policies. Such an analysis could help identify both the successes and shortcomings of EU regulations and standards in the context of international electric vehicle travel. Evaluating the user experience during cross-border journeys is another vital aspect, encompassing both emotional and psychological factors such as the stress of locating charging stations, long waiting times, and the potential lack of available chargers. A real-world experiment could identify the most pressing challenges faced by electric vehicle drivers and suggest improvements to enhance the overall user experience.
The present study examines an experiment in which an internal combustion engine vehicle is replaced with an electric vehicle to determine the feasibility of long-distance travel spanning multiple countries over a distance exceeding 2000 km.

3. Materials and Methods

The five main components of the research methodology, along with their sequence, are summarized in Figure 1: case definition, data collection from various sources, selection, experimental research, and, finally, calculation of average performance metrics along the route.
Case Definition
The case definition process consists of four steps: the first two involve a literature review on EVs and their charging infrastructure, a study of road infrastructure and potential routes from Ruse to Paris, and an examination of the temporal horizon.
Literature Review on EVs
As of March 2024, there are 13,466 registered EVs in Bulgaria, comprising a highly diverse fleet that includes various brands: Tesla, Dacia, BMW, Hyundai, Mercedes, Volvo, Renault, Volkswagen, Opel, Kia, Peugeot, Skoda, and others. EVs are available in a wide range of sizes and configurations, from compact urban cars to larger models, with the range of each model on a single charge varying according to specific attributes. On average, EVs can travel between 150 and 400 km on a full battery charge, as indicated in the literature [28,29]. However, this range is influenced by numerous factors, such as weather conditions [4,30], road conditions and gradients [31], traffic intensity, driving speed, battery degradation, and others [32,33].
Literature Review on EV Charging
Compared to conventional vehicles, EVs still have a significantly lower range-approximately 380 km (average range among 10 passenger EVs currently on the market)-and thus require more frequent recharging. Charging time depends on the type and capacity of the vehicle’s battery as well as on the charging point’s capacity (Table 1). While “slow” and “normal” chargers are more suitable for home or office charging cycles, “rapid” and “ultra-fast” chargers are better suited for highways and major road networks. Drivers often express concerns that their EV may not have enough range to reach their destination [1] and that charging may require waiting in line if charging posts are already occupied. These concerns are exacerbated by the range limitations and worries about the availability of charging stations along the route.
The availability of charging infrastructure varies significantly across countries, with payment systems lacking standardized minimum requirements and insufficient user information. It is worth marking that national fuel station chains have integrated charging posts at many of their locations along highways.
Within Europe, and particularly the EU, there is a unified standard for EV charging plugs (Type 2 and Combo 2 Combined Charging Systems).
According to Annex II of the EU’s Alternative Fuels Infrastructure Directive (AFID) [35], alternating current (AC) charging points for EVs must be equipped, for interoperability purposes, with at least open Type 2 sockets or connectors for vehicles, as specified in standard EN 62196-2.
The AFID (Annex II) mandates that high-power direct current (DC) charging points for EVs be equipped, for interoperability purposes, with at least Combo 2 Combined Charging Systems, as outlined in standard EN 62196-3.
The distribution of charging stations remains uneven, as there are no clear and consistent minimum infrastructure requirements to ensure EV mobility across regions. This is largely driven by private initiatives and investments rather than cohesive strategy and standards. The lack of harmonized payment systems with minimum requirements, along with real-time information on station availability and service billing, further complicates long-distance EV travel.
Preliminary destination selection and study of road infrastructure and potential routes.
The initial criteria for destination selection are as follows:
-
A route exceeding 2000 km in length;
-
Passing through multiple countries;
-
The team should have no prior EV charging experience before the experiment.
Following these conditions, the chosen destination was Ruse, Bulgaria, to Paris, France.
For this destination, two main route options were considered:
-
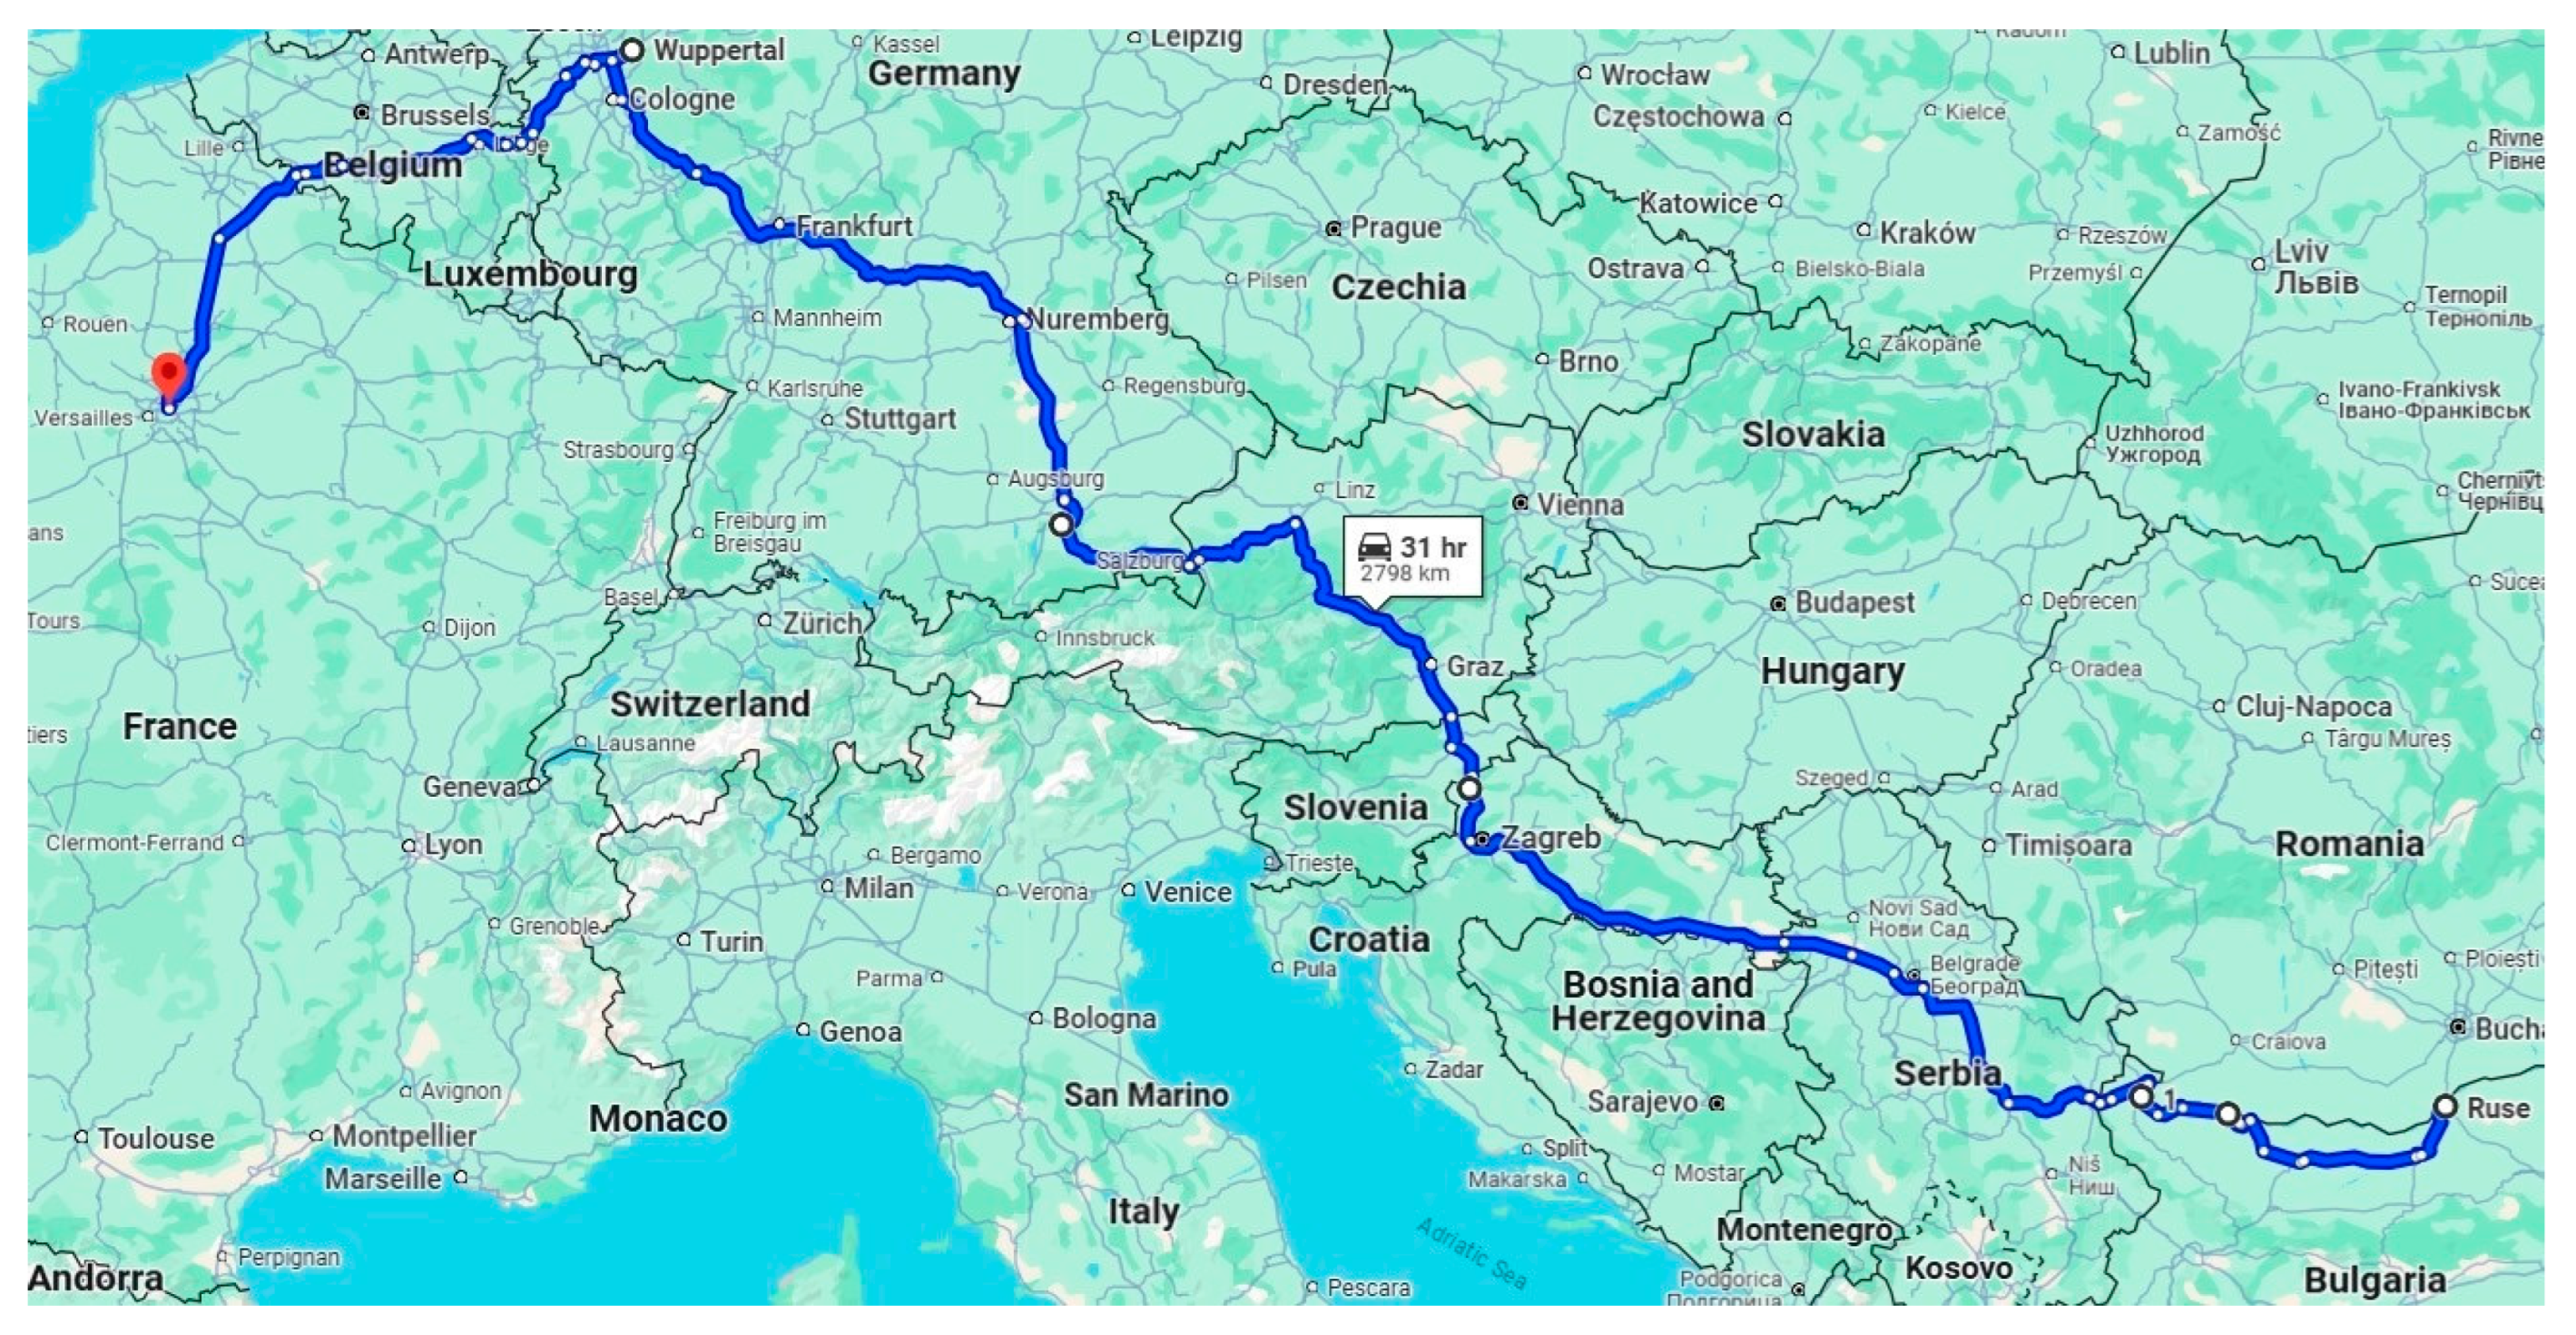
Traveling exclusively within the EU (Bulgaria, Romania, Hungary, Austria, Germany, France), as shown in Figure 2.
-
Traveling through both EU and non-EU countries (Bulgaria, Serbia, Croatia, Slovenia, Austria, Germany, Belgium, and France*), as shown in Figure 3.
*An alternative route, shorter than the one selected, exists.
Figure 3. Route from Ruse to Paris through EU and non-EU countries.
Wevj 16 00204 g003
Study of temporal horizon
The energy consumption of an EV depends on weather conditions, with literature indicating that in some cases, winter energy consumption increases by more than 20%, while in hot summer conditions it rises by more than 10% [28,29].
Data collection from various sources
During the research development, both existing and new data were collected. The research team developed a data collection plan, specifying sources, scope, methods, and timelines relevant to the study. The data collection process is illustrated in Figure 4. To track trends and provide reliable information for analysis, the appropriate study period was established, ensuring access to historical data.
The collected data are substantial in volume and are characterized by exceptional heterogeneity in terms of format, presentation method, temporal scope, territorial coverage, complexity, and volume.
Data from institutions were obtained through an exchange of letters requesting information provision. Following an examination of public sources, the necessary data for the research were extracted. The organization of data acquisition from institutions and public sources serves as a guarantee of their quality.
Through independent investigations, data essential for the research were secured, as well as additional data for analytical purposes.
To overcome the challenges in evaluating the collected data, they were systematized according to their applicability, sources, and scope. Data evaluation was conducted through an analysis of their quality, availability, and timeliness of receipt. The applicability of the data for performing the necessary analyses is contingent upon their quality.
Through independent investigations, the data essential for the research were secured, as well as additional data for analytical purposes.
Figure 5 illustrates the block diagram of the processes involved in data collection.
Selection
This stage is related to the selection of the EV for the experiment, the route, the temporal horizon, and the development of a schedule for movement along the route.
Selection of EV: For the purposes of this study, a new Peugeot e-2008 was purchased and registered in March 2023. That year, the model was manufactured with two different battery capacities: one with 50 kWh and another with 54 kWh. The vehicle used for the study was equipped with the following technical specifications, as documented in the technical manual:
Autonomous range: 330–342 km, aligning closely with the European average at the time.
Battery capacity: 50 kWh lithium-ion battery.
Electric motor power: 100 kW, front-mounted.
Curb weight: 1623 kg.
Maximum speed: Electronically limited to 150 km/h.
Average energy consumption (WLTP cycle): 15.7–16.1 kWh/100 km.
The car is traveling with two passengers and luggage, i.e., a load of around 240 kg.
Route selection: The route was chosen to pass through countries outside the EU and through several EU member states. The requirement to assess the degree of compatibility between the charging infrastructure conditions in the two groups of countries (EU and non-EU) and to guarantee a wider sample size for the study prompted the decision.
The team’s selected rest stops also influenced the decision to pass through specific cities.
Route: Ruse, BulgariaVidin, BulgariaBelgrade, SerbiaZagreb, CroatiaMaribor, SloveniaSalzburg, AustriaMunich, GermanyWuppertal, GermanyLiège, BelgiumParis, and France.
Figure 3 illustrates this route.
Selection of time horizon for the experiment: A variant for the experiment during the summer period was chosen, as it is a lighter period in terms of energy consumption (including auxiliary load restrictions if necessary).
Experimental Study
Study route: It coincides with the one chosen in part 3.
Charging points: They are selected based on the publicly available data about public charging stations.
Execution of the movement schedule: A comparison is made with the planned schedule.
Calculation of average performance indicators for the route
Travel time: This is the total travel time— t m o v e and the time for charging breaks— t c h a r g e a l l , and for other breaks (for recreation)— t s t a y :
T = t m o v e + t c h a r g e a l l + t s t a y ,   min .
The charging breaks time is the sum of the charging preparation times t p r e p a r a t i o n and charging time t c h a r g e :
t c h a r g e a l l = t p r e p a r a t i o n + t c h a r g e ,   min .
Time for EV charging preparation, t p r e p a r a t i o n : This is the time required to initiate charging, which includes familiarizing oneself with the terms of use of the respective charging station provider, ensuring compliance with the necessary requirements, and connecting the station’s plug to the EV.
It is important to note that the research team engaged with the charging stations for the first time, resulting in extended setup durations. As a result, the preparation for charging during the initial meeting required more time than with a known and previously utilized charging infrastructure.
EV charging time, t c h a r g e : The actual time during which the EV battery draws electricity from the charging post and for which the service is billed.
Energy consumption of the EV: This refers to the charged energy at each of the n stations during the study, denoted as E c h a r g e d i , for ( 1 i n ) . The specific energy consumption for each trip between two charging sessions is represented as E S E C , as well as the total charged energy consumption E t o t a l , without considering the amounts of regenerated energy during movement.
The total energy utilized by the EV, E t o t a l is the sum of the charged amounts at each charging post:
E t o t a l = i = 0 n E c h a r g e d i ,   kWh .
The specific consumption refers to the expenditure of electricity per kilometer traveled under certain conditions.
E S E C = E c h a r g e d i S i ,   kWh / km ,
where S i ,   ( k m ) represents the actual distance traveled by the EV to the respective charging point i from charging point ( i 1 ) .
Utilization of Charging Infrastructure for EVs: The primary criterion for the utilization of charging infrastructure is, of course, its actual condition—operational or non-operational. Additionally, its functionality is assessed based on multiple criteria that determine the factors influencing its use, such as location, information availability, amenities, payment options, and others. Possible external factors that could hinder its utilization are also identified.

4. Results

During the course of the study, a distance of 2984 km was covered under various speed regimes and ambient temperatures, along with diverse road conditions and varying degrees of auxiliary load utilization.
The time allocated for charging breaks, calculated using (2), is:
t c h a r g e a l l = 296 + 813 = 1109 min ≈ 18.48 h.
The total travel time, calculated using (1), is:
T = 2444 + 1109 + 2822 = 6375 min ≈ 106.25 h.
The total energy consumed by the EV, calculated using (3), is:
E t o t a l = 506.86 kWh.
Following the methodology, (4) has been applied under various driving modes and conditions. The results are summarized in Table 2 and graphically represented in Figure 6 and Figure 7.
The charging stops for the electric vehicle were conducted according to Table 3. The first charging session (Position “0”) was carried out at home, using a standard 220 V electrical grid in Ruse, Bulgaria. In all subsequent cases, charging was performed at commercial charging stations.
In three instances, highlighted in orange in Table 3 (Positions 4, 12, and 14), attempts to charge the vehicle were unsuccessful due to malfunctions or incompatibilities at the charging stations. As a result, it was necessary to locate the nearest available station in the area. This underscores one of the significant risks faced by electric vehicle drivers—without reserving sufficient battery capacity to reach an alternative charging station, they risk being stranded. To mitigate this issue, real-time information on the operational status of charging stations and their current occupancy is crucial.
In Serbia (near Belgrade) and Croatia (around Zagreb), severe traffic congestion was encountered, often requiring long stops and idling in dense queues under high ambient temperatures (30–34 °C). This had a notable impact on energy consumption, as prolonged stationary periods in high heat conditions increased battery drain. Overall, navigating through major urban areas proved to be one of the most significant risk factors for range efficiency.
The green-highlighted entry in Table 3 (Position 10) represents a charging station where the journey resumed with auxiliary loads activated (air conditioning system). The decision to turn on climate control was based on Austria’s well-developed fast-charging infrastructure (stations over 80 kW were spaced approximately 50 km apart), significantly lowering the risk of failing to locate a charging point. Additionally, moderate ambient temperatures (20–23 °C) in the mountainous terrain reduced the strain on energy consumption.
In Germany, with the exception of the Munich region, where the temperature rose to around 30 °C, the rest of the journey took place in milder conditions (23–24 °C). However, high traffic volumes on the autobahns frequently led to congestion, limiting speeds and increasing stop-and-go driving. In some segments, the vehicle was able to maintain higher speeds of approximately 120 km/h, which contributed to greater deviations from the expected range due to increased energy demand.
These findings highlight how external factors such as traffic density, climate conditions, and charging station reliability significantly influence energy consumption and travel efficiency for long-distance electric vehicle journeys.
The most sparsely distributed charging stations were encountered in Bulgaria and Serbia. In Bulgaria, the route followed primary roads where charging stations are currently under development. In Serbia, the route passed through two distinct segments:
The first section, from Bulgaria via the Vrška Čuka border crossing to the Niš–Belgrade highway, had very few charging stations.
The second section, along the highway, featured a higher number of charging stations, improving accessibility.
In contrast, in Croatia, Austria, Germany, Belgium, and France, fast-charging stations were well-distributed throughout the journey, which primarily followed major highways, ensuring greater convenience for long-distance travel.
From the information presented in Figure 6, it can be concluded that, during travel without auxiliary loads, losses due to discrepancies in mileage are primarily influenced by the speed modes, while specific consumption varies depending on both the speed modes and ambient temperature in a timely manner.
Table 4 shows the mean and boundary values of the four key indicators assessed during the journey: ambient temperature, vehicle speed, losses due to discrepancies in mileage, and specific fuel consumption when driving without auxiliary loads. The data that was processed with IBM SPSS Statistics 26 shows that the temperature ranges from 24 to 35 °C, the average speed on the sections from 58.9 to 74.5 km/h, the mileage mismatch losses from 0.64 to 29.86%, and the specific fuel consumption ranges from 14.65 to 22.14 kWh/100 km. The electric vehicle’s route passes through the countries of Bulgaria, Serbia, Croatia, Slovenia, and Austria. The electric vehicle did not require charging in Slovenia due to its short 80 km travel distance.
The data, analyzed using SPSS and summarized in Table 5, examine the relationships between each pair of evaluated parameters through Pearson’s correlation coefficient. The results indicate significant interactions between environmental and driving factors. A notable correlation (0.563) was observed between ambient temperature and specific energy consumption when traveling without auxiliary loads during high daytime temperatures (30–35 °C). This effect is attributed to several factors: 1. The study route passes through high-traffic areas with frequent congestion and delays, particularly near Belgrade and Zagreb. 2. The journey includes both highway segments and non-highway roads, where traffic density is lower, but the roads are characterized by numerous curves, ascents, and descents. 3. Battery characteristics, as higher ambient temperatures accelerate battery discharge rates. 4. To compensate for time lost in traffic congestion, the vehicle often maintained higher speeds where possible, leading to greater energy consumption. In this case, the impact of temperature is directly interlinked with other factors not explicitly reflected in the table.
A significant correlation (0.517) was also found between temperature and average speed, driven by similar factors as previously described.
The strongest correlation (0.601) was identified between specific energy consumption and losses due to discrepancies in mileage losses. This is primarily explained by the prolonged idle time in traffic congestion, during which the electric vehicle continues to consume energy at low speeds. Even when stationary, power consumption persists due to operating headlights, dashboard illumination, safety sensors, and monitoring systems, which contribute to losses due to discrepancies in mileage.
These findings highlight the complex interactions between environmental conditions, driving behavior, and energy efficiency, emphasizing the need for strategic route planning and real-time adaptive energy management for electric vehicles.
The table indicates that along the planned route, a significant number of charging stations (9) are conveniently located within 2 km of a main road/highway, followed by those situated at a nearby distance of 2 to 4 km (6). The difference in the number of stations located in each of the remaining two ranges is minimal, but their combined percentage of the total remains relatively high-25%. Three of the visited stations are located outside the EU, with the total distance to and from the main road ranging between 0.4 and 0.6 km. This distance is associated with the fact that these charging stations are situated within populated areas.
Table 6 shows the mean and boundary values of the four evaluated indicators: ambient temperature, vehicle speed, losses due to discrepancies in mileage, and specific fuel consumption when driving with auxiliary loads. The data processed with SPSS show that the temperature varies in the range from 21 to 28.8 °C, the average speed on the sections from 60.8 to 92.9 km/h, losses due to discrepancies in mileage from 21.05 to 49.69%, and the specific fuel consumption from 15.88 to 21.23 kWh/100 km.
The data, processed using SPSS and summarized in Table 7, reveal a significant inverse correlation between ambient temperature and average speed. This trend is primarily attributed to heavy traffic congestion near Munich, where road conditions resulted in a drop in average speed to 60.8 km/h, despite high ambient temperatures of 28.8 °C. Losses due to discrepancies in mileage exhibited a moderate correlation (0.396) with average speed, indicating that higher speeds contributed to increased deviations from the expected driving range. A moderate correlation (0.420) was also observed between losses due to discrepancies in mileage and specific energy consumption. This relationship is influenced by road inclines, which enable longer distances to be covered with lower energy consumption while maintaining higher speeds. Additionally, regenerative braking plays a role in partially replenishing battery energy during descents.
When comparing the actual specific energy consumption over the entire route to the manufacturer-stated consumption from test conditions, the real-world energy consumption was approximately 11% higher. This finding aligns with the predictions in [36], where authors estimate a 10% discrepancy between real-world and test cycle energy consumption. The key contributing factors to this difference include high traffic density and frequent stops near major urban areas; sustained highway speeds exceeding 90 km/h, increasing energy demand; inclined road sections, requiring additional energy for ascents; the impact of ambient temperature on battery efficiency; and vehicle energy consumption.
Data were collected from 20 charging stations, with successful charging conducted at 17 locations. For fast and ultra-fast charging stations within the EU, the cost of charging services ranged from EUR 0.46 to EUR 0.73 per kWh. Outside the EU, charging costs were significantly higher, ranging between EUR 0.91 and EUR 0.98 per kWh. The total detour distance from the main road/highway to the charging station and back varied between 0.4 km and 17 km. Table 8 presents the distribution of charging stations based on their detour distances, providing insights into accessibility and convenience along the evaluated route.
The data in Table 8 indicate that a significant number of charging stations (9) were conveniently located within 2 km of a main road or highway. These were followed by six stations situated at a moderate distance of 2–4 km, which can still be considered reasonably accessible. The difference in the number of charging stations in the remaining two distance categories is minimal; however, their share of the total remains relatively high at 25%, highlighting that a considerable portion of charging infrastructure requires longer detours. For charging stations outside the EU, three locations were visited, with detour distances ranging between 0.4 and 0.6 km from the main road. Their placement was primarily influenced by the fact that these stations were situated within urban areas, rather than along highways.
Additionally, each charging station was assessed based on the following factors: the presence of a roof over the charging area; availability of a resting area (benches); access to free internet; the option for cash payments; online information about the station’s functionality; the status of the station on the internet; information regarding station occupancy on the internet; and the actual condition of the station. The summarized data are presented in Table 9.

5. Discussion (Main Problems and Recommendations for Future Work)

The following main issues can be identified:
  • Limited availability of charging stations.
  • Need for reliable public information regarding the location of rapid charging infrastructure for EVs, respective charging power, and pricing.
  • The necessity of pre-route research for selected destinations.
  • Extended travel duration due to additional charging time.
  • Compatibility of charging points, variations in payment methods across different countries, including those offered by various providers (the need for installing and using different applications instead of the option to directly use debit and credit cards, difficulties with payment processing, such as incompatible payment methods or complex payment procedures).
  • Lack of protective structures at some charging points, which complicates reading information during sunny weather and does not protect users from adverse weather conditions (rain, snow, etc.).
  • Mandatory rest areas adjacent to charging stations.
  • Issues with cellular and network connectivity, such as unreliable internet connectivity, can disrupt communication between EVs and charging infrastructure, leading to unsuccessful charging or delays.
  • The absence of Wi-Fi at charging stations necessitates the use of data while roaming.
  • Limited driving range and inadequate charging infrastructure.
  • Management of charging cables, as issues with tangled cables, insufficient cable length, and difficulties handling heavy cables.
  • Reliability problems with charging infrastructure, such as malfunctioning equipment or inconsistent charging performance.
  • Charging EVs after reaching 80% battery capacity takes a considerable amount of time.
Recommendations:
  • Establishment of a unified information platform that should provide information on the location of rapid charging infrastructure for EVs, charging power, pricing, and other relevant data (e.g., rest area conditions during charging).
  • Introduction of a unified standard for payment—a standardized payment method for the charged amount of energy using credit and debit cards, streamlining payment processes, offering multiple payment options, and ensuring secure and reliable transaction processing.
  • Mandatory implementation of protective structures at charging stations, which should adhere to a unified standard.
  • Designated rest areas adjacent to charging infrastructure to ensure that users have appropriate facilities for relaxation while charging.
  • Availability of Wi-Fi at charging points to enhance user experience.
  • Utilization of standard charging protocols and increased operational compatibility between charging infrastructure and EVs.
  • Regular maintenance and updates of quality assurance measures with implemented real-time monitoring of charging points to maintain service quality.
Improvement of network infrastructure by deploying backup solutions, such as offline charging authentication methods, to address connectivity issues.

6. Conclusions

The study aims to highlight the main problems and provide recommendations for enhancing the potential of electric mobility for long-distance travel across multiple countries. This case was chosen because it frequently serves as a barrier to the adoption of EVs by consumers. The analysis of the results allowed for the identification of key issues and the formulation of essential recommendations. The study lacks a comprehensive sensitivity analysis that could strengthen the results, as the research focused only on several key parameters and the uncertainty analysis for some of them, such as energy consumption, and the availability and conditions of charging stations.
The presented methodology for researching electric mobility over long distances, starting from Bulgaria and traversing multiple countries, allows for the determination of the necessary amounts of energy required for charging EVs as well as the main challenges associated with traveling in them.
The research found that electricity consumption and battery usage are significant factors impacting long-distance mobility, alongside the availability of rapid charging points. When driving without auxiliary loads, the correlation analysis revealed that losses due to discrepancies in mileage are primarily influenced by speed variations, showing an approximately direct proportionality to driving speed. Additionally, specific energy consumption was found to be dependent on losses due to discrepancies in mileage (correlation coefficient: 0.601) and ambient temperature (correlation coefficient: 0.563).
While driving with auxiliary loads and relatively high average speeds, specific energy consumption remained relatively stable at approximately 18 kWh/100 km, regardless of fluctuations in ambient temperature. In contrast, range deviation losses exhibited a moderate correlation with speed (0.396) and varied in response to changes in ambient temperature.
Regarding the conditions observed at the charging stations, a predominant lack of protective coverings and resting areas was noted, as well as a complete absence of free internet access at all stations. Only one station offered the option for cash payments. Information about the station’s functionality was unavailable online for 25% of the stations, while data regarding their online status was lacking for 40% of the stations. In 50% of cases, there was no information online about station occupancy.
Electric mobility in urban settings has been well-researched and demonstrates proven potential. However, when the same EVs are used for long-distance travel and when crossing various countries, numerous problems arise that require solutions. Otherwise, there may be a necessity to own two vehicles: one for city travel and another for long-distance travel, which would further increase the global vehicle fleet. Current applications of long-distance electric mobility may require reassessment depending on future technological and managerial decisions implemented by policymakers.

Author Contributions

Conceptualization, V.P. and A.A.; methodology, V.P.; software, M.K.; validation, V.P., A.A. and M.K.; formal analysis, V.P.; investigation, A.A.; resources, V.P.; data curation, M.K.; writing—original draft preparation, V.P.; writing—review and editing, A.A.; visualization, M.K.; supervision, V.P.; project administration, V.P.; funding acquisition, V.P. All authors have read and agreed to the published version of the manuscript.

Funding

This study is financed by the European Union-NextGenerationEU, through the National Recovery and Resilience Plan of the Republic of Bulgaria, project № BG-RRP-2.013-0001.

Data Availability Statement

The data presented in this study are available on request from the corresponding author due to privacy reasons.

Conflicts of Interest

The authors declare no conflicts of interest.

References

  1. Modi, S.; Bhattacharya, J.; Basak, P. Estimation of energy consumption of electric vehicles using Deep Convolutional Neural Network to reduce driver’s range anxiety. ISA Trans. 2020, 98, 454–470. [Google Scholar] [CrossRef] [PubMed]
  2. Nanaki, E. Electric vehicles. Electric Vehicles for Smart Cities. Trends Chall. Oppor. 2021, 13–49. [Google Scholar] [CrossRef]
  3. Rogers, L.; Zoepf, S.; Prenninger, J. Analysing the Energy Consumption of the BMW ActiveE Field Trial Vehicles with Application to Distance to Empty Algorithms. Transp. Res. Procedia 2014, 4, 42–54. [Google Scholar] [CrossRef]
  4. Kambly, K.; Bradley, T. Geographical and temporal differences in electric vehicle range due to cabin conditioning energy consumption. J. Power Sources 2015, 275, 468–475. [Google Scholar] [CrossRef]
  5. Alves, J.; Baptista, P.; Gonçalves, G.A.; Duarte, G.O. Indirect methodologies to estimate energy use in vehicles: Application to battery electric vehicles. Energy Convers Manag. 2016, 124, 116–129. [Google Scholar] [CrossRef]
  6. Zhang, R.; Yao, E. Electric vehicles’ energy consumption estimation with real driving condi-tion data. Transp. Res. Part D Transp. Environ. 2015, 41, 177–187. [Google Scholar] [CrossRef]
  7. Zhai, H.; Frey, H.; Rouphail, N. A Vehicle-Specific Power Approach to Speed- and Facility-Specific Emissions Estimates for Diesel Transit Buses. Environ. Sci. Technol. 2008, 42, 7985–7991. [Google Scholar] [CrossRef]
  8. Fioria, C.; Ahna, K.; Rakha, H. Power-based electric vehicle energy consumption model: Model development and validation. Appl. Energy 2016, 168, 257–268. [Google Scholar] [CrossRef]
  9. Luin, B.; Petelin, S.; Al-Mansour, F. Microsimulation of electric vehicle energy consumption. Energy 2019, 174, 24–32. [Google Scholar] [CrossRef]
  10. Fetene, G.M.; Kaplan, S.; Mabit, S.; Jensen, A.; Prato, C. Harnessing big data for estimating the energy consumption and driving range of electric vehicles. Transp. Res. Part D Transp. Environ. 2017, 54, 1–11. [Google Scholar] [CrossRef]
  11. Wu, X.; Freese, D.; Cabrera, A.; Kitch, W. Electric vehicles’ energy consumption measurement and estimation. Transp. Res. Part D Transp. Environ. 2015, 34, 52–67. [Google Scholar] [CrossRef]
  12. Baltazara, J.; Valleta, F.; Garcia, J. A model for long-distance mobility with battery electric vehicles: A multiperspective analysis. Procedia CIRP. 2022, 109, 334–339. [Google Scholar] [CrossRef]
  13. International Energy Agency (IEA). Global EV Outlook 2022: Securing Supplies for an Electric Future. 2022. Available online: https://www.iea.org/reports/global-ev-outlook-2022 (accessed on 28 February 2025).
  14. Haghani, M.; Sprei, F.; Kazemzadeh, K.; Shahhoseini, Z. Trends in electric vehicles research. Transp. Res. Part D Transp. Environ. 2023, 123, 103881. [Google Scholar] [CrossRef]
  15. Nasehi, S.; Choudhury, F.; Tanin, E. Proactive Route Planning for Electric Vehicles. arXiv 2024, arXiv:2405.00691. [Google Scholar]
  16. Fazeli, S.; Venkatachalam, S.; Smereka, J. Efficient algorithms for electric vehicles’ min-max routing problem. Sustain. Oper. Comput. 2024, 5, 15–28. [Google Scholar] [CrossRef]
  17. Ant’on, L.; Leal, M.; Sainz-Pardo, J. Trip Optimization methods for Electric Vehicles Supported by Wireless. arXiv 2021, arXiv:2111.00255. [Google Scholar] [CrossRef]
  18. Qiao, Z.; Karabasoglu, O. Vehicle Powertrain Connected Route Optimization for Conventional, Hybrid and Plug-in Electric Vehicles. arXiv 2016, arXiv:1612.01243. [Google Scholar] [CrossRef]
  19. Artmeier, A.; Haselmayr, J.; Leucker, M.; Sachenbacher, M. The shortest path problem revisited: Optimal routing for electric vehicles. In KI 2010: Advances in Artificial Intelligence: 33rd Annual German Conference on AI, Karlsruhe, Germany, September 21–24, 2010. Proceedings 33; Springer: Berlin/Heidelberg, Germany, 2010. [Google Scholar] [CrossRef]
  20. Baum, M.; Dibbelt, J.; Pajor, T.; Wagner, D. Energy-optimal routes for electric vehicles. In Proceedings of the 21st ACM SIGSPATIAL International Conference on Advances in Geographic Information Systems, New York, NY, USA, 5–8 November 2013; pp. 54–63, ACM. [Google Scholar] [CrossRef]
  21. Coffman, M.; Bernstein, P.; Wee, S. Electric vehicles revisited: A review of factors that affect adoption. Transp. Rev. 2016, 37, 79–93. [Google Scholar] [CrossRef]
  22. Liao, F.; Molin, E.; Wee, B. Consumer preferences for electric vehicles: A literature review. Transp. Rev. 2017, 37, 252–275. [Google Scholar] [CrossRef]
  23. Turienzo, J.; Cabanelas, P.; Lampón, J.; Parkhurst, G. The transformation of mobility in Europe: Technological change and social conditionings. Travel Behav. Soc. 2025, 38, 100907. [Google Scholar] [CrossRef]
  24. Debnath, R.; Bardhan, R.; Reiner, D.M.; Miller, J.R. Political, economic, social, technological, legal and environmental dimensions of electric vehicle adoption in the United States: A so-cial-media interaction analysis Renew. Sustain. Energy Rev. 2021, 152, 111707. [Google Scholar] [CrossRef]
  25. Li, X.; Wang, T.; Li, J.; Tian, Y.; Tian, J. Energy Consumption Estimation for Electric Buses Based on a Physical and Data-Driven fusion model. Energy 2022, 15, 4160. [Google Scholar] [CrossRef]
  26. Dong, C.; Xiong, Z.; Li, N.; Yu, X.; Liang, M.; Zhang, C.; Li, Y.; Wang, H. A real-time prediction framework for energy consumption of electric buses using integrated Machine learning algorithms. Transp. Res. Part E Logist. Transp. Rev. 2025, 194, 103884. [Google Scholar] [CrossRef]
  27. Belloni, M.; Tarsitano, D.; Sabbioni, E. A Comprehensive Analysis of Energy Consumption in Battery-Electric Buses Using Experimental Data: Impact of Driver Behavior, Route Characteristics, and Environmental Conditions. Electronics 2025, 14, 735. [Google Scholar] [CrossRef]
  28. Garberson, A.; Hough, B. Study: Summer & Hot Weather on Electric Car Range; Recurrent Motors, Inc.: Seattle, WA, USA, 2024; Available online: https://www.recurrentauto.com/research/what-a-c-does-to-your-range (accessed on 20 July 2024).
  29. Garberson, A.; Hough, B. Study: Winter & Cold Weather EV Range 10,000+ Cars; Recurrent Motors, Inc.: Seattle, WA, USA, 2024; Available online: https://www.recurrentauto.com/research/winter-ev-range-loss (accessed on 20 July 2024).
  30. Al-Wreikat, Y.; Serrano, C.; Ricardo Sodre, J. Effects of ambient temperature and trip charac-teristics on the energy consumption of an electric vehicle. Energy 2022, 238, 122028. [Google Scholar] [CrossRef]
  31. Liu, K.; Yamamoto, T.; Morikawa, T. Impact of road gradient on energy consumption of electric vehicles. Transp. Res. Part D Transp. Environ. 2017, 54, 74–81. [Google Scholar] [CrossRef]
  32. Wang, H.; Zhao, D.; Cai, Y.; Meng, Q.; Ong, G.P. A trajectory-based energy consumption estimation method considering battery degradation for an urban electric vehicle network. Transp. Res. Part D Transp. Environ. 2019, 74, 142–153. [Google Scholar] [CrossRef]
  33. Lee, G.; Song, J.; Lim, Y.; Park, S. Energy consumption evaluation of passenger electric vehicle based on ambient temperature under Real-World driving conditions. Energy Convers. Manag. 2024, 306, 118289. [Google Scholar] [CrossRef]
  34. Mathieu, L.; Poliscanova, J.; Ambel, C.C.; Muzi, N.; Alexandridou, S. Recharge EU: How Many Charge Points Will Europe and Its Member States Need in the 2020s; Transport & Environment: Brussels, Belgium, 2020; 68p, Available online: https://www.transportenvironment.org/uploads/files/0120202020Draft20TE20Infrastructure20Report20Final.pdf (accessed on 21 October 2024).
  35. Alternative Fuels Infrastructure Directive 2014/94 (AFID). 2020. Available online: https://europe.influencemap.org/policy/EU-Alternative-Fuels-Infrastructure-431 (accessed on 20 July 2024).
  36. Fontaras, G.; Ciuffo, B.; Zacharof, N.; Tsiakmakis, S.; Marotta, A.; Pavlovic, J.; Anagnostopoulos, K. The difference between reported and real-world CO2 emissions: How much improvement can be expected by WLTP introduction? Transp. Res. Procedia 2017, 25, 3933–3943. [Google Scholar] [CrossRef]
Figure 1. Main components of the research methodology.
Wevj 16 00204 g001
Figure 2. Route from Ruse to Paris only on the territory of the EU.
Wevj 16 00204 g002
Figure 4. Data collection process.
Wevj 16 00204 g004
Figure 5. Flow chart of the processes for evaluating the collected data.
Wevj 16 00204 g005
Figure 6. The correlation between ambient temperature and speed mode concerning losses due to discrepancies in mileage and specific consumption during travel without auxiliary loads.
Wevj 16 00204 g006
Figure 7. The correlation between ambient temperature and speed mode concerning losses due to discrepancies and specific consumption during travel with auxiliary loads.
Wevj 16 00204 g007
Table 1. Available charging technology [34].
Charger Speed and TypeRated Power (kW)Approximate Charging Time *
Slow (AC)3–77–16 h
Normal (AC)11–222–4 h
Rapid (DC)50–10030–40 min
Ultra-fast (DC)>100<20 min
* It also depends on the battery capacity and other variables.
Table 2. Summary of the results for specific consumption ESEC and losses due to discrepancies under different atmospheric conditions and driving modes.
Ambient Temperature, °CSpeed Mode, km/hUtilization of Auxiliary Loads (AC, Radio, etc.)Actual Distance Traveled, kmDiscrepancy in Mileage *, kmLosses Due to Discrepancies in Mileage, %Specific Consumption E S E C kWh/100 km
123–3058.9No15710.6414.65
23568.0No273217.6915.71
323–3068.1No1933518.2516.42
43564.2No1543824.9222.14
53474.5No2116329.8617.44
633–2773.8No2523011.915.25
72460.0No1532015.3
82565.0No2094722.4916.36
921–2391.2Yes1494932.8918.15
102192.9Yes1786033.7118.33
1127–3060.8Yes1523221.0518.97
122377.3Yes1797340.7818.78
122485.1Yes1835127.8717.64
142471.7Yes1657143.0321.23
152265.7Yes1844423.9115.88
162392.6Yes1597949.6917.35
172385.2Yes1603421.2516.78
* difference between the actual recorded distance traveled and the estimated range displayed on the vehicle’s onboard computer after charging.
Table 3. Charging stations were visited along the research route.
№ Equivalent from Table 2Route Point/Charging StationAddressCountry
0StartUniversity of Ruse “Angel Kanchev”g.k. Student town, st. “Studentska” 8, 7017 RuseBulgaria
11AutoBOX (Voltspot) RAI PlevenVarbishka St., 5839 PlevenBulgaria
22EldriveWestern Industrial Zone, Pannonia Blvd 43, 3705 VidinBulgaria
33Charge&GOOMV Auto put Niš—Beograd LapovoSerbia
4Charging unsuccessfulCharge&GoOMV Belgrade Bypass, Belgrade 11271Serbia
54OMV eMobilityOMV Auto put Beograd Zagreb, Ruma 22400Serbia
65ChargePointPetrol Charging Station Ul. Petra Svačića 1, 35000, Slavonski BrodCroatia
76ElenKrapina, 49000, KrapinaCroatia
87ElenINA Donji Macelj 110-c, 49225, Donji MaceljCroatia
98IONITYEuropastraße 10a, 8784 TriebenAustria
109IONITYWarte am See 28 Mondsee, 5311 Innerschwand am MondseeAustria
1110EnBWZusestraße 1, 85649 BrunnthalGermany
12Charging unsuccessfulChargePointOtto-Hahn-Straße 6, 85276 Pfaffenhofen an der IlmGermany
1311FastnedAm Kreisel, 85125 KindingGermany
14Charging unsuccessfulMer GermanyRandersackerer Str. 46B, 97072 WürzburgGermany
1512WVV EnergieZeppelinstraße 122, 97074 WürzburgGermany
1613FastnedBrüsseler Str. 14, 65552 Limburg an der LahnGermany
1714EnBWWidukindstraße 97, 42289 WuppertalGermany
1815IONITYRue d’Awans 105, 4460 Grâce-HollogneBelgium
1916ENGIE VianeoAire de la Sentinelle Ouest—A2, 59174 La SentinelleFrance
2017ENGIE VianeoB&B HOTEL Saint-Witz, 10 Rue Jean Moulin, 95470 Saint-WitzFrance
21EndParis Charles de Gaulle AirportParis Charles de Gaulle Airport, 95700 Roissy-en-FranceFrance
Table 4. Descriptive statistics of the studied indicators when traveling without auxiliary loads.
Descriptives
StatisticStd. Error
TemperatureMean29.50001.63390
95% Confidence Interval for MeanLower Bound25.6364
Upper Bound33.3636
Minimum24.00
Maximum35.00
Average
Speed
Mean66.56252.02493
95% Confidence Interval for MeanLower Bound61.7743
Upper Bound71.3507
Minimum58.90
Maximum74.50
LossesMean16.96883.40466
95% Confidence Interval for MeanLower Bound8.9180
Upper Bound25.0195
Minimum0.64
Maximum29.86
Spec
Consumption
Mean16.65880.84056
95% Confidence Interval for MeanLower Bound14.6711
Upper Bound18.6464
Minimum14.65
Maximum22.14
Table 5. Correlation analysis of the studied indicators when traveling without auxiliary loads.
Correlations
TemperatureSpec ConsumptionLossesAverage Speed
TemperaturePearson Correlation10.5630.1660.517
Sig. (2-tailed) 0.1460.6940.190
N8888
Spec
Consumption
Pearson Correlation0.56310.6010.064
Sig. (2-tailed)0.146 0.1150.880
N8888
LossesPearson Correlation0.1660.60110.342
Sig. (2-tailed)0.6940.115 0.407
N8888
Average
Speed
Pearson Correlation0.5170.0640.3421
Sig. (2-tailed)0.1900.8800.407
N8888
Table 6. Descriptive statistics of the studied indicators when traveling with auxiliary loads.
Descriptives
StatisticStd. Error
TemperatureMean23.42220.74569
95% Confidence Interval for MeanLower Bound21.7027
Upper Bound25.1418
Minimum21.00
Maximum28.80
Average
Speed
Mean80.27784.00048
95% Confidence Interval for MeanLower Bound71.0527
Upper Bound89.5029
Minimum60.80
Maximum92.90
LossesMean32.68673.39347
95% Confidence Interval for MeanLower Bound24.8613
Upper Bound40.5120
Minimum21.05
Maximum49.69
Spec
Consumption
Mean18.12330.50706
95% Confidence Interval for MeanLower Bound16.9541
Upper Bound19.2926
5% Trimmed Mean18.0754
Minimum15.88
Maximum21.23
Table 7. Correlation analysis of the studied indicators when traveling with auxiliary loads.
Correlations
TemperatureAverage
Speed
LossesSpec
Consumption
TemperaturePearson Correlation1−0.644−0.3040.343
Sig. (2-tailed) 0.0610.4260.366
N9999
Average
Speed
Pearson Correlation−0.64410.396−0.191
Sig. (2-tailed)0.061 0.2920.622
N9999
LossesPearson Correlation−0.3040.39610.420
Sig. (2-tailed)0.4260.292 0.260
N9999
Spec
Consumption
Pearson Correlation0.343−0.1910.4201
Sig. (2-tailed)0.3660.6220.260
N9999
Table 8. Distribution of charging stations according to the total distance from and back to the main road.
Range (km)0.4–0.851–1.62.3–44.1–10>10
Number of charging stations54632
Table 9. Summary data for evaluating the functionality of visited charging stations in relation to their geographical distribution.
CriteriaAvailable in, Number of StationsMissing in, Number of Stations
Geographical locationEUnon-EUEUnon-EU
Roof over the charging area30143
Resting area (benches)20153
Availability of free Wi-Fi00173
Option for cash payments10163
Online information regarding the station’s functionality14132
Station status online11162
Online information on station occupancy10073
In terms of actual condition, only one of the twenty visited stations is non-operational, and it is located outside the EU.
Disclaimer/Publisher’s Note: The statements, opinions and data contained in all publications are solely those of the individual author(s) and contributor(s) and not of MDPI and/or the editor(s). MDPI and/or the editor(s) disclaim responsibility for any injury to people or property resulting from any ideas, methods, instructions or products referred to in the content.

