Article

Impact Assessment of Soil and Water Conservation Measures on Carbon Sequestration: A Case Study for the Tropical Watershed Using Advanced Geospatial Techniques

1
Department of Soil and Water Conservation Engineering, Mahatma Phule Krishi Vidyapeeth, Rahuri, Ahmednagar 413722, India
2
Department of Irrigation & Drainage Engineering, College of Agricultural Engineering and Technology, Anand Agricultural University, Godhra 389001, India
3
Department of Soil and Water Conservation Engineering, College of Agricultural Engineering and Technology, Anand Agricultural University, Godhra 389001, India
4
Department of Agricultural Engineering, Mahatma Phule Krishi Vidyapeeth, Rahuri, Ahmednagar 413722, India
*
Author to whom correspondence should be addressed.
Sustainability 2023, 15(1), 531; https://doi.org/10.3390/su15010531
Submission received: 7 December 2022 / Revised: 23 December 2022 / Accepted: 23 December 2022 / Published: 28 December 2022

Abstract

:
A sustainable method for protecting natural resources is the adoption of recommended soil and water conservation (SWC) measures. SWC measures are well recognized for their effective soil protection and water harvesting. Unfortunately, their significance in climate change mitigation has yet to receive global attention. The present study was conducted to highlight the applicability of SWC measures for carbon management in watersheds. In this study, the impact of SWC measures on land cover, soil erosion, carbon loss, and carbon sequestration were investigated using advanced techniques of remote sensing (RS) and geographic information systems (GIS). The study was conducted in the Central Mahatma Phule Krishi Vidyapeeth (MPKV) campus watershed, located in the rainfed region of Maharashtra, India. The watershed is already treated with various scientifically planned SWC measures. Following the implementation of conservation measures in the watershed, average annual soil loss was reduced from 18.68 to 9.41 t ha−1yr−1 and carbon loss was reduced from 348.71 to 205.52 kgC ha−1yr−1. It was found that deep continuous contour trenches (DCCT) constructed on barren, forest, and horticultural land have the soil carbon sequestration rates of 0.237, 0.723, and 0.594 t C ha−1yr−1, respectively, for 0–30 cm depth of soil. Similarly, compartment bunds constructed on agricultural land have a soil carbon sequestration rate of 0.612 t C ha−1yr−1. These findings can be of great importance in the planning and management of climate-resilient watersheds.

1. Introduction

Climate change is one of the greatest concerns in the world today and poses a direct threat to the livelihood, food security and economic development of most countries [1,2]. Anthropogenic activities are causing emissions of greenhouse gases (GHG), resulting in global warming, which has already raised Earth’s temperature and is projected to rise by more than 1.5 °C by the end of the century [3]. Without a proper action plan, dealing with the impacts of climate change will become more complicated in the future, leading to a global food crisis [4]. Sustainable land management strategies are needed to reduce the emissions occurring from land degradation. The major land degradation process that increases the carbon (C) emission in the atmosphere is soil erosion [5]. In India, at national level, soil erosion transports about 4.87 Pg (Petagram) of soil and 115.36 Tg (Teragram) of C every year, which consequently emits about 34.61 Tg of C to the atmosphere [6]. The carbon loss associated with the soil erosion is a major factor responsible for C emissions across Indian states. Among the major states in India, Madhya Pradesh has the highest value of soil erosion associated C loss (20.33 TgC yr−1), followed by Chhattisgarh (9.98 TgC yr−1), Maharashtra (9.18 TgC yr−1), Uttar Pradesh (9.11 TgC yr−1), and Andhra Pradesh (8.70 TgC yr−1) [6]. Therefore, region specific soil conservation strategies are needed to cope with the problem of soil and carbon loss in India.
Soil and water conservation (SWC) measures play a vital role in the management of natural resources in a sustainable way [7]. The implementation of SWC measures according to climatic and topographic conditions of the area is important for ensuring effective protection against soil erosion. The obstructions created by SWC measures reduce runoff, and subsequent sediment transportation that help to maintain soil quality and fertility [8]. The implementation of favourable SWC measures improves soil fertility, enhances soil water-holding capacity, rehabilitates degraded land and renovates land productiveness [9,10,11]. SWC measures not only help to protect the soil, but also to preserve and improve the storage of organic carbon in the soil.
The carbon flux between soil and the atmosphere is an important part of the global C cycle. The soil carbon pool is the third largest pool on the earth’s surface, which stores about 1500 Pg of C in the first metre of soil depth [12]. This pool is much larger than the atmospheric pool (800 Pg of C) and terrestrial vegetation pool (500 PgC) [13]. Higher soil organic carbon (SOC) content greatly improves agricultural productivity by changing soil properties. It improves soil aeration, water holding capacity, water infiltration, and drainage, which in turn increases soil fertility [14]. SOC is critical to maintaining soil quality, land management and food security. Therefore, the importance of SOC in the terrestrial ecosystem attracts global attention [15,16,17,18]. The focus of global efforts has been on both reducing emissions of GHGs and raising the stock of carbon in soil pools. The SWC measures have demonstrated their role in sediment capture and may serve as a natural C sink [19]. SWC measures provide a viable solution for decreasing soil erosion and increasing sediment deposition.
Terrestrial carbon sequestration through sustainable land management practices has gained prominence in recent years. A few global studies have examined the effectiveness of various SWC measures for carbon sequestration. But there hasn’t yet been a thorough investigation into how SWC measures affect soil erosion, carbon loss, and carbon sequestration. Mahajan et al. 2021 [20] studied the role of continuous contour trenches (CCT) in carbon sequestration in west coast of India. They found that CCT built at high density cashew plantations on 19% sloping land has a SOC sequestration rate (SOCSR) of 1.5 MgC ha−1yr−1, much higher than the control plots (0.9 MgC ha−1 yr−1). Adhikary et al. 2016 [21] studied the impact of contour hedgerow systems in combination with contour trenches on soil carbon sequestration in the Easter Ghats highlands of Odisha, India. They found that the loss of soil carbon in the treated area was reduced by 44.1–47.6% as compared to the control plot, and had a carbon sequestration rate of 1.62 Mg ha−1 yr−1 in the top 40 cm of soil. Similarly, Hailu and Betemariyam 2021 [22] studied the status of SOC stocks in farmlands treated with level soil bunds (LSB) for six years in Somodo Watershed, Ethiopia. They reported that farmlands treated with LSB had higher SOC stock (98.43 ± 11.55 Mg ha−1) than the control plot (93.01 ± 13.51 Mg ha−1). The process of capturing atmospheric carbon and storing it securely in soils for longer periods of time is known as soil carbon sequestration [23]. CO2 capture from the atmosphere involves three main steps: (1) absorption of atmospheric CO2 by plants through the process of photosynthesis, (2) transfer of CO2 into plant biomass, and (3) transfer of C from plant biomass to soil through the process of root respiration or decomposition, where it is stored in the form of SOC.
The impact of SWC measures on natural resource management is well recognized, but regional watershed-based technical information on the fate of SWC measures on carbon sequestration is scarce. The watersheds are ideal units from the perspective of management [24]. A healthy watershed is essential to our social, environmental, and economic well-being and it can be achieved through sound watershed management activities. Watershed development activities are incomplete without proper soil and water resource management. The incorporation of sustainable land management practices into watershed planning will aid in the development of watersheds that are more resilient to the impacts of climate change. Agronomical measures such as crop rotation, mulching, no-tillage, cover crops, and crop residue management have previously been validated for their effectiveness in carbon sequestration [25,26,27]. The primary limitation of these measures is that they only apply to agricultural fields. A comprehensive study on land area treatments such as deep CCT (DCCT) and compartment bunding (CB) was found to be lacking. The benefits of land area treatment include their suitability in a wide range of climatic and topographic conditions [28]. In addition, they are suitable for a variety of land types, including barren, forest, agricultural, etc. Therefore, efforts were made in this study to assess the impact of SWC measures on land cover, soil erosion, carbon loss, and carbon sequestration using advanced geospatial techniques.
In recent times, remote sensing data has found widespread use in many fields of natural resource management [29]. It has emerged as a potentially ideal data source for planning and monitoring watersheds, due to the availability of data from a variety of sensors across a number of platforms, all of which can capture information at a variety of spatial, temporal, radiometric, and spectral resolutions [29,30]. Nowadays, environmental processes in the watershed have been monitored using Remote Sensing (RS) and Geographic Information System (GIS)-based models. Also, artificial intelligence-based models are becoming increasingly prominent in the field of environmental monitoring [31,32]. In the present study, RS and GIS were utilized for change detection analysis, soil loss, and carbon loss estimations. The study was conducted in the Central Mahatma Phule Krishi Vidyapeeth (MPKV) Campus watershed, located in the Maharashtra state, India. The watershed is already treated with various scientifically planned SWC measures. The study aimed to evaluate the impact of DCCT constructed on barren, forested, and horticultural land, as well as CB constructed on agricultural land.

2. Material and Method

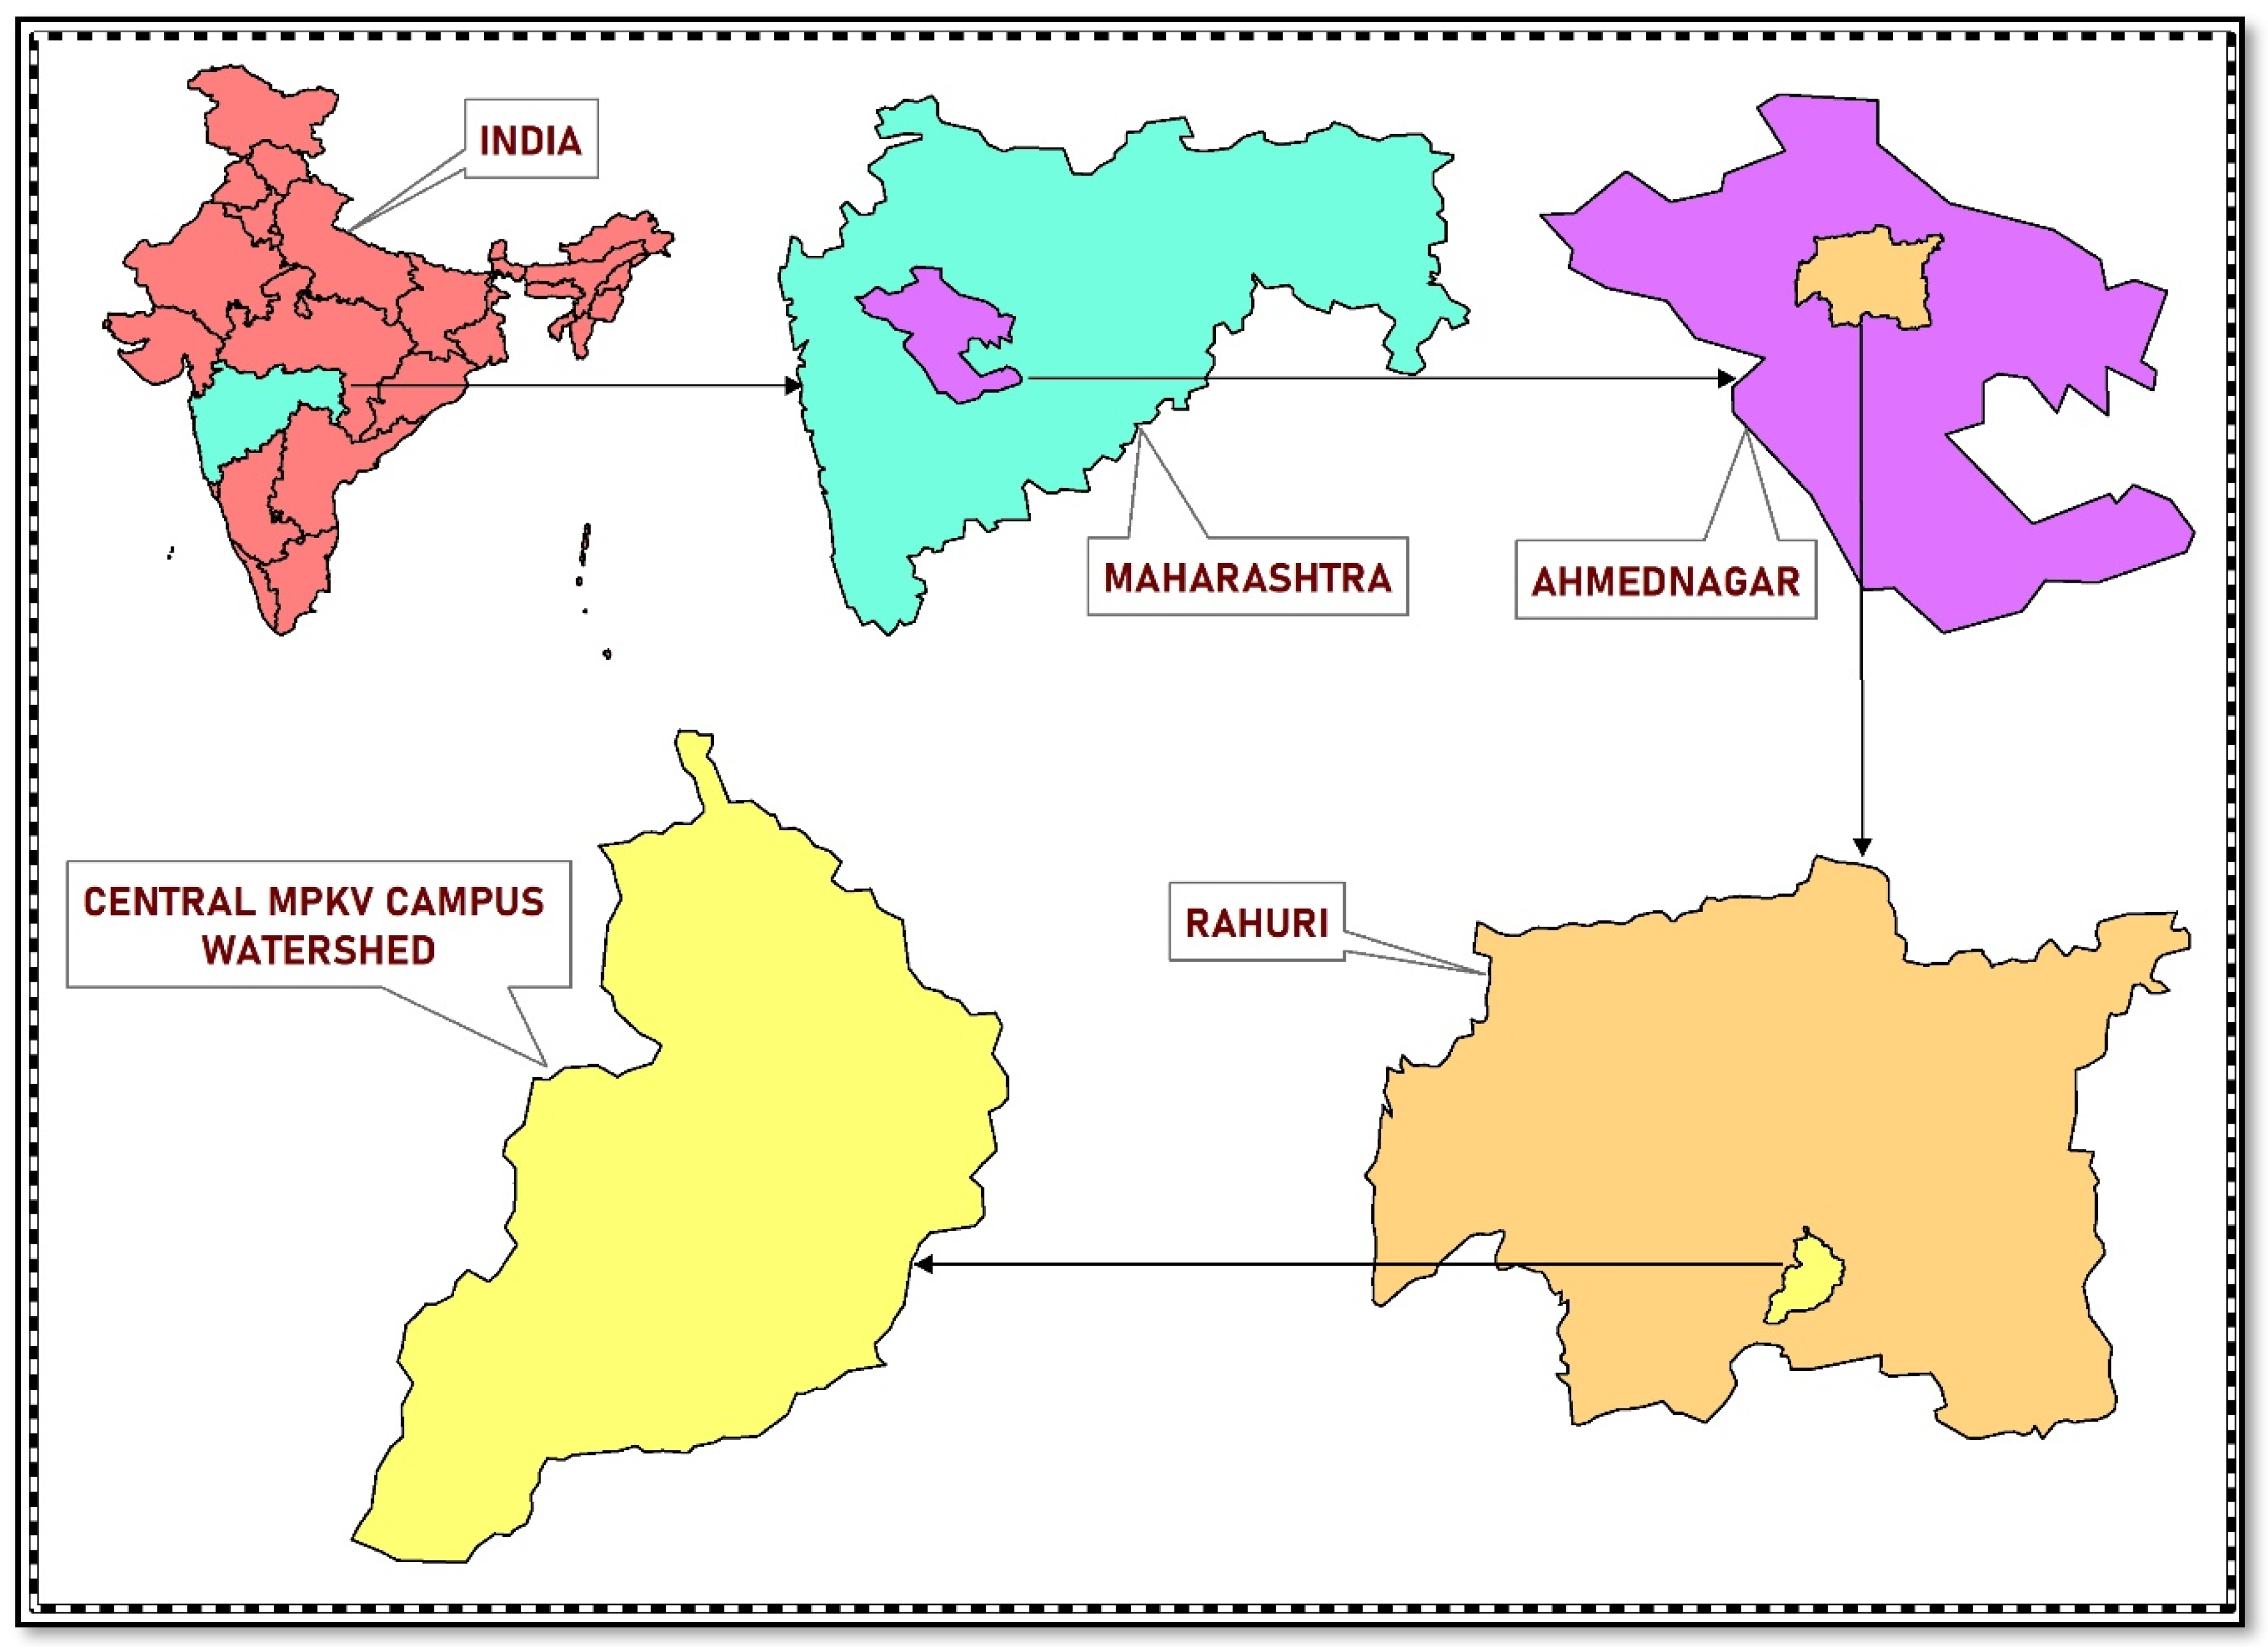
2.1. Description of Study Area

The study was conducted at the “Central MPKV Campus” watershed, located in the Ahmednagar district of Maharashtra State, India. The total geographical area of the watershed is 1260 ha (12.60 km2). The study area lies in the rain shadow region of Sahyadri mountain ranges and receives an average annual rainfall of 592 mm. The study area is primarily subjected to monsoon rainfall, with the main rainy season lasting from late June to early September. The study area is located between latitudes 19°21.77′ N and 19°18.73′ N and longitudes 74°37.79′ E and 74°36.49′ E. The climate in the study area is hot and dry, with normal lowest and highest annual temperatures of 19 °C and 31 °C, respectively. The elevation of the study area from mean sea level varies from 441 m near the outlet of the watershed to 542 m at the extreme end of the watershed. The location map of the study area is shown in Figure 1.

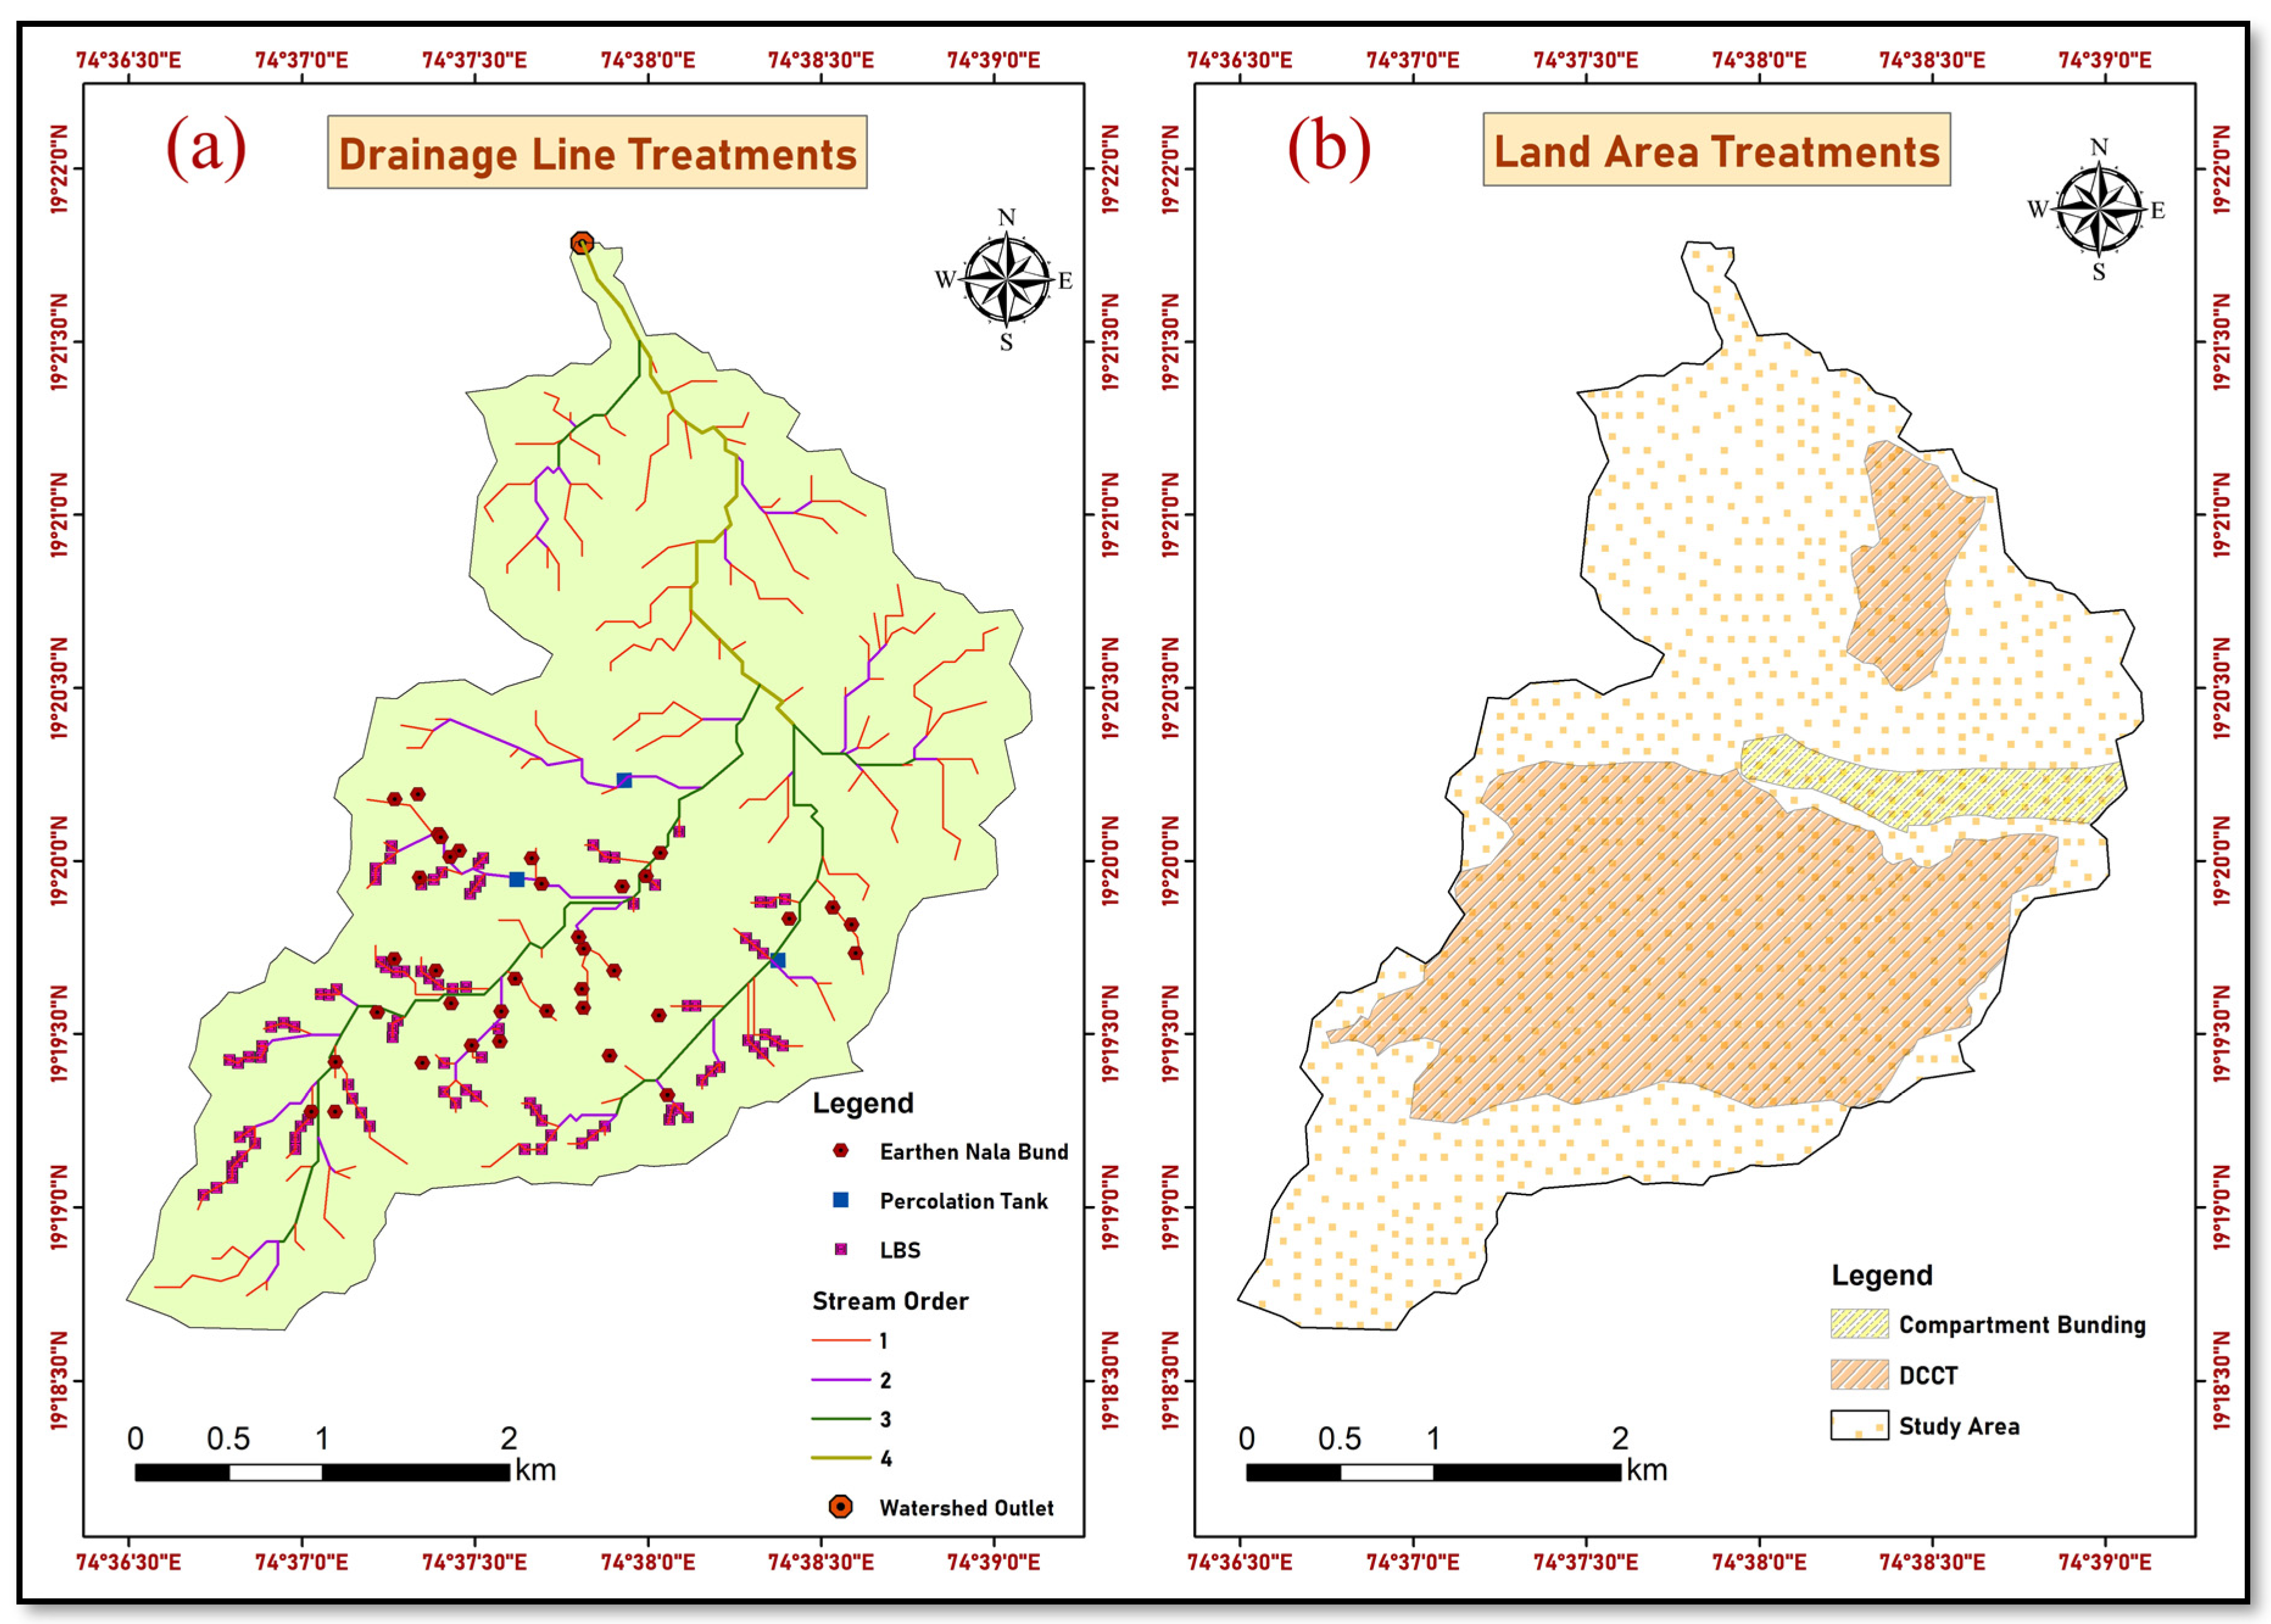
2.2. Soil and Water Conservation Measures in the Watershed

The Central MPKV Campus watershed is treated with various soil and water conservation measures to minimize soil loss and maximize water availability. It includes both drainage line treatments and land area treatments. Drainage line treatments are those built-in streams or rivers, whereas land area treatments are built on plain lands. The construction of various SWC measures in the watershed began in 2017 and were completed in 2018. SWC treatments were applied to 545 ha of the total study area. The treatment implemented in the watershed is based on the watershed’s climatic and physiographic characteristics. The details of various SWC measures constructed in the watershed are given in Table 1 and Figure 2.

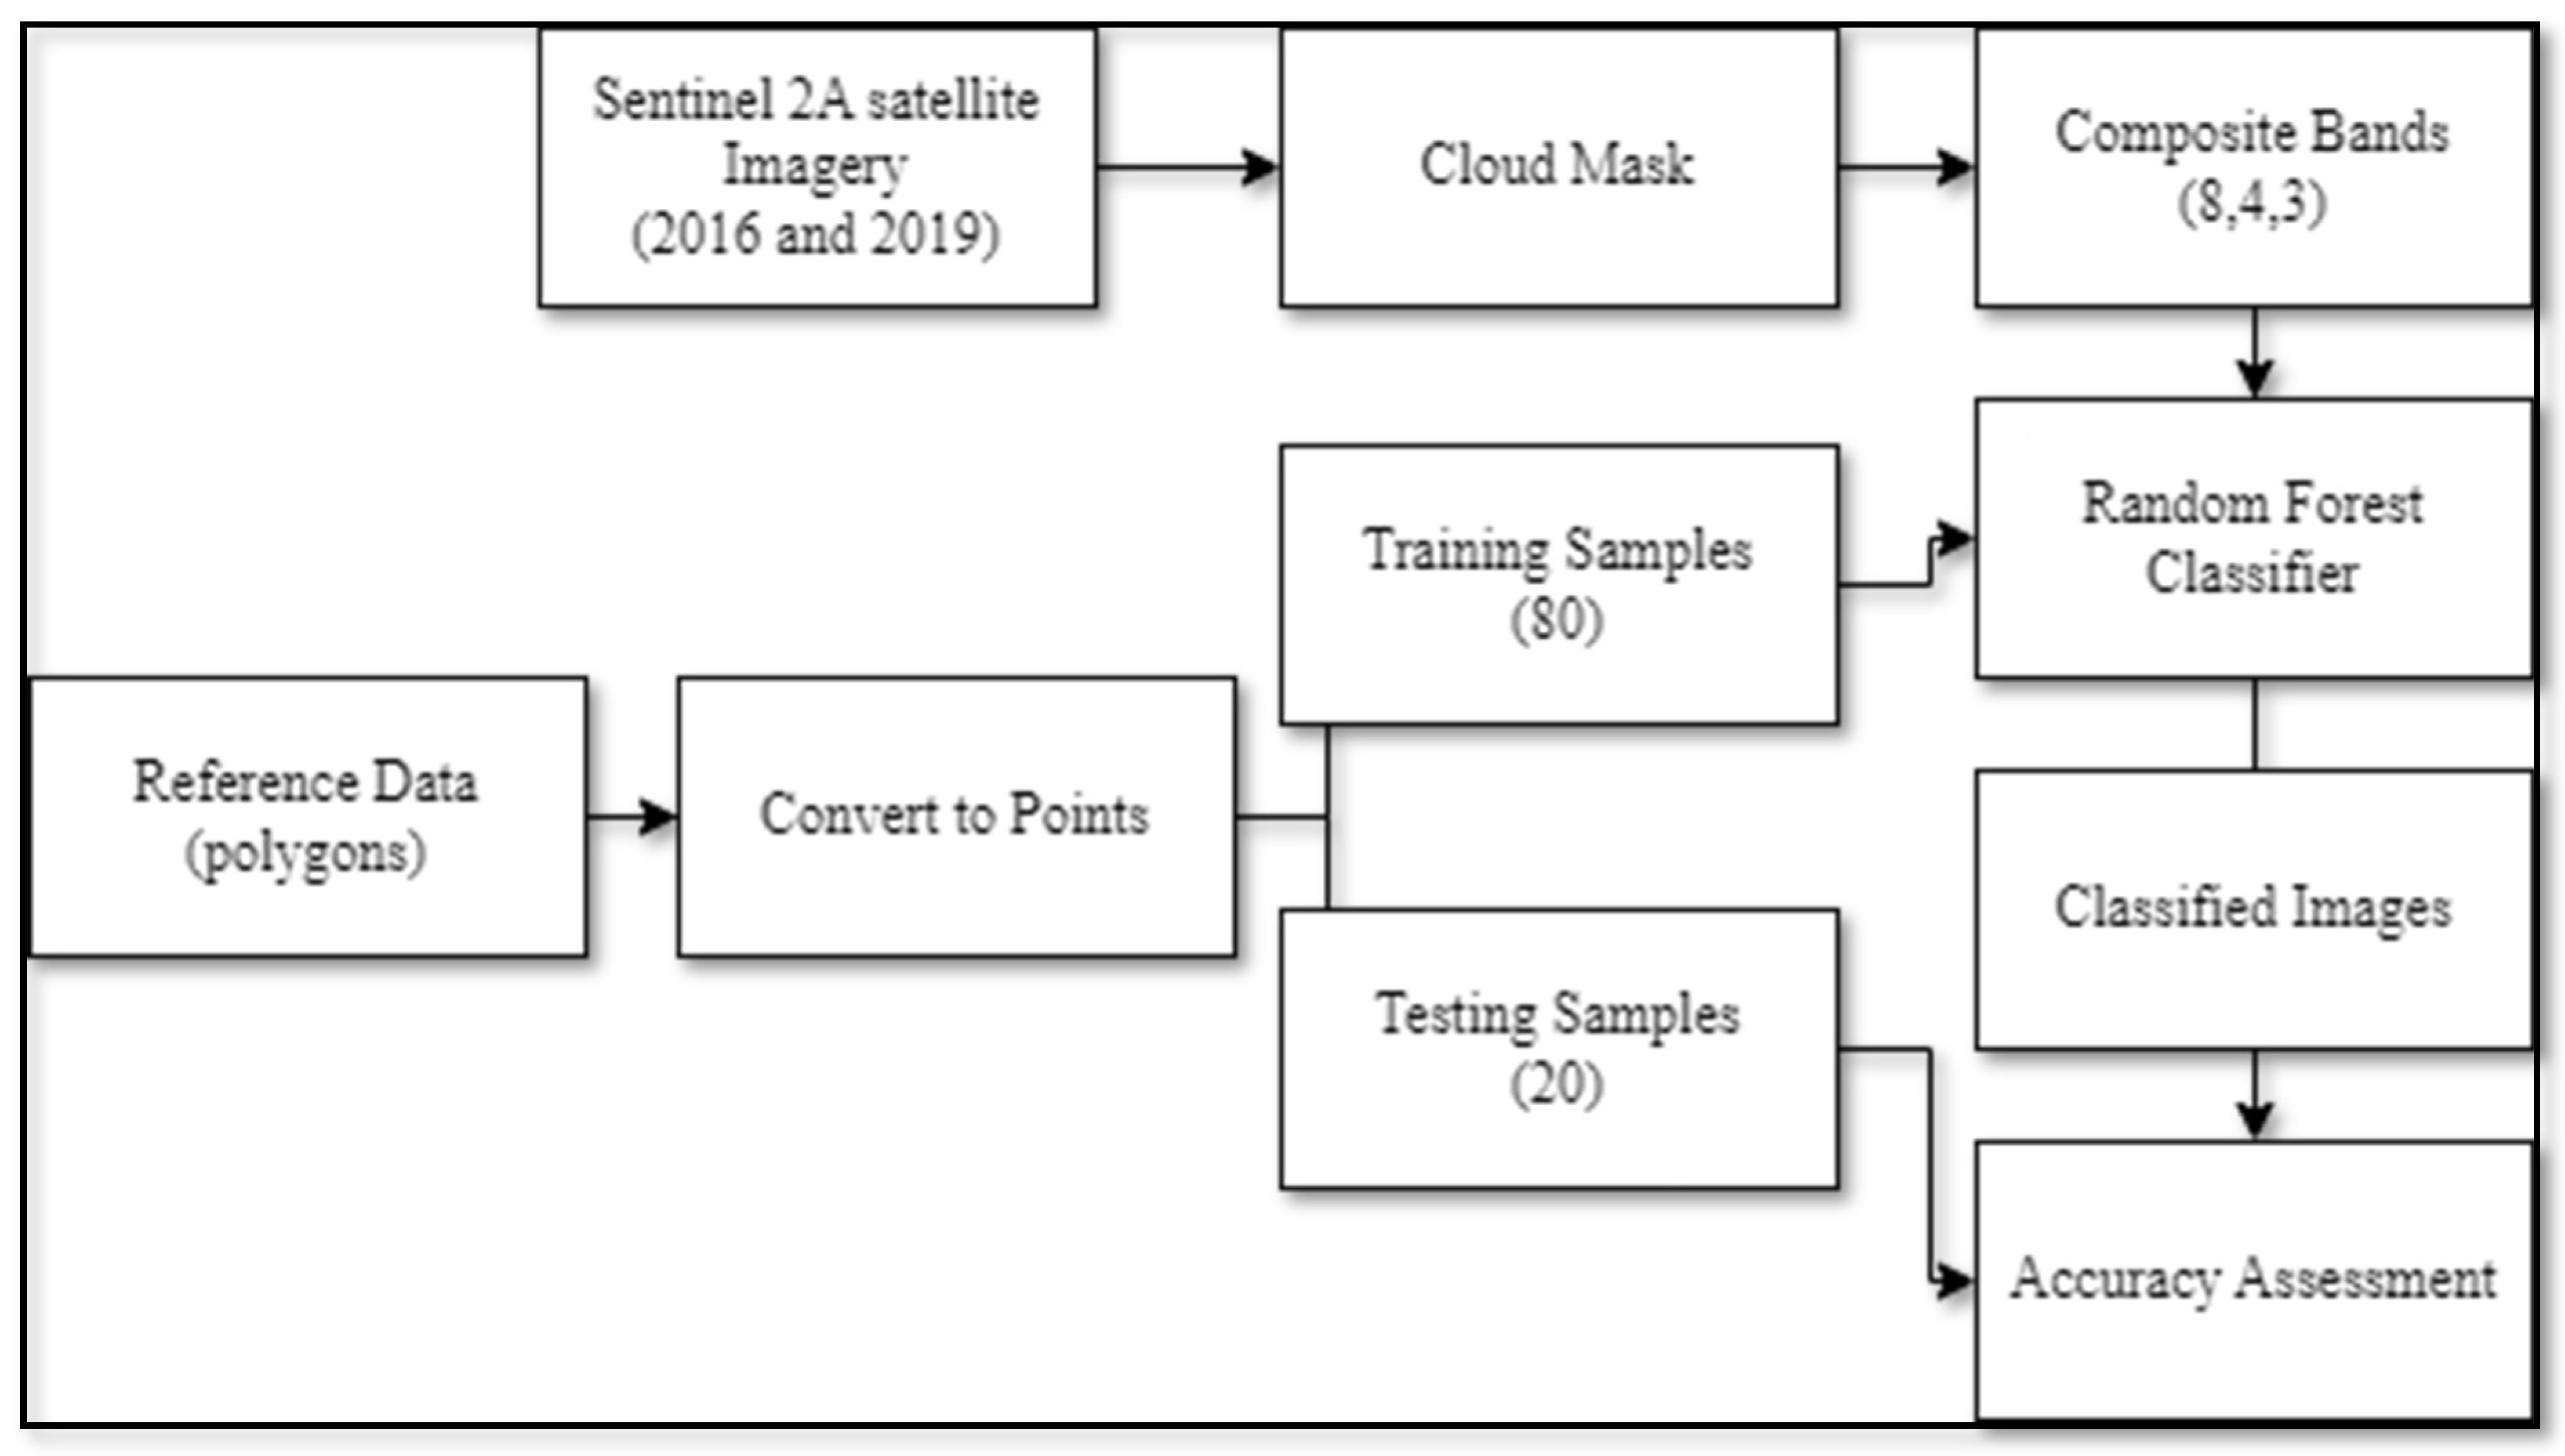
2.3. Change Detection Analysis of Watershed

The impact of SWC measures on land cover was analysed by change detection analysis. Change detection analysis is used to identify the changes of the object or phenomenon at different time intervals [33]. In the present study, a change detection analysis was performed using satellite imagery and Google Earth Engine (GEE) software. Sentinel 2A satellite imagery was acquired from the United States Geological Survey (USGS) EarthExplorer portal (https://earthexplorer.usgs.gov/ accessed on 15 June 2022) for 2016 and 2021, to perform change detection analysis. Two land use land cover (LU/LC) maps were prepared of the watershed, one before conservation measures, for 2016, and other after conservation measures, for 2021. The Random Forest Image classification technique was used in the GEE platform to create the LU/LC maps of the study area. Image classification accuracy assessment was performed using the Kappa coefficient and ground truth points. The changes in land cover were analysed over a period of five years (2016 to 2021). The flow chart of the methodology used for the creation of LU/LC maps is shown in Figure 3.

2.4. Estimation of Soil Loss from Watershed

Soil loss associated with water erosion is one of the most serious and challenging land management issues [34]. The problem of soil loss can be overcome by adopting site specific SWC measures. In the present study, impact of SWC measures on soil loss was analysed by comparing the soil loss rate from the watershed before conservation measures and after conservation measures. The soil loss from the watershed was estimated for 2016 (without any SWC measures) and 2021 (with SWC measures). The universal soil loss equation (USLE) proposed by Wischmeier and Smith (1978) [35], in conjunction with advanced geospatial tool, weas used to estimate the soil loss from the watershed. The different USLE parameters were derived in the Arc GIS 10.8 software. The different USLE parameters are given in Equation (1) and their data sources are described in Table 2.
A = R × K × L S × C × P
where, A = Estimated average annual soil loss in tonnes/ha/year, R = Erosivity of rainfall in MJ-mm/ha-hr-year, K = Soil erodibility factor in tonnes-ha-hr/ha-MJ-mm, LS = Slope length factor also known as topographic factor, dimensionless, C = Crop management factor, dimensionless, and P = Conservation Practice factor, dimensionless.

2.5. Description of USLE Parameters

2.5.1. Rainfall Erosivity Factor (R)

The R factor of study area was calculated using regression equation developed specifically for the hot and dry regions of Rahuri tehsil. The average annual rainfall over the last 30 years (1991 to 2021) was used to calculate the R factor. The R factor value was kept constant for estimating soil loss before and after conservation measures. The Equation (2) was used to calculate the R factor:
R   = 0.0022 X 2 + 0.7526 X   + 152.35
where, R = Annual Erosivity, MJ-mm/ha-hr-yr, and X = Annual Rainfall, mm.

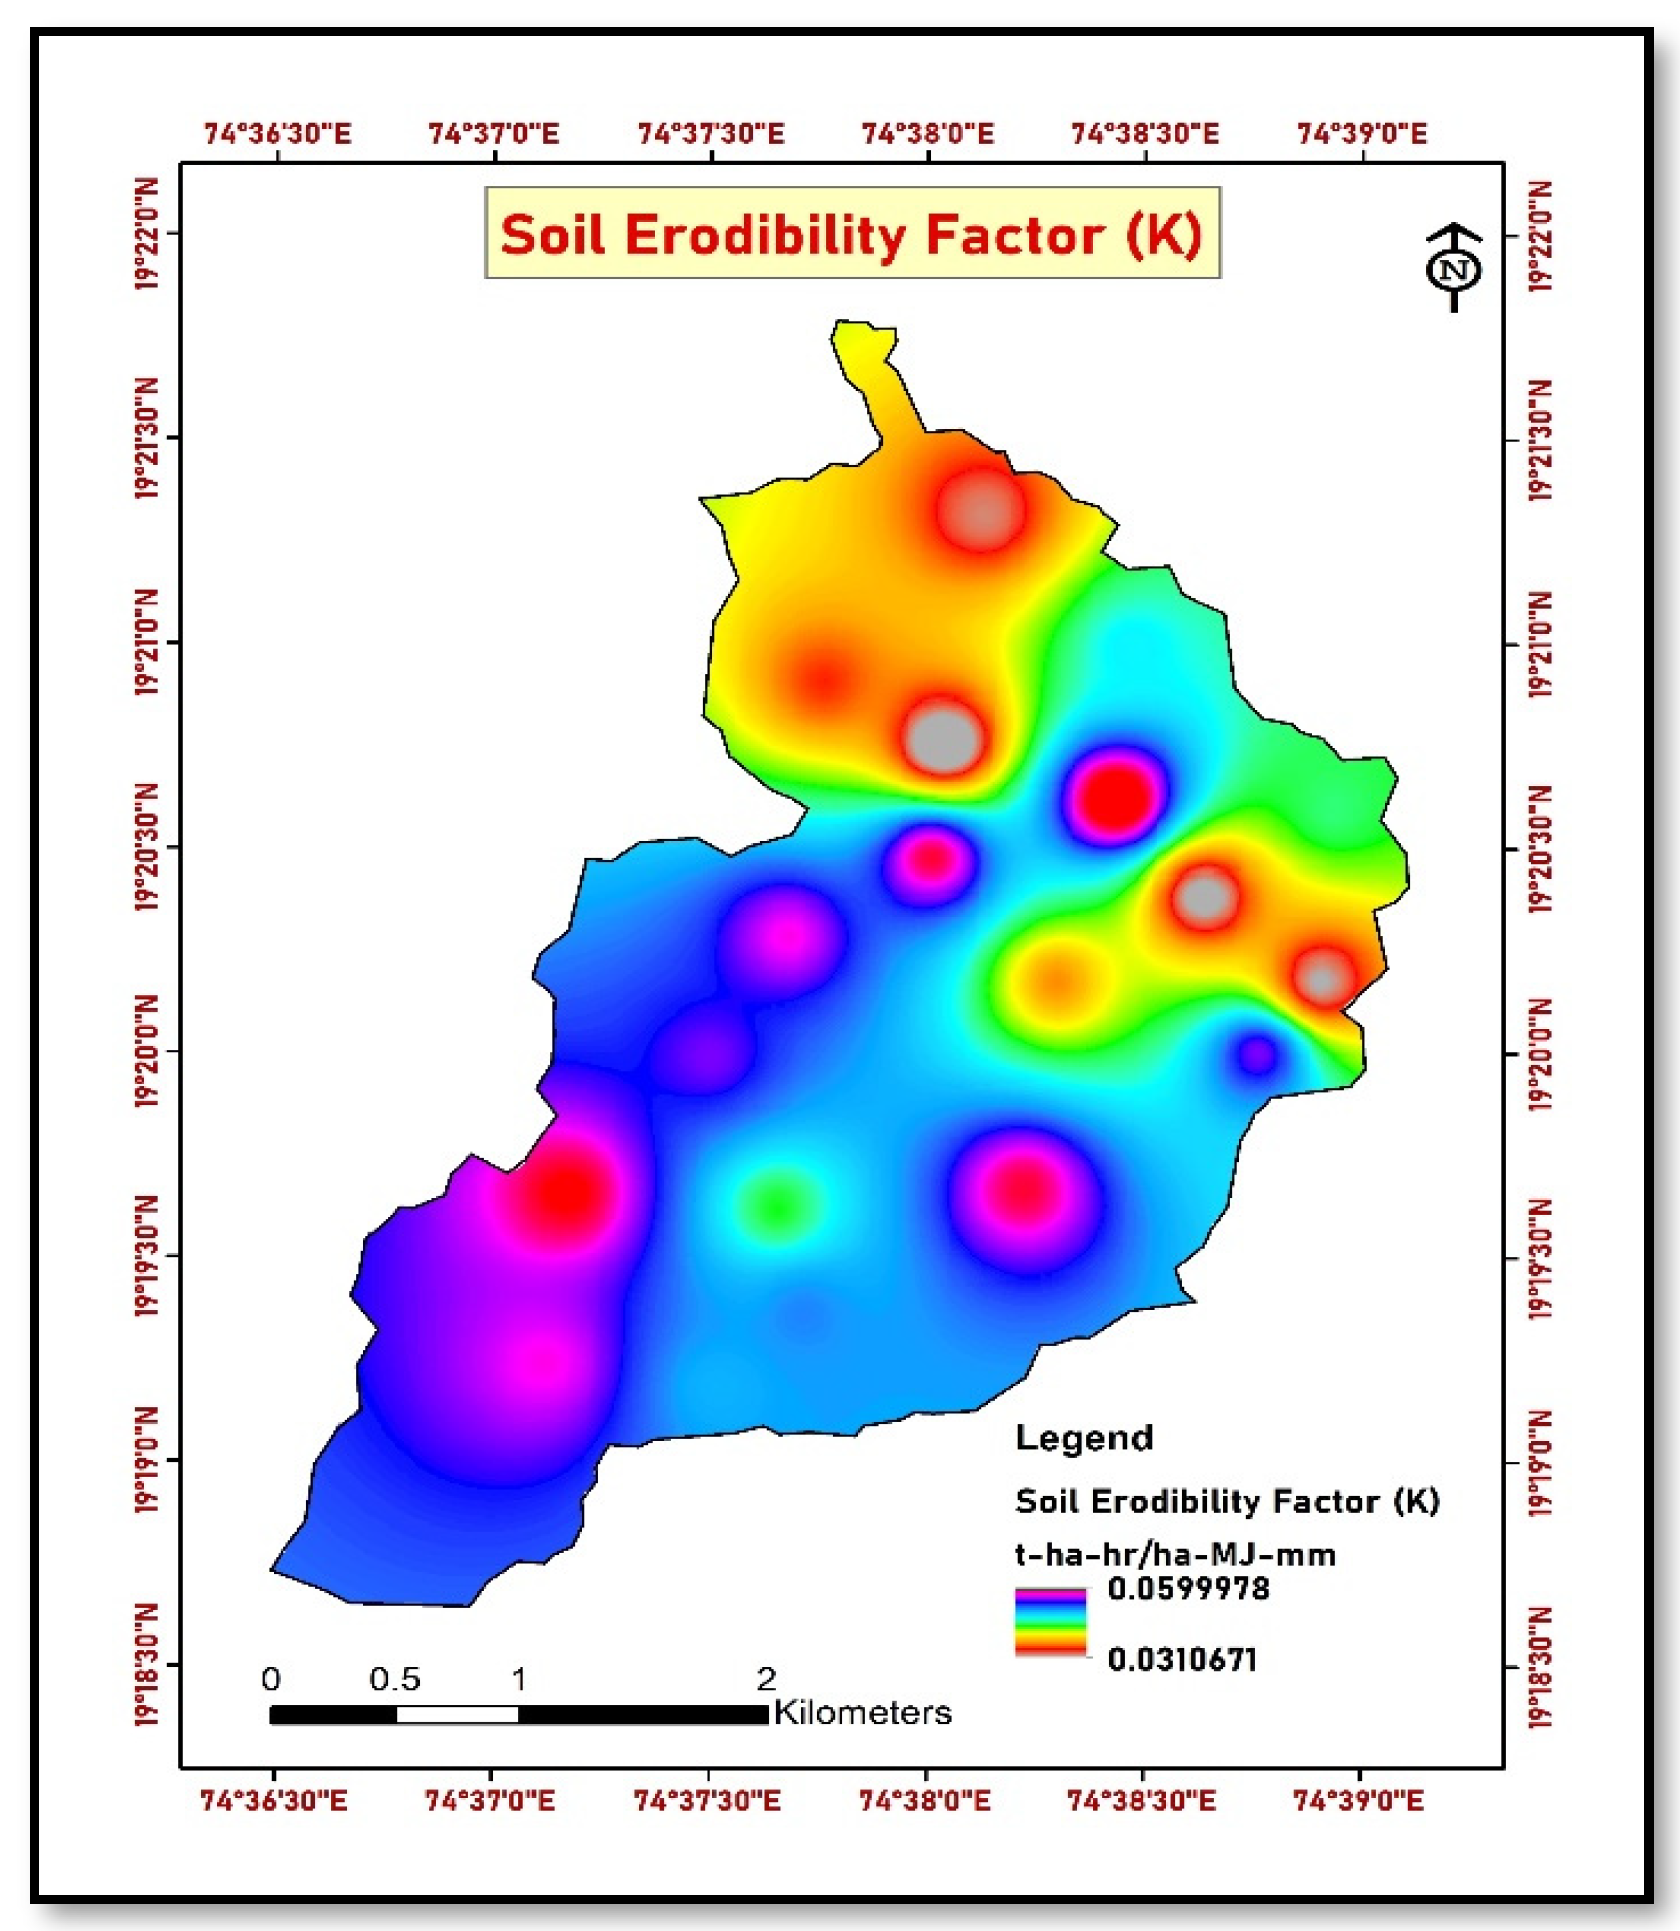
2.5.2. Soil Erodibility Factor (K)

K is a measure of the susceptibility of soil particles to the detachment and transport by rainfall and runoff. Texture is the principal component affecting the K factor, but soil structure, soil organic matter, and permeability of soil also contribute [36]. A total of 50 soil samples were collected from the study area using the grid sampling method. The collected soil samples were analysed in a soil testing laboratory to determine soil physicochemical properties such as soil texture, structure, organic carbon, and permeability. The K factor was calculated using Equations (3) and (4), and mapped using ArcGIS software [37,38,39]. It was observed that soil physical properties (soil texture) did not change over the period of five years, therefore the K factor values for before and after conservation measures were kept unchanged.
K ( factor ) = 2.77 × 10 7 ( 12 OM )   M 1.14 + 4.28 × 10 3 ( s 2 ) + 3.29 × 10 3 ( p 3 )
where
M = [ ( 100 C ) ( L + A r m f ) ]
C is the clay percentage (< 0.002 mm), L is silt percentage (0.002–0.05 mm), Armf is the percentage of very fine sand (0.05–0.1 mm), OM is the organic matter content (%), p is a code denoting the class of permeability, and s is a code for the structure size.

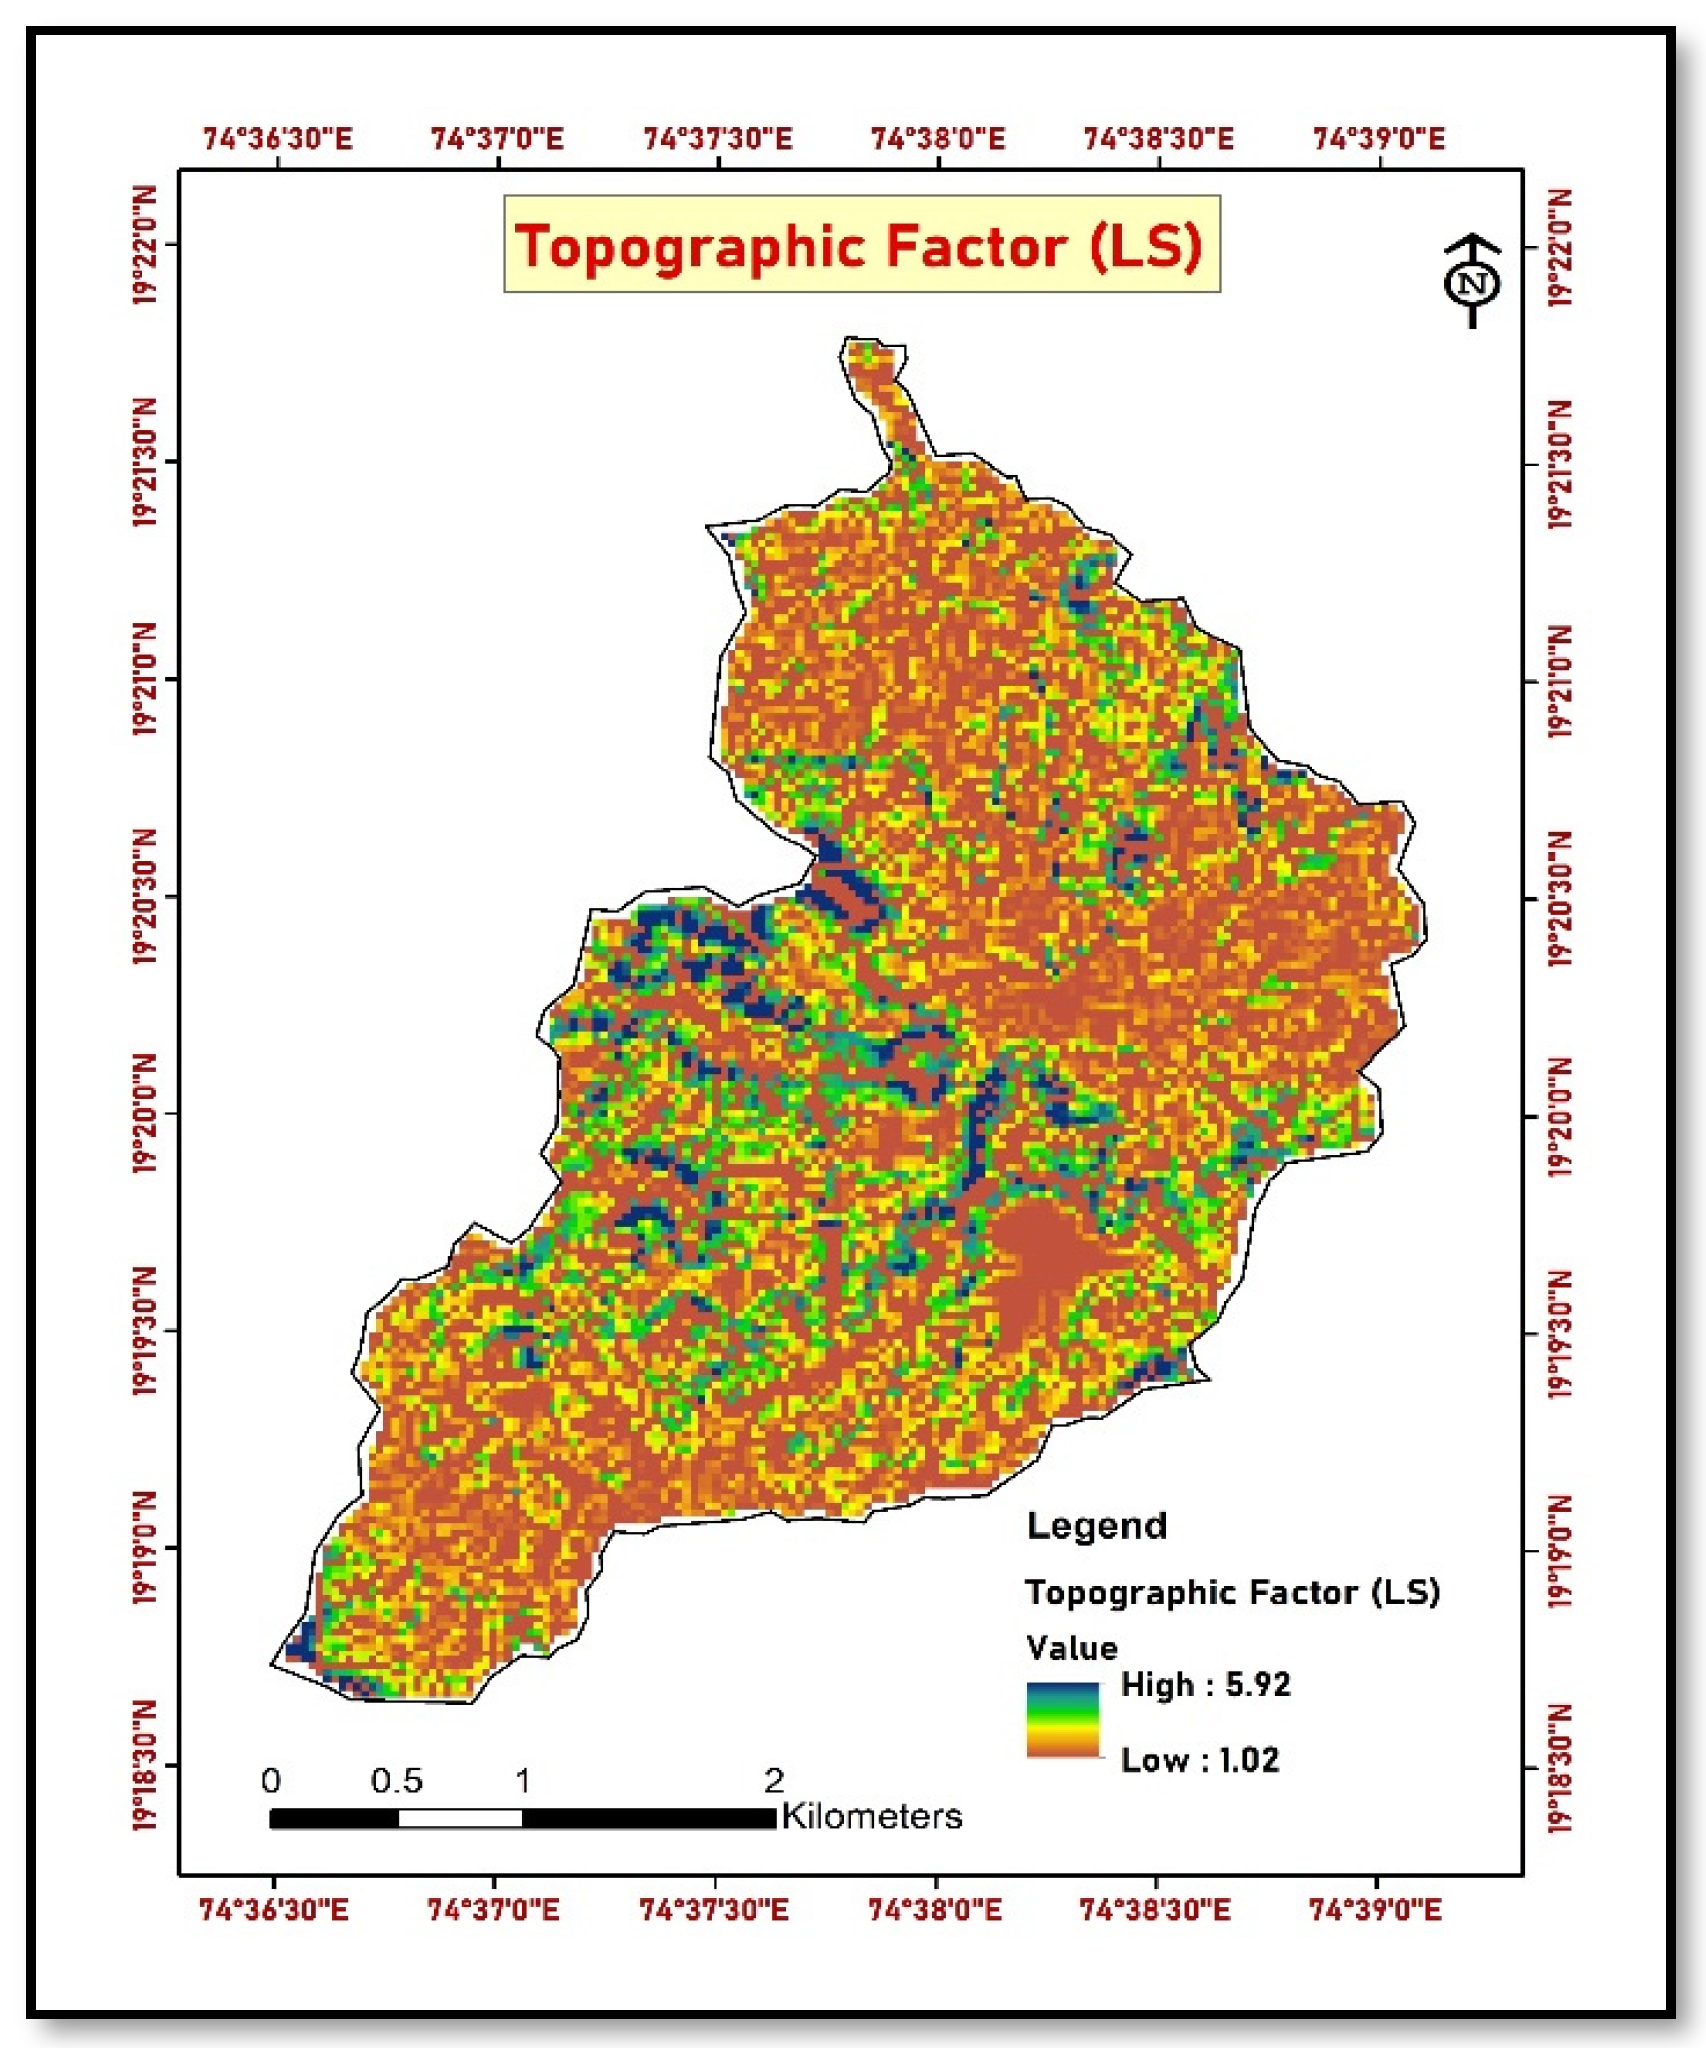
2.5.3. Slope Length Factor (LS)

The LS factor is a ratio between soil loss, under specific circumstances, and soil loss at a site with 9% slope steepness and a slope length of 22.13 m. The risk of erosion increases with slope steepness and length [40]. The Shuttle Radar Topography Mission (SRTM) Digital Elevation Model (DEM) with a spatial resolution of 30 m was used to prepare a slope map of the study area. The DEM was pre-processed in ArcGIS environment to remove discontinuation in the data set, and then, different thematic layers such as flow direction, flow accumulation, slope steepness, and slope gradient were prepared. The Equations (5) and (6) developed by Wischmeier and Smith (1978) [35] were used to generate an LS factor map of the study area. A similar approach was also followed by other researchers [41,42,43]. It was observed that slope steepness and flow length did not change significantly in the five-year period, therefore the LS factor was kept constant for measuring soil loss before and after conservation measures.
LS = ( X / 22.1 ) m   ( 0.065 + 0.045 S + 0.0065 S 2 )
X = ( FLow   Accumulation × Cell   size   value )
where, LS = slope length − steepness factor/Topographic factor, S = slope gradient (%), X = length of slope (m), and m = exponent (slope-length exponent).

2.5.4. Crop Management Factor (C)

C factor is the ratio of soil loss, on land managed for a given crop, to soil loss, on land that is continually fallow or tilled [35]. LU/LC maps prepared before and after conservation measure scenarios were used to generate C factor maps of the study area. C factor values obtained from different literature, for different land covers, were assigned in Arc GIS software and the C factor map of study area was prepared. There was significant change in the land cover before and after the conservation measures, therefore two C factor maps were generated, one for before conservation measures, and other for after conservation measures. The C factor values assigned for different land covers are given in Table 3.

2.5.5. Conservation Practice Factor (P)

The P factor indicates the effects of activities that lower the volume and rate of water runoff, hence reducing erosion. The P factor is the ratio of soil loss caused by a soil conservation practice to that caused by straight-row farming up and down the hill [35]. The P factor value of one was given for the entire watershed before conservation measures. After conservation measures were made, the area under different conservation measures in the watershed was mapped by conducting a field survey. The GPS device was used to map the area under different conservation measures. P factor values obtained from previous literature were assigned to the respective conservation measures in the ArcGIS 10.8 software.
The five layers of different USLE parameters, generated in Arc GIS software, were overlapped using raster calculator tool. The two raster layers of soil loss, one before conservation measures and another after conservation measures, were prepared. The soil loss was classified into five different classes ranging from slight to severe. The change in the area under different soil erosion classes, due to conservation measures, was analysed.

2.6. Estimation of Carbon Loss from Watershed

The soil erosion and subsequent sediment transport through the runoff had a profound effect on the carbon budget of terrestrial ecosystem [46]. The intensified soil erosion leads to the increased carbon emissions [47]. Breakdown of structural aggregates, due to soil erosion, is responsible for the release of soil organic carbon into the atmosphere [48]. Carbon loss due to land degradation is the function of soil loss, soil organic carbon content, and the carbon enrichment ratio (CER). In the present study carbon loss, associated with soil loss, was estimated using Arc GIS software. The C-loss from the watershed, before and after conservation measures, was estimated using Equation (7) developed by Mandal et al. (2020) [6]. Soil loss, soil organic carbon, and CER in the three raster layers were generated in the Arc GIS software. Soil loss layer was generated using the USLE model. Soil organic carbon data, for before conservation measures, was obtained from the Department of Soil and Water Conservation Engineering, MPKV, Rahuri and SOC data, for after conservation measures, was collected though soil sampling. A total of 50 soil samples were collected in 2021 and analysed in the soil laboratory to estimate SOC content. The CER values, recommended for the conditions of Maharashtra state (Table 4), by Mandal et al. (2020) [6], were used to prepare CER layer.
C l o s s   ( t h a y r ) = S o i l   l o s s   ( t h a y r ) × SOC   ( % ) × CER 100

2.7. Estimation of Impact of SWC Measures on Carbon Sequestration

2.7.1. Soil Sampling

The soil samples were collected from 0 to 15 cm and 15 to 30 cm depths by using a soil sampling auger. The soil samples were collected from 48 different locations of watershed, covering different land cover patterns. The soil samples were collected from two major land area treatments (DCCT and CB) and four major land covers of the watershed (agricultural, forest, barren, and horticultural lands). The sampling was carried out during the month of January for three consecutive years 2020, 2021, and 2022. The impact of four major treatments was assessed on carbon sequestration: (1) Agricultural land treated with CB (T1), (2) Barren land treated with DCCT (T2), (3) Forest land treated with DCCT (T3), and (4) Horticultural land treated with DCCT (T4). Twelve soil samples were taken from each treatment (T1, T2, T3, and T4).

2.7.2. Soil Analysis

The collected samples were analysed in the soil laboratory of the Department of Soil and Water Conservation Engineering, MPKV, Rahuri, India, to estimate the physicochemical properties of soil, using standard procedures. The bulk density of soil was determined using the clod method [49]. The SOC was determined using the wet oxidation method by Walkley and Black [50]. The soil texture was determined using the Hydrometer method [51].

2.7.3. Soil Organic Carbon Stock and SOC Sequestration Rate

The SOC Stock was calculated for two different layers of 0–15 cm and 15–30 cm depths. The calculations of SOC stock were completed using the measured SOC, BD, and depth or thickness, of each layer separately. The SOC stock was calculated using the formula given in Equation (8) [52].
S O C   s t o c k   ( t h a ) = S O C   ( % ) 100 × B D   ( g m c c ) × s o i l   t h i c k n e s s × 10,000
Further, the total SOC stock up to a maximum 30 cm depth was calculated by adding the SOC stock of 0 to 15 cm and 15 to 30 cm depths. The soil C sequestration rate (CSR) was calculated by comparing the SOCS for a particular treatment for the particular year to that of the preceding year. The total SOC sequestered was the difference between the SOC stock in a given year and that for preceding year. The CSR was calculated using Equation (9),
S O C   s e q u e s t r a t i o n   r a t e   ( t h a / y r ) = ( C Y C Y 1 ) / n
where CY = Soil carbon stock in the year Y, CY−1 = Soil carbon stock in the year Y−1, and n = time period.

3. Statistical Analysis

The data of OC, BD, and SOC stock were analysed using a one-way analysis of variance (ANOVA) and the results were compared at a 5% (p < 0.05) level of significance. The statistical analysis of data was performed in Microsoft Excel 2019.

4. Result and Discussion

4.1. Impact of SWC Measures on Land Cover

The watershed was classified into seven major LU/LC classes namely agriculture, barren, current fallow, forest, horticulture, settlement, and waterbody. The result of land cover classification achieved through satellite imagery are presented in Table 5 and Figure 4. The overall accuracy of image classification and Kappa coefficient for the watershed were 88% and 0.78, respectively, for the before conservation measures image, and 89% and 0.80, respectively, for after conservation measures image.
It was observed that SWC measures implemented in the watershed significantly affected the land utilization within the watershed. Agriculture, natural vegetation, horticulture, settlements, and waterbody land cover classes expanded in area. In contrast, the extent of barren and current fallow land decreased. The highest positive increase in area was observed in agricultural land cover, which increased by 41.89%, while the lowest positive increase was observed in horticultural land cover, which increased by 22.32%. The increased demand for food and source of employment generation increased agricultural area in the watershed. The highest negative increment in the watershed was observed in the current fallow land cover, which decreased by 56.81%. Before the SWC measures, the fallow land in the watershed was 93.74 ha, which was due to the scarce availability of water for irrigation purposes. But after the implementation of SWC measures in the watershed, water availability increased rapidly, leading to the conversion of fallow land and current fallow land for agricultural food production. Barren land in the watershed decreased rapidly by 21.05%, which was converted for use as agriculture, forest, settlement, and waterbody. The increased population and living standards increased the demand for residential buildings and transportation networks which significantly increased settlement area in the watershed by 24.71%. The SWC measures implemented in the watershed harvested and conserved rainwater, which helped to replenish groundwater and increased surface water storage area. The surface water storage area in the watershed increased by 26.04%. This additional water harvested in the watershed is utilized for agriculture, domestic use, and livestock purposes. The increased water availability in the watershed increased the overall vegetation area from 35%, in 2016, to 50%, in 2022. It was found that SWC measures not only helped in the conservation of natural resources but also increased the socioeconomical status of the people living in the watershed.

4.2. Impact of SWC Measures on Soil Erosion

4.2.1. Soil Loss from Watershed before Conservation Measures

R Factor

The average annual rainfall in the watershed for a 30-year period (1991 to 2021) is 592 mm, resulting in rainfall erosivity (R) of 478.19 MJ-mm/ha-hr-yr. The mean annual erosivity of the watershed reveals that the site is in the moderate erosion risk zone. The estimated moderately low rainfall erosivity index for the study area presages further risk of soil erosion hazards, especially under conditions of increasing rainfall.

K Factor

The soil erodibility (K) in the study area varied from 0.0310 to 0.0599 t-ha-hr/ha-MJ-mm (Figure 5). The watershed has three major types of soil: sandy clay loam, sandy loam, and clay loam. Among the different soil types found within the watershed, sandy loam soil has the highest erodibility value and clay loam soil has the lowest. The soil type wise average K factor values are given in Table 6. The lower soil erodibility value indicates lower susceptibility of soil to erosion, and vice versa. The permeability of soils in the watershed ranged from 16 to 42 mm/hr. So, the majority of soil comes under the moderate permeability class [53]. Therefore, permeability code 3 was used for estimation of the K factor. The soil structure in the watershed is medium or course granular (1–2 mm). Therefore, the structure code of 2 was used for the erodibility estimation.

LS Factor

The topographic factor for watershed varied from 1.02 in the plain areas to 5.92 in the hilly areas (Figure 6). The slope of the watershed ranges from 0 to 30.23%, with a mean slope of 4.17%. Around 90% of the watershed had a slope in the range of 0–9%, with the remaining 10% having a slope greater than 9%. A lower value of the LS factor is an indicator of low slope length and low slope, and vice versa. The higher the value of the LS factor, the greater the chance of a severe soil hazard.

C Factor

The before conservation measures land cover classification of the watershed indicated that barren land is the dominant land cover among the other land covers (Figure 7a). The barren land has a maximum C-factor value, indicating that the area is at high risk of erosion. Similarly, a lower value of C-factor (0.04) was assigned to the dense vegetation cover that was found in forest areas. The C factor was set to 0 for waterbodies and settlement areas because the soil is completely covered with other medium in these areas. The C factor values are high for those land covers where obstruction to soil erosion is less, and low C factor values are for those land covers where there is greater obstruction to the eroding soil.

P Factor

The P factor value generally ranges from 0 to 1. A zero value indicates there is complete protection of SWC measures against soil erosion, whereas one value indicates no protection of SWC measures against soil erosion. Before the introduction of the conservation measures scenario, there was no conservation measure implemented in the watershed. The P factor value of 1 is considered for the entire watershed.

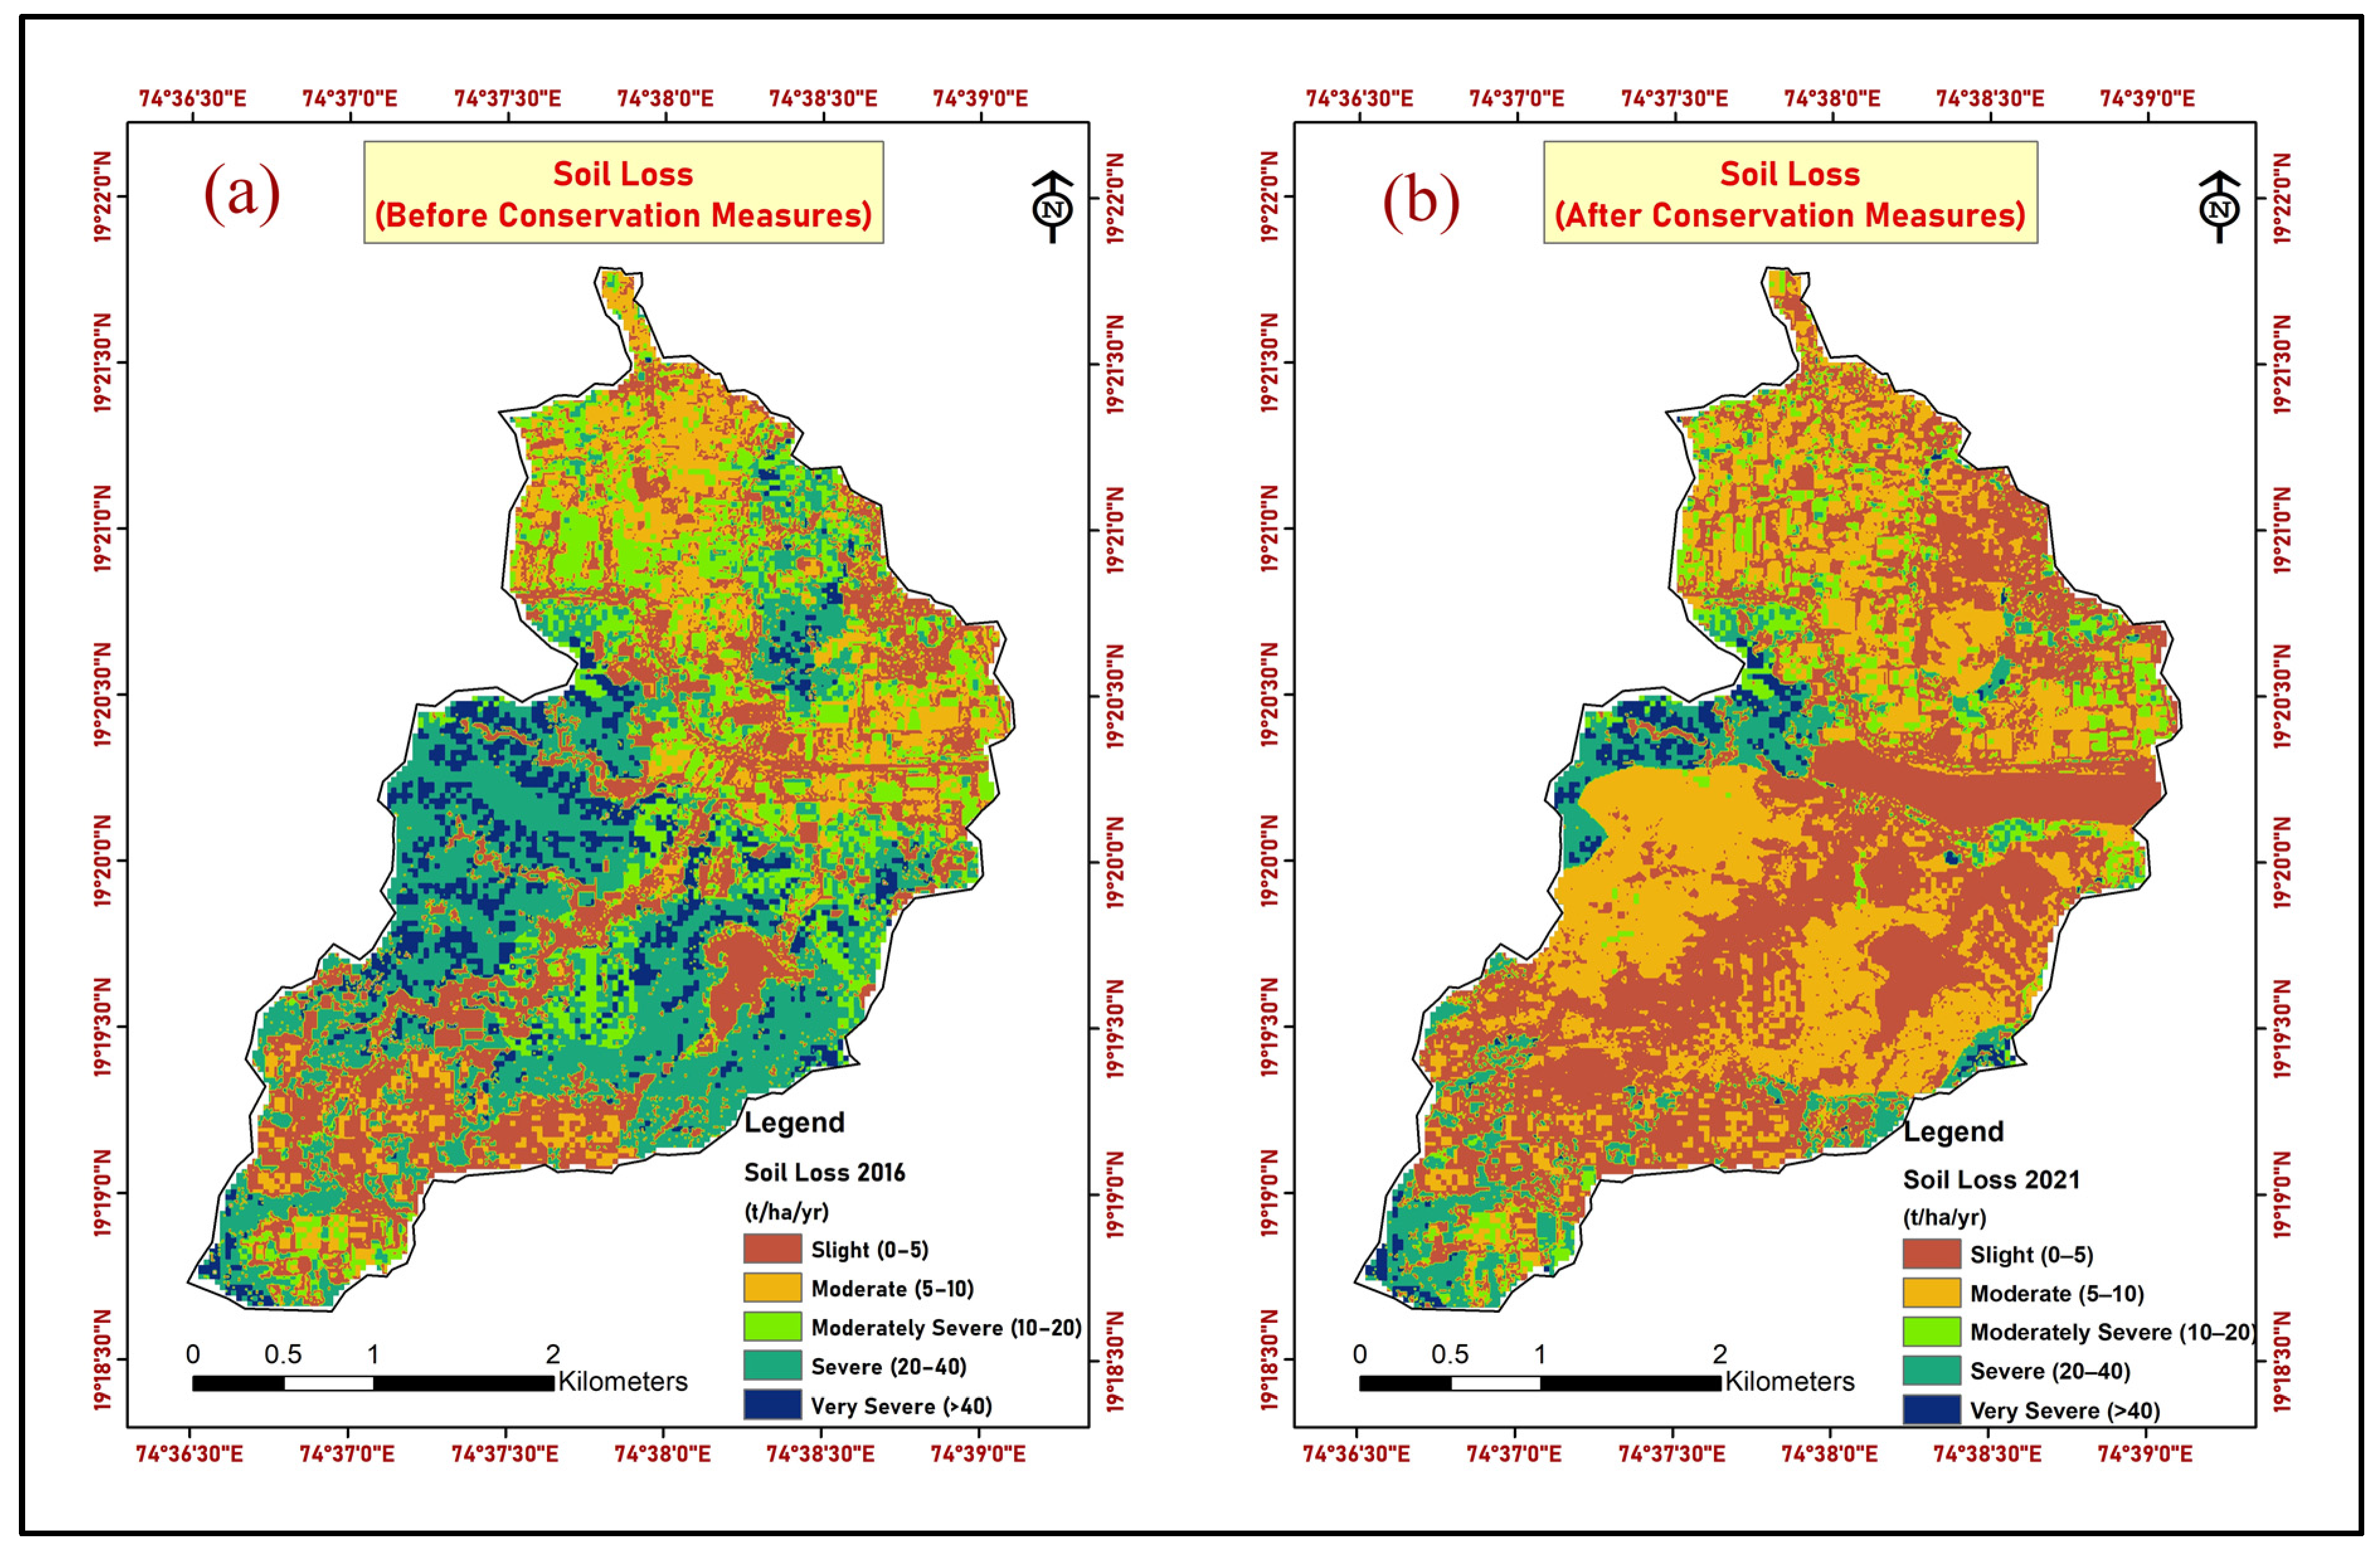
4.3. Soil Loss before Conservation Measures

The average annual soil loss from the watershed, before conservation measures, varied from 0 to 78.23 t ha−1 yr−1, with a mean soil loss rate of t ha−1 yr−1 (Figure 8a). Annually, 23,119.36 tons of soil were lost from the watershed as a result of soil erosion alone. The tolerable soil loss limit for the watershed is 11 t ha−1 yr−1 [54]. Before conservation measures, the soil loss rate from the watershed was well above the tolerable limit, resulting in severe fertile soil loss from the watershed. To easily interpret soil loss dynamics from the watershed, the soil loss rate was classified into five categories (Table 7): slight (0–5 t ha−1 yr−1), moderate (5–10 t ha−1 yr−1), moderately severe (10–20 t ha−1 yr−1), severe (20–40 t ha−1 yr−1), and extremely severe (>40 t ha−1 yr−1) soil erosion risk. It was found that 28.99% of the watershed area was under the slight erosion class. This area was mainly in the plains of the watershed where agricultural land cover was dominant. Similarly, moderate erosion risk was found in 12.82% of the watershed area, moderately severe erosion risk in 17.18%, severe erosion risk in 31.52%, and extremely severe erosion risk in 9.49%. The severity of soil erosion is directly affected by the LU/LC, soil type, topography, and rainfall intensity [39,40]. Areas with dense vegetation cover, flat lands, and cohesive soils were found to have less soil erosion, whereas areas with no or spare vegetation, and steep and long slopes were found to have severe soil erosion.

4.4. Soil Loss from the Watershed after Conservation Measures

The rate of soil loss before conservation measures has made it clear that soils within the watershed are more vulnerable to soil erosion hazards. Therefore, they should be conserved in order to maintain the fertility of the soil. As a result, site specific conservation measures were implemented in the watershed and their impact on soil erosion was analysed.
Three out of the five USLE model parameters were employed in the same way as they were before conservation measures. These three parameters are rainfall erosivity, soil erodibility, and slope length factor. It was found that rainfall pattern, soil type, and land slope fluctuate over decades but only minor changes in these parameters occur on a yearly basis. This minor change can be negligible, therefore, for measuring soil loss after conservation measures R, K, and LS parameters were kept unchanged.
The change detection analysis showed that there were significant changes in the LU/LC after the implementation of the SWC measures in the watershed. Therefore, the C-factor map, which depends entirely on LU/LC, has changed after the implementation of conservation measures (Figure 7b). The C-factor values used for different pre-conservation land covers were thought to be similar after conservation. Only the area under C-factor values changed with changing land cover area. After conservation measures, the area under C-factor values for agriculture, forestry, horticulture, settlements, and waterbodies increased, while the areas under barren land and current fallow land decreased.
Implementation of SWC measures directly affected the P factor of the watershed. The various site-specific conservation measures implemented in the watershed changed the P factor values of the watershed (Figure 9). Before conservation measures, the P factor value of one was considered for the entire watershed, but after implementation of conservation measures, the specific value of each conservation measure obtained from the previous literature was provided. The major land area measures taken in the watershed are DCCT on 495 ha area and compartment bunding on 50 ha area. The P factor value of 0.15 and 0.03 [44] was used for the DCCT and compartment bunding, respectively. The P-factor value of 1 was used for the remaining areas.
The after conservation measures soil loss from the watershed ranged from 0 to 53.24 t ha−1 yr−1, with a mean soil loss rate of 9.41 t ha−1 yr−1(Figure 8b). After implementation of conservation measures, soil loss from the watershed was reduced by as much as 11,560.6 tons per year. This soil loss rate from the watershed is well below the tolerable soil loss limit, indicating that the rate of soil formation is greater than the rate of soil loss. The impact of scientifically planned and constructed conservation measures was visible not only in the treated part of the watershed, but also in the surrounding areas of the watershed. The obstructions created in the upper reaches of the watershed to the flowing water, by implementing SWC measures, reduced runoff and subsequent sediment transportation in the upper, middle, and lower reaches of the watershed. The soil loss rate from the watershed after conservation measures was reduced by 50%, to that of the before conservation measures soil loss rate. The higher efficiency of SWC measures in soil loss control is consistent with other local studies by Bhattacharyya et al., 2015 [55], Kumawant et al., 2020 [28], and Nasir Ahmad et al., 2020 [56]. Similar to before conservation measures, soil loss rate classification, after conservation measures, was also classified into 5 classes (Table 7). It was observed that the areas under slight and moderate erosion classes increased by 20% each and the areas under moderately severe, severe, and extremely severe erosion classes decreased by 10%, 20%, and 6%, respectively. Almost 75% of the watershed area is now classified as having a low to moderate risk of erosion and only 13% of the watershed area remains in the severe to extremely severe erosion risk class. The spatial distribution of soil loss reveals that areas with a high erosion risk are situated in regions of long and steep slopes, sparse vegetation cover, and fine soils with no conservation measures [40,41,42]. This suggests that it is possible to achieve a significant reduction in the rate of soil loss, provided that conservation measures are planned and constructed in a scientific manner.

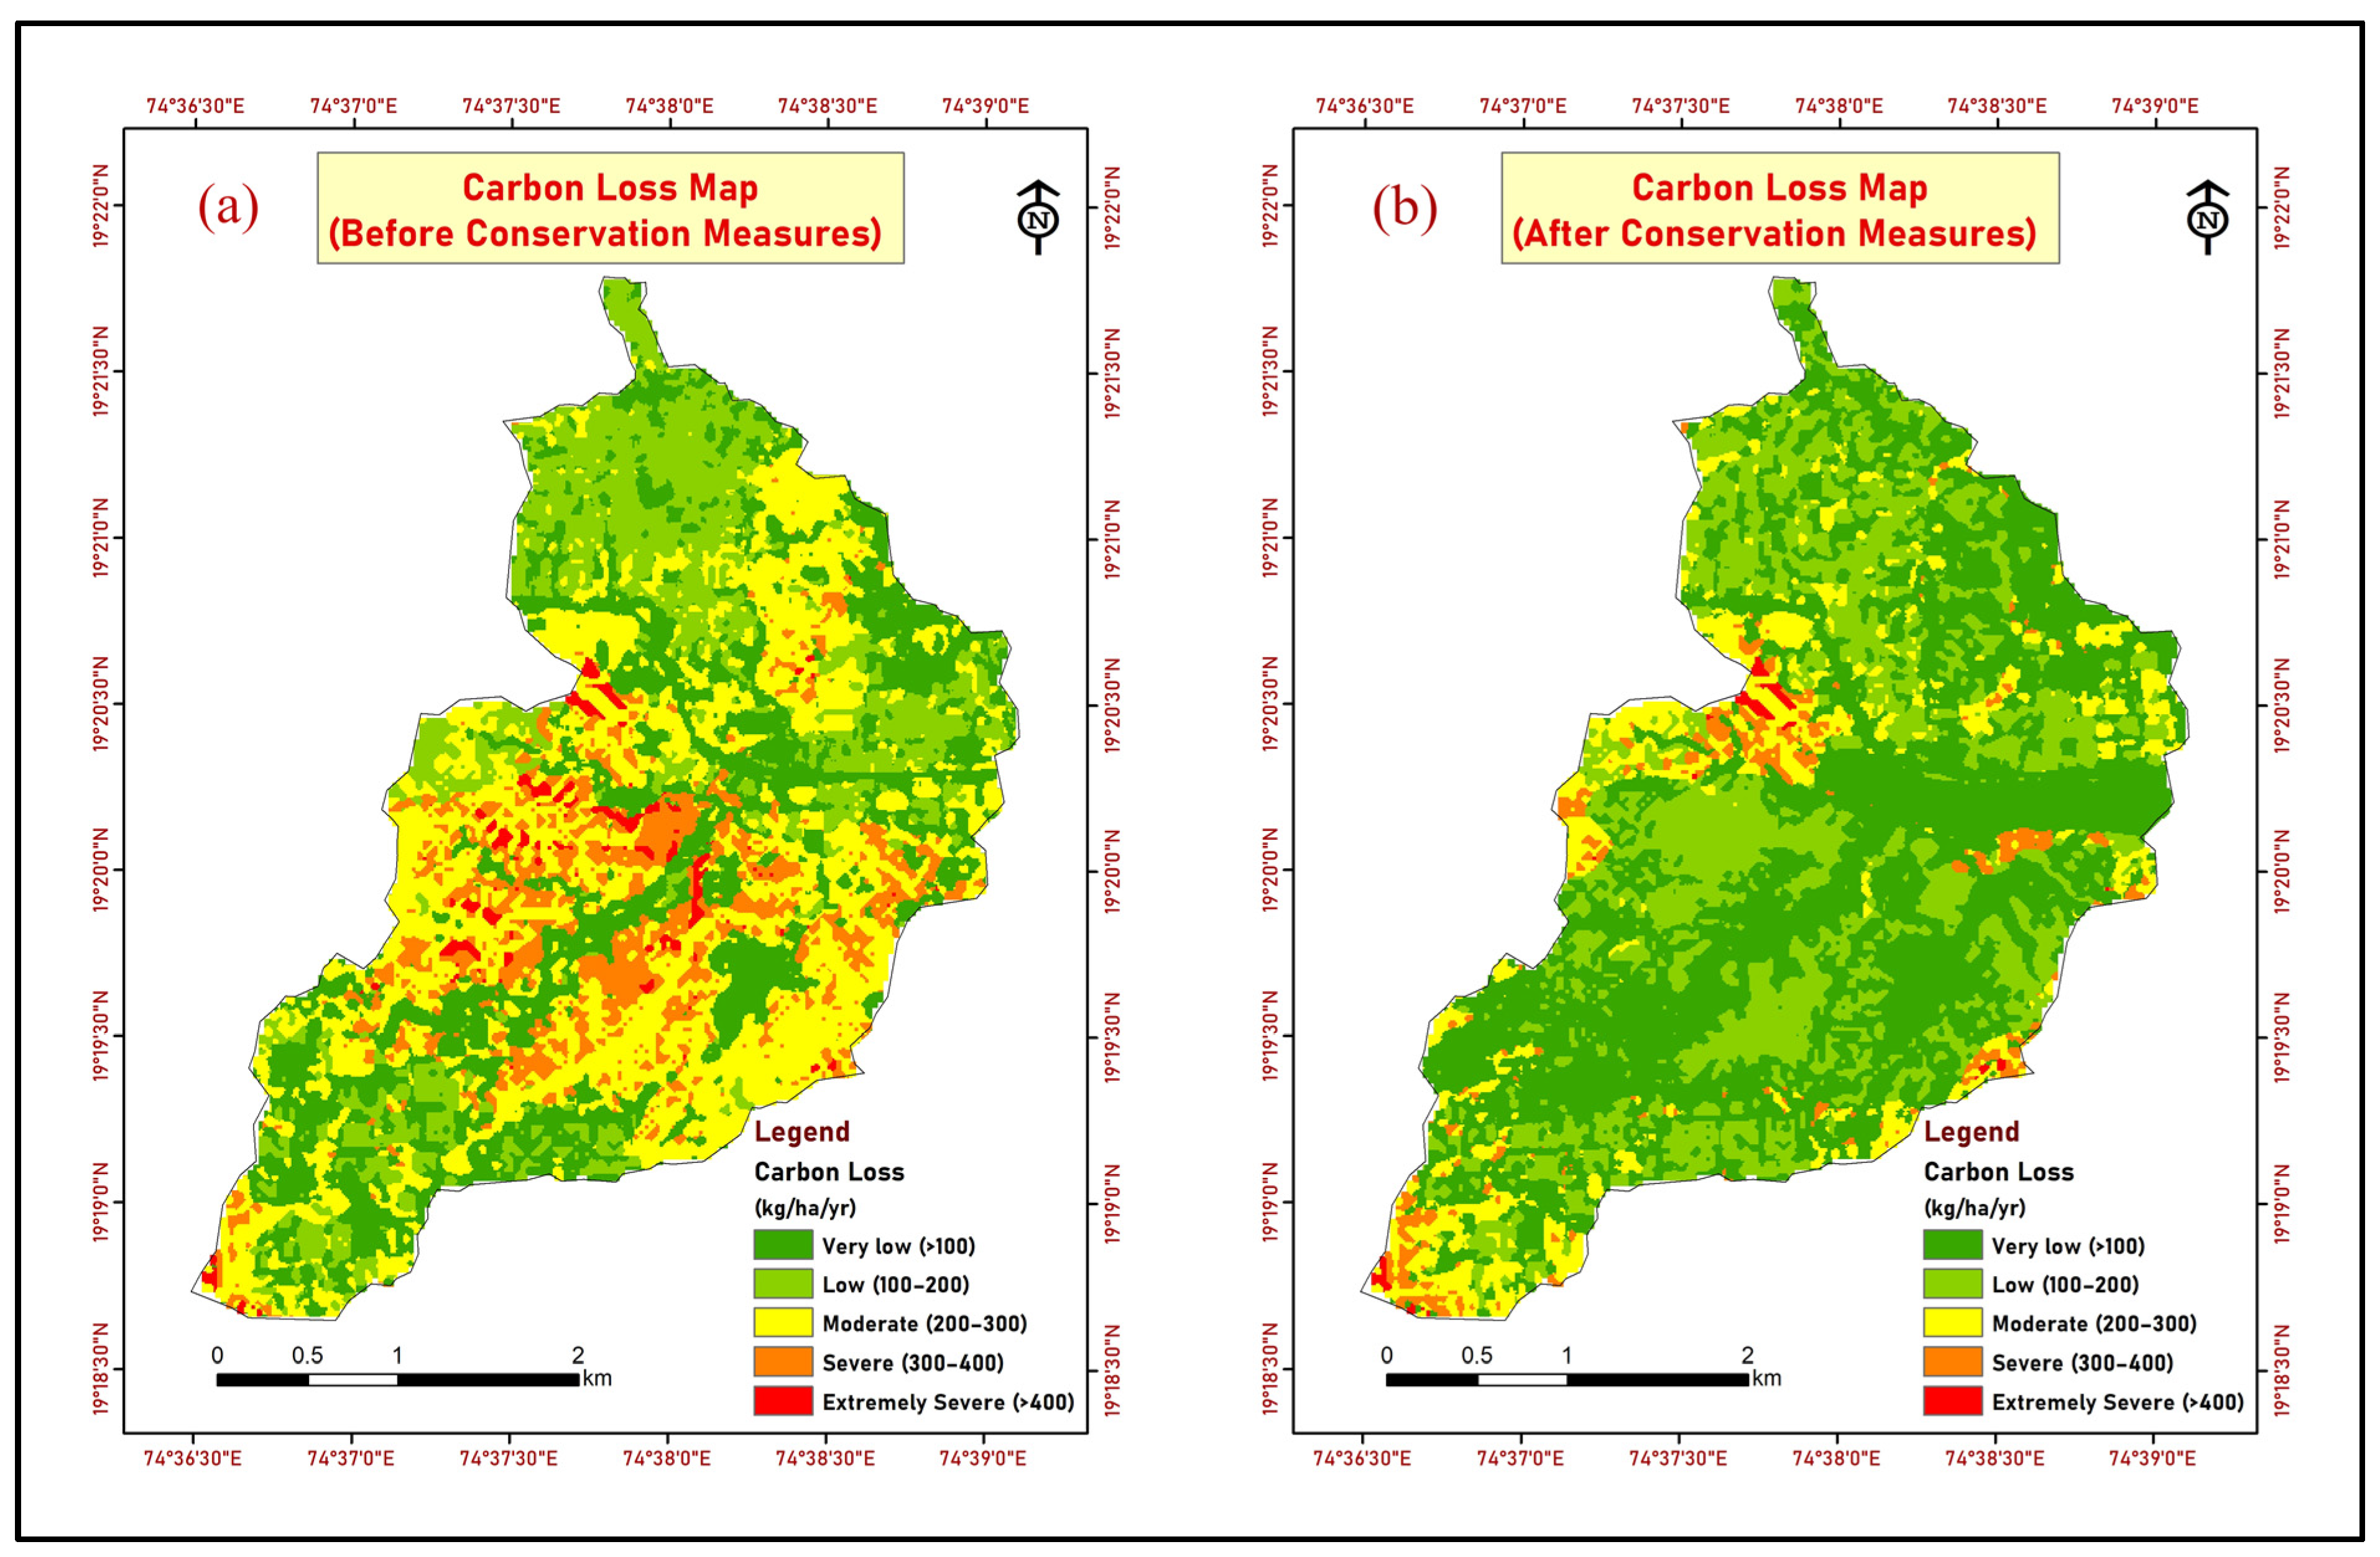
4.5. Carbon Loss from the Watershed

4.5.1. Before Conservation Measures Carbon Loss

The before conservation measures carbon loss, associated with soil loss, was estimated using three parameters: soil loss rate before conservation measures, SOC content before conservation measures, and the CER ratio. SOC content in the watershed before conservation measures ranged from 0.28 to 0.83 %, with a mean SOC of 0.62% (Table 8). The SOC content map of the watershed is given in Figure 10. The CER ratio maps for the watershed were generated from the before and after conservation measures soil loss rate classification map. The CER map used in the present study is given in Figure 11.
The average annual carbon loss before conservation measures, from the watershed, varied from 0 to 618.42 kgC ha−1 yr−1, with a mean carbon loss rate of 348.71 kgC ha−1 yr−1 (Figure 12a). Annual carbon loss through soil erosion from the watershed was 439.37 tons of carbon, before conservation measures. The severity of soil erosion was found in areas where soil erosion risk was moderate, moderately severe, and extremely severe. The CO2 emitted into the atmosphere due to soil erosion was 1611.16 tons of CO2 per year. It was found that soil degradation due to erosion was one of the main causes of carbon emissions in the watershed. To understand the soil carbon emission dynamics of the watershed, carbon loss rate was categorized into five classes (Table 9): very low (0–100 kgC ha−1 yr−1), low (100–200 kgC ha−1 yr−1), moderate (200–300 kgC ha−1 yr−1), severe (300–400 kgC ha−1 yr−1), and extremely severe (>400 kgC ha−1 yr−1) carbon erosion risk area. Out of the total watershed area, 25.63% of the area was found under a very low risk carbon erosion area. Similarly, the areas under moderate, moderately severe, severe, and extremely severe carbon erosion classes were 19.84%, 34.52%, 14.68%, and 5.32%, respectively.

4.5.2. After Conservation Measures Carbon Loss

After the implementation of conservation measures in the watershed, carbon loss from the watershed ranged from 0 to 538.30 kgC ha−1 yr−1, with a mean of 205.52 kgC ha−1 yr−1 (Figure 12b). The carbon loss after conservation measures was reduced by 40% to that of the carbon loss, before conservation measures. The soil carbon loss and CO2 emissions from the watershed after conservation measures were reduced by up to 258.95 tons of C and 949.56 tons of CO2, respectively. Similar to before conservation measures, carbon loss classification, after conservation measures, was also classified into five classes (Table 9). It was found that the area under the very low carbon loss class was 44.44%. Similarly, the area under low, moderate, severe, and extremely severe carbon erosion classes was found as 32.94%, 13.65%, 6.43%, and 2.54%, respectively. The area under very low and low carbon erosion classes increased by 20% and 13%, respectively. Whereas areas under moderate, severe, and extremely severe erosion risk classes decreased by 20%, 8%, and 3%, respectively. Nearly 75% of the watershed area is under the very low to low carbon erosion class. It was found that implementation of site specific SWC measures not only helps with soil loss reduction, but reduces soil carbon emissions from the watershed. The carbon loss values from the watershed are comparable to those found by Lense et al. 2021 [57] in the tropical watershed, which ranged from 0.16 kgC ha−1 yr−1 to 209.50 kgC ha−1 yr−1.

4.6. Impact of SWC Measures on Carbon Sequestration
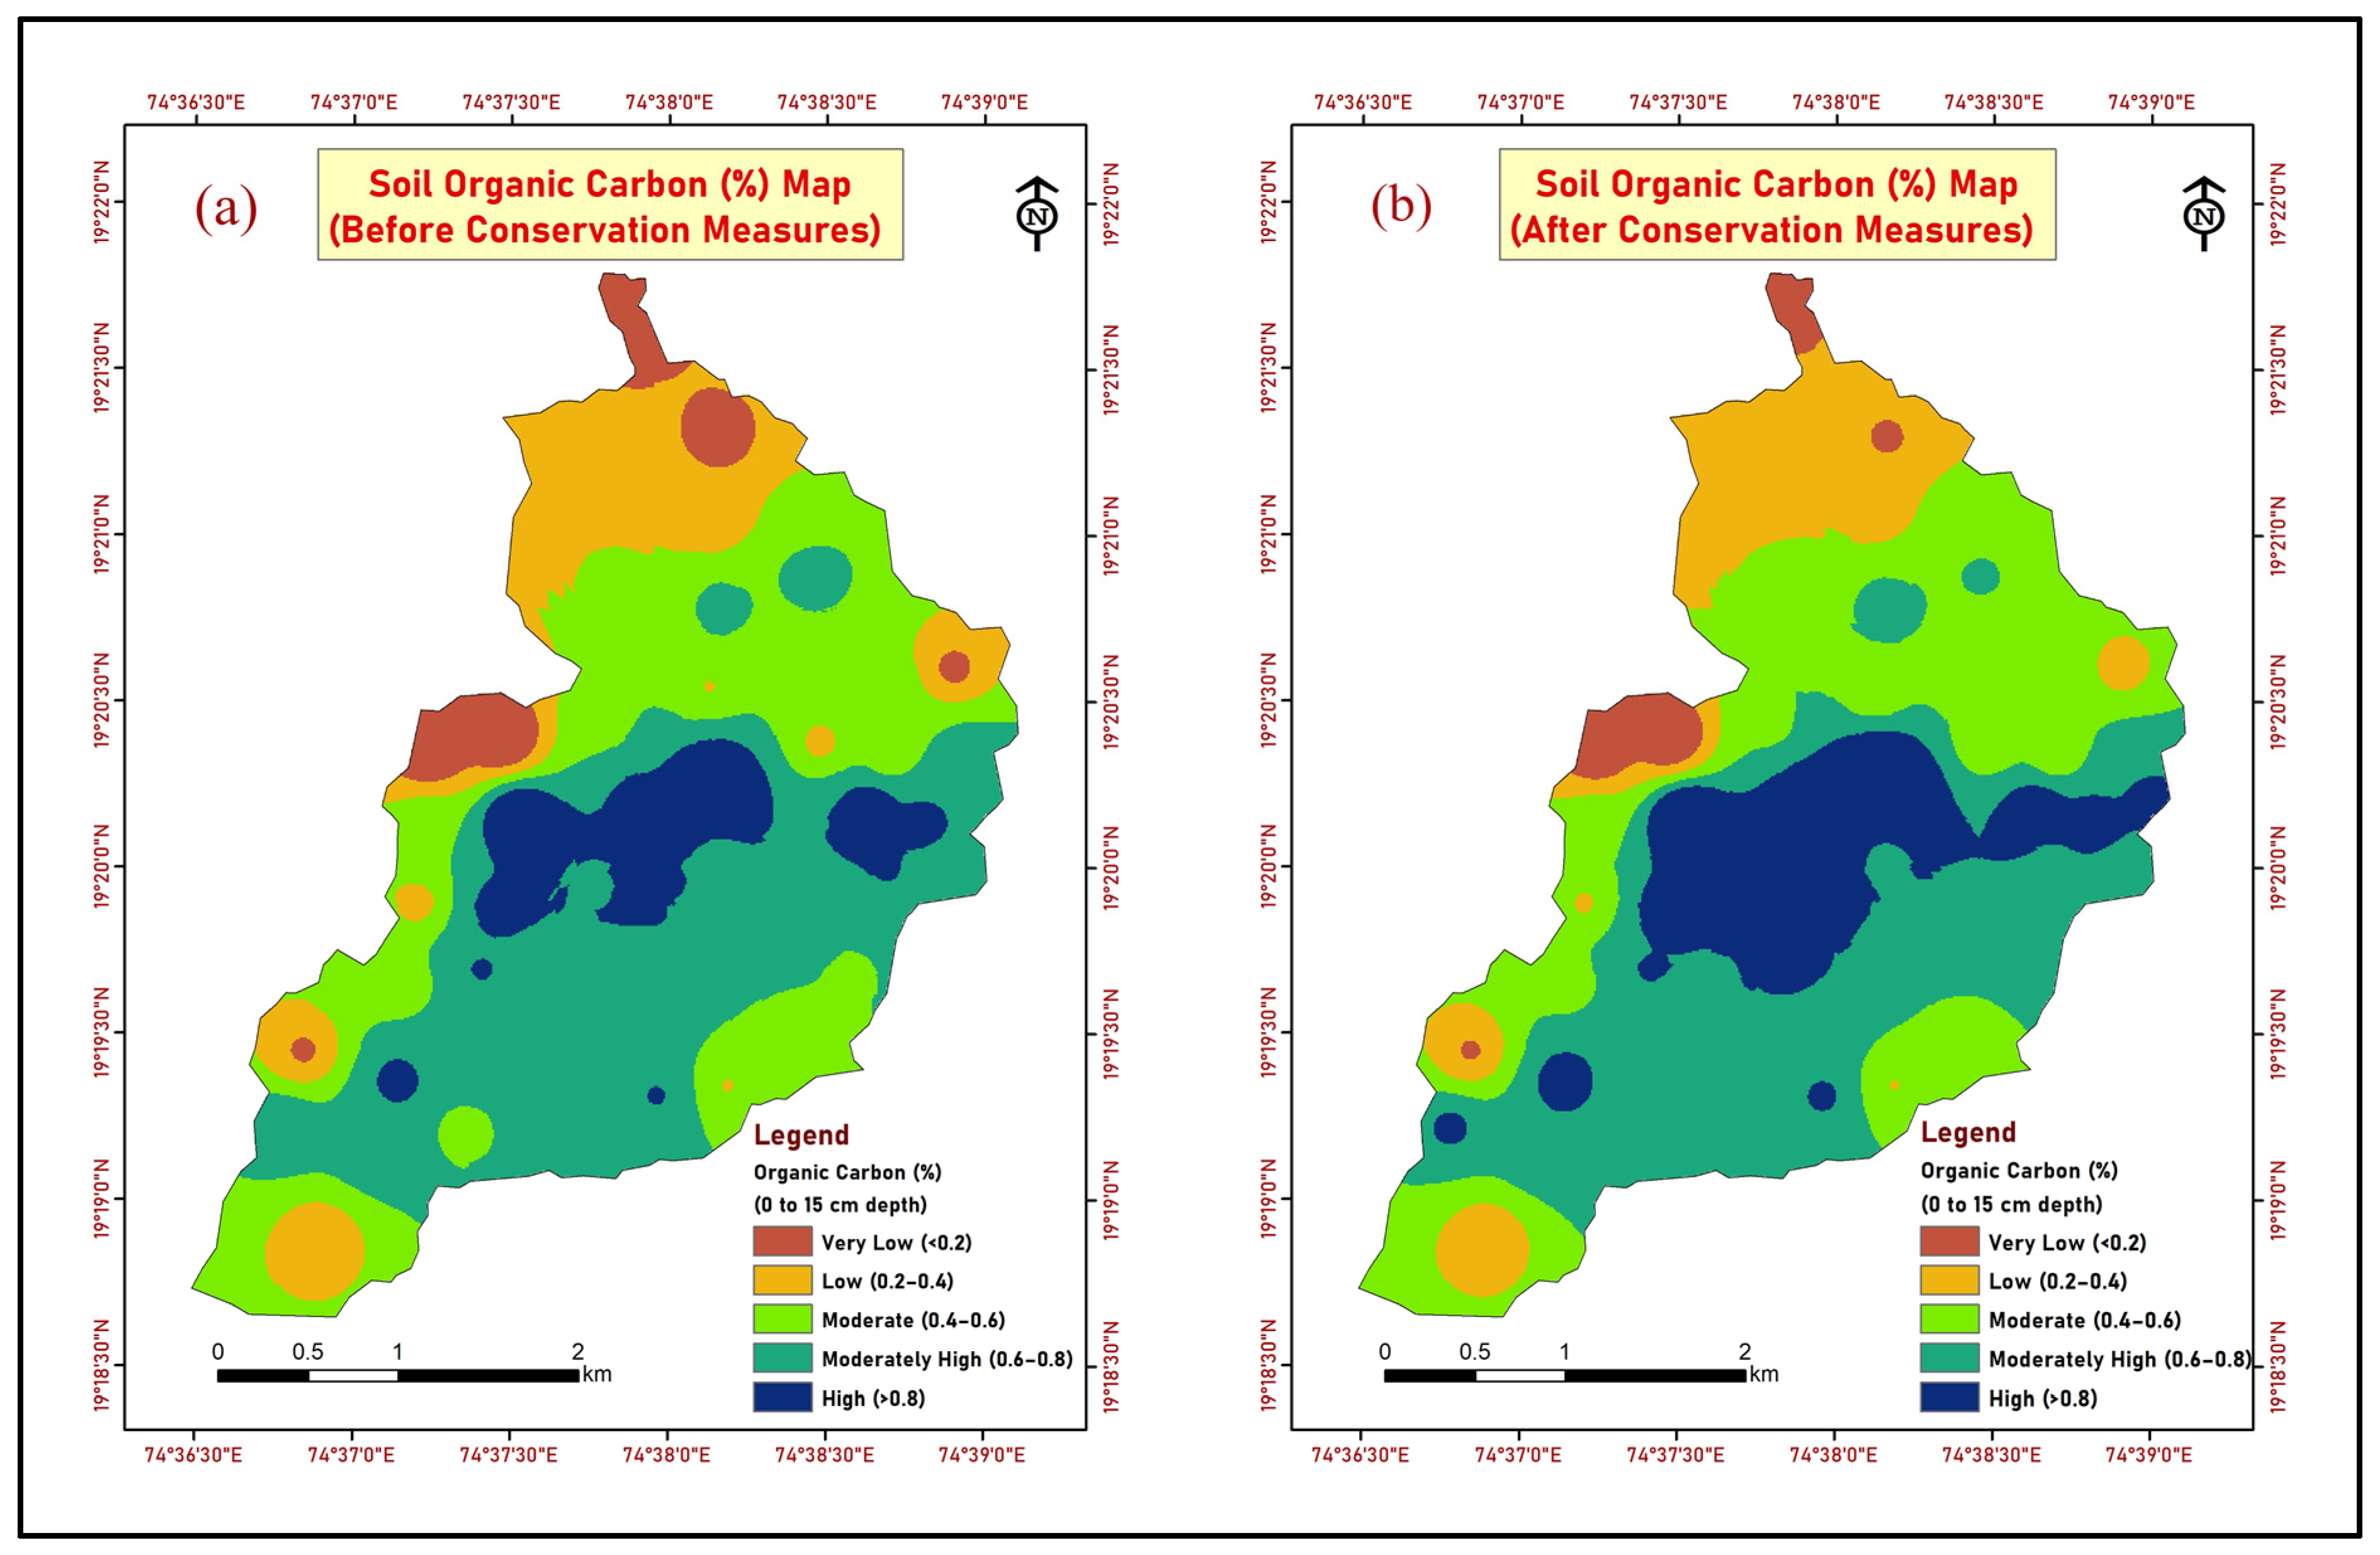
4.6.1. SOC Content

The SOC content under four treatments (T1 = Agriculture + CB, T2= Barren + DCCT, T3 = Forest + DCCT and T4= Horticulture + DCCT) varied from 0.49 to 0.92%, 0.51 to 0.94%, and 0.52 to 1% for the first 0 to 15 cm depth, for three consecutive years, Y1 (2020), Y2 (2021), and Y3 (2022), respectively. Similarly, for 15 to 30 cm depths, SOC content under four treatments varied from 0.48 to 0.81%, 0.52 to 0.85%, and 0.51 to 0.92% for years Y1, Y2 and Y3, respectively. The treatment average SOC content in years Y1, Y2, and Y3 is given in Table 10. It was found that SOC content was higher for the 0–15 cm depth than 15–30 cm depth for all four treatments. This is consistent with previous research, as microbial activities and humus content are greater in the surface soils and decrease with depth [58,59]. Among the four treatments, the average SOC content was highest in the T3 treatment and lowest for T2 treatment for 0–15 and 15–30 cm depths. The soils in the T3 treatment were significantly influenced by vegetation cover, which included deep-rooted trees and a substantial litter layer. Whereas soils in the T2 treatment were vulnerable to soil erosion due to sparse vegetation cover. It was observed that for all the treatments and both the soil sampling depths, the SOC content was increased, but the rate of increase in SOC content was variable for all the treatments. The average SOC increase rate for a 0–15 cm depth from year Y1 to Y2 and Y2 to Y3 was 2.69% and 3.56%, respectively. The SOC increase rate for a 0–15 cm depth and for Y1 to Y2 year was found highest in the T1 treatment (4.11%) and lowest in the T3 treatment (1.16%). Similarly, for a 0–15 cm depth and for Y2 to Y3 year, the SOC increase rate was highest in the T4 treatment (4.94) and lowest in the T1 treatment (2.63%). The SOC increase rate for a 15–30 cm depth for Y1 to Y2 year was found highest in the T4 treatment (2.86%) and lowest in the T2 treatment (1.75%). Similarly, for a 15–30 cm depth and for Y2 to Y3 year the SOC increase rate was found highest in the T4 treatment (4.17%) and lowest in the T2 treatment (1.72%). The SOC content under different treatments was varied with the presence of vegetation cover. These results indicated that SOC accumulation in the watershed was significantly influenced by SWC measures [20,60]. In other studies, from around the world, Nave et al. 2013 [61] observed 1.5% per year SOC accumulation rate in the Unites states, and Barcena et al. 2014 [62] observed 0.8% per year in Northern Europe.

4.6.2. Bulk Density

The average bulk density for all four treatments increased with the increasing soil sampling depth. The average bulk density for a 0–15 cm depth was significantly lower than for the 15–30 cm depth for all the treatments (Table 10). This is consistent with the observation that soil bulk density typically increases with soil depth, as subsurface layers have less organic matter, aggregations and root penetration than surface layers and thus contain less pore space [63]. The average bulk density for three consecutive years (Y1, Y2s and Y3) has not changed significantly (p < 0.05) for both 0–15 and 15–30 cm depths. Average bulk density for three years from Y1 to Y3 was 1.43 gm/cc for a 0–15 cm depth and 1.46 gm/cc for a 15–30 cm depth. The average bulk density was highest in T2 and T3 treatments and lowest in the T1 treatment for a 0–15 cm depth. Similarly, for a 15–30 cm depth, the highest bulk density was in the T3 treatment and lowest was in the T1 treatment. It was found that the bulk density of soil was one of the major factors that influenced the amount of SOC stock under each treatment. The variation in soil bulk density between treatments may be attributable to land cover, topography factors, climate, and parent material [63,64].

4.6.3. SOC Stock and Soil Carbon Sequestration Rate

The SOC stock and carbon sequestration rate was different for all four treatments (Table 10). The SOC stock in different treatments was mainly influenced by SOC content and the bulk density of soil [65]. The average SOC stock was found highest in the T3 treatment and lowest in the T2 treatment for both 0–15 and 15–30 cm depths. The SOC stock increase rate varied from 0.94 to 2.41% from year Y1 to Y2 for 0–15 cm depth, with the highest increase rate found in the T3 (2.41%) treatment, and lowest in the T2 (0.94%) treatment. Similarly, from year Y2 to Y3 the SOC stock increase rate varied from 1.10 to 2.89% and was found highest in the T3 (2.89%) treatment, and lowest in the T2 (1.10%) treatment, for a 0–15 cm depth. For the 15–30 cm depth, for the period of Y1 to Y2, the SOC stock increase rate varied from 0.76 to 1.37%, and was found highest in the T1 (1.37%) treatment, and lowest in the T2 (0.76%) treatment. Similarly, for a 15–30 cm depth, for the period Y2 to Y3, SOC stock increase rate was varied from 0.80 to 1.53%, and was found highest in the T1 (1.53%) treatment, and lowest in the T2 (0.80%) treatment. The overall average SOC increase rate was found highest in the T1 (2.58%) treatment and lowest in the T2 (1.02%) treatment for a 0- 15 cm depth. For a 15–30 cm depth, average SOC increase rate was found highest in the T1 (1.45%) treatment and lowest in the T2 (0.78%) treatment. The SOC sequestration is influenced by the SWC measures through the annual turnover of organic matter from the soil and plant biomass, through biological processes [20,66]. Additionally, the decomposition of litter adds organic matter to the topsoil [67].
The average soil carbon sequestration rate for a 0–15 cm depth for period Y1 to Y2 varied from 0.126 to 0.454 t C ha−1 yr−1. It was found highest in the T3 (0.126 t C ha−1 yr−1) treatment and lowest in the T2 (0.454 t C ha−1 yr−1) treatment. Similarly, for period Y2 to Y3, the average SOC sequestration rate varied from 0.148 to 0.503 t C/ha/yr, and was found highest in the T3 (0.148 t C ha−1 yr−1) treatment and lowest in the T2 (0.503 t C ha−1 yr−1) treatment. The average SOC sequestration rate for a 15–30 cm depth and for the period of Y1 to Y2 varied from 0.098 to 0.247 t C ha−1 yr1, and was found highest in the T3 (0.247 t C ha−1 yr−1) treatment and lowest in the T2 (0.098 t C ha−1 yr−1) treatment. Similarly, for period Y2 to Y3, average SOC sequestration rate varied from 0.103 to 0.242 t C ha−1 yr−1, and was found highest in the T3 (0.242 t C ha−1 yr−1) treatment and lowest in the T2 (0.103 t C ha−1 yr−1) treatment. It was found that agricultural lands treated with CB increased the SOC sequestration rate by 0.395 t C ha−1 yr−1 and 0.218 t C ha−1 yr−1 in 0–15 and 15–30 cm depths, respectively. Similarly, barren land, forest land, and horticultural lands treated with DCCT increased the SOC sequestration rate by 0.137, 0.479, and 0.380 t C ha−1 yr−1, respectively, for a 0–15 cm depth, and 0.101, 0.245, and 0.215 t C ha−1 yr−1, respectively for a 15–30 cm depth. It was found that the impact of different SWC measures on diverse land covers was different. The average SOC sequestration rate for a 0–30 cm depth was found highest in the T3 (0.723 t C ha−1 yr−1) treatment and lowest in the T2 (0.237 t C ha−1 yr−1) treatment (Table 11). Carbon storage in various soil layers is primarily dependent on the quality and quantity of plant litter [20]. The presence of high levels of soil carbon sequestration in the uppermost layers may be due to a vegetation barrier, which may have improved the carbon sequestration by adding decomposable organic matter. According to Walter et al. 2003 [68], the barrier effect created by SWC measures contributes to the improvement of SOC by retaining sediments and nutrients in treated areas. The study’s findings are consistent with other studies that show lower erosion and higher soil carbon sequestration in treated areas. Sustainable soil management practices resulted in a SOC sequestration rate of 0.62 t C ha−1 yr−1 in China [69], 0.45 ± 0.14 t C ha−1 yr−1 in Belgium [70], 0.4 ± 0.61 t C ha−1 yr−1 in the United States [71], 0.57 t C ha−1 yr−1 in Nigeria [72], and 0.38 t C ha−1 yr−1 in England [73].
Along with SWC measures, land cover type was also a major influencing factor that affects the rate of soil carbon sequestration. The increased vegetation cover and reduced soil loss were the major factors responsible for high soil carbon sequestration rates in the watershed [60,65]. It was found that implementation of site-specific SWC measures not only helps with natural resource conservation but also helps in soil carbon sequestration. The increased rate of soil carbon sequestration resulting from SWC measures will provide a viable means of mitigating climate change. Financing high-priced carbon capture and storage projects is the greatest obstacle in developing countries for mitigating climate change [74]. Developing climate-resilient watersheds through the implementation of sustainable SWC practices can provide a long-term and cost-effective solution to the climate change problem. The main benefits of implementing SWC measures is the low cost of construction with people’s participation, as well as the wider applicability under various climatic and physiographic conditions [28]. It also provides numerous socioeconomic benefits such as reduced soil erosion, soil fertility and moisture conservation, increased crop productivity, and climate change mitigation [14,25]. Furthermore, the enhanced carbon in the soil from improved soil management practices can provide farmers with access to the carbon market. The main challenge in the wider applicability of SWC measures is that they are site specific and require scientific knowledge to reap the full benefits. Existing literature regarding the effectiveness of SWC measures in carbon sequestration is scant. Extensive research is required to further validate the applicability of SWC measures under diverse environmental conditions.

5. Conclusions

The present investigation revealed the significance of SWC measures in reducing soil erosion, preventing carbon loss, and improving SOC stock and SOC sequestration rate. The SWC measures implemented in the watershed reduced soil loss and carbon loss by 50% and 40%, respectively. The soil loss rate after conservation measures was below the tolerable soil loss limit of the region. The study found that the USLE model coupled with the GIS technique makes soil loss and carbon loss estimation simple and credible. Implementing recommended conservation measures significantly reduces the soil loss rate and prevents carbon loss from soil. The conservation measures serve the dual purposes of protecting natural resources and reducing climate change. The SOC sequestration rate in the watershed was greatly influenced by vegetation cover and the barrier effect created by SWC measures. It was found that DCCT constructed on barren, forest, and horticultural land has a SOC sequestration rate of 0.237, 0.723, and 0.594 t C ha−1 yr−1, respectively, for a 0–30 cm depth of soil. Similarly, compartment bunds constructed on agricultural land have the SOC sequestration rate of 0.612 t C ha−1 yr−1. The DCCT and CB constructed in the watershed were found to act as potential natural C sinks. Thus, SWC measures can be regarded as climate change mitigation and adaptation measures. The findings of this study provide insightful information on sustainable carbon management practices for climate change mitigation. This information will assist stakeholders and policymakers in planning climate-resilient watersheds. Adopting sustainable land management practices can give developing countries a big boost in the fight against climate change, especially in countries where it is hard to get financing for climate change mitigation projects.

Author Contributions

Conceptualization, R.S. and S.N.; Data curation, R.S.; Formal analysis, R.S. and S.N.; Investigation, S.N.; Methodology, R.S., S.N. and A.A.; Project administration, S.N., S.G. and A.A.; Resources, S.N. and S.G.; Software, R.S. and S.N.; Supervision, S.N., M.T., S.G. and A.A.; Validation, R.S. and S.N.; Visualization, R.S., M.T., S.G. and A.A.; Writing—original draft, R.S., S.N. and M.T.; Writing—review & editing, R.S., S.N., M.T. and A.A. All authors have read and agreed to the published version of the manuscript.

Funding

This research received no external funding.

Institutional Review Board Statement

This article does not include human or animal studies conducted by any of the authors.

Informed Consent Statement

Not applicable.

Data Availability Statement

The datasets generated during and/or analysed during the current study are available from the corresponding author on request.

Acknowledgments

The authors would like to express their gratitude to the Department of Soil and Water Conservation Engineering, Mahatma Phule Krishi Vidyapeeth, Rahuri for their extensive cooperation during the research work.

Conflicts of Interest

The authors affirm that they have no known financial or interpersonal conflicts that might have appeared to have an impact on the research presented in this paper.

References

  1. Hoque, M.A.-A.; Pradhan, B.; Ahmed, N. Assessing Drought Vulnerability Using Geospatial Techniques in Northwestern Part of Bangladesh. Sci. Total Environ. 2020, 705, 135957. [Google Scholar] [CrossRef] [PubMed]
  2. Ahmad, M.M.; Yaseen, M.; Saqib, S.E. Climate Change Impacts of Drought on the Livelihood of Dryland Smallholders: Implications of Adaptation Challenges. Int. J. Disaster Risk Reduct. 2022, 80, 103210. [Google Scholar] [CrossRef]
  3. Thammanu, S.; Marod, D.; Han, H.; Bhusal, N.; Asanok, L.; Ketdee, P.; Gaewsingha, N.; Lee, S.; Chung, J. The Influence of Environmental Factors on Species Composition and Distribution in a Community Forest in Northern Thailand. J. For. Res. 2020, 32, 649–662. [Google Scholar] [CrossRef]
  4. Islam, A. Climate Change and Its Impact on Sustainable Development in Bangladesh. Int. J. Econ. Energy Environ. 2017, 2, 90. [Google Scholar] [CrossRef] [Green Version]
  5. Nyssen, J.; Frankl, A.; Zenebe, A.; Deckers, J.; Poesen, J. Land Management in the Northern Ethiopian Highlands: Local and Global Perspectives; Past, Present and Future. Land Degrad. Dev. 2015, 26, 759–764. [Google Scholar] [CrossRef]
  6. Mandal, D.; Giri, N.; Srivastava, P. The Magnitude of Erosion-Induced Carbon © Flux and C-Sequestration Potential of Eroded Lands in India. Eur. J. Soil Sci. 2020, 71, 151–168. [Google Scholar] [CrossRef]
  7. Degu, M.; Melese, A.; Tena, W. Effects of Soil Conservation Practice and Crop Rotation on Selected Soil Physicochemical Properties: The Case of Dembecha District, Northwestern Ethiopia. Appl. Environ. Soil Sci. 2019, 2019, 6910879. [Google Scholar] [CrossRef] [Green Version]
  8. Fang, H. The Effect of Soil Conservation Measures on Runoff, Soil Erosion, TN, and TP Losses Based on Experimental Runoff Plots in Northern China. Water 2021, 13, 2334. [Google Scholar] [CrossRef]
  9. Mekonnen, M.; Getahun, M. Soil Conservation Practices Contribution in Trapping Sediment and Soil Organic Carbon, Minizr Watershed, Northwest Highlands of Ethiopia. J. Soils Sediments 2020, 20, 2484–2494. [Google Scholar] [CrossRef]
  10. Addis, H.K.; Abera, A.; Abebaw, L. Economic Benefits of Soil and Water Conservation Measures at the Sub-Catchment Scale in the Northern Highlands of Ethiopia. Prog. Phys. Geogr. Earth Environ. 2019, 44, 251–266. [Google Scholar] [CrossRef]
  11. Tanto, T.; Laekemariam, F. Impacts of Soil and Water Conservation Practices on Soil Property and Wheat Productivity in Southern Ethiopia. Environ. Syst. Res. 2019, 8, 1–9. [Google Scholar] [CrossRef]
  12. Simon, A.; Dhendup, K.; Rai, P.B.; Gratzer, G. Soil Carbon Stocks along Elevational Gradients in Eastern Himalayan Mountain Forests. Geoderma Reg. 2018, 12, 28–38. [Google Scholar] [CrossRef]
  13. Wiesmeier, M.; Urbanski, L.; Hobley, E.; Lang, B.; von Lützow, M.; Marin-Spiotta, E.; van Wesemael, B.; Rabot, E.; Ließ, M.; Garcia-Franco, N.; et al. Soil Organic Carbon Storage as a Key Function of Soils—A Review of Drivers and Indicators at Various Scales. Geoderma 2019, 333, 149–162. [Google Scholar] [CrossRef]
  14. Liao, C.; Tian, Q.; Liu, F. Nitrogen Availability Regulates Deep Soil Priming Effect by Changing Microbial Metabolic Efficiency in a Subtropical Forest. J. For. Res. 2020, 32, 713–723. [Google Scholar] [CrossRef]
  15. Wang, Z. Estimating Terrestrial Carbon Storage and Internal Carbon Exchange under Equilibrium State. Ecol. Model. 2019, 401, 94–110. [Google Scholar] [CrossRef]
  16. Deng, L.; Wang, K.; Zhu, G.; Liu, Y.; Chen, L.; Shangguan, Z. Changes of Soil Carbon in Five Land Use Stages Following 10 years of Vegetation Succession on the Loess Plateau, China. Catena 2018, 171, 185–192. [Google Scholar] [CrossRef]
  17. Tang, X.; Zhao, X.; Bai, Y.; Tang, Z.; Wang, W.; Zhao, Y.; Wan, H.; Xie, Z.; Shi, X.; Wu, B.; et al. Carbon Pools in China’s Terrestrial Ecosystems: New Estimates Based on an Intensive Field Survey. Proc. Natl. Acad. Sci. USA 2018, 115, 4021–4026. [Google Scholar] [CrossRef] [Green Version]
  18. Hounkpatin, O.K.L.; Op de Hipt, F.; Bossa, A.Y.; Welp, G.; Amelung, W. Soil Organic Carbon Stocks and Their Determining Factors in the Dano Catchment (Southwest Burkina Faso). Catena 2018, 166, 298–309. [Google Scholar] [CrossRef]
  19. Cardinael, R.; Chevallier, T.; Cambou, A.; Béral, C.; Barthès, B.G.; Dupraz, C.; Durand, C.; Kouakoua, E.; Chenu, C. Increased Soil Organic Carbon Stocks under Agroforestry: A Survey of Six Different Sites in France. Agric. Ecosyst. Environ. 2017, 236, 243–255. [Google Scholar] [CrossRef] [Green Version]
  20. Mahajan, G.R.; Das, B.; Manivannan, S.; Manjunath, B.L.; Verma, R.R.; Desai, S.; Kulkarni, R.M.; Latare, A.M.; Sale, R.; Murgaonkar, D.; et al. Soil and Water Conservation Measures Improve Soil Carbon Sequestration and Soil Quality under Cashews. Int. J. Sediment Res. 2021, 36, 190–206. [Google Scholar] [CrossRef]
  21. Adhikary, P.P.; Hombegowda, H.C.; Barman, D.; Jakhar, P.; Madhu, M. Soil Erosion Control and Carbon Sequestration in Shifting Cultivated Degraded Highlands of Eastern India: Performance of Two Contour Hedgerow Systems. Agrofor. Syst. 2016, 91, 757–771. [Google Scholar] [CrossRef]
  22. Hailu, L.; Betemariyam, M. Comparison of Soil Organic Carbon and Total Nitrogen Stocks between Farmland Treated with Three and Six Years Level Soil Bund and Adjacent Farmland without Conservation Measure: In the Case of Southwestern Ethiopia. PLoS ONE 2021, 16, e0252123. [Google Scholar] [CrossRef]
  23. Fang, J.; Yu, G.; Liu, L.; Hu, S.; Chapin, F.S. Climate Change, Human Impacts, and Carbon Sequestration in China. Proc. Natl. Acad. Sci. USA 2018, 115, 4015–4020. [Google Scholar] [CrossRef] [PubMed] [Green Version]
  24. Sriyana, I.; De Gijt, J.G.; Parahyangsari, S.K.; Niyomukiza, J.B. Watershed Management Index Based on the Village Watershed Model (VWM) Approach towards Sustainability. Int. Soil Water Conserv. Res. 2020, 8, 35–46. [Google Scholar] [CrossRef]
  25. Page, K.L.; Dang, Y.P.; Dalal, R.C. The Ability of Conservation Agriculture to Conserve Soil Organic Carbon and the Subsequent Impact on Soil Physical, Chemical, and Biological Properties and Yield. Front. Sustain. Food Syst. 2020, 4, 31. [Google Scholar] [CrossRef] [Green Version]
  26. Ranjan, R.; Kumar, D.; Yadav, R.S.; Pramanik, M.; Meena, M.K.; Sinha, N.K. Conservation Agriculture for Carbon Sequestration and Mitigation of Climate Change. In Conservation Agriculture: A Sustainable Approach for Soil Health and Food Security; Springer: Singapore, 2021; pp. 433–449. [Google Scholar] [CrossRef]
  27. Demenois, J.; Torquebiau, E.; Arnoult, M.H.; Eglin, T.; Masse, D.; Assouma, M.H.; Blanfort, V.; Chenu, C.; Chapuis-Lardy, L.; Medoc, J.-M.; et al. Barriers and Strategies to Boost Soil Carbon Sequestration in Agriculture. Front. Sustain. Food Syst. 2020, 4, 37. [Google Scholar] [CrossRef] [Green Version]
  28. Kumawat, A.; Yadav, D.; Samadharmam, K.; Rashmi, I. Soil and Water Conservation Measures for Agricultural Sustainability. Soil Moisture Importance 2020, 23. [Google Scholar] [CrossRef]
  29. Pei, T.; Xu, J.; Liu, Y.; Huang, X.; Zhang, L.; Dong, W.; Qin, C.; Song, C.; Gong, J.; Zhou, C. GIScience and Remote Sensing in Natural Resource and Environmental Research: Status Quo and Future Perspectives. Geogr. Sustain. 2021, 2, 207–215. [Google Scholar] [CrossRef]
  30. Zhao, Q.; Yu, L.; Du, Z.; Peng, D.; Hao, P.; Zhang, Y.; Gong, P. An Overview of the Applications of Earth Observation Satellite Data: Impacts and Future Trends. Remote Sens. 2022, 14, 1863. [Google Scholar] [CrossRef]
  31. Nikoobakht, S.; Azarafza, M.; Akgün, H.; Derakhshani, R. Landslide Susceptibility Assessment by Using Convolutional Neural Network. Appl. Sci. 2022, 12, 5992. [Google Scholar] [CrossRef]
  32. Azarafza, M.; Azarafza, M.; Akgün, H.; Atkinson, P.M.; Derakhshani, R. Deep Learning-Based Landslide Susceptibility Mapping. Sci. Rep. 2021, 11, 1–16. [Google Scholar] [CrossRef] [PubMed]
  33. Kotkar, S.R.; Jadhav, B.D. Analysis of Various Change Detection Techniques Using Satellite Images. In Proceedings of the 2015 International Conference on Information Processing (ICIP), Pune, India, 16–19 December 2015. [Google Scholar] [CrossRef]
  34. Pimentel, D. Soil Erosion: A Food and Environmental Threat. Environ. Dev. Sustain. 2006, 8, 119–137. [Google Scholar] [CrossRef]
  35. Wischmeier, W.H. Predicting Rainfall Erosion Losses. A Guide to Conservation Planning. In The USDA Agricultural Handbook No. 537; Department of Agriculture, Science and Education Administration: Washington, DC, USA, 1978. [Google Scholar]
  36. Wu, Q.; Jiang, X.; Lu, Q.; Li, J.; Chen, J. Changes in Soil Organic Carbon and Aggregate Stability Following a Chronosequence of Liriodendron Chinense Plantations. J. For. Res. 2020, 32, 355–362. [Google Scholar] [CrossRef]
  37. Han, W.; Wang, J.; Kang, J.; Li, L.; Peng, G. Erosion Characteristics of Hydraulic Turbine Guide-Vane End Clearance in Sediment Water Flow: A Simplified Model Analysis. J. Flow Control Meas. Vis. 2017, 05, 111–126. [Google Scholar] [CrossRef] [Green Version]
  38. Adewumi, J.K.; Musa, J.J.; Adeosun, O.J.; Akpoebidimiyen, O.E.; Adekunle, A.; Adewumi, B.S. Soil Detachment with Organic Mulching Using Rainfall Simulator in Comparison with a Short Duration Natural Rainfall for Effective Soil Conservation. J. Environ. Prot. 2020, 11, 457–469. [Google Scholar] [CrossRef]
  39. Ebrahimi, M.; Nejadsoleymani, H.; Sadeghi, A.; Mansouri Daneshvar, M.R. Assessment of the Soil Loss-Prone Zones Using the USLE Model in Northeastern Iran. Paddy Water Environ. 2020, 19, 71–86. [Google Scholar] [CrossRef]
  40. Kashiwar, S.R.; Kundu, M.C.; Dongarwar, U.R. Soil Erosion Estimation of Bhandara Region of Maharashtra, India, by Integrated Use of RUSLE, Remote Sensing, and GIS. Nat. Hazards 2021, 110, 937–959. [Google Scholar] [CrossRef]
  41. Chadli, K. Estimation of Soil Loss Using RUSLE Model for Sebou Watershed (Morocco). Model. Earth Syst. Environ. 2016, 2, 1–10. [Google Scholar] [CrossRef]
  42. El Jazouli, A.; Barakat, A.; Ghafiri, A.; El Moutaki, S.; Ettaqy, A.; Khellouk, R. Soil Erosion Modeled with USLE, GIS, and Remote Sensing: A Case Study of Ikkour Watershed in Middle Atlas (Morocco). Geosci. Lett. 2017, 4, 1–12. [Google Scholar] [CrossRef] [Green Version]
  43. Girmay, G.; Moges, A.; Muluneh, A. Estimation of Soil Loss Rate Using the USLE Model for Agewmariayam Watershed, Northern Ethiopia. Agric. Food Secur. 2020, 9, 1–12. [Google Scholar] [CrossRef]
  44. Chandramohan, T.; Durbude, D.G. Estimation of Soil Erosion Potential Using Universal Soil Loss Equation. J. Indian Soc. Remote Sens. 2002, 30, 181–190. [Google Scholar] [CrossRef]
  45. Pancholi, V.; Lodha, P.; Prakash, I. Estimation of Runoff and Soil Erosion for Vishwamitri River Watershed, Western India Using RS and GIS. Am. J. Water Sci. Eng. 2015, 1, 7–14. [Google Scholar] [CrossRef]
  46. Braun, K.N.; Theuerkauf, E.J.; Hurtgen, M.T.; Masterson, A.L.; Horton, D.E. Loss-On-Ignition Estimates for Soil Organic Carbon in Great Lakes Freshwater Coastal Wetlands. Wetlands 2020, 40, 1201–1206. [Google Scholar] [CrossRef]
  47. Dayathilake, D.D.T.L.; Lokupitiya, E.; Wijeratne, V.P.I.S. Estimation of Soil Carbon Stocks of Urban Freshwater Wetlands in the Colombo Ramsar Wetland City and Their Potential Role in Climate Change Mitigation. Wetlands 2021, 41, 1–10. [Google Scholar] [CrossRef]
  48. Ferretto, A.; Brooker, R.; Aitkenhead, M.; Matthews, R.; Smith, P. Potential Carbon Loss from Scottish Peatlands under Climate Change. Reg. Environ. Chang. 2019, 19, 2101–2111. [Google Scholar] [CrossRef] [Green Version]
  49. Bache, B.W.; Chesworth, W.; Chesworth, W.; Gessa, C.; Lewis, D.T. Bulk Density. In Encyclopedia of Soil Science; Springer: Berlin/Heidelberg, Germany, 2008; pp. 74–75. [Google Scholar] [CrossRef]
  50. Byers, S.C.; Mills, E.L.; Stewart, P.L. A Comparison of Methods of Determining Organic Carbon in Marine Sediments, with Suggestions for a Standard Method. Hydrobiologia 1978, 58, 43–47. [Google Scholar] [CrossRef]
  51. Bieganowski, A.; Ryżak, M. Soil Texture: Measurement Methods. In Encyclopedia of Agrophysics; Springer: Berlin/Heidelberg, Germany, 2011; pp. 791–794. [Google Scholar] [CrossRef]
  52. Lorenz, K.; Lal, R. Soil Carbon Stock. In Carbon Sequestration in Agricultural Ecosystems; Springer: Berlin/Heidelberg, Germany, 2018; pp. 39–136. [Google Scholar] [CrossRef]
  53. Blake, G.R.; Steinhardt, G.C.; Pombal, X.P.; Muñoz, J.C.N.; Cortizas, A.M.; Arnold, R.W.; Schaetzl, R.J.; Stagnitti, F.; Parlange, J.-Y.; Steenhuis, T.S.; et al. Permeability. In Encyclopedia of Soil Science; Springer: Berlin/Heidelberg, Germany, 2008; pp. 531–538. [Google Scholar] [CrossRef]
  54. Hudson, N. Soil Conservation; Batsford: London, UK, 1995; ISBN 9780713473537. [Google Scholar]
  55. Bhattacharyya, R.; Ghosh, B.; Mishra, P.; Mandal, B.; Rao, C.; Sarkar, D.; Das, K.; Anil, K.; Lalitha, M.; Hati, K.; et al. Soil Degradation in India: Challenges and Potential Solutions. Sustainability 2015, 7, 3528–3570. [Google Scholar] [CrossRef] [Green Version]
  56. Nasir Ahmad, N.S.B.; Mustafa, F.B.; Muhammad Yusoff, S.Y.; Didams, G. A Systematic Review of Soil Erosion Control Practices on the Agricultural Land in Asia. Int. Soil Water Conserv. Res. 2020, 8, 103–115. [Google Scholar] [CrossRef]
  57. Lense, G.H.E.; Moreira, R.S.; Parreiras, T.C.; Avanzi, J.C.; Mincato, R.L. Modelagem Da Perda de Carbono Orgânico Do Solo Por Erosão Hídrica Em Uma Bacia Hidrográfica Tropical. Rev. Ciência Agronômica 2021, 52. [Google Scholar] [CrossRef]
  58. Furtak, K.; Gajda, A.M. Activity and Variety of Soil Microorganisms Depending on the Diversity of the Soil Tillage System. Sustain. Agroecosystems 2018, 45. [Google Scholar] [CrossRef] [Green Version]
  59. Hellwig, N.; Gómez-Brandón, M.; Ascher-Jenull, J.; Bardelli, T.; Anschlag, K.; Fornasier, F.; Pietramellara, G.; Insam, H.; Broll, G. Humus Forms and Soil Microbiological Parameters in a Mountain Forest: Upscaling to the Slope Scale. Soil Syst. 2018, 2, 12. [Google Scholar] [CrossRef] [Green Version]
  60. Belay, A.; Eyasu, E. Effect of Soil and Water Conservation (SWC) Measures on Soil Nutrient and Moisture Status, a Case of Two Selected Watersheds. J. Agric. Ext. Rural Dev. 2019, 11, 85–93. [Google Scholar] [CrossRef]
  61. Nave, L.E.; Swanston, C.W.; Mishra, U.; Nadelhoffer, K.J. Afforestation Effects on Soil Carbon Storage in the United States: A Synthesis. Soil Sci. Soc. Am. J. 2013, 77, 1035–1047. [Google Scholar] [CrossRef] [Green Version]
  62. Bárcena, T.G.; Kiær, L.P.; Vesterdal, L.; Stefánsdóttir, H.M.; Gundersen, P.; Sigurdsson, B.D. Soil Carbon Stock Change Following Afforestation in Northern Europe: A Meta-Analysis. Glob. Chang. Biol. 2014, 20, 2393–2405. [Google Scholar] [CrossRef] [PubMed]
  63. Miheretu, B.A.; Yimer, A.A. Spatial Variability of Selected Soil Properties in Relation to Land Use and Slope Position in Gelana Sub-Watershed, Northern Highlands of Ethiopia. Phys. Geogr. 2017, 39, 230–245. [Google Scholar] [CrossRef]
  64. Wubie, M.A.; Assen, M. Effects of Land Cover Changes and Slope Gradient on Soil Quality in the Gumara Watershed, Lake Tana Basin of North–West Ethiopia. Model. Earth Syst. Environ. 2019, 6, 85–97. [Google Scholar] [CrossRef] [Green Version]
  65. Calvo de Anta, R.; Luís, E.; Febrero-Bande, M.; Galiñanes, J.; Macías, F.; Ortíz, R.; Casás, F. Soil Organic Carbon in Peninsular Spain: Influence of Environmental Factors and Spatial Distribution. Geoderma 2020, 370, 114365. [Google Scholar] [CrossRef]
  66. Ekholm, P.; Lehtoranta, J. Does Control of Soil Erosion Inhibit Aquatic Eutrophication? J. Environ. Manag. 2012, 93, 140–146. [Google Scholar] [CrossRef]
  67. Mesfin, S.; Taye, G.; Hailemariam, M. Effects of Integrated Soil and Water Conservation Measures on Soil Aggregate Stability, Soil Organic Matter and Soil Organic Carbon Stock of Smallholder Farmlands in Semi-Arid Northern Ethiopia. Carbon Manag. 2018, 9, 155–164. [Google Scholar] [CrossRef]
  68. Walter, C.; Merot, P.; Layer, B.; Dutin, G. The Effect of Hedgerows on Soil Organic Carbon Storage in Hillslopes. Soil Use Manag. 2003, 19, 201–207. [Google Scholar] [CrossRef]
  69. Wang, C.; Pan, G.; Tian, Y.; Li, L.; Zhang, X.; Han, X. Changes in Cropland Topsoil Organic Carbon with Different Fertilizations under Long-Term Agro-Ecosystem Experiments across Mainland China. Sci. China Life Sci. 2010, 53, 858–867. [Google Scholar] [CrossRef] [PubMed]
  70. Buysse, P.; Roisin, C.; Aubinet, M. Fifty Years of Contrasted Residue Management of an Agricultural Crop: Impacts on the Soil Carbon Budget and on Soil Heterotrophic Respiration. Agric. Ecosyst. Environ. 2013, 167, 52–59. [Google Scholar] [CrossRef]
  71. Johnson, J.; Reicosky, D.; Allmaras, R.; Sauer, T.; Venterea, R.; Dell, C. Greenhouse Gas Contributions and Mitigation Potential of Agriculture in the Central USA. Soil Tillage Res. 2005, 83, 73–94. [Google Scholar] [CrossRef]
  72. Raji, B.A.; Ogunwole, J.O. Potential of Soil Carbon Sequestration under Various Landuse in the Sub-Humid and Semi-Arid Savanna of Nigeria: Lessons from Long-Term Experiments. Int. J. Soil Sci. 2005, 1, 33–43. [Google Scholar] [CrossRef]
  73. Poulton, P.R.; Pye, E.; Hargreaves, P.R.; Jenkinson, D.S. Accumulation of Carbon and Nitrogen by Old Arable Land Reverting to Woodland. Glob. Chang. Biol. 2003, 9, 942–955. [Google Scholar] [CrossRef]
  74. Martin-Roberts, E.; Scott, V.; Flude, S.; Johnson, G.; Haszeldine, R.S.; Gilfillan, S. Carbon Capture and Storage at the End of a Lost Decade. One Earth 2021, 4, 1569–1584. [Google Scholar] [CrossRef]
Figure 1. Location Map of the Study Area.
Sustainability 15 00531 g001
Figure 2. SWC Treatments in the watershed (a) Drainage line treatments (b) Land area treatments.
Sustainability 15 00531 g002
Figure 3. Flowchart for preparation of the LU/LC map in GEE.
Sustainability 15 00531 g003
Figure 4. Land Use/Land Cover Map of the Watershed. (a) Before conservation measures (b) After conservation measures.
Sustainability 15 00531 g004
Figure 5. Soil Erodibility (K) Factor Map of the Watershed.
Sustainability 15 00531 g005
Figure 6. Topographic Factor (LS) Map of the Watershed.
Sustainability 15 00531 g006
Figure 7. Crop Management Factor Map of the Watershed. (a) Before conservation measures (b) After conservation measures.
Sustainability 15 00531 g007
Figure 8. Soil Loss from the Watershed. (a) Before conservation measures (b) After conservation measures.
Sustainability 15 00531 g008
Figure 9. After Conservation Measures Conservation Practice (P) Factor Map of the Watershed.
Sustainability 15 00531 g009
Figure 10. Soil Organic Carbon Content. (a) Before conservation measures (b) After conservation measures.
Sustainability 15 00531 g010
Figure 11. CER Map of the Watershed. (a) Before conservation measures (b) After conservation measures.
Sustainability 15 00531 g011
Figure 12. Carbon Loss Map of the Watershed (a) Before conservation measures (b) After conservation measures.
Sustainability 15 00531 g012
Table 1. Soil and water conservation measures in the watershed.
Total Study Area1260 ha
Total Treated Area545 ha
Perimeter of treated area12.77 km
Area Under DCCT495 ha
Length of DCCT99,600 running m
Area Under Compartment Bunding50 ha
Earthen Nala Bunds38 nos.
Percolation Tanks2 nos.
Loose Boulder Structures97 nos.
Table 2. USLE parameters and their data source.
USLE ParametersData Sources
Rainfall Erosivity Factor (R)Rainfall data (1991 to 2021) collected from Department of Agrometeorology, MPKV, Rahuri.
Soil Erodibility Factor (K)Field soil sampling and analysis (50 soil samples)
Slope Length Factor (LS)Digital Elevation Model (SRTM Dem with 30 m spatial resolution)
Crop Management Fact (C)Satellite Imagery (Sentinel 2A with 10 m spatial resolution)
Conservation Practice factor (P)Field Survey
Table 3. Crop management (C) factor for different land cover classes.
Sr. No.Land Use/Land CoverC Value
1Forest [44]0.04
2Barren land [44]0.84
3Settlement [44]0
4Horticultural crops [45]0.1
5Agriculture land [45]0.45
6Waterbody [45]0
7Current fallow [45]0.6
Table 4. Erosion class and CER values.
Sr. No.Erosion ClassErosion Range (t ha−1 yr−1)CER Value
1Very low<53.62
2Low5 to 103.28
3Moderate10 to 202.3
4Severe20 to 402.3
5Extremely severe>402.04
Table 5. Area coverage by different land use/land cover classes before and after conservation measures.
Sr. No.Land Cover ClassYear 2016Year 2021Change in Area (ha)Change in Area (%)
(Before Conservation Measures)
Area (ha)
(After Conservation Measures)
Area (ha)
1Waterbody32.9141.488.5726.04
2Barren Land605.65478.17−127.48−21.05
3Agriculture162.17230.167.9341.89
4Natural Vegetation231.95304.9773.0231.48
5Current Fallow93.7440.49−53.25−56.81
6Settlement58.3972.8214.4324.71
7Horticulture75.1991.9716.7822.32
(−) ve value indicates decrease in area.
Table 6. Soil type wise soil erodibility (K) factor values (t-ha-hr/ha-MJ-mm).
Soil TypeMinimumMaximumMeanCoefficient of Variation
Sandy Clay Loam0.0310.0520.04415.64
Sandy loam0.0520.0600.0564.48
Clay Loam0.0290.0330.0316.08
Table 7. Area under different soil erosion classes before and after conservation measures.
Soil Erosion ClassSoil Loss
(t ha−1 yr−1)
Before Conservation MeasuresAfter Conservation Measures
Area (ha)Area (ha)
Slight<5365.27574.75
Moderate5 to 10161.54414.36
Moderately Severe10 to 20216.51102.53
Severe20 to 40397.13130.12
Very Severe>40119.5438.224
Table 8. Land cover wise SOC content before and after conservation measures.
Land CoverSOC Content before Conservation Measures (%)SOC Content after Conservation Measures (%)Total Number of Samples
Agriculture land0.64 ± 0.070.76 ± 0.1010
Barren land0.51± 0.100.62 ± 0.1115
Natural Vegetation land0.70 ± 0.080.87 ± 0.0715
Horticulture land0.65 ± 0.040.81 ± 0.1010
Average0.620.77
Table 9. Area under different carbon erosion classes before and after conservation measures.
Carbon Loss ClassCarbon Loss Range
(kgC ha−1 yr−1)
Before Conservation MeasuresAfter Conservation Measures
Area (ha)Area (ha)
Very low<100323560
Low100–200250415
Moderate200–300435172
Severe300–40018581
Extremely Severe>4006732
Table 10. Treatment wise yearly SOC content, Bulk density and SOC stock at 0–15 and 15–30 cm depths.
YearParameterDepthTreatments
Agriculture #Barren *Forest *Mango *
2020
(Y1)
SOC (%)0–150.73 ± 0.080.61 ± 0.120.86 ± 0.60.78 ± 0.1
15–300.7 ± 0.040.57 ± 0.090.82 ± 0.060.75 ± 0.03
Bulk density
(gm/cc)
0–151.381.461.461.43
15–301.421.51.481.46
SOC stock
(t ha−1)
0–1515.11113.35918.83416.731
15–3014.9112.82518.20416.425
2021
(Y2)
SOC (%)0–150.76 ± 0.10.62 ± 0.110.87 ± 0.070.81 ± 0.1
15–300.72 ± 0.050.58 ± 0.060.83 ± 0.080.77 ± 0.05
Bulk density
(gm/cc)
0–151.381.451.451.44
15–301.431.491.471.47
SOC stock
(t ha−1)
0–1515.45913.48519.28817.099
15–3015.11412.92318.45116.626
2022
(Y3)
SOC (%)0–150.78 ± 0.090.64 ± 0.120.9 ± 0.10.85 ± 0.12
15–300.75 ± 0.080.59 ± 0.080.85 ± 0.10.78 ± 0.07
Bulk density
(gm/cc)
0–151.391.461.461.44
15–301.441.51.471.46
SOC stock
(t ha−1)
0–1515.90113.63319.79117.491
15–3015.34513.02618.69316.854
# indicates CB treatment and * indicates DCCT treatment.
Table 11. Treatments wise yearly SOC stock (t ha−1) and SOC sequestration rate (t C ha−1 yr−1) at 0–30 cm depth.
Land Cover2020
(Y1)
2021
(Y2)
2022
(Y3)
SOC Increase Rate Y1 to Y2SOC Increase Rate Y2 to Y3Avg. SOC Increase Rate
Agriculture #30.02130.57331.2460.5520.6730.612
Barren *26.18426.40826.6590.2240.2510.237
Forest *37.03837.73938.4840.7010.7450.723
Mango *33.15633.72534.3450.5690.6200.594
# indicates CB treatment and * indicates DCCT treatment.
Disclaimer/Publisher’s Note: The statements, opinions and data contained in all publications are solely those of the individual author(s) and contributor(s) and not of MDPI and/or the editor(s). MDPI and/or the editor(s) disclaim responsibility for any injury to people or property resulting from any ideas, methods, instructions or products referred to in the content.

