Abstract
Ganoderma boninense is a white-rot fungus that causes basal stem rot (BSR) disease in the oil palm. Potential natural inhibitors, such as gallic acid, thymol, propolis, and carvacrol, were assessed for their antagonistic effects against G. boninense. These naturally occurring phenolic compounds have also been utilised to inhibit hydrolytic and ligninolytic enzymes produced by the pathogen. Mycelial inhibition was dose-dependent in the presence of different concentrations of phenolic compounds, including, for example, in cellulase enzyme inhibition (GA mg/mL = 94%, THY 0.25 mg/mL = 90%, PRO 3.5 mg/mL = 92.5%, and CARV 0.15 mg/mL = 90.3%). A significant difference was observed revealing that gallic acid had the greatest inhibitory effect on the secretion of hydrolytic and ligninolytic enzymes, especially at 40 mM GA (cellulase = 0.337 U/mL, amylase = 0.3314 U/mL, xylanase = 0.211 U/mL, laccase = 0.4885 U/mL, lignin peroxidase = 0.218 U/mL, and manganese peroxidase = 0.386 U/mL). The growth and secretion of enzymes (inhibitory action) are inversely proportional to the concentration of phenolic compounds. Phenolic compounds have a greater potential as inhibitory agents and suppress the production of hydrolytic and ligninolytic enzymes. The selected phenolic compounds were evaluated for their ability to alter the morphology and integrity of G. boninense mycelia. The reduction in cell viability of G. boninense has been explained by research on morphological disruption, such as branching patterns, hyphal length, and rigidity of fungal cells, which eventually interrupt the secretion of enzymes. These studies highlight the efficacy of phenolic compounds in treating Ganoderma. In addition, these findings proved that naturally occurring phenolic compounds could be a substitute for chemical controls and other synthetic fungicides to eradicate the occurrence of BSR in oil palms, thus avoiding a situation that is difficult to overcome.
1. Introduction
The demand for oil palm has grown annually in the global market. As a remedy, the annual establishment and expansion of oil palm plantation areas has been carried out. However, Malaysian biodiversity is in jeopardy because of habitat loss caused by deforestation and agricultural land expansion. Despite the expanded cultivation area, palm oil output is impeded by pests and diseases, such as upper stem rot and basal stem rot [1]. The major disease that causes OP to collapse is BSR disease, which is caused by the white-rot fungus Ganoderma boninense. BSR spreads when healthy oil palm roots come into contact with infected roots because of the interaction between the pathogen and roots and the release of spores [2]. Pathogenesis requires the pathogen to break down polysaccharides concurrently or selectively during conversion [3,4].
The pathophysiology of the disease involves the activity of the pathogen’s ligninolytic and hydrolytic enzymes, which break down cellulose and hemicellulose components in the cell walls of the oil palm, leading to the simultaneous degradation and penetration of cellulose. Selective degradation also breaks down lignin and hemicellulose, resulting in the production of wood that is rich in cellulose and consumed by hydrolytic enzymes, such as cellulase, amylase, and xylanase [5,6,7]. These enzymes convert cellulose into simple sugars and hydrolyse hemicellulose, leading to damage to xylem tissue, which restricts nutrient and water intake. This stress affects oil palm from its roots to its branches. Furthermore, if the activities of lignin-breaking enzymes, such as laccase (Lac), manganese peroxidase (MnP), and lignin peroxidase (LiP), are suppressed, lignin breakdown is hindered. Lignin breakdown is the primary defense mechanism in plants and helps to prevent the penetration of hydrolytic enzymes released by G. boninense PER71 [8,9]. Because pathogens rely on cellulose and hemicellulose as their carbon sources, stopping the activity of hydrolytic and ligninolytic enzymes can be crucial in preventing these organisms from invading.
In the agricultural sector, phenolic compounds are increasingly emerging, with host–pathogen interactions as their primary focus. According to previous studies, phenolic substances with low molecular weights might prevent the presence of G. boninense PER71 [2,10]. When a pathogen infects a plant, the metabolic pathways of phenolic compounds are triggered, and they play a role in the manufacturing of lignin and cell walls [11]. This clarifies how plants defend themselves against disease invasion and resistance. When infection occurs in the early stages, phenolic chemicals and their derivatives accumulate [12]. Phenolic compounds work well as alternatives to chemical pesticides and are affordable for extensive cultivation. Therefore, the capacity of the five phenolic compounds to suppress the cellular growth and synthesis of hydrolytic and ligninolytic enzymes of G. boninense PER71 was investigated. These compounds include gallic acid, thymol, propolis, and carvacrol.
2. Materials and Methods
2.1. Fungi, Culture Maintenance, and Treatments
The Malaysian Palm Oil Board (MPOB), Bandar Baru Bangi, provided G. boninense strain PER71. The culture was maintained by subculturing on Potato Dextrose Agar (PDA, Oxoid Ltd., Cheshire, UK) every seven days and incubating at 28 °C. Various concentrations of gallic acid, thymol, carvacrol, and propolis were used in this study with purity more than 98% (Sigma Life Sciences, Burlington, MA, USA).
2.2. Screening of Phenolic Compounds for the Production of Hydrolytic and Lignolytic Enzymes by G. boninense per 71
2.2.1. Hydrolytic Enzymes
Evaluation of the endoglucanase activity was conducted whereby a 5 mm plug cut off from an actively growing G. boninense PER71 at edge of the culture (provided by MPOB, well-maintained for further studies; it will be very filamentous and has aerial growth) was cultured in the centre of CMC agar media comprising 20 g of CMC and 15 g of agar L−1 amended with different concentrations (based on the preliminary studies) of phenolic compounds GA (5, 6, 7, and 8 mg/mL), THY (0.1, 0.15, 0.2, and 0.25 mg/mL), PRO (2, 2.5, 3, and 3.5 mg/mL), and CARV (0.1, 0.13, and 0.15 mg/mL). Medium that was not amended with phenols served as a control. All plates were incubated in the dark for 10 days. After 10 d, the plates were flooded with Congo red (1 mg L−1) obtained from Sinar Scientific Sdn Bhd, Sri Serdang for 15 min. Then, 1 mM of NaCl (Sinar Scientific Sdn Bhd, Sri Serdang, Selangor, Malaysia) was added to observe the cellulose degradation by cellulase. A clear yellow or red background indicates that the cellulose has been degraded [2].
The medium was prepared using 2 g of starch, 1 g of peptone, 1 g of yeast extract, and 20 g of agar L−1 (Sinar Scientific Sdn Bhd, Sri Serdang, Selangor, Malaysia) and amended with different concentrations of each phenolic compound. Media plates were inoculated with a G. boninense PER71 plug (5 mm) excised from an actively growing culture and incubated in the dark for 10 days. The plates were then flooded with Lugol’s iodine (0.25% wv−1) for a few seconds. A medium containing 1 g of birchwood xylan, 0.1 g of peptone, 0.01 g of yeast extract, and 20 g of agar L−1 was used to measure xylanase activity. The medium was supplemented with different concentrations of each phenolic compound (Bucher et al., 2004). Media plates were inoculated with a G. boninense PER71 plug (5 mm Ø) excised from an actively growing culture and incubated in the dark for 10 days. The plates were then flooded with a Lugol’s iodine solution (0.25% wv−1) (Sinar Scientific Sdn Bhd). A clear zone around the colony or a purple-black background indicates xylanase production.
2.2.2. Ligninolytic Enzymes
The production of ligninolytic enzymes by G. boninense PER71 was detected by growing the culture on a medium containing RBBR dye and tannic acid in the presence of phenolic compounds GA (5, 6, 7, and 8 mg/mL), THY (0.1, 0.15, 0.2, and 0.25 mg/mL), PRO (2, 2.5, 3, and 3.5 mg/mL), and CARV (0.1, 0.13, and 0.15 mg/mL). A Petri plate containing 2% MEA supplemented with 0.05% RBBR and different concentrations of each phenolic compound was inoculated with a 5 mm Ø agar plug excised from a seven-day-old G. boninense PER71 culture. Petri dishes containing MEA supplemented only with RBBR and inoculated with or without G. boninense PER71 were used as control plates. All plates were incubated at room temperature for approximately 10 days until the control plate was fully colonised. Decolourisation of the dye confirms the production of ligninolytic enzymes [13].
G. boninense PER71 cultures were grown on a medium containing 5 g of tannic acid (Sinar Scientific Sdn Bhd, Sri Serdang, Selangor, Malaysia), 15 g of malt extract, and 20 g of agar L−1 and amended with four different concentrations, GA (5, 6, 7, and 8 mg/mL), THY (0.1, 0.15, 0.2, and 0.25 mg/mL), PRO (2, 2.5, 3, and 3.5 mg/mL), and CARV (0.1, 0.13, and 0.15 mg/mL), from each phenolic compound. A medium not amended with phenol was used as a control. The prepared media were inoculated with a mycelial disc of 5 mm excised from a 7-day-old culture of G. boninense PER71 and incubated in the dark for 10 days. The production of a dark-brown colour under the colony indicated the production of ligninolytic enzymes.
2.3. Quantification of Hydrolytic and Ligninolytic Enzymes Produced by G. boninense per 71
G. boninense PER71 was cultured in a 250 mL Erlenmeyer flask containing 40 mL of sterilised PDB and amended with phenolic compounds to obtain the desired concentrations. Sterilised oil palm wood chips obtained from Malaysian Palm Oil Board, MPOB (0.5 g) were added to the medium to induce the production of hydrolytic enzymes. Each flask was inoculated with five 5 mm mycelial plugs excised from an actively growing 7-day-old culture of G. boninense PER71. All of the treated flasks were incubated at 28 °C with constant shaking (200 rev/min−1) (PROTECH, SI 50, TUJUAN CEKAP SDN BHD, Shah Alam, Selangor, Malaysia) for 10 d. G. boninense PER71, along with the wood chips, were centrifuged at 1792× g for 40 min at 4 °C [14]. The supernatant was transferred to a fresh tube, which served as the enzyme source.
2.3.1. Cellulase Activity
Different concentrations of GA (5, 6, 7, and 8 mg/mL), THY (0.1, 0.15, 0.2, and 0.25 mg/mL), PRO (2, 2.5, 3, and 3.5 mg/mL), and CARV (0.1, 0.13, and 0.15 mg/mL) phenolic compounds were prepared in 100 mL conical flasks containing 50 mL of Sabouraud Dextrose Broth, and 0.5% of carboxymethyl cellulose as a carbon source was added into the conical flask. Flasks containing only culture media without phenolic compounds were used as positive controls. Each conical flask was inoculated with three plugs of 5 mm diameter mycelium excised from the actively growing G. boninense PER71 culture [8]. All samples were incubated at 24 °C for 10 days. The contents were then filtered using sterilised cheesecloth and centrifuged at 5000 rpm for 10 min. To measure cellulase activity, the total reducing sugar released from the filtered substrate using Whatman No. 1 filter paper was determined using dinitrosalicylic acid reagent [2]. The reducing sugar content was measured spectrophotometrically at 540 nm using a UV-Vis spectrometer (Model: Multiskan SkyHigh Microplate Spectrophotometer, Thermo Scientific Multiscan Go, Thermo Fisher, Vantaa, Finland). Enzyme activity was expressed as mg glucose released min−1 mg−1 fresh weight [2]. Furthermore, 1 U (umol/min) is defined as the amount of the enzyme that catalyses the conversion of one micromole of substrate per minute under the specified conditions of the assay method.
2.3.2. Amylase Activity
An aliquot of the crude enzyme extract (250 μL) from each treatment group was incubated at 50 °C for 30 min with 250 μL of 1% starch in 50 mM of sodium citrate buffer (pH 5). The reaction was stopped by the addition of 500 μL of DNS (3, 5-dinitrosalicylic acid) [15] and submerged in boiling water (100 °C) for 5 min. The mixture was cooled to room temperature, and the reaction was monitored at 540 nm using a UV-Vis spectrophotometer, Model Multiskan SkyHigh Microplate Spectrophotometer, Thermo Scientific Multiscan Go, Thermo Fisher, Vantaa, Finland [15].
2.3.3. Xylanase Activity
An aliquot of crude enzyme extract (250 µL) from each treatment group was incubated at 50 °C for 30 min with 250 µL of 1% xylan from birchwood in 50 mM of sodium citrate buffer (pH 5). The reaction was stopped by the addition of 500 µL of 3, 5-dinitrosalicylic acid (DNS) [15] and submerged in boiling water (100 °C) for 5 min. The mixture was cooled to room temperature, and the reaction was monitored at 540 nm using a UV-Vis spectrophotometer, Model Multiskan SkyHigh Microplate Spectrophotometer, Thermo Scientific Multiscan Go, Thermo Fisher, Finland [15]. The negative control PDB without phenolic compounds served as a reference [2,16].
2.3.4. Laccase Activity
Laccase activity was measured according to the level of oxidation of 2, 2-azino-bis (ABTS) substrate converted to a more stable cation radical, and it was spectrophotometrically determined at 420 nm. The assay mixture consists of 0.5 mM of ABTS in 0.1 M of sodium acetate at a pH of 4.5. The reaction mixture was initialised by adding 100 µL of crude enzyme extract to the existing 2.8 mL of ABTS solution [2].
2.3.5. Lignin Peroxidase Activity
Lignin peroxidase activity was quantified as the amount of veratryl alcohol oxidised to veratryl aldehyde [2]. The reaction mixture contained 1 mL of 125 mM sodium tartrate buffer (pH 3.0), 10 mM of veratryl alcohol, and 0.5 mL of crude enzyme extract (0.5 mL). The reaction was activated through the addition of 500 uL of 0.2 mM hydrogen peroxide solution, and the mixture was read spectrophotometrically (Model: Multiskan SkyHigh Microplate Spectrophotometer, Thermo Scientific Multiscan Go, Thermo Fisher, Vantaa, Finland) at 310 nm.
2.3.6. Manganese Peroxidase Activity
Manganese peroxidase activity was measured based on the oxidation of guaiacol. The reaction mixture contained 0.5 mL each of 100 mM of sodium tartrate buffer (pH 5), 100 mM of guaiacol, 50 mM of hydrogen peroxide, and 0.1 mL of crude enzyme extract. All laccase, lignin peroxidase, and manganese peroxidase activities are expressed in units per millilitre (U/mL) [2].
2.4. Scanning Electron Microscopy
Scanning Electron Microscopy (SEM) was used to investigate the effect of phenolic compounds on the mycelial morphology of G. boninense PER71 (SEM). SEM images were obtained by peeling off the surface of each G. boninense PER71 culture grown on PDA plates containing various concentrations of phenolic compound. One centimetre (five per sample) of the excised culture was preserved in 4% glutaraldehyde for 12–24 h. Following a 0.1 M sodium cacodylate buffer wash, the cultures were fixed with osmium tetroxide fixed for two hours. The samples were dehydrated in a sequence of alcohol concentrations (30, 40, 50, 60, 70, 80, 90, and 100%) for 10 min. The prepared samples were immersed thrice for 15 min in a 100% acetone solution. The samples were then coated with gold–palladium and dried to the critical point using liquid CO2. The coated mycelial cultures were observed under an SEM (JEOL, JSM 6400, Tokyo, Japan) operating at 15 kV [8].
2.5. High-Resolution Transmission Electron Microscopy (HR-TEM)
As stated in the previous section, mycelial sample surfaces were peeled off and subjected to a 6% glutaraldehyde solution for 24 h at room temperature. The samples were dehydrated in an HPLC graded ethanol series for five minutes, CO2-dried (SAMDRI 780-B Tousimis, Rockville, MD, USA), and then sputter-coated with gold–palladium in a Nanotech sputter coater after three rinses with 0.02 M of phosphate buffers (BAL-TEC SDC 050, New York, NY, USA). The coated mycelial samples were kept in a desiccator until they were inspected. The samples were embedded in resin (EMS, cat. 14380) and allowed to polymerise, and the samples were maintained. Ultrathin pieces (60 nm thick) were cut using a diamond knife (Ultracut R, Leica, Washington, DC, USA) and collected on Formvar-coated copper grids (EMS cat. FCF200). After contrast in uranyl acetate and lead citrate, they were cleaned and examined using a JEM-2100F field-emission electron microscope [8,17].
2.6. Statistical Analysis
Data were analysed using SAS Statistical Software, version 9.4 English. Statistical significance was set at p ≤ 0.05. Means were compared using Tukey’s Studentized Range (HSD) test. The experiments were conducted at a probability level of 95% (α = 0.05). The results are expressed as the mean ± standard error obtained from four replicates.
3. Results
3.1. Qualitative and Quantitative Analyses of Hydrolytic Enzymes
Cellulase, Amylase, and Xylanase Activity
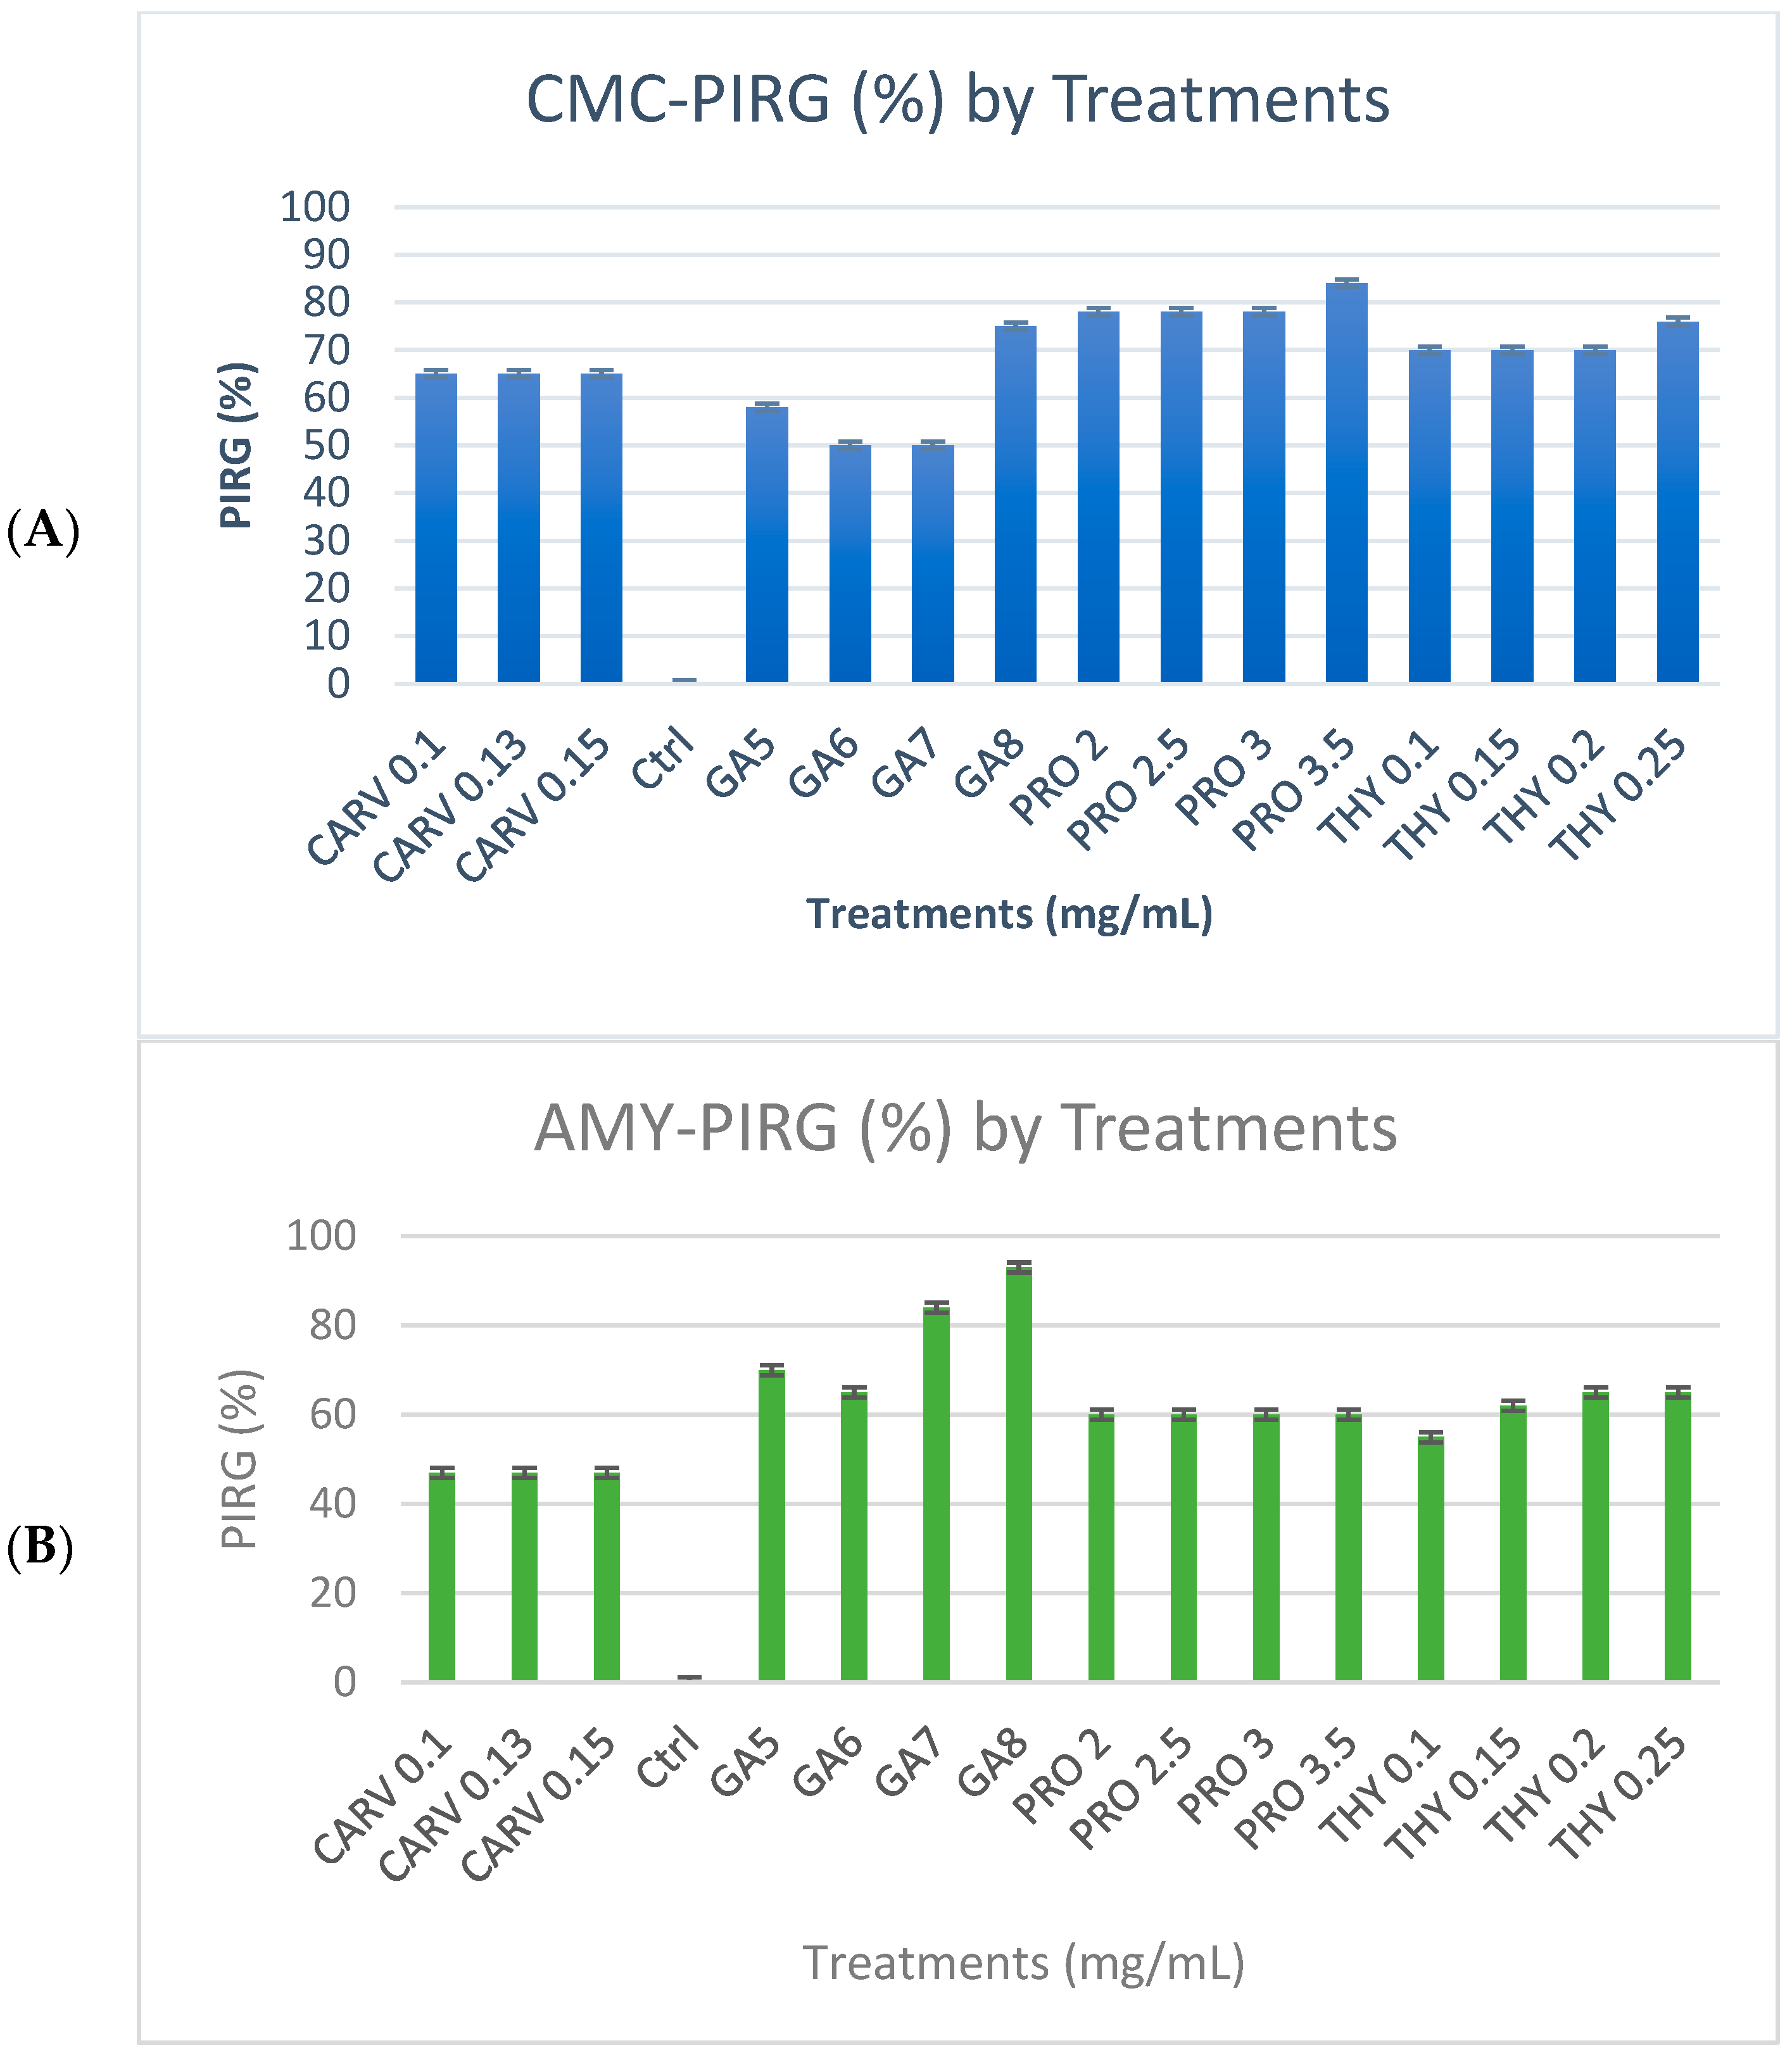
Figure 1A shows the cellulase enzyme produced by G. boninense PER71 under the influence of specific concentrations (mg/mL) of phenolic compounds GA-5, 6, 7, and 8, THY-0.1, 0.15, 0.2, and 0.25, PRO-2, 2.5, 3, and 3.5, and CARV-0.1, 0.13, and 0.15. Based on this observation, mycelial growth was not as prominent in the media treated with GA. Yet, a deeply coloured brown zone was noticeable as a background of the mycelial plug with the PIRG = 94% in GA 8 mg/mL plate, 90% in THY 0.25 mg/mL, 92.5% in PRO 3.5 mg/mL, and 90.3% in CARV 0.15 mg/mL treated plates. Most CMC plates treated with phenolic compounds appear to have very fine and thin mycelial structures.
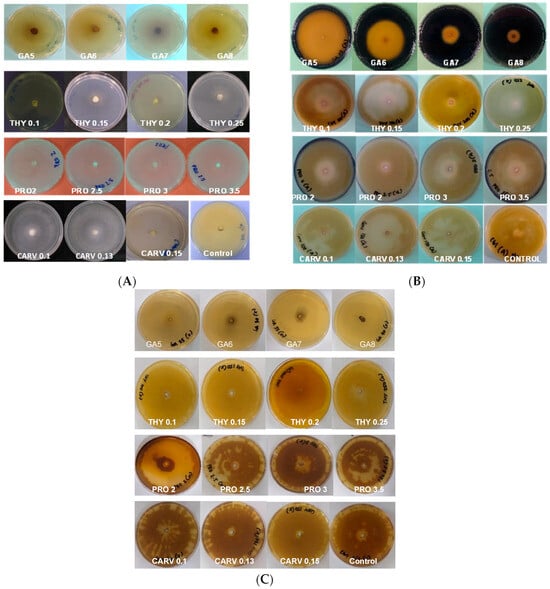
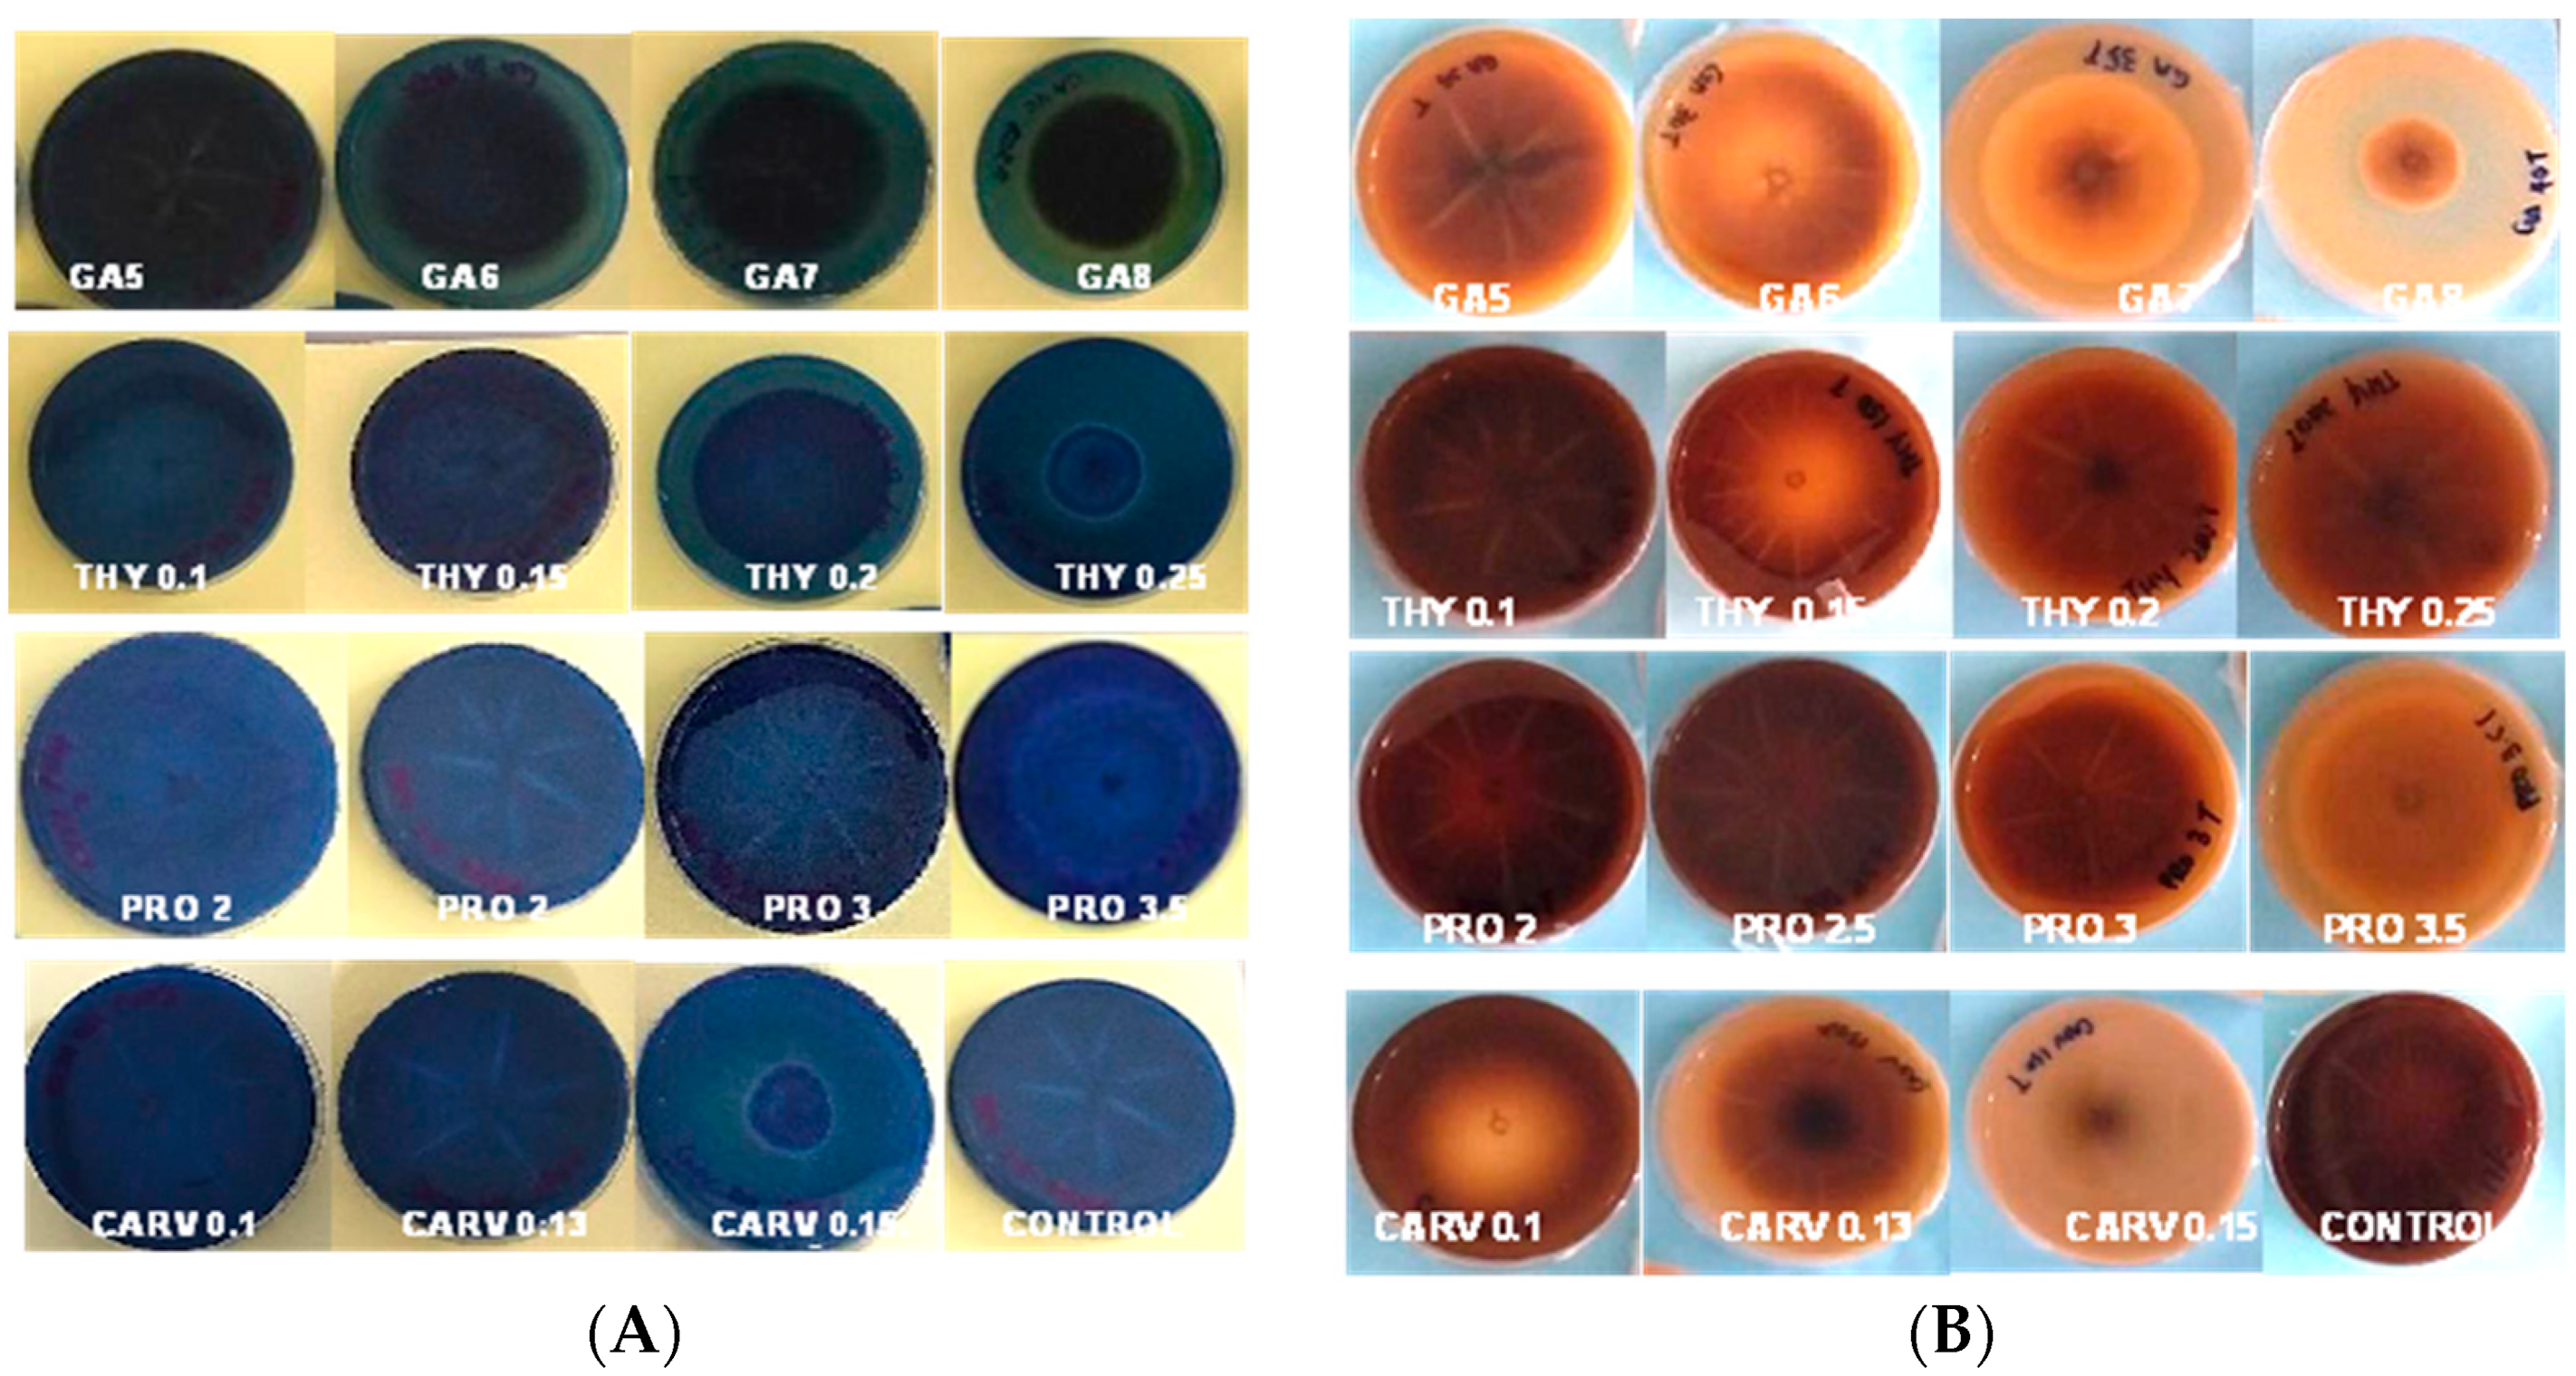
Figure 1.
(A) Poison Food test of G. boninense PER71 in the presence of different concentrations of phenolic acids and degradation of (A) cellulose, (B) starch, and (C) xylan. GA—Gallic acid; THY—Thymol; PRO—Propolis; CARV—Carvacrol.
Figure 1B represents the degradation of starch due to amylase enzyme produced by the G. boninense PER71 at different concentrations (mg/mL) of phenolic compounds GA-5, 6, 7, and 8, THY-0.1, 0.15, 0.2, and 0.25, PRO-2, 2.5, 3, and 3.5 and CARV-0.1, 0.13, and 0.15. All plates with specific treatments inhibited the growth of fungi, which corresponded to decreased production of amylase. Each phenolic compound exhibited a p-value of <0.05, which is p = 0.0001, as referred to in the measurement of mycelial growth diameter. The plates treated with GA8 showed the best result in the degradation of starch by exhibiting the least amount of clear zone and a higher length of purple-black background (Figure 1B); the PIRG values are GA 8 mg/mL = 96%, THY 0.25 mg/mL = 4.6%, PRO 3.5 mg/mL = 8.7%, and CARV 0.15 mg/mL = 3.2%.
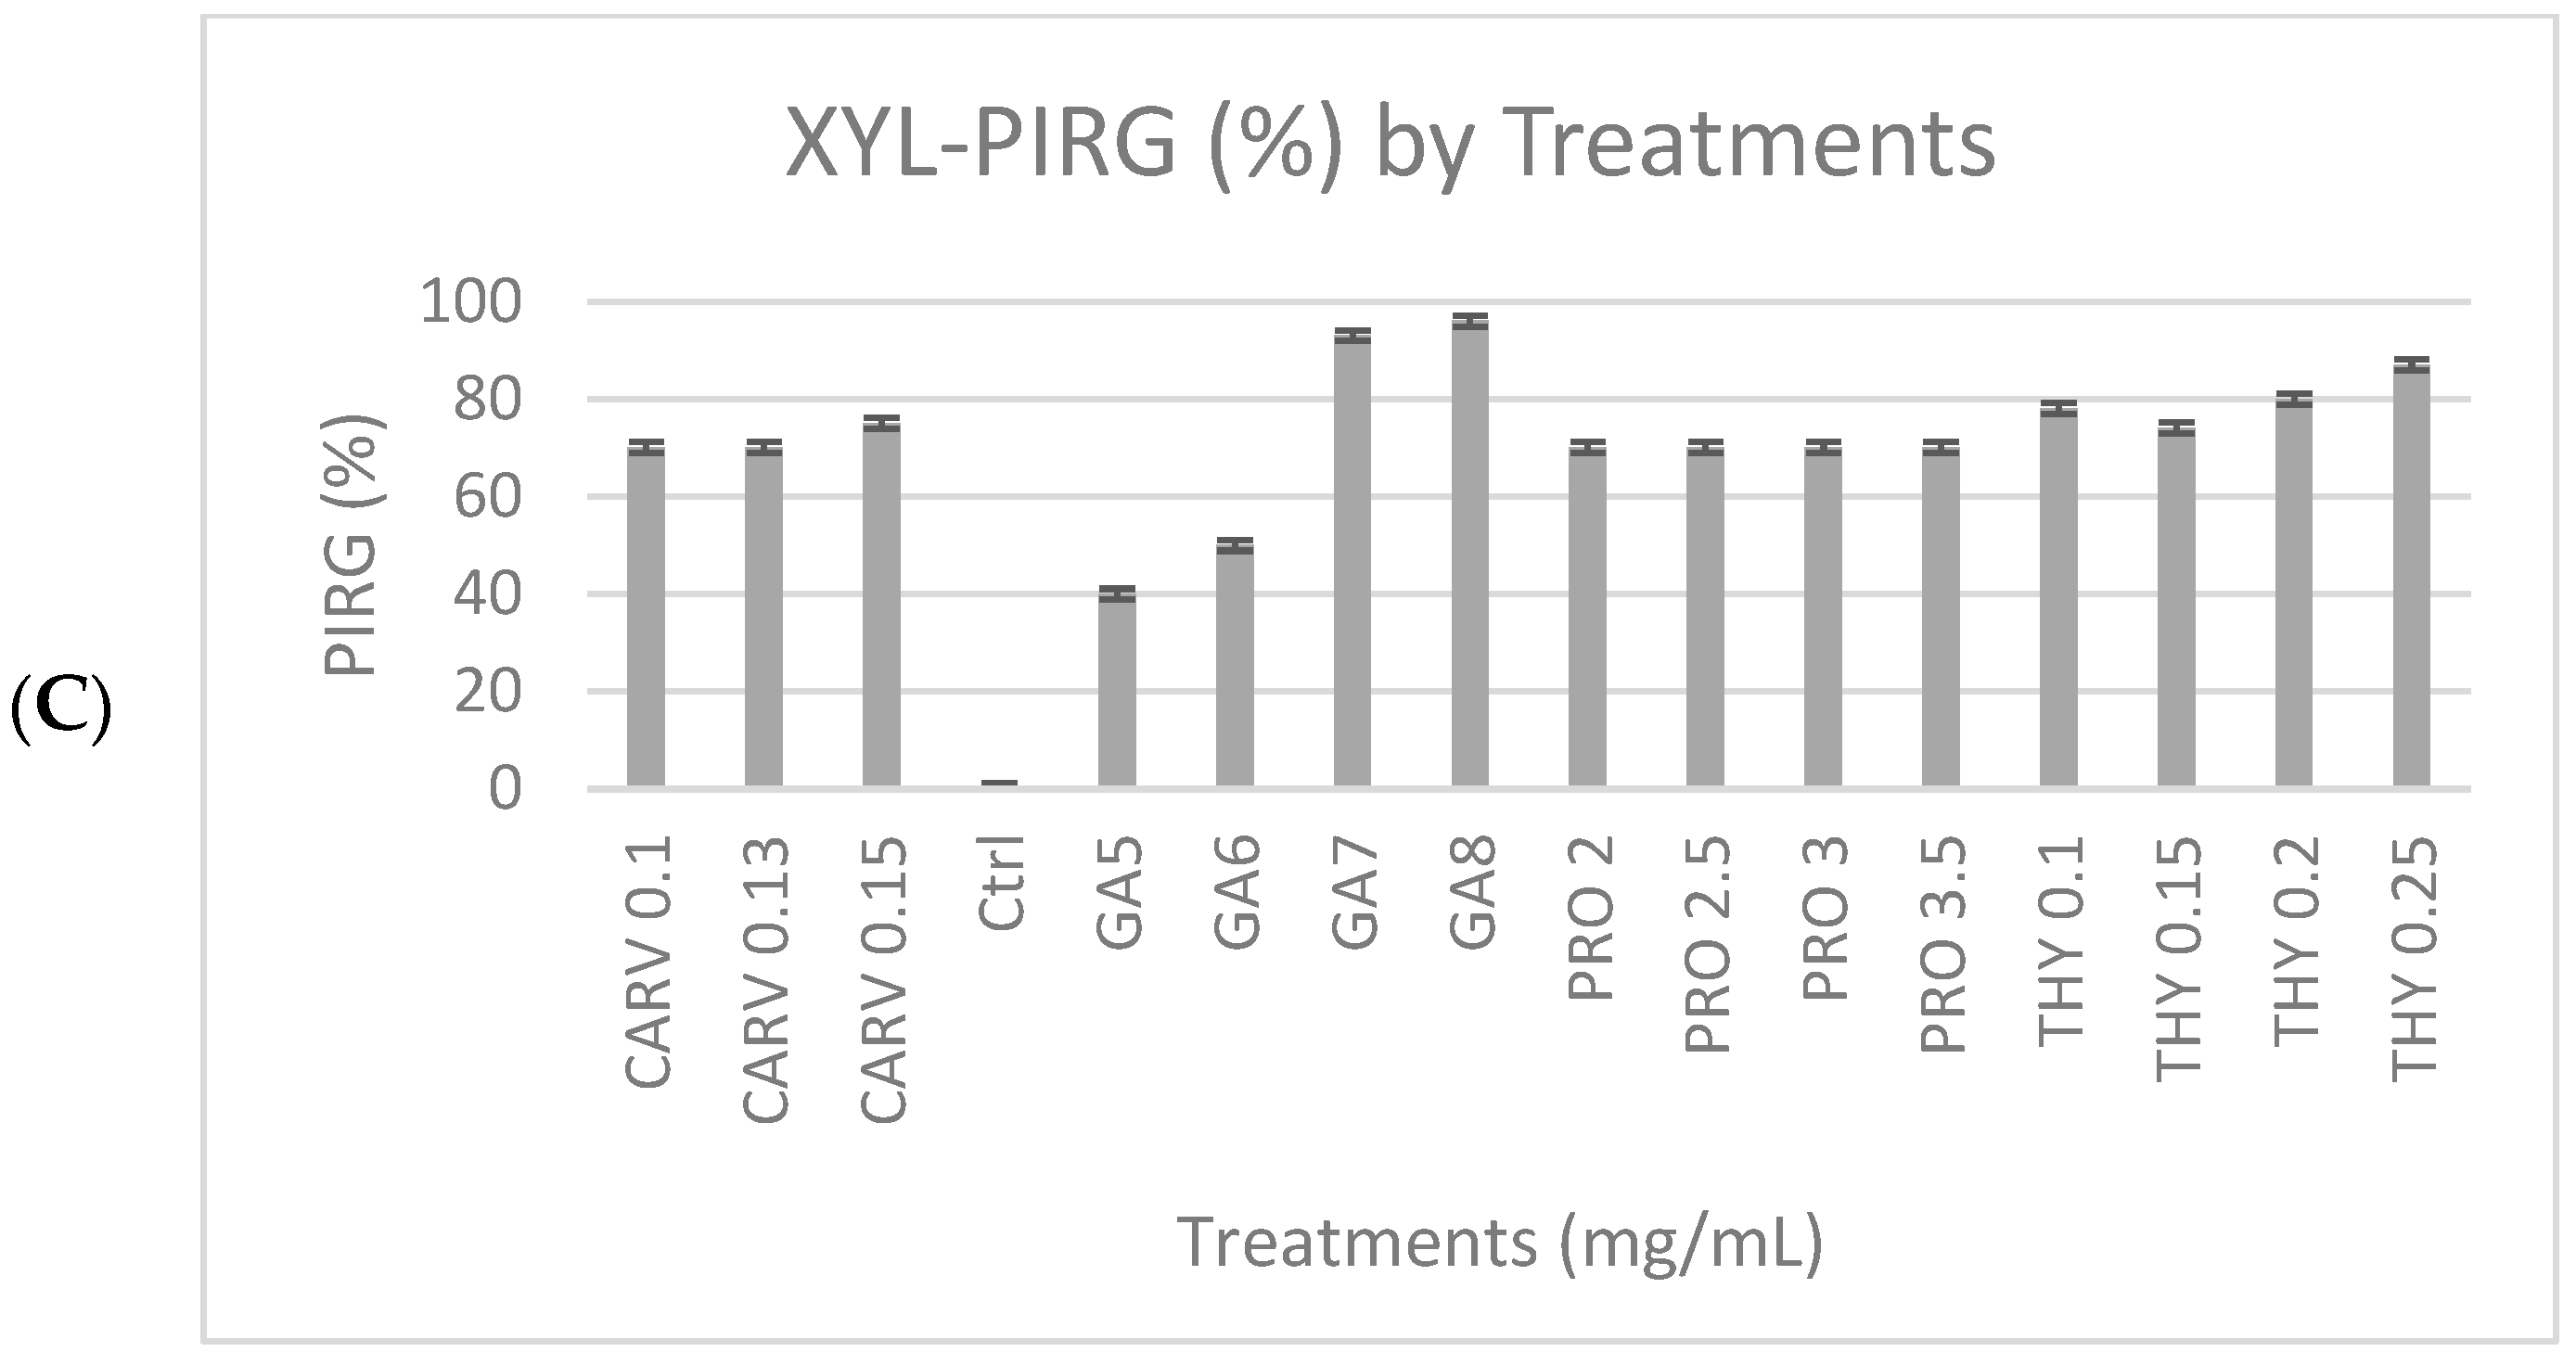
Figure 1C, shows the degradation of xylan due to the xylanase enzyme produced by the G. boninense PER71 and when treated with specific concentrations (mg/mL) of phenolic compounds GA-5, 6, 7, and 8, THY-0.1, 0.15, 0.2, and 0.25, PRO-2, 2.5, 3, and 3.5, and CARV-0.1, 0.13, and 0.15. Various ranges of GA concentrations inhibited the growth of fungi, which proved that the production of xylanase was decreasing. GA was significantly different from other phenolic compounds, with a p-value of <0.05, which was 0.0001, referring to the measurement of the diameter of the mycelial growth (PIRG = 94%). Other than that, the degradation of dye observed in THY 0.25 mg/mL was 3%, PRO 3.5 mg/mL = 2.7%, and CARV 0.15 mg/mL = 1.8%, respectively. Fully colonised Petri dishes containing G. boninense PER71 were used as a reference.
The tested phenolic compounds exhibited significant inhibitory effects on the radial expansion of G. boninense mycelium for enzyme degradation at varying concentrations, as illustrated in Figure 2. The minimum concentration required for each phenolic compound to impede the growth of G. boninense mycelia range varies depending on the specific phenolic compound in question. For instance, degradation of enzyme and mycelial growth was suppressed on plates supplemented with 8 mg/mL of gallic acid, 3.5 mg/mL of propolis, or 0.25 mg/mL of thymol. Notably, phenolic compounds with high concentrations inhibited mycelial growth compared to growth observed on control plates. In general, gallic acid, propolis, and thymol were the most effective among the phenolic compounds, exhibiting significant inhibitory effects when compared to the other phenols investigated. The presence of phenols at varying concentrations in the growth medium had a notable impact on the growth of G. boninense mycelium.
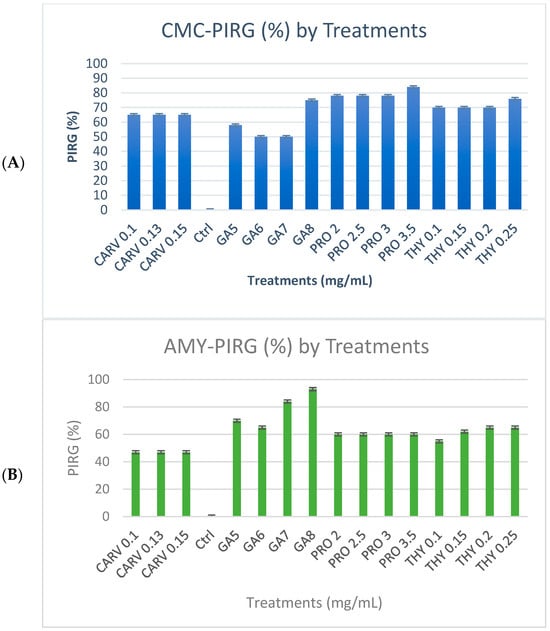
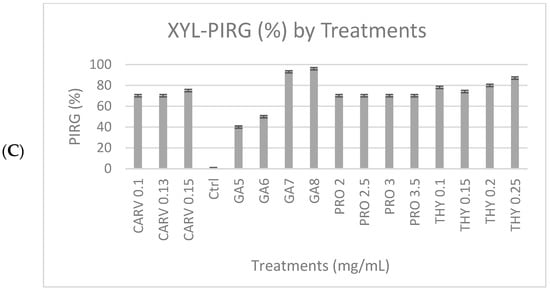
Figure 2.
Percentage inhibition of radial growth (PIRG %) of G. boninense PER71 treated with different concentrations of phenolic compounds on enzyme production. The graph shows the percentage of enzyme production for (A) cellulase, (B) amylase, (C) xylanase, and the interpretation of data is based on 100% enzyme production. Vertical bars indicate standard error, and each value represents the mean of four replicates.
The effects of the four phenolic acids on hydrolytic enzyme activity of G. boninense PER71 are presented in Table 1. The amounts of cellulase, amylase, and xylanase produced by G. boninese in the presence of GA were lower than those of the other phenolic compounds. Carvacrol exhibited the highest level of enzyme synthesis among all hydrolytic enzyme activities mentioned below. The amounts of cellulase, amylase, and xylanase produced by the control were 1.43, 1.37, and 1.1147 U/mL, respectively. The production of all of these enzymes by G. boninense PER71 was significantly different from that of the control when influenced by the selected phenolic compounds at p < 0.05.

Table 1.
Effect of phenolic compounds on hydrolytic enzyme activity by G. boninense PER71.
3.2. Qualitative and Quantitative Analyses of Ligninolytic Enzymes
Laccase, Lignin Peroxidase, and Manganese Peroxidase Activity
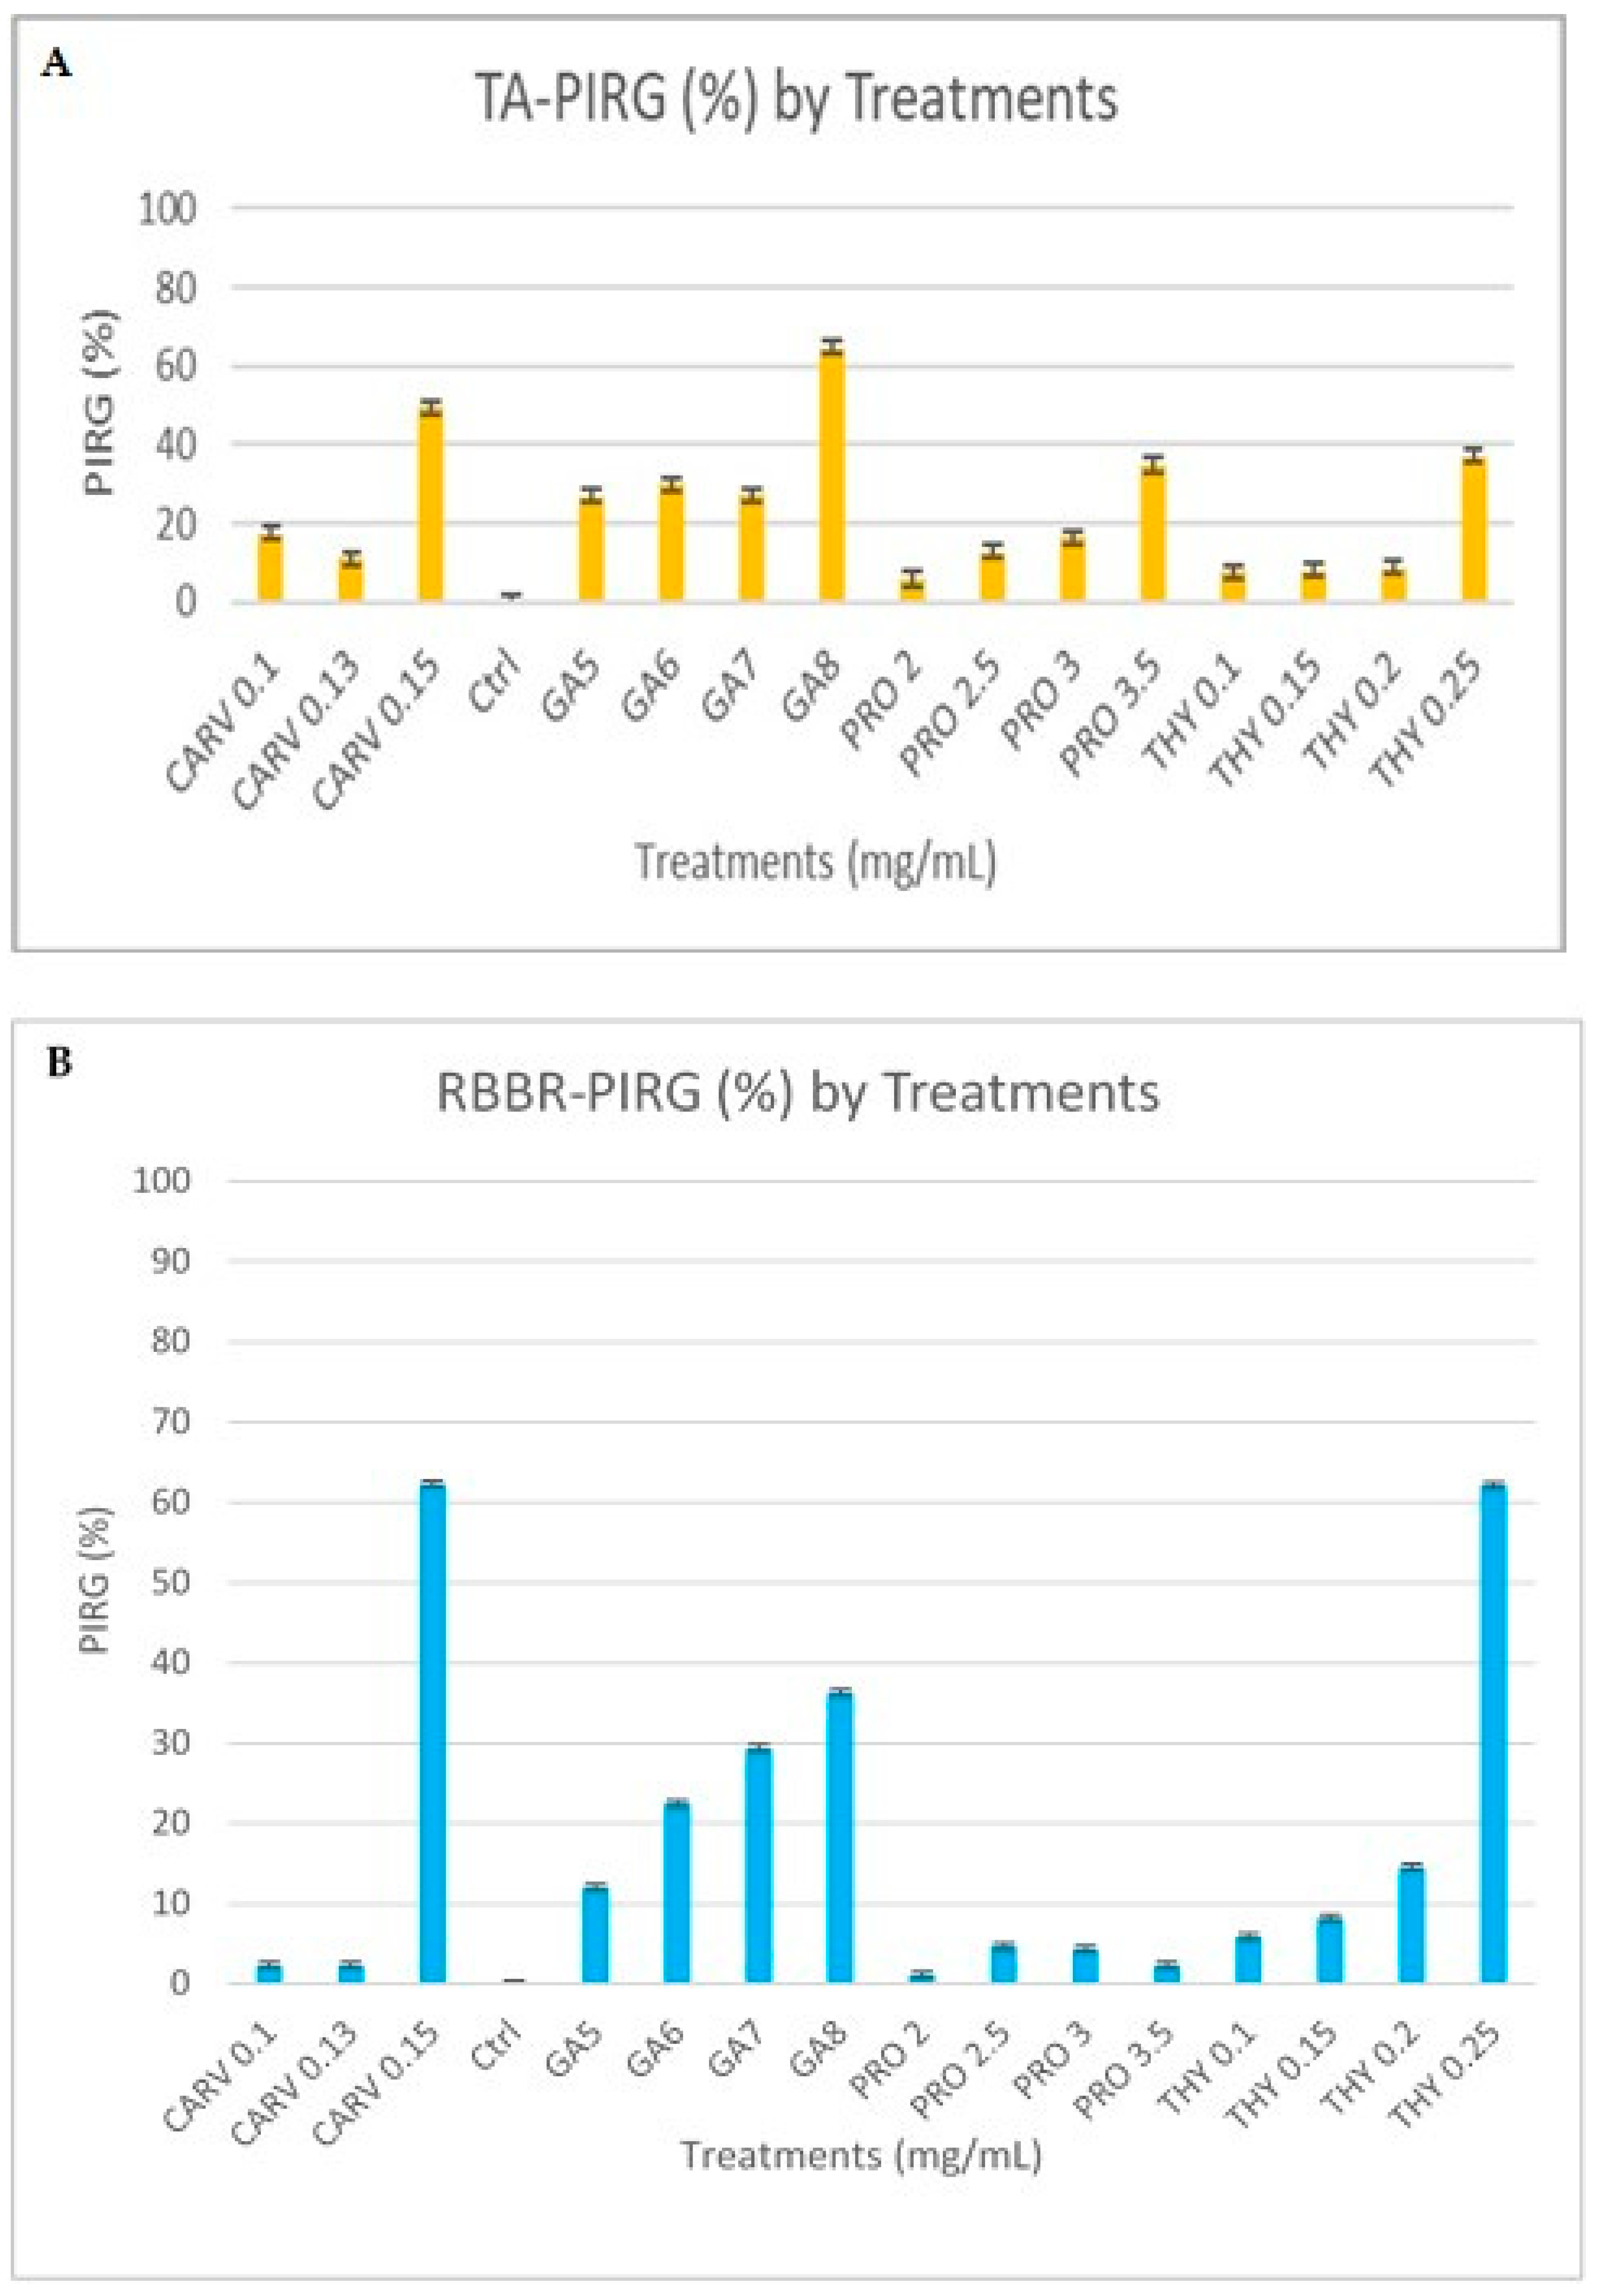
Figure 3A,B represent RBBR and tannic acid degradation by G. boninese in the presence of different concentrations of phenolic acids GA-5, 6, 7, and 8, THY-0.1, 0.15, 0.2, and 0.25, PRO-2, 2.5, and 3, and CARV-0.1, 0.13, and 0.15. In GA 8 mg/mL treated plates, the mycelia had dark and light brownish circular patterns with brown exudates, but on THY 0.2 and 0.25 treated plates, orange-coloured exudates were spotted. PRO-treated plates had a circular mycelial structure, and for CARV, an intense dark zone was observed in the background of the plate. The degradation of dye was visible, and the PIRG for plates with the highest concentrations were GA (8 mg/mL = 84%), THY (0.25 mg/mL = 2%), PRO (2.5 mg/mL = 6.5%), and CARV (0.15 mg/mL = 1.8%). Figure 3A presents the laccase produced by G. boninense PER71, and GA, THY, and CARV at higher concentrations inhibited the growth of fungi, which corresponded to lower production of enzymes. The PIRG recorded was THY 0.25 mg/mL = 84%, CARV 0.15 mg/mL = 80%, GA 8 mg/mL with 15%, and PRO 3.5 mg/mL = 13.25% at a p-value of <0.05, which is p = 0.0001 calculated on the Tukey (HSD) test, which significantly impacts the production of the enzyme (Figure 4). Figure 3B presents the lignin and manganese peroxidase enzyme produced by the G. boninense PER71 when treated with different concentrations (mg/mL) of phenolic compounds GA-5, 6, 7, and 8, THY-0.1, 0.15, 0.2, and 0.25, PRO-2, 2.5, 3, and 3.5, and CARV-0.1, 0.13, and 0.15. GA and THY significantly affected the production of MnP and LiP (p = 0.0055 and <0.0001, respectively).
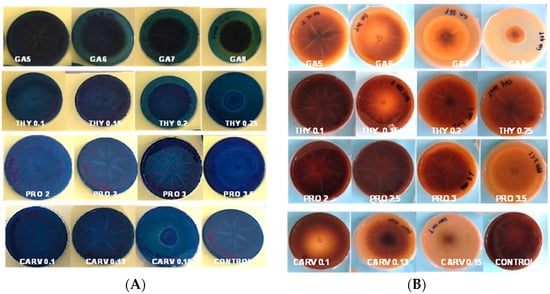
Figure 3.
Poison Food test of G. boninense PER71 in the presence of different concentrations of phenolic acids and degradation of (A) RBBR dye and (B) tannic acid. GA—Gallic acid; THY—Thymol; PRO—Propolis; CARV—Carvacrol.
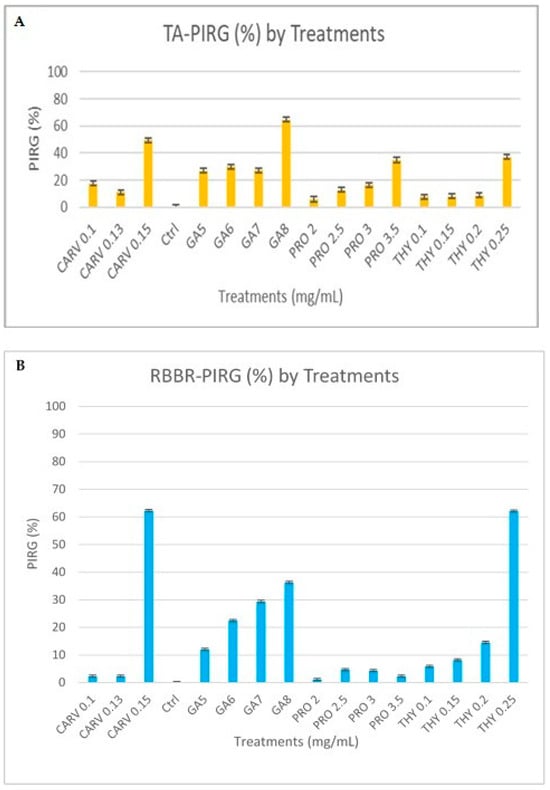
Figure 4.
Percentage inhibition of radial growth (PIRG %) of G. boninense PER71 treated with different concentrations of phenolic compounds on enzyme production. The graph shows the percentage of enzyme production of (A) tannic Acid and (B) RBBR. The interpretation of data is based on 100% of enzyme production. Vertical bars indicate standard error, and each value represents the mean of four replicates.
G. boninense cultures cultivated on media containing RBBR dye and phenolic treatments exhibited a significantly reduced decolourisation effect (p ≤ 0.005) when compared to the control group, as shown in Figure 3. Over the observation period, the culture growing on the control plate completely colonised the plate and effectively decolourised the RBBR dye. This decolourisation process indicated the production of ligninolytic enzymes. Conversely, media containing phenols at different concentrations inhibited the growth of G. boninense, preventing the fungus from producing ligninolytic enzymes and, consequently, not decolourising the media. Of note, G. boninense growth on media containing 0.25 mg/mL of THY was inhibited at a higher range (p ≤ 0.05), highlighting this phenol as a particularly potent inhibitor compared to the others. Similarly, G. boninense cultures grown on agar media containing tannic acid and phenolic treatments exhibited significantly reduced growth and a notably smaller dark-brown area (8 mg/mL of GA) formed under the colony in comparison to the control plates (p ≤ 0.005), as depicted in Figure 3. The presence of a dark-brown area beneath the colony indicated the secretion of ligninolytic enzymes.
The influence of the four different treatments on ligninolytic enzyme activity of G. boninense PER71 is shown in Table 2. The significant variations in the enzymatic activities of Lac, LiP, and MnP, affected by the four different phenolic compounds, demonstrated that the treatments prevented G. boninense PER71 from producing its own enzymes. Higher levels of phenolic acids, particularly gallic acid, have a significant impact on fungal growth and boost the inhibitory function of the enzyme. Between 2.5 and 3.5 mg/mL of propolis, there was a noticeable drop in laccase enzyme activity. Similarly, lignin peroxidase activity modulated by thymol showed a reduction in enzyme activity. MnP activity was significantly reduced by gallic acid.
Table 2.
The effect of phenolic compounds on the production of ligninolytic enzyme activity by G. boninense.
3.3. Scanning Electron Microscopy (SEM)
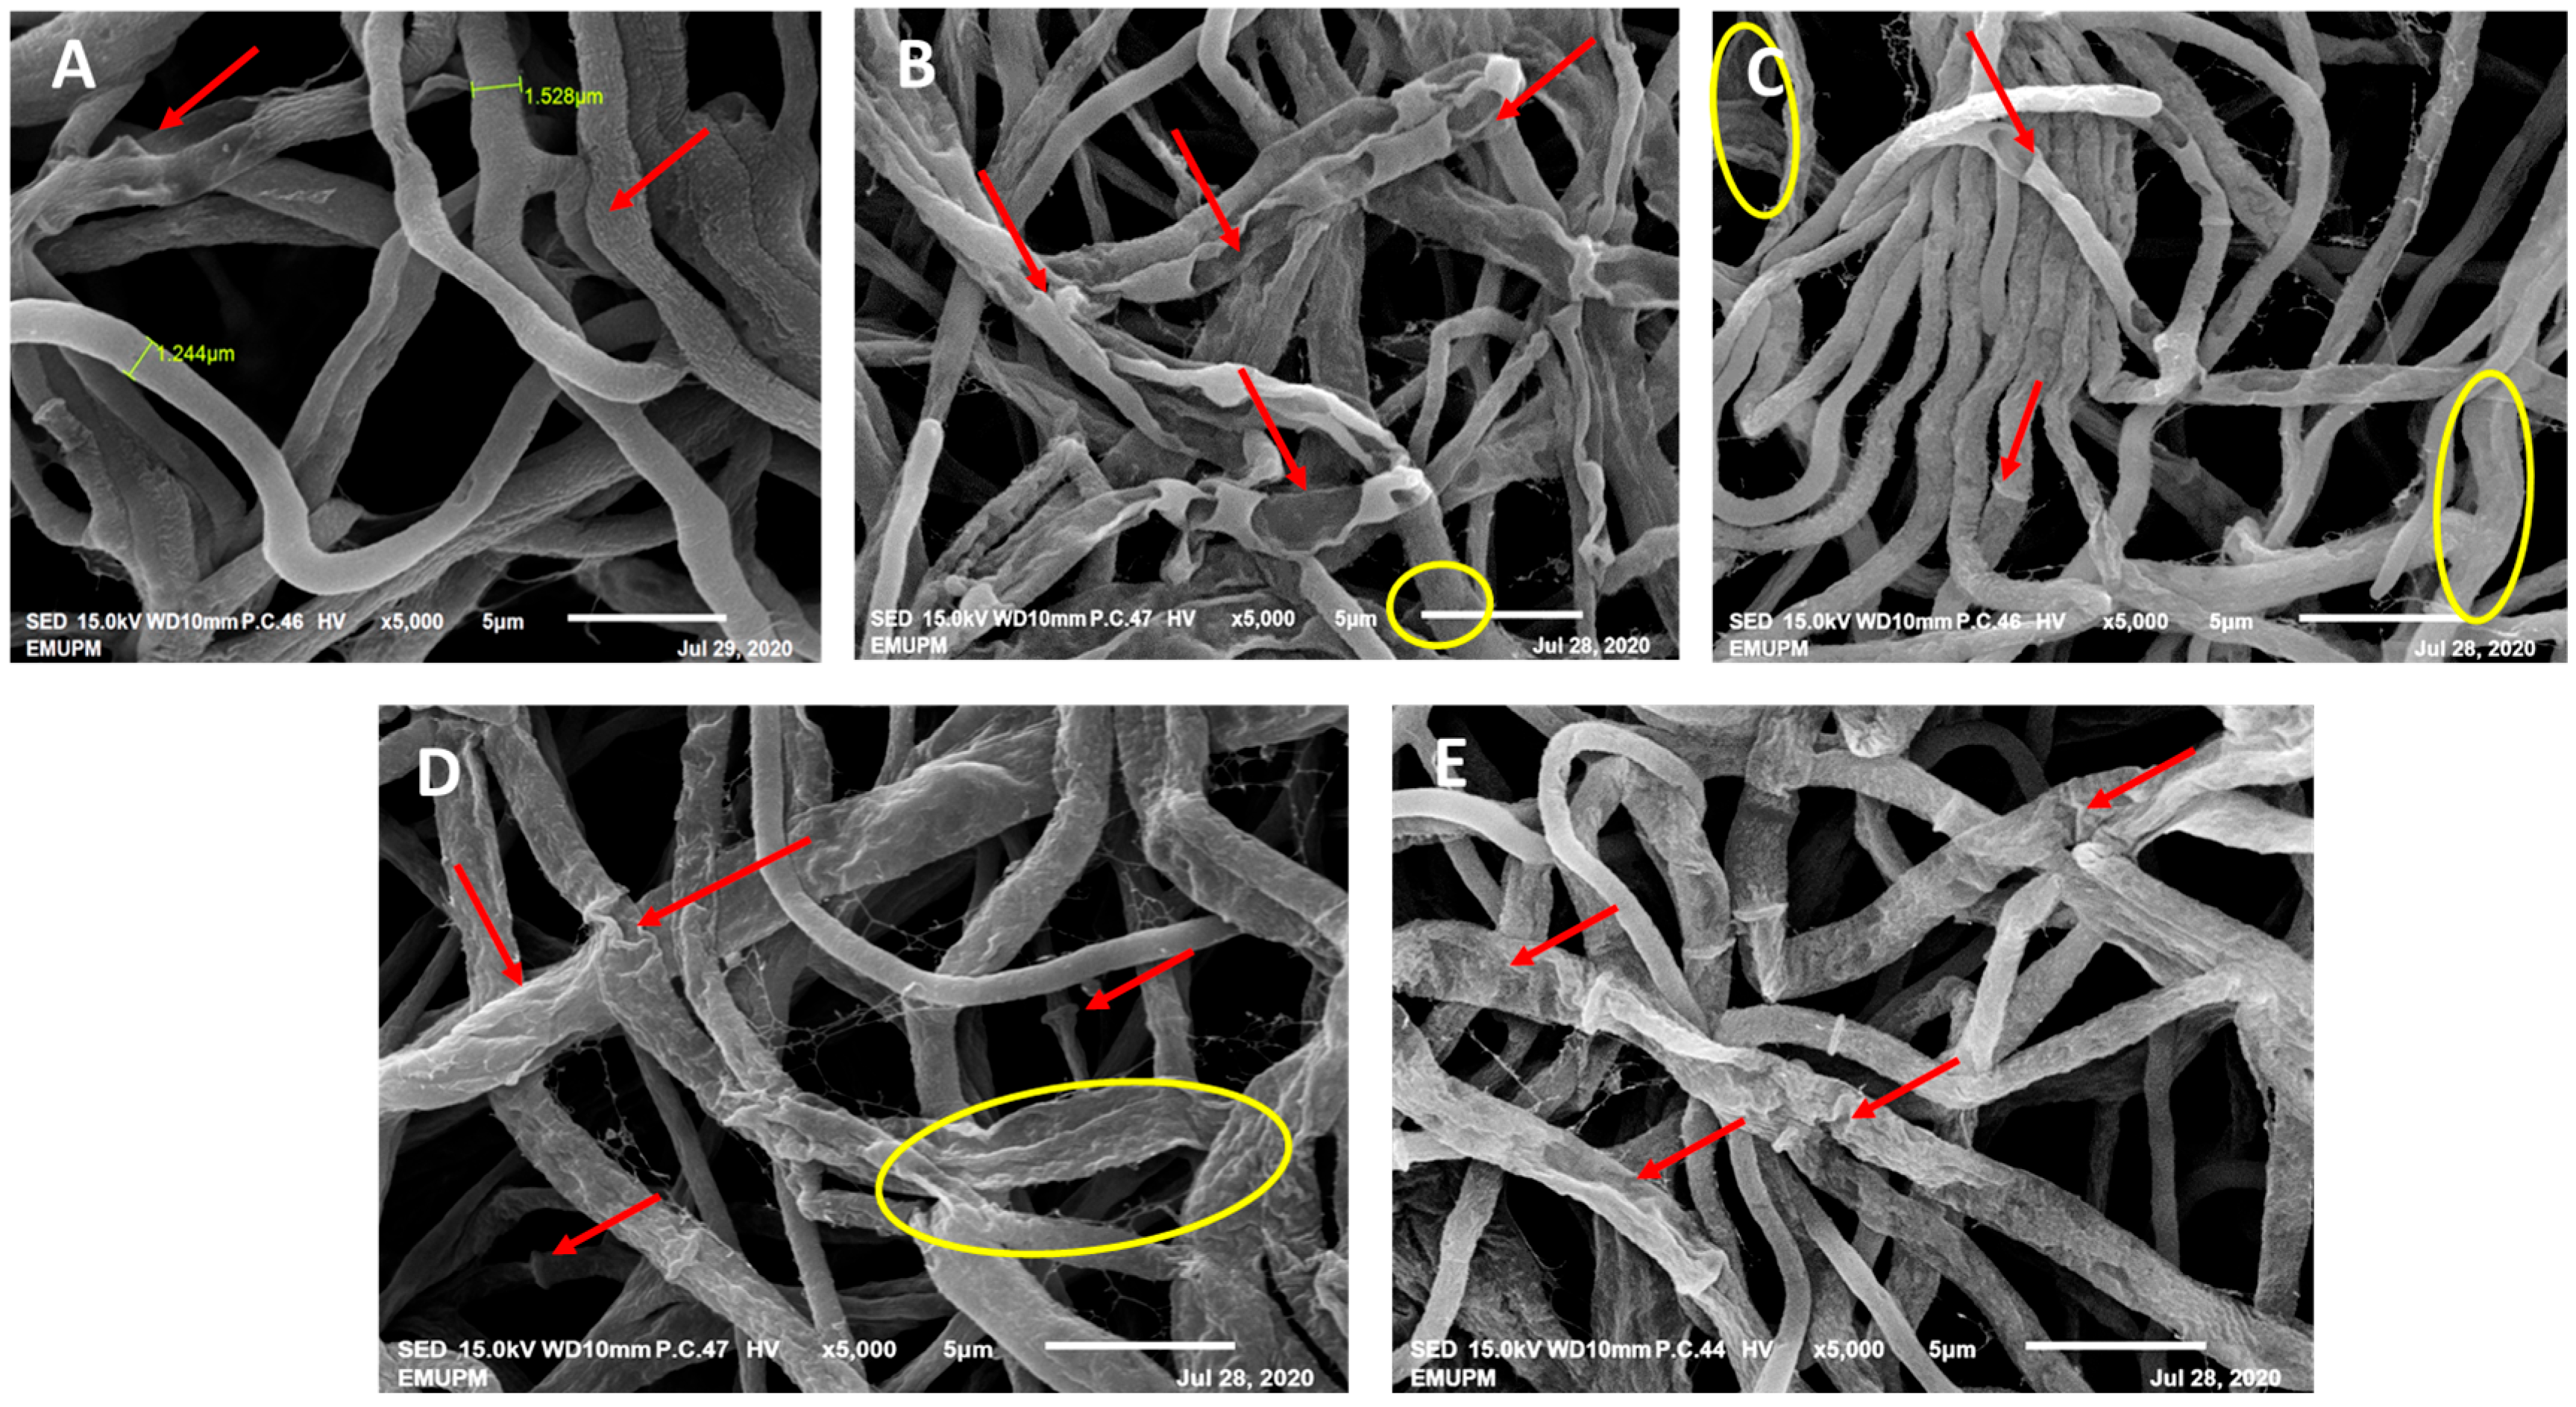
The mycelium cultivated without the presence of phenolic acids displayed a smooth, dense, and healthy appearance, featuring a diameter of 1.244 mm and clearly visible clamp connections (see Figure 5A). In contrast, the mycelium subjected to gibberellic acid (GA) exhibited reduced density and a shrivelled and fused appearance with a diameter of 2.732 mm, and the hyphae’s wrinkled surface displayed perforations (refer to Figure 5B). Thymol-treated mycelium showed signs of distortion (diameter of 2.005 mm), fused openings revealing empty hyphae, shrinkage (1.528 mm diameter), and detachment of the mycelium (see Figure 5D). Conversely, treatment with carvacrol (CARV) did not induce significant alterations in the mycelial structure, resulting only in shrivelled mycelium with a diameter of 0.709 mm (see Figure 5E).

Figure 5.
Alterations in mycelial morphology after treatment with phenolic compounds were observed through SEM at 5000× magnification. (A) Healthy mycelia of G. boninense PER71 excised from the control plate. The arrows indicate clamp connections. (B) Mycelium of G. boninense PER71 treated with GA. The arrows indicate fused mycelium with holes and shrinkage of the mycelium, and the hyphae are encircled. (C) Mycelium of G. boninense PER71 treated with thymol. The arrows indicate the holes, shrivelling, and empty hyphae, and the encircled mycelial region indicates the rupture of hyphae. (D) Mycelia of G. boninense PER71 cells treated with propolis. The arrows indicate shrivelling and collapse, and the encircled region indicates the breaking/detachment of the mycelium connection. (E) Mycelium of G. boninense PER71 treated with carvacrol showing shrivelling of mycelium (arrow). Note: scale 5 µm.
3.4. High-Resolution Transmission Electron Microscopy (HR-TEM)
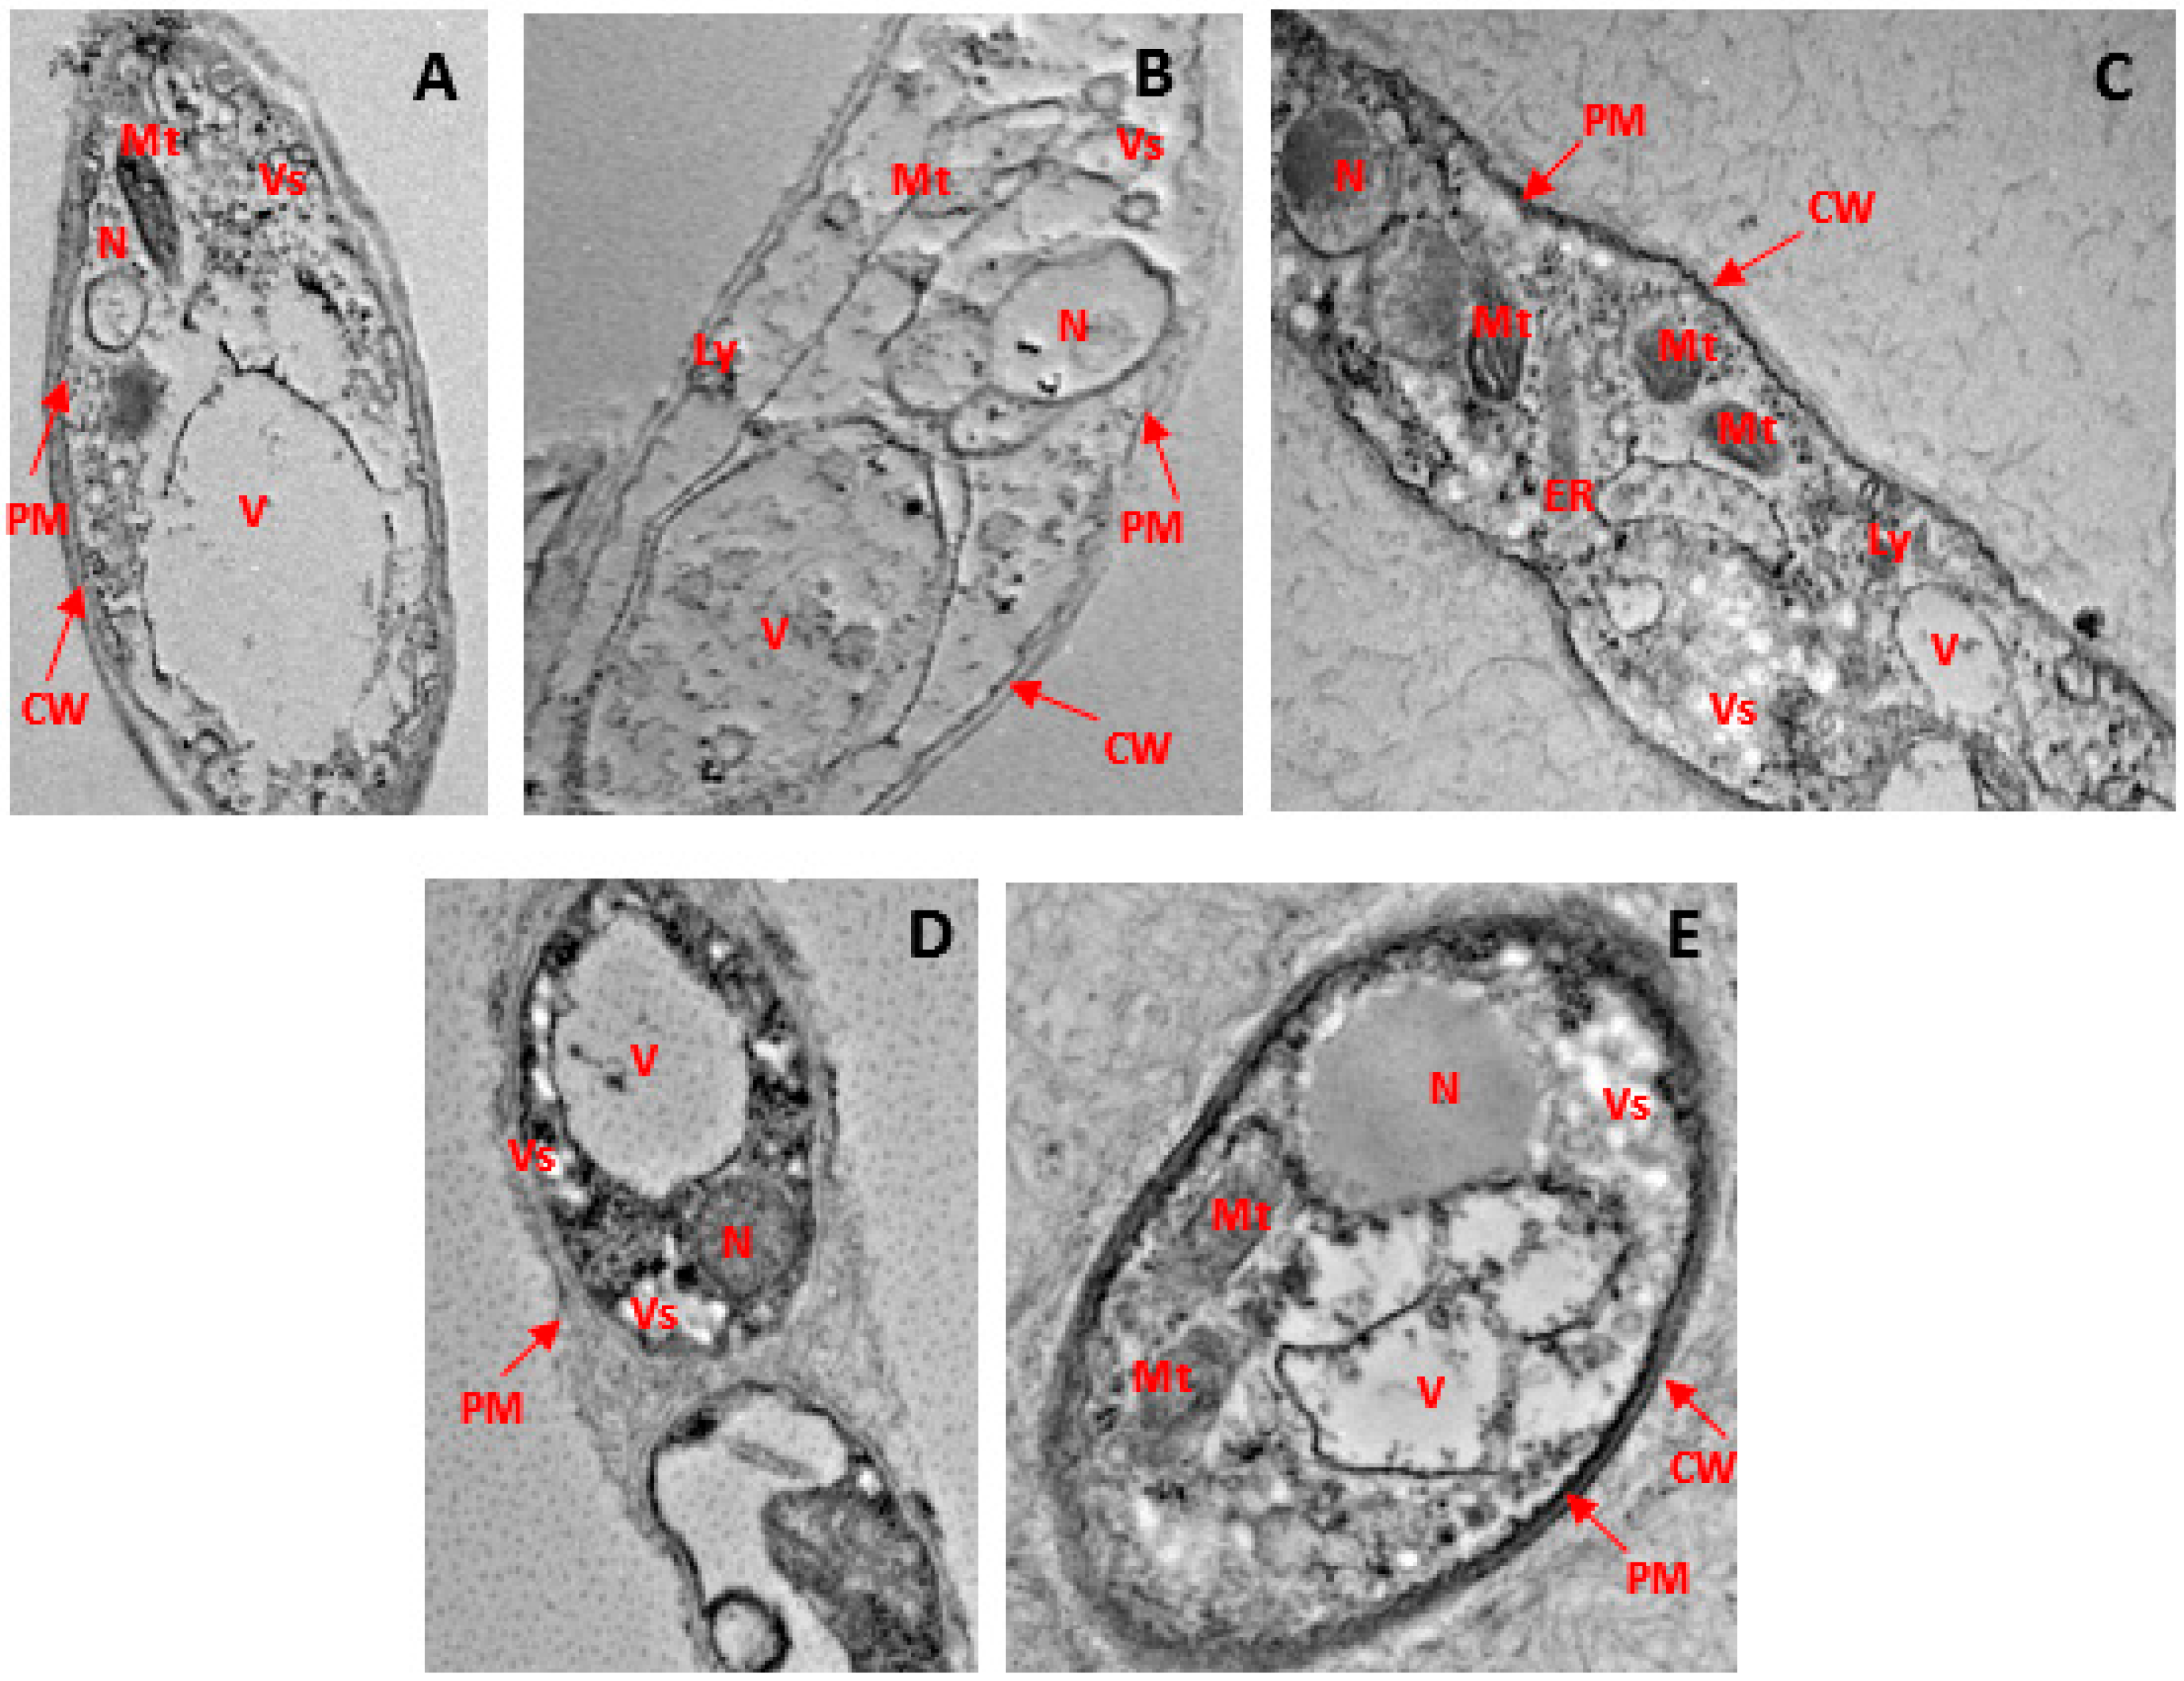
Through the use of HR-TEM, it was observed that the hyphal cell walls and interiors treated with phenolic compounds underwent notable ultrastructural modifications. Mycelium retrieved from a solution lacking phenolic compounds exhibited well-defined cytoplasmic organelles, including mitochondria and endoplasmic reticulum, along with a nucleus enclosed by a robust and intact cellular membrane. The cell membrane manifested as a sharp, electron-dense lipid bilayer closely adhering to the inner surface of the fungal cell wall (see Figure 6A). Two prominent alterations induced by the application of phenolic chemicals included the development of electron-dense inclusions within the cell wall and the inner space between the cell membrane and the cell wall.

Figure 6.
Ultrastructural modifications in the hyphae of G. boninense PER71 treated with phenolic compounds as observed through HR-TEM at 6000× magnification. (A) Rigid and intact cell wall and plasma membrane, prominent cytoplasmic organelles, such as mitochondria, vesicles, vacuoles, and endoplasmic reticulum, as well as the nucleus in healthy hyphae. (B) The arrows indicate disruption of the cell wall and membrane, loss of vesicle with empty regions, condensed nucleus, deformed mitochondria, and disorganisation of cytoplasmic contents in hyphae treated with 8 mg/mL of GA. (C) indicates the cell component leakage, disruption of the cell membrane, and disorganisation of cytoplasmic content in hyphae treated with 0.25 mg/mL THY. (D) shows the disruption of the cell membrane, disorganisation of cytoplasmic content, and less disintegration of the cell wall and plasma membrane; cytoplasmic organelles are evident in hyphae treated with 3.5 mg/mL of PRO. (E) Less damage to fungal hyphae with intact cell wall and irregular but continuous plasma membrane; prominent nucleus and cytoplasmic organelles in hypha treated with 0.15 mg/mL of CARV. Note: scale 1 μm. CW: cell wall, PM: plasma membrane, Mt: mitochondria, ER: endoplasmic reticulum, V: vacuole, N: nucleus, Vs: vesicle.
In the case of mycelium exposed to gibberellic acid (GA), there was an irregular membrane structure, accompanied by cellular membrane disintegration and the fusion and rupture of vacuoles. Numerous electron-dense inclusions of varied sizes and forms were observed (refer to Figure 6B). Hyphae treated with thymol (THY) displayed significant damage to the cell wall and cytoplasmic organelles (see Figure 6C). A substantial portion of the cell membranes and cell walls was either destroyed or barely visible. Organelle disintegration, blurry and damaged walls, along with a detached plasma membrane from the cell wall structure were evident in propolis (PRO)-treated hyphae (see Figure 6D). In hyphae subjected to carvacrol (CARV) treatment, reduced nuclear content was observed, and certain sections of the cell membranes exhibited irregular borders, murky walls, and damaged plasma membranes (see Figure 6E). These substantial morphological or ultrastructural changes were occasionally accompanied by the compromise of membrane structures in the nucleus and cytoplasmic organelles.
4. Discussion
Infections are typically caused by pathogens due to the presence of hydrolytic and ligninolytic enzymes [18]. Ligninolytic enzymes produced by G. boninense PER71 play a crucial role in the establishment of BSR. Restricting the proliferation and breakdown of these enzymes can help to reduce BSR infection. The lignolytic and hydrolytic enzyme activity was assessed through spectrometric analysis. Based on the findings, gallic acid and thymol exhibited decreased and unstable synthesis of enzymes, min−1 mg−1, whereas propolis and carvacrol were proportional to the concentration of the enzymes. Overall, it has been discovered that gallic acid may prevent the development of ligninolytic enzymes, which can help to reduce the oxidation of phenolic compounds [19,20]. An increase in phenolic compound concentration was accompanied by an increase in cell wall breakdown, disintegration, disruption, absence of septa, thin cell walls, electrolyte leakage, accumulation of cellular components, and other abnormalities because of the interaction between the lignocellulolytic enzyme and the cell wall [16].
In general, phenolic chemicals interfered with intra- and intermolecular hydrogen bonding, which had an adverse effect on the synthesis of enzymes and accelerated the degradation of those involved in pathogenic pathways. As phenolic compound concentrations increased, the effect on enzyme production grew. In particular, gallic acid demonstrates a significant rise in oxidative properties that may support ligninolytic enzyme activity. Gallic acid displayed the strongest antifungal efficacy and a sizable impact on the suppression of G. boninense PER71 mycelia [21].
Lignin and polysaccharides are broken down by the hydrolytic and ligninolytic enzymes produced by G. boninense PER71. Hydrolytic enzymes are necessary to break down holocellulose (cellulose and hemicelluloses) [22]. Lignin is broken down and degraded by ligninolytic enzymes [2]. Regarding qualitative analysis, various colour intensities were observed during the experiment, which provided a quick indication of the enzyme production. The degradation of the dye, colour shifts, and emergence of a strongly coloured zone serve as indicators of extracellular oxidase and secreted enzymes. Many morphological traits, including fine, thin mycelium, fluffy, thicker, and thinner outer layers, as well as an uneven distribution, were observed. This might have resulted from the interaction of phenolic compounds with the physical barriers of G. boninense PER71.
Gallic acid and thymol, at the highest tested concentrations, effectively inhibited the growth of G. boninense PER71 as well as the activity of hydrolytic and ligninolytic enzymes. Fungal hyphae directly absorb the available nutrients as a result of these extracellular enzymes’ action on the nutrients nearby and enable the nutrients to enter the cell. The existence of substrates and the stability of enzymes are closely related to enzyme synthesis. Additionally, strain type and substrate dependence have an impact on enzyme manufacturing efficiency [23]. According to [24], the lag phase is associated with the antifungal efficacy of phenolic acids. The growth of the mycelia increased in a medium rich in nutrients (control plate devoid of phenolic compounds), but the opposite was true in media deficient in nutrients and rich in phenolic compounds. The presence of more phenolic compounds and fewer nutrients caused a prolonged lag phase in mycelia formation. As a result, enzyme secretion decreased, and resistance to pathogen attack could not develop.
Syringaldehyde and vanillin phenol comprise approximately 69% of the phenolic monomers found in oil palms. These phenols are prevalent in oil palm wood, and when the phenol level is low, ligninolytic enzymes can oxidise phenolic compounds and destroy lignin [25]. The combination of phenolic chemicals can inhibit these lipid redox peroxidase processes, which aids in the reduction of BSR [14]. As a result, a sufficient quantity of phenolic compounds helps reduce G. boninense PER71. Increased GA concentration exhibited a stronger inhibitory effect on the synthesis of enzymes, notably when amylase, xylanase, laccase, and extracellular haeme protein peroxidases were qualitatively analysed (LiP and MnP). According to [2], both ligninolytic and hydrolytic enzymes are degraded simultaneously. In lignocellulosic materials, xylanase (a hemicellulolytic enzyme) starts the hydrolysis of −1, 4-xylans, and when the GA concentration increases, less xylanase, amylase, laccase, LiP, and MnP are produced. Thymol significantly inhibited the synthesis of the enzymes Lac, LiP, and MnP. According to one study, when there are enough lignin-modifying enzymes (LME), the amount of ligninolytic enzyme production may change, indicating that there is less of a need for it [16]. Lac levels decreased, demonstrating THY’s excellent potential to reduce G. boninense PER71. Propolis’ antifungal qualities have been shown to be a successful strategy for inhibiting enzymes, particularly xylanase and lignin peroxidase. This could be due to preventing invasion of the host cell and obstructing proteins and enzymes [26]. As propolis contains a variety of bioactive chemicals, differing propolis concentrations can disrupt cellular organelles and components [27,28]. Peroxidase enzymes are widely used in the polymerisation of cell wall components and aid in creating barriers that prevent pathogens from invading the oil palm basal zone [29]. The defense system works on the basis that it is activated whenever a plant pathogen infects the host. In contrast, the defense mechanism will eventually stop functioning if G. boninense PER71 is unable to initiate and repress the resistance reaction. This results in apparent infection [30]. The inner cell wall of OP is protected by lignin, which makes it difficult for fungal pathogens to take hold. It is crucial to research how enzymes are triggered by the presence of phenolic substances [31]. Plant cells, called lignocelluloses, contain lignin, which is linked to cellulose and hemicellulose. The capacity to prevent the fungal pathogen from spreading the illness is promising, and the efficiency of ligninolytic enzymes demonstrates that the first-line defense is secured. As a result, there is less opportunity for hydrolytic enzymes to spread and cause BSR in OP plants [29]. When an enzyme attack occurs, the polymeric lignin structure chemically binds to hemicellulose and cellulose to protect against it [32]. In general, the amount of phenolic compounds present is directly correlated with the inhibition of G. boninense-produced hydrolytic and ligninolytic enzymes (PER 71).
The structural alterations found through SEM and HR-TEM demonstrated that phenolic compounds significantly changed the structural morphology, external surface, internal organelles, and cytoplasmic components of the mycelium. The mycelium was most significantly affected by GA and THY, which led to holes, a reduction in the size of the mycelium, shrivelling of the outer membrane, and severe disruption of internal cytoplasmic elements, such as the nucleus, mitochondria, endoplasmic reticulum, vacuoles, and vesicles. These essentially describe the severity of the biological and chemical processes of the mycelium [33]. GA and THY significantly affected mycelia compared to PRO and CARV. The integrity of the cell wall was weakened as a result of THY and GA targeting the cell membrane [34]. Cell division requires the integrity of the cell wall, but in this study, the mycelium was severely disrupted by phenolic compounds, which prevented it from surviving in an environment that normally controls the creation of biological activities and enzymes [34,35]. Interactions with cellular sulfhydryl compounds have been connected to propolis separation from the fungal cell wall and interruption of division. [31] discussed how phenolic compounds obstruct yeast proliferation and germ tube pathways. They continued by claiming that plasmalemma invasion through phenolic compound therapy alters the dynamic interaction between ergosterol and chitin. Additional SEM and HR-TEM data revealed that transformation of the morphological and ultra-cellular structure of mycelia was associated with the inhibition of G. boninense. The integrity of the mycelial membrane and polarity of the cell membrane are lost because of the antifungal activity of benzoic acid. Fungal survival is critically dependent on the integrity of the plasma membrane, and membrane injury can result in loss of intracellular components [36].
Central to antifungal activity is the capacity to alter the function of cell lipoprotein membranes, disrupt cellular ionic homeostasis, acidify vacuolar and cytosolic pH, and compromise structural cellular integrity [35,37]. Changes in cell permeability may be responsible for modifications in the shape and size of internal organelles, such as mitochondria and vacuoles, as observed in recent studies [38]. The membrane potential is frequently disrupted by phenolic compounds, allowing both internal and external elements to enter and exit cells [39]. It has been proposed that the hydroxyl, amide, and sulfonic groups of phenolic substances can interact with the cell membranes [31]. In addition, improved formulations of GA and THY could make them suitable treatments and preventatives for basal stem rot. The development of optimal concentrations for industrial use as a replacement for synthetic fungicides has also been suggested.
5. Conclusions
In conclusion, this study contributes to the investigation of the effects of different phenolic compounds at various concentrations on G. boninense PER71 growth and suppression, as well as on the synthesis of hydrolytic and ligninolytic enzymes. Phenolic chemicals, particularly GA and PRO, were found to suppress the enzymes in this in vitro study. Phenolic compounds are natural barriers that protect substrates from enzyme degradation and prevent this wood-degrading WRF from commencing.
Author Contributions
Funding acquisition: Y.S.; Investigation, D.G. and Y.S.; Methodology, D.G. and Y.S.; Project administration, Y.S.; Supervision, Y.S.; Validation, Y.S.; Visualisation, Y.S.; Writing—original draft, D.G. and Y.S.; Writing—review and editing, Y.S. All authors have read and agreed to the published version of the manuscript.
Funding
This work was supported by the Deanship of Scientific Research, Vice Presidency for Graduate Studies and Scientific Research, King Faisal University, Saudi Arabia [Grant No. 5639].
Institutional Review Board Statement
Not applicable.
Informed Consent Statement
Not applicable.
Data Availability Statement
Dataset available on request from the authors.
Acknowledgments
The authors are thankful to the Deanship of Scientific Research, King Faisal University, Saudi Arabia, for financial assistance, and to the University Putra Malaysia for providing research facilities.
Conflicts of Interest
The authors declare that the research was conducted in the absence of any commercial or financial relationships that could be construed as a potential conflict of interest.
Abbreviations
| GA | Gallic acid |
| THY | Thymol |
| PRO | Propolis |
| CARV | Carvacrol |
| BSR | Basal stem rot |
| Lac | Laccase |
| MnP | Manganese peroxidase |
| LiP | Lignin peroxidase |
| SEM | Scanning Electron Microscopy |
| HR-TEM | High-resolution transmission electron microscopy |
| LME | Lignin-modifying enzymes |
| OP | Oil palm |
References
- Surendran, A.; Siddiqui, Y.; Saud, H.M.; Ali, N.S.; Manickam, S. The antagonistic effect of phenolic compounds on ligninolytic and cellulolytic enzymes of Ganoderma boninense, causing basal stem rot in oil palm. Int. J. Agric. Biol. 2017, 19, 1437–1446. [Google Scholar]
- Surendran, A.; Siddiqui, Y.; Manickam, S.; Ali, A. Role of benzoic and salicylic acids in the immunization of oil palm seedlings challenged by Ganoderma boninense. Ind. Crops Prod. 2017, 122, 358–365. [Google Scholar] [CrossRef]
- Surendran, A.; Siddiqui, Y.; Ahmad, K.; Fernanda, R. Deciphering the Physicochemical and Microscopical Changes in Ganoderma boninense-Infected Oil PalmWoodblocks under the Influence of Phenolic Compounds. Plants 2021, 10, 1797. [Google Scholar] [CrossRef] [PubMed]
- Lundell, T.K.; Mäkelä, M.R.; de Vries, R.P.; Hildén, K.S. Chapter Eleven. Genomics, Lifestyles and Future Prospects of Wood-Decay and Litter-Decomposing Basidiomycota. In Advances in Botanical Research; Martin, F.M., Ed.; Academic Press: Cambridge, MA, USA, 2014; Volume 70, pp. 329–370. [Google Scholar]
- Koyani, R.D.; Bhatt, I.M.; Patel, H.R.; Vasava, A.M.; Rajput, K.S. Evaluation of Schizophyllum commune Fr. potential for biodegradation of lignin: A light microscopic analysis. Wood Mater. Sci. Eng. 2016, 11, 46–56. [Google Scholar] [CrossRef]
- Erwin Takemoto, S.; Hwang, W.J.; Takeuchi, M.; Itoh, T.; Imamura, Y. Anatomical characterization of decayed wood in standing light red meranti and identification of the fungi isolated from the decayed area. J. Wood Sci. 2008, 54, 233–241. [Google Scholar] [CrossRef]
- Rees, R.W.; Flood, J.; Hasan, Y.; Potter, U.; Cooper, R.M. Basal stem rot of oil palm (Elaeis guineensis); Mode of root infection and lower stem invasion by Ganoderma boninense. Plant Pathol. 2009, 58, 982–989. [Google Scholar] [CrossRef]
- Surendran, A.; Siddiqui, Y.; Saud, H.M.; Ali, N.S.; Manickam, S. Inhibition and kinetic studies of lignin-degrading enzymes of Ganoderma boninense by naturally occurring phenolic compounds. J. Appl. Microbiol. 2018, 125, 876–887. [Google Scholar] [CrossRef]
- Bucher, V.V.C.; Hyde, K.D.; Pointing, S.B.; Reddy, C.A. Production of wood decay enzymes, mass loss and lignin solubilization in wood by marine ascomycetes and their anamorphs. Fungal Divers. 2004, 15, 14. [Google Scholar]
- Ganapathy, D.; Siddiqui, Y.; Ahmad, K.; Adzmi, F.; Ling, K.L. Alterations in Mycelial Morphology and Flow Cytometry Assessment of Membrane Integrity of Ganoderma boninense Stressed by Phenolic Compounds. Biology 2021, 10, 930. [Google Scholar] [CrossRef]
- Witzell, J.; Martín, J.A. Phenolic metabolites in the resistance of northern forest trees to pathogens—Past experiences and future prospects. Can. J. For. Res. 2008, 38, 2711–2727. [Google Scholar] [CrossRef]
- Paterson, R.R.; Meon, S.; Abidin, M.Z.; Lima, N. Prospects for inhibition of lignin degrading enzymes to control Ganoderma white rot of oil palm. Curr. Enzym. Inhib. 2008, 4, 172–179. [Google Scholar] [CrossRef]
- Machado, K.M.; Matheus, D.R.; Bononi, V.L. Ligninolytic enzymes production and Remazol Brilliant Blue R decolorization by tropical Brazilian basidiomycetes fungi. Braz. J. Microbiol. 2005, 36, 246–252. [Google Scholar] [CrossRef]
- Srivastava, N.; Rawat, R.; Singh Oberoi, H.; Ramteke, P.W. A review on fuel ethanol production from lignocellulosic biomass. Int. J. Green Energy 2015, 2, 949–960. [Google Scholar] [CrossRef]
- Miller, G.L. Use of dinitrosalicylic acid reagent for determination of reducing sugar. Anal. Chem. 1959, 31, 426–428. [Google Scholar] [CrossRef]
- Naidu, Y.; Siddiqui, Y.; Rafii, M.Y.; Saud, H.M.; Idris, A.S. Investigating the effect of white-rot hymenomycetes biodegradation on basal stem rot-infected oil palm wood blocks: Biochemical and anatomical characterisation. Ind. Crops Prod. 2017, 108, 872–882. [Google Scholar] [CrossRef]
- Calderon-Garciduenas, L.; González-Maciel, A.; Reynoso-Robles, R.; Rodríguez-López, J.L.; Silva-Pereyra, H.G.; Labrada-Delgado, G.J.; Pérez-Guillé, B.; Soriano-Rosales, R.E.; Jimenez-Bravo Luna, M.A.; Brito-Aguilar, R.; et al. Environmental Fe, Ti, Al, Cu, Hg, Bi, and Si nanoparticles in the atrioventricular conduction axis and the associated ultrastructural damage in young urbanites: Cardiac arrhythmias caused by anthropogenic, industrial, E-waste, and indoor nanoparticles. Environ. Sci. Technol. 2021, 55, 8203–8214. [Google Scholar] [CrossRef] [PubMed]
- Sansone, G.; Rezza, I.; Fernández, G.; Calvente, V.; Benuzzi, D.; Sanz, M.I. Inhibitors of polygalacturonase and laccase of Botrytis cinerea and their application to the control of this fungus. Int. Biodeterior. Biodegrad. 2011, 65, 243–247. [Google Scholar] [CrossRef]
- Ahn, J.; Grün, I.U.; Mustapha, A. Effects of plant extracts on microbial growth, color change, and lipid oxidation in cooked beef. Food Microbiol. 2007, 24, 7–14. [Google Scholar] [CrossRef]
- Muniroh, M.; Nusaibah, S.; Vadamalai, G.; Siddique, Y. Proficiency of biocontrol agents as plant growth promoters and hydrolytic enzyme producers in Ganoderma boninense infected oil palm seedlings. Curr. Plant Biol. 2019, 20, 100116. [Google Scholar] [CrossRef]
- Assis, K.; Chong, K.P.; Idris, A.S.; Ho, C.M. Economic loss due to Ganoderma disease in oil palm. In Proceedings of the Indonesia Conference on Mathematics, Statistics and Scientific Computing, Kuala Lumpur, Malaysia, 21–22 December 2016; Volume 11, p. 12. [Google Scholar]
- H’ng, P.S.; Wong, L.J.; Chin, K.L.; Tor, E.S.; Tan, S.E.; Tey, B.T.; Maminski, M. Oil palm (Elaeis guineensis) trunk as a resource of starch and other sugars. J. Appl. Sci. 2011, 11, 3053–3057. [Google Scholar] [CrossRef]
- Surendran, A. Effect of Naturally Occuring Phenolic Compound on Cell Wall Degrading Enzymes and Suppression of Ganoderma Boninense Infection in Oil Palm Seedlings. Ph.D. Thesis, University of Putra Malaysia, Kembangan, Malaysia, 2018. [Google Scholar]
- Wang, L.; Fan, D.; Chen, W.; Terentjev, E. Bacterial growth, detachment and cell size control on polyethylene terephthalate surfaces. Sci. Rep. 2015, 5, 15159. [Google Scholar] [CrossRef] [PubMed]
- Camarero, S.; Sarkar, S.; Ruiz-Dueñas, F.J.; Martínez, M.J.; Martínez, A.T. Description of a versatile peroxidase involved in the natural degradation of lignin that has both manganese peroxidase and lignin peroxidase substrate interaction sites. J. Biol. Chem. 1999, 274, 10324–10330. [Google Scholar] [CrossRef] [PubMed]
- Kresnawaty, I.; Eris, D.; Mulyatni, A.; Prakoso, H. Inhibitory effect of phenolic acid on Ganoderma boninense enzyme as an approach on Ganoderma infection. IOP Conf. Ser. Earth Environ. Sci. 2018, 183, 012023. [Google Scholar] [CrossRef]
- Zhang, J.; Ma, S.; Du, S.; Chen, S.; Sun, H. Antifungal activity of thymol and carvacrol against postharvest pathogens Botrytis cinerea. J. Food Sci. Technol. 2019, 56, 2611–2620. [Google Scholar] [CrossRef] [PubMed]
- Zhang, J.; Li, L.; Lv, Q.; Yan, L.; Wang, Y.; Jiang, Y. The fungal CYP51s: Their functions, structures, related drug resistance, and inhibitors. Front. Microbiol. 2019, 10, 691. [Google Scholar] [CrossRef] [PubMed]
- Sahebi, M.; Hanafi, M.M.; Mohidin, H.; Rafii, M.Y.; Azizi, P.; Idris, A.S.; Moradpoor, M. Antioxidant enzyme activities and secondary metabolite profiling of oil palm seedlings treated with combination of NPK fertilizers infected with Ganoderma boninense. BioMed Res. Int. 2018, 2018, 1494157. [Google Scholar] [CrossRef]
- Choudhary, D.K.; Prakash, A.; Johri, B.N. Induced systemic resistance (ISR) in plants: Mechanism of action. Indian J. Microbiol. 2007, 47, 289–297. [Google Scholar] [CrossRef] [PubMed]
- Bivi, M.S.; Paiko, A.S.; Khairulmazmi, A.; Akhtar, M.S.; Idris, A.S. Control of Basal Stem Rot Disease in Oil Palm by Supplementation of Calcium, Copper, and Salicylic Acid. J. Plant Pathol. 2016, 32, 396. [Google Scholar] [CrossRef]
- Paterson, R.R.M. Ganoderma disease of oil palm—A white rot perspective necessary for integrated control. Crop Prot. 2007, 26, 1369–1376. [Google Scholar] [CrossRef]
- An, P.; Yang, X.; Yu, J.; Qi, J.; Ren, X.; Kong, Q. A-terpineol and terpene-4-ol, the critical components of tea tree, exert antifungal activites in vivo against Aspergillus niger in grapes by inducing morphous damage and metabolic changes of fungus. Food Control 2018, 98, 42–53. [Google Scholar] [CrossRef]
- Fernanda, R.; Siddiqui, Y.; Ganapathy, D.; Ahmad, K.; Surendran, A. Suppression of Ganoderma boninense Using Benzoic Acid: Impact on Cellular Ultrastructure and Anatomical Changes in Oil PalmWood. Forest 2021, 12, 1231. [Google Scholar] [CrossRef]
- Xu, Y.; Luo, L.; Chen, B.; Fu, Y. Recent development of chemical components in propolis. Front. Biol. China 2009, 4, 385–391. [Google Scholar] [CrossRef]
- Liu, J.; Zong, Y.; Qin, G.; Li, B.; Tian, S. Plasma membrane damage contributes to antifungal activity of silicon against penicillium digitatum. Curr. Microbiol. 2010, 61, 274–279. [Google Scholar] [CrossRef] [PubMed]
- Zhang, Y.Q.; Rao, R. Beyond ergosterol: Linking pH to antifungal mechanisms. Virulence 2010, 1, 551–554. [Google Scholar] [CrossRef] [PubMed]
- Li, Z.; Liu, M.; Dawuti, G.; Dou, Q.; Ma, Y.; Liu, H.; Aibai, S. Antifungal Activity of Gallic Acid In Vitro and In Vivo. Phytother. Res. 2007, 31, 1039–1045. [Google Scholar] [CrossRef]
- Pag, U.; Oedenkoven, M.; Sass, V.P.; Shai, Y.; Shamova, O.; Antcheva, N.; Tossi, A.; Sahl, H.-G. Analysis of in vitro activities and modes of action of synthetic antimicrobial peptides derived from a_- helical ‘sequence template’. J. Antimicrob. Chemother. 2008, 61, 341–352. [Google Scholar] [CrossRef]

Disclaimer/Publisher’s Note: The statements, opinions and data contained in all publications are solely those of the individual author(s) and contributor(s) and not of MDPI and/or the editor(s). MDPI and/or the editor(s) disclaim responsibility for any injury to people or property resulting from any ideas, methods, instructions or products referred to in the content. |
© 2024 by the authors. Licensee MDPI, Basel, Switzerland. This article is an open access article distributed under the terms and conditions of the Creative Commons Attribution (CC BY) license (https://creativecommons.org/licenses/by/4.0/).