Article

Establishing In Vitro Screening Protocols Based on Phenotypic Plasticity of Amaranthus dubius and Galinsoga parviflora Seeds for Drought, Salinity, and Heat Tolerance

by
Candyce Ann Areington
1,*,
Martha M. O’Kennedy
2 and
Sershen
3
1
School of Life Sciences, Westville Campus, University of KwaZulu-Natal, Durban 4001, South Africa
2
Council for Scientific and Industrial Research (CSIR), NextGen Health Cluster, Pretoria 0001, South Africa
3
Department of Biodiversity and Conservation Biology, University of the Western Cape, Private Bag X17, Bellville 7535, South Africa
*
Author to whom correspondence should be addressed.
Int. J. Plant Biol. 2024, 15(3), 878-894; https://doi.org/10.3390/ijpb15030063
Submission received: 28 July 2024 / Revised: 30 August 2024 / Accepted: 2 September 2024 / Published: 4 September 2024

Abstract

:
The vulnerability of commercial crops under a changing climate has led scientists to consider wild crop species as alternative food sources. The aim of this study was to identify plastic physiological and morphological traits that could be used to in vitro screen Amaranthus dubius and Galinsoga parviflora seeds for drought, salinity, and heat tolerance. To establish the lethal dose/temperature, 50% (LD/T50), for each stress, seeds for both were subjected to various mannitol and NaCl stresses and a range of temperatures. Percentage seedling emergence was selected as the initial indicator of tolerance and used to establish the LD/T50 for in vitro screening for both species. Seeds of both were then screened at the LD/T50 concentrations/temperatures established, and seedlings that emerged after 21 days were measured for leaf area, root (RL), shoot length (SL), chlorophyll content (Chl), fresh, dry mass, and leaf number. Data for these were used to quantify plasticity in terms of Valladares’s phenotypic plasticity index. For A. dubius, three (viz. RL, SL, and Chl) showed some plasticity (≥0.53) and tolerance across all three stressors. For G. parviflora all traits except SL showed some plasticity (≥0.58) and tolerance across all three stressors. Both species had high phenotypic plasticity across all three stressors, which suggests that wild leafy vegetables may possess the ability to tolerate climate change-associated stressors and should be considered for future breeding programs.

1. Introduction

Wild leafy vegetables (WLVs) are edible crops that are often used to supplement poorer diets in many developing countries, such as South Africa (SA) [1,2,3,4]. Most WLVs are richer in minerals and nutrients than their commercial counterparts and can serve as alternative or supplemental food sources [1,2,3,4,5,6,7]. Two such WLVs are A. dubius Mart. ex Thell. and G. parviflora Cav. 1796 belonging to the families Amaranthaceae and Asteraceae, respectively [4,5,6,7,8]. Both these species have weed-like qualities, such as cosmopolitan distribution, fast life cycles, and the production of a large number of seeds, which allows WLVs to thrive under a changing climate [2,6,8]. Both are utilized as supplementary crops during times of famine, and both particularly can be used for medical purposes (viz. it has antioxidant, antibacterial, and cardioprotective properties) [2,4,5,7,8].
Climate change is leading to food security concerns globally and three climate change-induced scenarios of concern in SA are drought, salinity, and heat stress; these stressors pose threats to current food security and as such, were selected as the stressors of interest in the present study [7,9,10]. In order for WLVs to be considered alternative food sources, plant scientists need to understand their responses to climate change-induced stressors [3,7,11].
Plants respond to stress by adjusting their biochemical, physiological, and morphological traits in order to be able to tolerate or avoid stress [12,13,14,15,16,17,18]. Phenotypic plasticity is the phenomenon whereby plants adjust their phenotypes to avoid and/or tolerate stress/es [16,17,18,19,20]. Having high phenotypic plasticity allows for various phenotypic combinations that could result in a phenotype that is tolerant to various abiotic stressors [14,17]. In order for the survival of the species, adaption/tolerance to stress must occur at a population level [13,17,21]. Therefore, a population with high phenotypic plasticity could produce tolerant phenotypes [13,17,21].
Breeding programs inherently decrease the phenotypic and genetic diversity of the population/species being bred, and this is a well-documented phenomenon in many highly bred commercial crop species [15,22,23,24]. This, however, can be mitigated by introducing new genetic and/or phenotypic diverse materials into breeding these programs [5,24,25,26,27]. Wild leafy vegetables are known to have higher phenotypic plasticity, meaning that they have unused genetic potential that could be used in breeding programs [2,7,8,24,27,28]. Some WLVs species have been bred, particularly within the genus Amaranthus to increase the biomass and yield of A. hypochondriacus [5]. However, at the time of this study, there was no published information on the breeding or phenotypic plasticity of A. dubius and G. parviflora.
One important step in breeding is to screen the genetic material and identify tolerant phenotypes to the stress/es [25,27,29,30,31]. Screening techniques include field, pot, and in vitro systems which have all been effectively used previously to screen and/or select stress-tolerant genotypes [32]. Pot and in vitro screening are more cost and space-efficient, as they allow for a larger number of genotypes to be screened simultaneously, and for control to be maintained over the environmental components; however, it is always prudent to subsequently verify pot and/or in vitro screening with field screening trials [26,27,29,33]. However, field screening is complicated, labor intensive, and challenging in terms of ensuring homogeneity across the experimental area and considering the environmental conditions [23,26,27,34]. Slabbert et al. [32] screened three Amaranthus species (viz. A. hybrids L., A. hypochondriacus, and A. tricolor L.) using in vitro screening techniques in order to reduce the expense of greenhouse and field trials. In a study by Lin et al. [35] G. parviflora seedlings were screened for cadmium (Cd) tolerance using both pot and field techniques. Seed germination and early seedling development of plants are the most sensitive to climate change-induced stress/es [5,34].
In order to identify tolerant phenotypes, physiological and/or morphological traits that show tolerance to stress need to be measured [31,36]. Previous studies on screening Amaranthus species have used physiological (e.g., chlorophyll content (Chl)) [36,37,38] and morphological traits (viz. fresh mass (FM), dry mass (DM), leaf area (LA), and the number of leaves) [4,38,39] to differentiate between tolerant and sensitive genotypes. One published example of a screening study available on G. parviflora used morphological traits such as root length (RL), FM, and DM [40]. At the time of this study, there were no published studies on any Amaranthus species or G. parviflora using shoot length (SL) as a tolerance-indicating trait. However, the trait has been used widely to screen for stress tolerance in other crop species [41,42,43]. Identifying species/populations with high phenotypic plasticity based on plastic and tolerance-indicating traits would expedite breeding progress, especially in underutilized WLVs [5,17,19,20,39].
The present study aimed to develop in vitro screening protocols for drought, salinity, and heat tolerance for A. dubius and G. parviflora seeds. This involved creating in vitro screening protocols based on phenotypic plasticity by evaluating selected morphological and physiological traits under each stress. By doing so, the study provides essential initial information, specifically screening protocols, which are necessary for future breeding programs of A. dubius and G. parviflora. It also identified plastic traits that could be used in these screening protocols.

2. Materials and Methods

2.1. Plant Material

Seeds for both A. dubius and G. parviflora were harvested from a wild population growing on the grounds of Randles Nursery in KwaZulu-Natal (KZN), South Africa (29°49′25.79″ S; 30°58′52.82″ E) and on the grounds of the University of KwaZulu-Natal (KZN), South Africa (29°41′11.65″ S; 30°56′44.75″ E), respectively. The voucher specimens of both species were identified and are housed in the Bews Herbarium at the University of KwaZulu-Natal, Pietermaritzburg campus, South Africa (CAA 01/2020 and CAA 02/2020, A. dubius and G. parviflora respectively). The seeds of both species were stored in open trays at room temperature until further use. Please refer to Appendix A for visual representation of the methods described below.

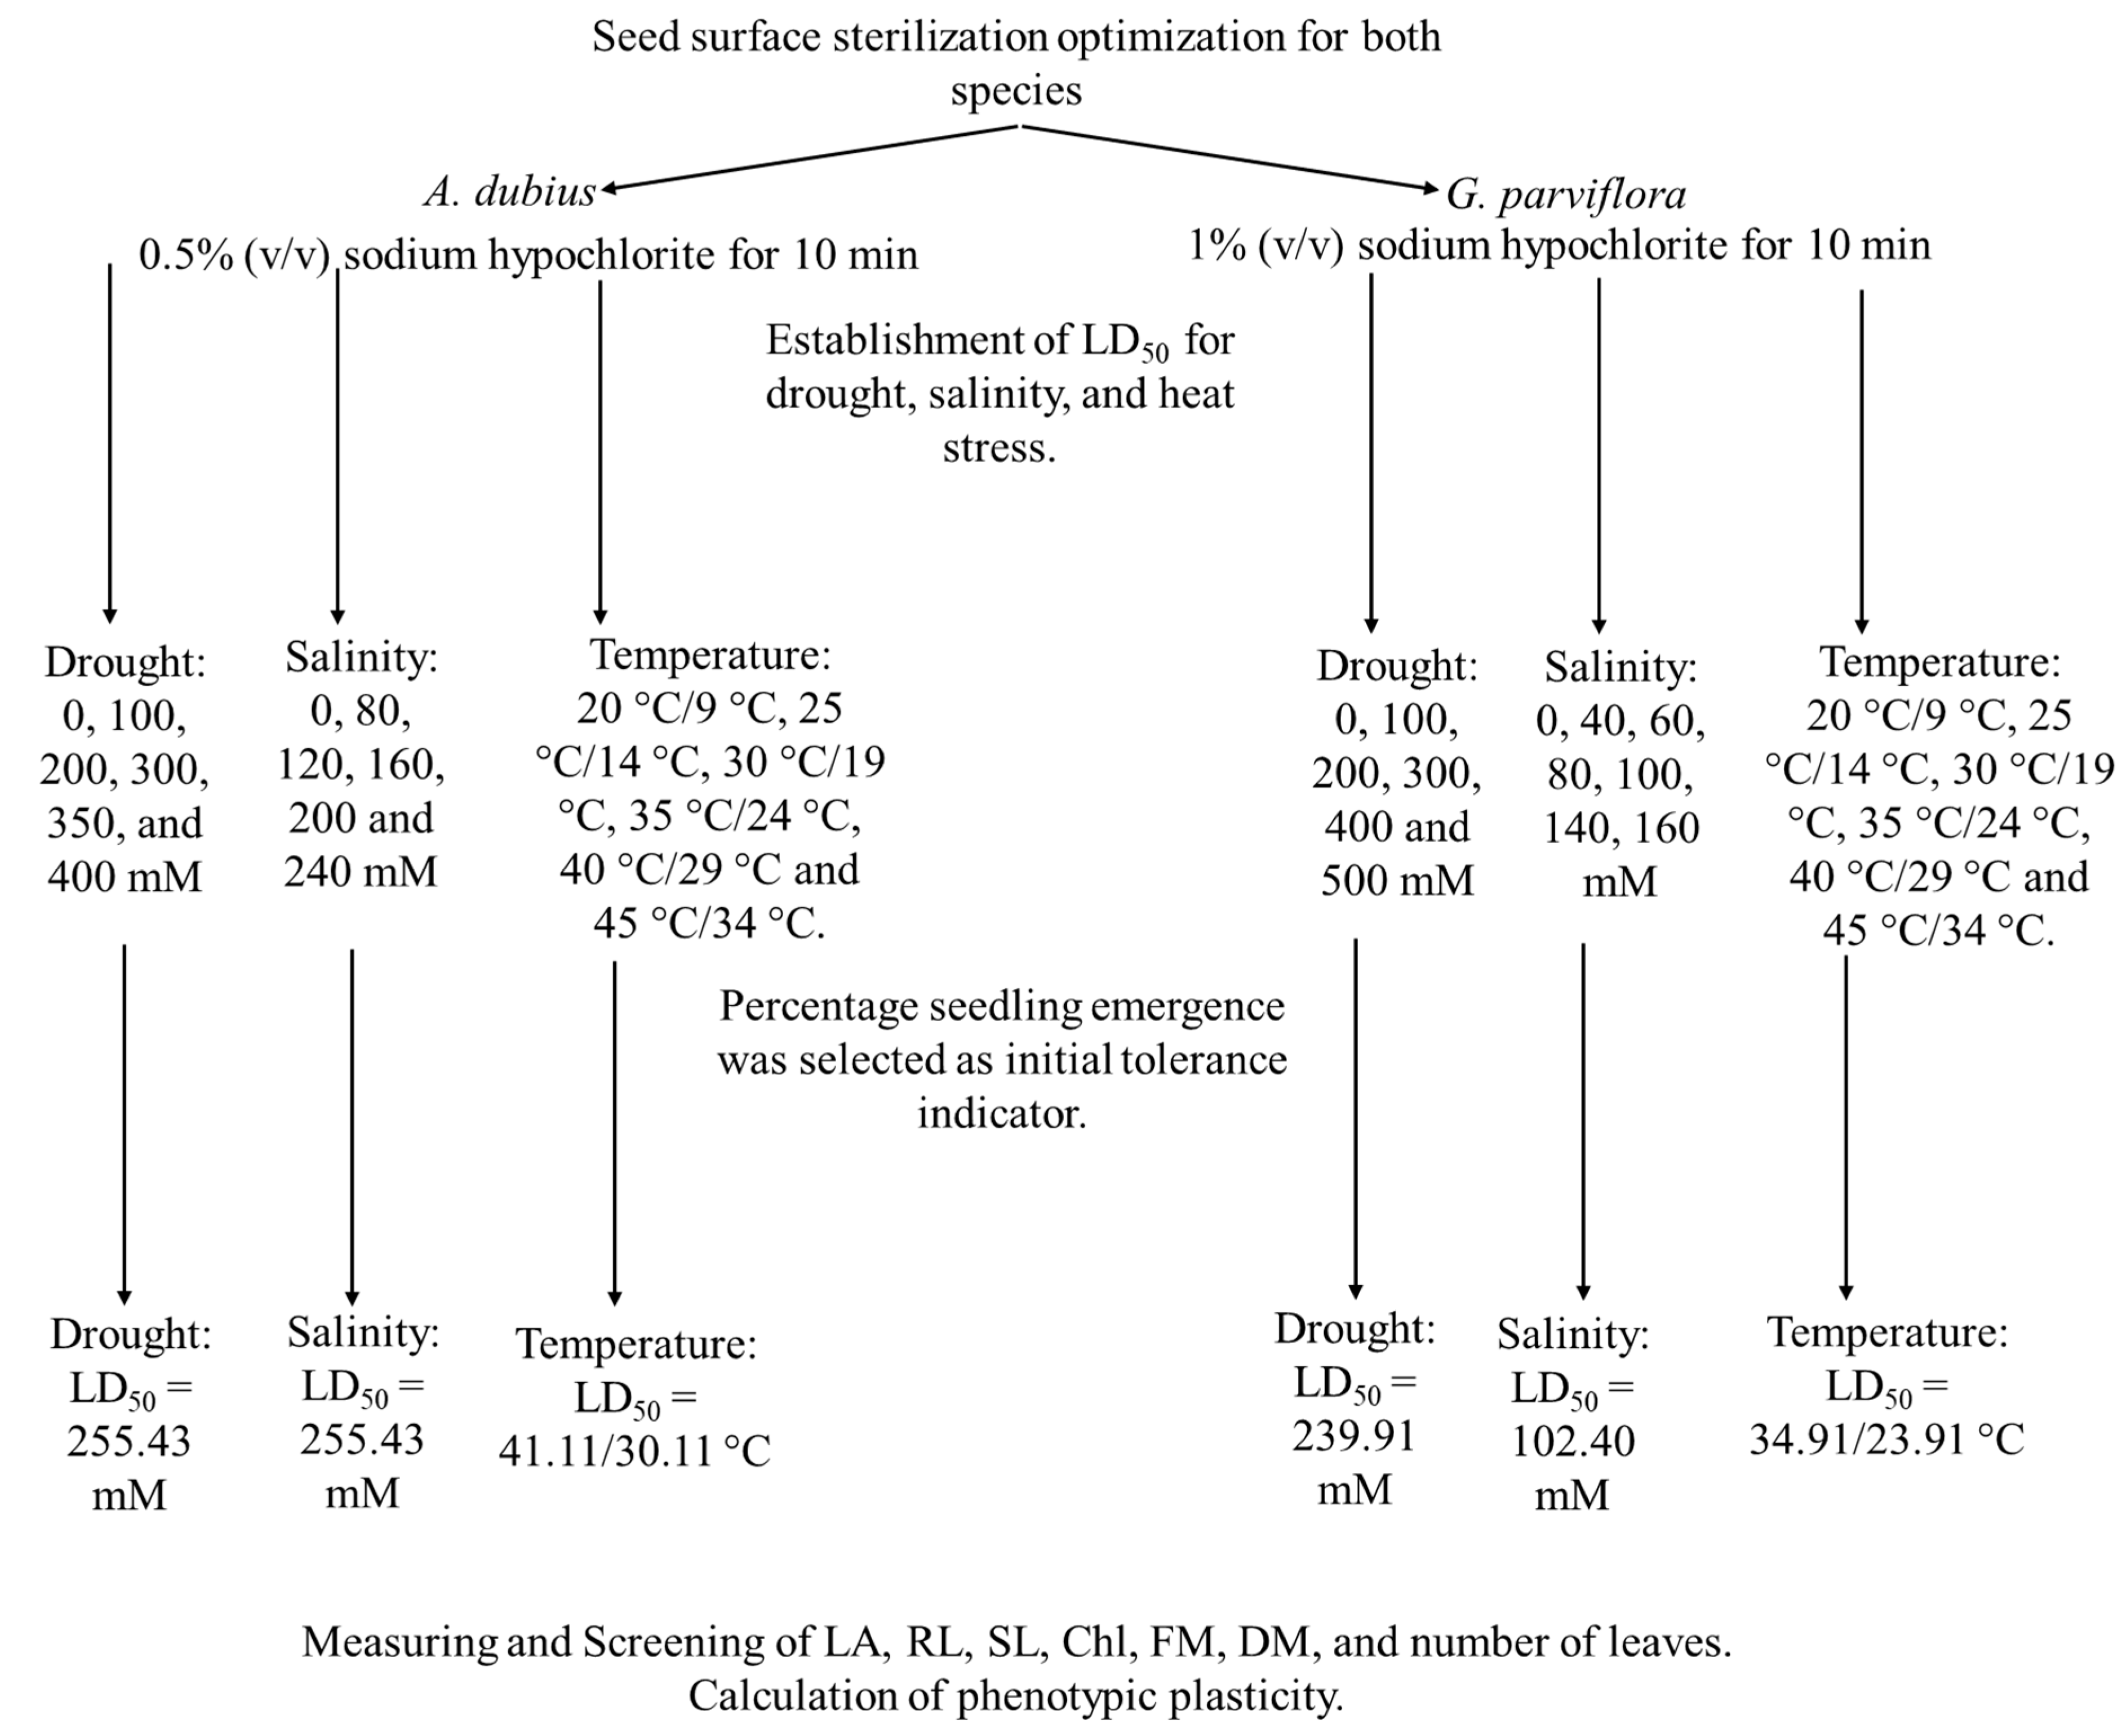
2.2. Seed Surface Sterilization and In Vitro Culture

Seeds of both species were imbibed in deionized water (d.H2O) for 1 h on a shaker at 120 rpm prior to seed surface sterilization. It should be noted that seed surface sterilization protocols were established prior to this experiment to ensure that sterilization did not compromise viability while simultaneously reducing microbial contamination. Seeds of A. dubius and G. parviflora were surface sterilized in 0.5% and 1% (v/v) sodium hypochlorite, respectively, with a few drops of Tween-20® (which was used to break surface tension) on a shaker at 120 rpm for 10 min, and then rinsed three times in sterile deionized water. Sterilized seeds were used for further investigation. Standard medium—which consisted of half-strength Murashige and Skoog basal salt with vitamins medium [44] (MS), 30 g/L sucrose, and 8 g/L agar—was placed onto Petri dishes (65 mm) for further investigation. Prior to being autoclaved, at 121 °C and 1.2 kg/cm2 for 25 min, the pH of all media was adjusted to 5.6–5.8.
For both species, all cultures pertaining to screening for drought and salinity tolerance were maintained in a growth room under 16 h light (200 µmol/m2/s)/8 h dark photoperiod at 26 °C (day)/23 °C (night) (note that these temperatures will act as the control for the heat stress). However, all heat cultures were instead kept in growth chambers (Model GC-300TLH Plant Growth Chamber 150B Lab CompanionTM (Seoul, Republic of Korea)) set at 16 h light (370.37 µmol m−2 s−1)/8 h dark photoperiod. After 14 days in culture, uncontaminated seeds/seedlings were subcultured onto fresh standard media for a further 7 days.

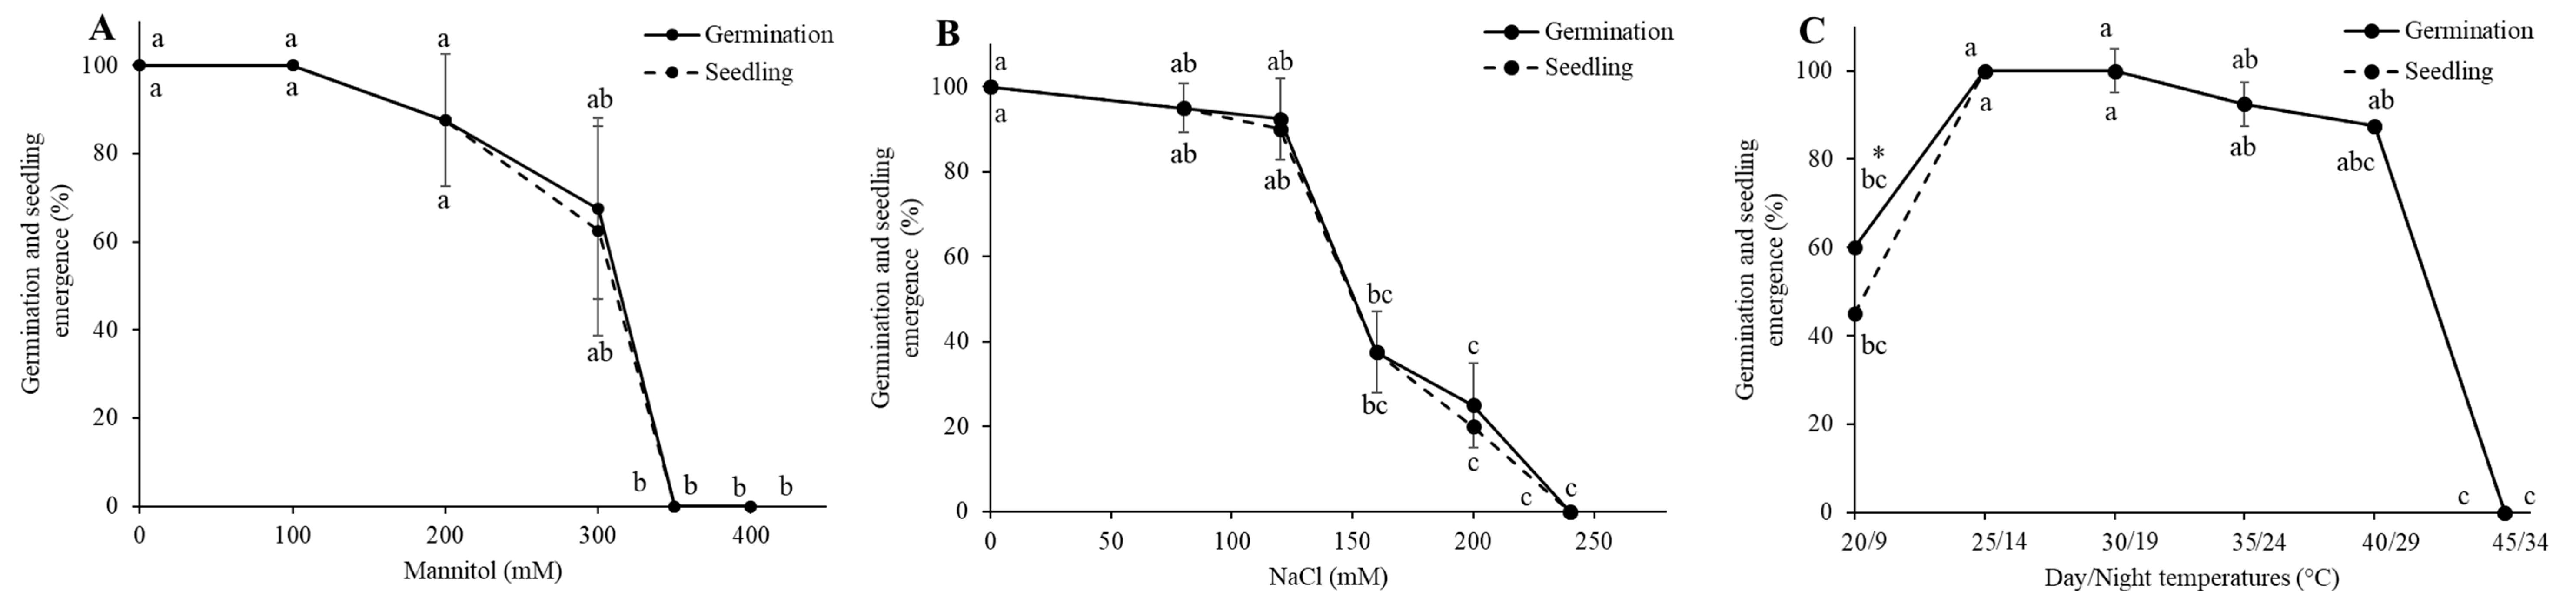
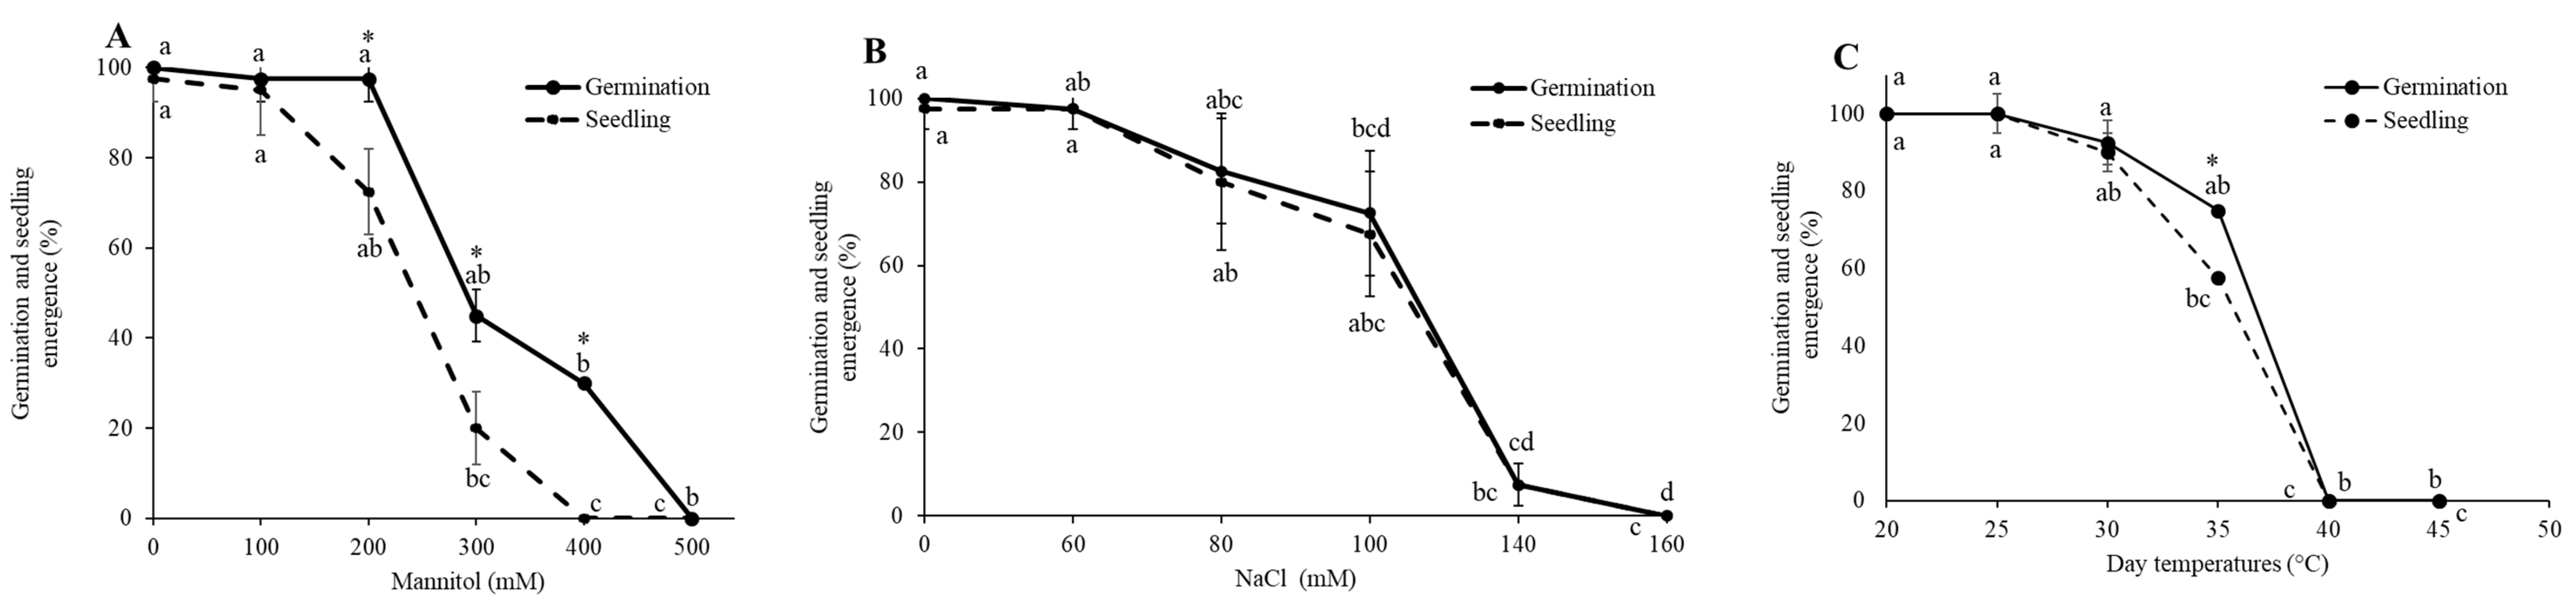
2.3. Establishment of LD50 for Drought, Salinity, and LT50 Heat Stress

Under aseptic conditions, 40 seeds each, of A. dubius and G. parviflora were plated onto standard germination media (as described in Section 2.2) which for drought and salinity stress were supplemented with mannitol (0, 100, 200, 300, 350, and 400 mM for A. dubius, and 0, 100, 200, 300, 400 and 500 mM for G. parviflora) and NaCl (0, 80, 120, 160, 200 and 240 mM for A. dubius, and 0, 40, 60, 80, 100, 140, 160 mM for G. parviflora), respectively. When screening for heat tolerance, both A. dubius and G. parviflora cultures were placed in a growth chamber at temperatures increasing in 5 °C increments day/night of 20 °C/9 °C, 25 °C/14 °C, 30 °C/19 °C, 35 °C/24 °C, 40 °C/29 °C, and 45 °C/34 °C.
Germination and seedling emergence totality were recorded after 21 days and expressed as a percentage (%). Seeds were considered germinated when at least 2 mm of the radical had protruded, while seedling emergence was considered when the first two leaves had unfurled. Percentage seedling emergence was selected as the initial tolerance indicator trait for both species under all three stressors and it was therefore, used to establish the concentrations/temperatures that inhibited seedling emergence by 50% (LD/T50) for both species under all three stressors. For all three stressors, for both species, the percentage seedling emergence data at day 21 were used to calculate the LD/T50, from a linear regression analysis of the three stressors against percentage seedling emergence, using the linear equation y = m x + c , at the regression coefficient of r2 ≥ 0.62 and r2 ≥ 0.84 for A. dubius and G. parviflora, respectively.

2.4. In Vitro Screening for Phenotypic Plasticity at LD/T50

Eighty seeds of A. dubius were placed on the standard media (as described in Section 2.2) which was supplemented with either 255.43 mM mannitol or 148.65 mM NaCl for drought and salinity stress, respectively. While seeds of G. parviflora were placed on the standard media supplemented with either 239.41 mM mannitol or 102.40 mM NaCl for drought and salinity stress, respectively. For the LT50 for heat stress which was 41.11 °C (day)/30.11 °C (night) and 34.91 °C (day)/23.91 °C (night) for A. dubius and G. parviflora, respectively, seeds were placed in a growth chamber (same conditions as Section 2.2). After 21 days, both species had their leaf area (cm2), root, shoot length (cm), fresh mass (g), dry mass (g), leaf number, and leaf chlorophyll content (Minolta SPAD-502, Minolta Camera Co. Ltd., Osaka, Japan) [45] measured in all emerged seedlings. Dry mass was determined after the whole plant material was placed in an oven at 80 °C for 48 h, and leaf area (cm2) was measured using a flat-bed scanner and processed through image analysis software (ImageJ®, Version 1.53o, 2022) [46].
For both A. dubius and G. parviflora, the phenotypic plasticity indices (PPI) (PPI = (maximum value − minimum value)/maximum value as per Valladares et al. [19]) were calculated for each of the seven traits measured in the seedlings exposed to all of the three stressors. The mean phenotypic plasticity (MPI) was also calculated by averaging the seven traits’ PPI for each stress, and by averaging a single trait’s PPI across each stress, this would identify those plastic traits for both species that were common across all three stressors.

2.5. Statistical Analyses

All statistical analyses were performed using PASW 27 (SPSS Inc., Chicago, IL, USA). All data were tested for normality using the Shapiro–Wilk test (p > 0.05). All percentage data were arcsine transformed. For normally distributed data, a two-way ANOVA (p < 0.05) was used to test for significant differences (1) in percentage germination and seedling emergence across the various concentrations/temperatures for each stress LD/T curve for both A. dubius and G. parviflora and (2) among the control and stressors of the selected morphological and physiological traits. A Tukey post hoc test was used to separate significantly different data. A t-test (p < 0.05) was then run to establish whether there were significant differences between the percentage germination and seedling emergence protocols within each concentration measured for each stressor, to identify the tolerance discriminating trait to establish the in vitro screening protocol. Differences in the relationships between percentage seedling emergence and the concentrations/temperatures for both species across each stressor were determined using a comparison of regressions. Please note that all data were non-parametric and were therefore subjected to one of two transformations: log or square root, except where data had been arcsine transformed. Where parameter data (which was all) were not normally distributed, a non-parametric Kruskal-Wallis (ANOVA) or Mann-U–Whitney (t-test) was run on untransformed ranked data.

3. Results

3.1. Establishment of LD50 for Drought, Salinity, and LT50 Heat Stress

The identification of an initial tolerance-indicating trait was necessary in order to develop in vitro screening protocols for both species; therefore, percentage (%) germination and seedling emergence were measured in seeds that were subjected to drought, salinity, and heat stress for 21 days. For A. dubius (Figure 1A–C) and G. parviflora (Figure 2A–C), under all three stressors, there were significant inverse proportional relationships observed, where an increase in stress intensity (concentration/temperature) caused a significant decrease in percentage germination and seedling emergence.
Amaranthus dubius seeds under the higher mannitol (350 and 400 mM) recorded significantly lower percentage germination and seedling emergence (0%) than those grown under control conditions and lower mannitol (100 (100%) and 200 mM (87.50 ± 15.00%)) (Figure 1A). Amaranthus dubius seeds that were exposed to increasing salinity showed a decline in percentage germination and seedling emergence, where at 200 and 240 mM, the germination and seedling emergence were significantly lower than when exposed to 0 mM (100%), 80 mM (95.00 ± 5.77%), and 120 mM (92.50 ± 9.57% and 90.00 ± 14.14%, respectively) (Figure 1B). Seeds of A. dubius grown under 25 °C/14 °C and 30 °C/19 °C, recorded 100% germination and seedling emergence which was significantly higher than the percentage germination and seedling emergence at 20 °C/9 °C (60.00 ± 0.00% and 45.00 ± 5.77%, respectively) and at the highest stress intensity 45 °C/34 °C (which was 0% for both parameters) (Figure 1C). There were no significant differences between percentage germination and seedling emergence when A. dubius seeds were exposed to various drought and NaCl levels. It is important to note that the only significant differences between percentage germination and seedling emergence for A. dubius were recorded at 20 °C/9 °C, where percentage seedling emergence (45.00 ± 5.77%) was more sensitive than percentage germination (60.00 ± 0.00%) (t-Test, p = 0.29). Therefore, because percentage seedling emergence showed more sensitivity to heat stress (whilst the other two stresses showed no difference), this parameter was used as the initial tolerance-indicating trait.
Galinsoga parviflora seeds exposed to various (drought) exhibited significantly lower germination at 400 mM and 500 mM, where 30% and 0% germination were recorded, respectively (Figure 2A). At 300 mM mannitol, G. parviflora exhibited 20.00 ± 8.17% seedling emergence—0% at 400 and 500 mM. These were significantly lower than the percentage seedling emergence recorded at the lower mannitol (0 and 100 mM) concentrations. Percentage seedling emergence was more sensitive than percentage germination at 200 mM, 300 mM, and 400 mM mannitol in G. parviflora seedlings. Galinsoga parviflora decreased percentage germination and percentage seedling emergence when exposed to increasing salinity (Figure 2B). When G. parviflora seeds were exposed to salinity, percentage germination and percentage seedling emergence at 100 mM, 140 mM, and 160 mM were significantly lower than percentage germination and percentage seedling emergence at 0 mM (100%). Note that at 140 and 160 mM NaCl, G. parviflora recorded the same values for both percentage germination and percentage seedling emergence (7.50 ± 5.00% and 0%, respectively). There was no difference between percentage germination and percentage seedling emergence of G. parviflora when exposed to salinity. Seeds of G. parviflora exposed to increasing day/night temperatures decreased percentage germination and seedling emergence. For example, at 40 °C/29 °C and 45 °C/34 °C there was 0% germination recorded and it was significantly lower than the percentage germination at lower temperatures (viz. 20 °C/9 °C, 25 °C/14 °C and 30 °C/19 °C) (Figure 2C). Similarly, percentage seedling emergence recorded 0% at 40 °C/29 °C and 45 °C/34 °C was significantly lower than the percentage seedling emergence at lower temperatures (viz. 20 °C/9 °C, 25 °C/14 °C and 30 °C/19 °C). The only significant differences between percentage germination and percentage seedling emergence for G. parviflora when exposed to heat stress were recorded at 35 °C/24 °C, where percentage seedling emergence (57.50 ± 5.00%) was more significantly lower than percentage germination (75.00 ± 5.77%) (t-Test, p = 0.004). It is important to note that under drought stress and various temperatures percentage seedling emergence was more sensitive than percentage germination. Therefore, for both A. dubius and G. parviflora percentage seedling emergence was used as the initial tolerance-indicating trait.
The data for percentage seedling emergence were then used to determine the concentrations/temperatures that inhibited seedling emergence by 50% (LD/T50) for use in subsequent experiments for both A. dubius (Figure 1A–C) and G. parviflora (Figure 2A–C). For A. dubius the calculated lethal doses (LD/T50), where 50% of seedling emergence was inhibited by the stressor were as follows: 255.43 mM mannitol for drought stress (−0.63 MPa) ( y = 0.2737 x + 119.91 , r2 = 0.80); 148.65 mM NaCl for salinity stress ( y = 0.4625 x + 118.75 , r2 = 0.85); and 41.11 °C/30.11 °C for heat stress ( y = 4.25 x + 224.75 , r2 = 0.62). For G. parviflora, the calculated LD/T50 were as follows: 239.41 mM mannitol for drought stress (−0.59 MPa) ( y = 0.2357 x + 106.43 , r2 = 0.91); 102.40 mM NaCl for salinity stress ( y = 0.6947 x + 121.14 , r2 = 0.84); and 34.91 °C/23.91 °C for heat stress ( y = 5.8 x + 252.5 , r2 = 0.92). Comparison of regressions showed significant although marginal differences (r2 = 0.252 ± 0.533; p < 0.013, curve estimation) between drought, salinity, and heat stress when percentage seedling emergence of A. dubius seeds was compared across the stressors. For G. parviflora seeds, the comparisons of regressions were strongly and significantly different (r2 = 0.834 ± 0.091; p < 0.001, curve estimation) between drought, salinity, and heat stress when percentage seedling emergence was compared across the stressors.

3.2. In Vitro Screening for Phenotypic Plasticity at LD/T50

The mean leaf areas (LA) of A. dubius seedlings exposed to 41.11 °C/30.11 °C (0.65 ± 0.15 cm2) and control (0.56 ± 0.29 cm2) conditions were significantly higher than the mean LAs under the other stresses (Table 1). The mean LA of A. dubius seedlings exposed to 148.65 mM salinity (0.07 ± 0.03 cm2) was significantly higher than the mean LA of those exposed to 255.43 mM mannitol (0.03 ± 0.01 cm2). Galinsoga parviflora control seedlings had significantly higher mean LA than those exposed to the stressors; there were no significant differences between the mean LAs of seedlings exposed to the stressors (Table 2).
Amaranthus dubius seedlings that were exposed to 41.11 °C/30.11 °C exhibited significantly the longest mean root length (RL) (6.14 ± 1.59 cm) than those grown under the control (3.67 ± 0.84 cm) conditions and other stressors (the mean RLs under drought and salinity were significantly smaller than those grown under the control conditions and heat stress) (Table 1). There were no significant differences recorded between A. dubius seedlings’ mean RLs exposed to 148.65 mM salinity (0.79 ± 0.26 cm) and 255.43 mM mannitol (0.47 ± 0.27 cm). Galinsoga parviflora control seedlings (3.23 ± 1.47 cm) exhibited significantly longer mean RL, which was followed by the mean RL of those exposed to 34.91 °C/23.91 °C (1.64 ± 0.62 cm) (Table 2), while G. parviflora seedlings exposed to heat stress (34.91 °C/23.91 °C) recorded significantly longer mean RLs than those exposed to salinity stress (102.40 mM). There was no significant difference between the mean RLs of G. parviflora seedlings exposed to drought and salinity stress.
The significantly longest mean shoot length (SL) of A. dubius seedlings was recorded in those that were exposed to 41.11 °C/30.11 °C (4.17 ± 0.30 cm), which was followed by those grown under the control (1.65 ± 0.51 cm) conditions (Table 1). The significantly shortest mean SLs were recorded in the A. dubius seedlings that were exposed to 148.65 mM salinity (0.59 ± 0.25 cm) and 255.43 mM mannitol (0.40 ± 0.08 cm) (which were not significantly different from each other). For G. parviflora seedlings, significantly longer mean SL was recorded in those exposed to 34.91 °C/23.91 °C (0.91 ± 0.17 cm). This was followed by those exposed to 239.91 mM mannitol (0.43 ± 0.08 cm), which was significantly higher than those grown under the control conditions and salinity stress (Table 2). There was no significant difference between the mean SLs of those G. parviflora seedlings exposed to the control conditions and salinity stress.
In the seedlings of A. dubius, similar results were displayed in RL, SL, and chlorophyll content (Chl), where those exposed to 41.11 °C/30.11 °C showed significantly higher mean Chl than the control and other stressors (Table 1). The mean Chl of A. dubius seedlings grown under the control (12.28 ± 2.98 SPAD units) conditions were significantly higher than those exposed to drought (2.31 ± 0.67 SPAD units) and salinity (2.26 ± 1.53 SPAD units) stress (which were not significantly different for each other). The mean Chl of G. parviflora control seedlings were significantly higher than the mean Chl of those exposed to the stressors (Table 2). The mean Chl of G. parviflora seedlings showed no significant differences amongst drought, salinity, and heat stress.
The significantly highest mean fresh masses (FM) of A. dubius were recorded in seedlings exposed to 41.11 °C/30.11 °C (0.0797 ± 0.0274 g) and the control seedlings (0.0619 ± 0.0371 g) (which were not significantly different from each other) (Table 1). Followed by the mean FM of A. dubius seedlings under salinity (0.0067 ± 0.0030 g) stress which was significantly higher than those under drought (0.0051 ± 0.0013 g) stress. Similar to mean Chl in G. parviflora seedlings, the highest mean FM was recorded in seedlings under control conditions, which were significantly higher than the mean FMs of those exposed to the stressors (Table 2). The mean FMs of G. parviflora seedlings showed no significant differences amongst drought, salinity, and heat stress.
The mean dry masses (DM) of A. dubius seedlings exposed to 41.11 °C/30.11 °C and the control conditions (which were not significantly different from each other) were significantly higher than the mean DMs of those under the other stressors (Table 1). In A. dubius seedlings, the significantly lowest mean DMs were recorded in those exposed to drought and salinity. However, the mean DMs were not significantly different between drought and salinity stress. Galinsoga parviflora seedlings under control conditions exhibited significantly the highest mean DM compared to those exposed to the stressors (Table 2). These were followed by those G. parviflora seedlings exposed to 239.91 mM mannitol (0.0006 ± 0.0006 g) and 102.40 mM NaCl (0.0006 ± 0.0006 g), which were not significantly different from each other but were significantly higher than those exposed to 34.91 °C/23.91 °C (0.0002 ± 0.0001 g).
Similar trends were observed in RL, SL, and Chl of A. dubius seedlings, where the significantly highest mean number of leaves were in seedlings under control conditions (Table 1). In A. dubius seedlings exposed to 41.11 °C/30.11 °C (4.63 ± 0.49 number of leaves), the mean number of leaves was significantly higher than those exposed to drought (2.00 ± 0.00 number of leaves) and salinity stress (2.00 ± 0.00 number of leaves), although there were no significant differences between the mean number of leaves in seedlings under drought and salinity stress. In G. parviflora seedlings, the significantly highest mean number of leaves was recorded in those under control conditions (Table 2). The mean numbers of leaves of G. parviflora seedlings under drought, salinity, and heat stress were not significantly different from one another; similar trends were observed in Chl and FM.
Very interestingly, the measured traits that could be used as tolerance-indicating traits in the proposed screening protocols for drought, salinity, and heat tolerance for A. dubius were RL, SL, Chl, and number of leaves, while for G. parviflora, these were: RL, SL, Chl, and number of leaves.
It appears that for both A. dubius and G. parviflora populations, measured salinity had a positive effect on the phenotypic plasticity of all the measured traits, while drought and heat stress negatively affected the phenotypic plasticity of all the measured traits (Table 3 and Table 4). Amaranthus dubius control seedlings exhibited a mean phenotypic plasticity index of 0.70 ± 0.24. Under drought and heat stress, the indices were lower, at 0.56 ± 0.28 and 0.54 ± 0.28 (Table 3). The A. dubius population exposed to salinity stress recorded a mean phenotypic plasticity of 0.76 ± 0.34, which was higher than the indices calculated for those seedlings grown under the control conditions and other stressors. The control population of A. dubius showed 86% of the measured traits with phenotypic plasticity indices between 0.58 and 0.94 (these were: LA, RL, SL, Chl, FM, and DM), with the highest index being recorded for FM. Under drought stress, the measured A. dubius population exhibited 71% of measured traits, which had phenotypic plasticity indices of ≥0.55 (viz. LA, RL, Chl, FM, and DM), with DM having the highest index (0.86). Under salinity stress, 86% of the measured traits in the population of A. dubius seedlings had phenotypic plasticity indices ≥ 0.83 (viz. LA, RL, SL, Chl, FM, and DM) and the highest index was Chl (0.95). The measured population of A. dubius under heat stress showed 57% of measured traits being ≥0.55 (viz. LA, RL, FM, and DM) with DM calculated to be the most plastic trait (0.98). The lowest mean phenotypic plasticity indices across the control and stressors for the measured populations of A. dubius seedlings was number of leaves which was ≤0.29. Across all the stressors, five of the measured traits in the measured A. dubius populations showed high mean phenotypic plasticity indices (0.69 ± 0.21 to 0.91 ± 0.05), these were LA, RL, Chl, FM, and DM (although, SL was plastic it possessed low phenotypic plasticity (0.53 ± 0.26)). The control population of G. parviflora seedlings showed that the mean phenotypic plasticity index was 0.86 ± 0.17, and the indices were lower in those populations grown under drought (0.79 ± 0.21) and heat (0.71 ± 0.17) stress (Table 4). Only the G. parviflora population under salinity stress recorded a higher mean phenotypic plasticity (0.89 ± 0.10). It is important to mention that all measured traits in the populations of G. parviflora seedlings grown under control conditions and all three of the stresses recorded phenotypic plasticity indices ≥0.50 (Table 4). The highest phenotypic plasticity indices were DM (0.98), measured in control seedlings; Chl (0.97) under drought; LA, RL, and Chl (0.97) under salinity; and FM (0.90) under heat stress. Across all the stressors, all the measured traits in G. parviflora seedlings showed high mean phenotypic plasticity indices ≥0.68, except for number of leaves, which showed low plasticity (0.58 ± 0.17). Of the two species, G. parviflora had higher phenotypic plasticity indices and therefore capabilities.

4. Discussion

The identification of traits that are plastic and show tolerance to climate change-induced abiotic stressors is essential in the development of screening strategies for edible plant species, and this study could lead to more efficient breeding protocols for alternative food sources, such as A. dubius and G. parviflora [2,5,14,19,24]. At the time of this study, there were no published abiotic stress screening protocols for A. dubius specifically, but in vitro [32,47] and pot [37] protocols have been published for other members of the genus. At the time of this submission, apart from the authors’ own study [48], there are only two peer-reviewed studies on pot and field screening of G. parviflora (both for cadmium stress [35,40]). To the best of the author’s knowledge, this study is, therefore, the first to screen seeds for both A. dubius and G. parviflora for tolerance to drought, salinity, and heat stress.
This study screened seeds based on similar studies that have successfully used seeds to screen for abiotic tolerance [49,50,51,52,53,54]. The use of seeds as plant material in screening studies has been widely reported for commercial crops [49,50,52] and wild crop species [51,54]. At the time of this study, there were, however, no published articles on the use of seeds as the plant material for screening A. dubius and G. parviflora for tolerance to abiotic/biotic stressors. It was chosen to use in vitro techniques for this study; of the above-mentioned studies only Carvalho et al. [50] made use of in vitro screening techniques to screen Vigna unguiculata (L.) Walp seeds for drought tolerance. The in vitro screening protocol for A. dubius involved seeds being placed on standard media supplemented with the calculated LD/T50 concentration of mannitol (255.43 mM) or NaCl (148.65 mM), while for heat stress the Petri dishes were placed in a growth chamber set at the temperature (41.11 °C/30.11 °C) that caused 50% inhibition of seedlings to emerge. The physiological and morphological traits measured in the A. dubius seedlings that emerged under drought and salinity stress showed that all traits were significantly lower than those traits measured in seedlings that emerged under the control conditions. This indicates that A. dubius was sensitive to and negatively affected by drought and salinity stress. Of the A. dubius seedlings that emerged under heat stress, 71% of the measured traits were affected. Among these, 57% of the measured traits were positively affected. In fact, only the number of leaves was negatively affected; all of this is indicative of A. dubius showing some level of tolerance to heat stress. The in vitro screening protocol of G. parviflora involved seeds being placed on standard media supplemented with the calculated LD/T50 concentration of mannitol (239.91 mM) or NaCl (102.40 mM), while for heat stress the Petri dishes were placed in a growth chamber set at the temperature (34.91 °C/23.91 °C), which caused 50% inhibition of seed germination. All of the measured physiological and morphological traits in G. parviflora seedlings that grew under drought stress were negatively affected, suggesting that this species shows a level of sensitivity to drought stress. In the G. parviflora seedlings that emerged under salinity and heat stress, 86% of the measured physiological and morphological traits were negatively affected by the stressors, and values for these traits were significantly lower than those measured in control seedlings. Only under heat stress did G. parviflora seedlings experience a significant increase in SL relative to control seedlings. This indicates that G. parviflora seedlings were negatively affected by all three stressors but with greater sensitivity to drought and heat stress.
In order for a screening protocol to be established for both species, an initial trait that can be used to select for tolerance needs to be identified [24,25,29,30,32]. Percentage (%) germination (emergence of radical) as a tolerance-indicating trait has been reported in screening studies [50,51,53,55,56], however, this study opted to use the percentage emergence of the seedlings (seedlings with two unfurled leaves) as the tolerance-indicating trait. This was due to the fact that percentage seedlings emergence was more sensitive under drought stress for G. parviflora than percentage germination, particularly at mannitol of 200, 300, and 400 mM (Figure 2A). Under heat stress, both species also showed percentage seedling emergence to be more sensitive than percentage germination at 20 °C/19 °C (A. dubius) and 35 °C/24 °C (G. parviflora), only. Additionally, the emergence of a radical is not confirmation of the plant’s ability to grow and reach maturity under stress conditions [57].
The use of an inhibiting dose of a selecting agent for screening plants can be calculated using linear regression [58,59,60], nonlinear regression [61], or probit regression [62]; all of these have been previously reported in the literature. This study, however, used linear regression for both species. For A. dubius and G. parviflora, the comparison of regressions showed that seedlings under each stress were significantly different from one another, although they responded similarly (in terms of trends) at varying degrees of intensity. However, G. parviflora seedlings showed a strong relationship between the regressions of each of the stresses (viz. drought–salinity, drought–heat, and salinity–heat; r2 ≥ 0.83); this indicates that both stresses could have similar negative effects on the species and also that the responses of seedling emergence would be similar under both stressors.
Typical responses of plants exposed to drought stress is to prevent excess transpiration to conserve water, this is generally achieved with a decrease in leaf area (LA), shoot length (SL), fresh mass (FM), dry mass (DM), and number of leaves [4,32,36,55,63]. The results obtained in this study for both species showed decreases in leaf area (LA), chlorophyll content (Chl), fresh mass (FM), and number of leaves (Table 1 and Table 2). The decrease in these morphological parameters is the plant’s attempt to decrease surface area [4,32,36,38]. For example, in a study by Liu and Stützel [63], A. tricolor L., A. blitum L., and A. cruentus L. experienced a decrease in LA and DM when exposed to drought stress. In another study on WLVs, A. cruentus, Corchorus olitorius L., Beta vulgaris L., and Vigna unguiculata (L.) Walp. were exposed to drought stress. Plants of all four species decreased in height, FM, and number of leaves [38]. Amaranthus hypochondriacus L., A. tricolor L., and A. hybridus L. experienced a decrease in LA and Chl [32]. A similar study on A. tricolor showed two varieties (VA15 and VA13) demonstrated decreased LA, Chl, and DM when exposed to drought [36]. Two studies on Arabidopsis thaliana L. Heynh. 1842, wild types Columbia CS 907 [64] and Col-0 [56], showed that when exposed to drought, CS 907 plants decreased in RL, while Col-0 showed both decreased RL and SL. Another study on a wild type (Vp16) of Zea mays L. showed a decrease in SL when exposed to drought stress. At the time of this study, there were no peer-reviewed studies on the effects of drought on the RL and SL of any Amaranthus species, while there were no studies for G. parviflora or other members of the genus being exposed to drought stress. In fact, the only two studies that could be found for G. parviflora were those by Lin et al. [35,40], where the species was screened for cadmium (Cd) for its possible hyperaccumulator potential. Although G. parviflora showed high tolerance to Cd it was still negatively affected by the stress (e.g., the authors measured various biochemical and morphological parameters), of significance to our study was that the plant height, RL, and FM all significantly decreased as the [Cd] increased [35,40].
Amaranthus dubius was also shown to be negatively affected by salinity stress, where all the measured morphological and physiological traits were lower than those seedlings grown under the control conditions (Table 1). Galinsoga parviflora showed a level of sensitivity to salinity stress, all measured physiological and morphological traits (except SL) were significantly lower than the control (Table 2). The Na+ and Cl ions produced under saline conditions could cause ion accumulation in the plant tissue, leading to possible ion imbalances and even toxicity [34,65]. In response to these imbalances of ions in the plant tissue, plants tend to decrease morphological parameters and attempt to slow down metabolic processes [34,65]. This explains why the results observed in this study were similar to those observed by Hoang et al. [66], where the authors subjected A. tricolor and A. dubius to different levels of salinity, and at the higher concentrations of NaCl, both species experienced decreases in plant height, RL, LA, DM, and number of leaves. In another study on a WLV, Ceratotheca triloba (Bernh.) Hook. f., when exposed to increasing salinity, showed a decrease in SL and RL in the seedlings, which is similar to what was found in this study [55]. Similar to this study, where Chl and FM decreased in selected species under salinity stress, studies on A. lividus L. [67] and A. tricolor [36] also showed decreases in Chl and FM under salinity stress. It is important to note that under salinity stress, G. parviflora seedlings showed no significant difference in SL between salinity and control seedlings (Table 2).
The results of the present study suggest that although A. dubius was sensitive to heat stress, the seedlings were not negatively affected (Table 1). Three traits (viz. RL, SL, and Chl) were significantly higher in seedlings under heat stress than the control, while FM and DM showed no significant difference. A study by Hwang et al. [68], showed that under heat stress, A. tricolor (C4) increased its plant height, RL, LA, FM, DM, and number of leaves, which is similar to what was found in this study for A. dubius. This indicated that both these species (A. tricolor and A. dubius) were positively affected by heat stress. Interestingly, those authors examined a C4 (being A. tricolor) and a C3 (Brassica chinensis L. cv. Quanzhou), as in this study (C4 A. dubius and the C3 G. parviflora), and the results were similar because in this study and theirs, it was evident that both C3 (viz. G. parviflora and B. chinensis) plants were negatively affected by the heat stress [68]. Galinsoga parviflora experienced a decrease in all traits, except SL (which increased significantly) when exposed to heat stress (Table 2). The same results were found in B. chinensis, in which LA, FM, and DM decreased when exposed to heat stress [68]. It is important to note that a decrease in Chl is often associated with sensitivity to stress while an increase in Chl is normally associated with plants showing some sort of tolerance to the stress, which was the case in this study, with A. dubius increasing its Chl under heat stress [69,70,71,72]. In a previous study by authors Areington et al. [48], heat stress appears to benefit plants with C4 photosynthetic pathways while negatively impacting C3 species. This is due to C4 plants generally operating at higher optimum temperatures and having the ability to maintain photosynthesis under elevated temperatures due to the CO2 concentration mechanism’s C4 photosynthetic pathway [68,73].
It must be mentioned that G. parviflora was sensitive to all stressors, but interestingly SL was the only trait that did not change under salinity stress and increased under heat stress while all other measured traits were lower than those seedlings in the control. The author attributes this to the fact that under in vitro conditions, there are no limiting resources (viz. sucrose, water, and nutrients are within the growth medium). Additionally, there is no gaseous exchange. Therefore, the plant can invest the carbon into the growth of SL rather than the other organs [74,75]. This is not in agreement with many other studies, where morphological traits generally decrease under stress conditions; particularly when exposed to salinity stress plants are known to decrease their SL [41,42,65,76,77].
Identifying species/populations with high phenotypic plasticity based on plastic and tolerance-indicating traits would expedite breeding progress, especially in underutilized WLVs [5,17,19,20,39]. This study used phenotypic plasticity index to identify plastic traits, although these indices are generally used to rank species/cultivars based on their phenotypic plasticity [19,20,78]. This is generally done by establishing the plasticity of individual traits and collating them to rank the species/cultivars, this would identify those that have higher phenotypic plasticity capabilities compared to the others [19,20,78]. For example, Khanam and Oba [20] ranked 15 A. tricolor L. cultivars using Valladares et al. [19] phenotypic plasticity index to establish which of the cultivars had higher phenotypic plasticities. Those authors used various physiological and morphological traits to calculate phenotypic plasticity in all 15 A. tricolor cultivars. These traits were Chl a, Chl b, total Chl, plant height, FM, and DM, to name a few [20]. This study showed that both species possessed high mean levels of phenotypic plasticity under control conditions (0.70 ± 0.24 and 0.86 ± 0.17, A. dubius and G. parviflora, respectively) (anything above >0.50 indicates plasticity; while anything ≥0.60 indicates high plasticity which increases as values approach 1) [20] (Table 3 and Table 4). When populations of both species were exposed to drought and heat stress, they experienced a decrease in the mean phenotypic plasticity. The populations of both species experienced an increase in mean phenotypic plasticity when seedlings were exposed to salinity stress (0.76 ± 034 and 0.89 ± 0.10, A. dubius and G. parviflora, respectively). For A. dubius, three traits were identified as showing tolerance and plasticity across all three selected stressors: RL (0.72 ± 0.15), SL (0.53 ± 0.26), and Chl (0.69 ± 0.21). For G. parviflora, six traits were identified as plastic- and tolerance-indicating traits: LA (0.91 ± 0.06), RL (0.84 ± 0.09), Chl (0.89 ± 0.14), FM (0.89 ± 0.11), DM (0.91 ± 0.11), and number of leaves (0.58 ± 0.17). It is important to mention that for G. parviflora, all measured traits were plastic, and for A. dubius, only number of leaves was not identified as plastic. All this suggests that both species naturally possess high phenotypic plasticity and would therefore be able to adapt to various climate change associate abiotic stressors [2,5,8,20,28]. In a study by Zhang et al. [39], an A. palmeri (S. Wats) population possessed high phenotypic plasticity, specifically shoot DM (0.65), leaf DM (0.87), and LA (0.71), which were similar to what was obtained in this study for A. dubius. In a study by Khanam and Oba [20], a population of A. tricolor had a high Chl (0.73) phenotypic plasticity index, which was similar to what was seen in this study, where the measured A. dubius population’s Chl exhibited an index of 0.69. The high phenotypic plasticity capabilities of both species suggest that there is potential to identify tolerant phenotypes/genotypes for climate-change-induced stressors (based on reasoning offered in other studies, e.g., [12,14,17,18,21]).

5. Concluding Remarks and Recommendations

In conclusion, Amaranthus dubius and Galinsoga parviflora are neglected and underutilized wild leafy vegetables that possess high plasticity and the potential to tolerate various climate-change-induced stressors. The traits that were most plastic and hence recommended for the in vitro rapid screening of drought, sanity, and heat stress tolerance for A. dubius are root length, shoot length, and chlorophyll content, while for G. parviflora, these are: leaf area, root length, chlorophyll content, fresh mass, dry mass, and number of leaves. Since in vitro screening techniques are conducted under controlled conditions, with limited environmental exposure specifically gaseous exchange, there is a need to validate their plasticity under field conditions in future. Nevertheless, this study represents the groundwork for the adoption of these species into breeding programs aimed at developing novel climate-tolerant crop species. It also expands our knowledge on how to exploit phenotypic plasticity for the purposes of screening species for stress tolerance.

Author Contributions

Conceptualization, all authors; methodology, C.A.A.; software, C.A.A.; validation, all authors; formal analysis, all authors.; investigation, C.A.A.; resources, C.A.A. and S.; data curation, all authors.; writing—original draft preparation, C.A.A.; writing—review and editing, M.M.O. and S.; visualization, all authors; supervision, M.M.O. and S.; project administration, C.A.A. and S.; funding acquisition, C.A.A. and S. All authors have read and agreed to the published version of the manuscript.

Funding

Funding and support for this project were provided by the University of KwaZulu-Natal and the Council for Scientific and Industrial Research (CSIR), South Africa.

Institutional Review Board Statement

Not applicable.

Informed Consent Statement

Not applicable.

Data Availability Statement

The raw data supporting the conclusions of this article will be made available by the authors on request.

Conflicts of Interest

The authors declare no conflict of interest.

Appendix A

Figure A1. Visual representation of methodology for this study.
Ijpb 15 00063 g0a1

References

  1. Odhav, B.; Beekrum, S.; Akula, U.S.; Baijnath, H. Preliminary assessment of nutritional value of traditional leafy vegetables in KwaZulu-Natal. S. Afr. J. Food Compos. Anal. 2007, 20, 430–435. [Google Scholar] [CrossRef]
  2. Achigan-Dako, E.G.; Sogbohossou, O.E.D.; Maundu, P. Current knowledge on Amaranthus spp.: Research avenues for improved nutritional value and yield in leafy amaranths in sub-Saharan Africa. Euphytica 2014, 197, 303–317. [Google Scholar] [CrossRef]
  3. Mabhaudhi, T.; Chibarabada, T.P.; Chimonyo, V.G.P.; Murugani, V.G.; Pereira, L.M.; Sobratee, N.; Govender, L.; Slotow, R.; Modi, A.T. Mainstreaming underutilized indigenous and traditional crops into food systems: A South African perspective. Sustainability 2019, 11, 172. [Google Scholar] [CrossRef]
  4. Amma, C.S.; Rajalakshmi, R. Morphological and Physiological Responses in Red Amaranthus (Amaranthus tricolor L.) and Green Amaranthus (Amaranthus dubius Mart. ex Thell.) Under Progressive Water Stress. Asian J. Biol. Life Sci. 2023, 12, 61. [Google Scholar]
  5. Joshi, D.C.; Sood, S.S.; Hosahatti, R.; Kant, L.; Pattanayak, A.; Kumar, A.; Yadav, D.; Stetter, M.G. From zero to hero: The past, present and future of grain amaranth breeding. Theor. Appl. Genet. 2018, 131, 1807–1823. [Google Scholar] [CrossRef]
  6. Ripanda, A.; Luanda, A.; Sule, K.S.; Mtabazi, G.S.; Makangara, J.J. Galinsoga parviflora (Cav.): A comprehensive review on ethnomedicinal, phytochemical and pharmacological studies. Heliyon 2023, 9, e13517. [Google Scholar] [CrossRef]
  7. Sattar, M.; Saeed, F.; Afzaal, M.; Rasheed, A.; Asif, A.; Sharif, S.; Hussain, M.; Asad Ur Rehman, H.; Raza, M.A.; Munir, H.; et al. An overview of the nutritional and therapeutic properties of amaranth. Int. J. Food Prop. 2024, 27, 263–272. [Google Scholar] [CrossRef]
  8. Damalas, C.A. Distribution, biology, and agricultural importance of Galinsoga parviflora (Asteraceae). Weed Biol. Manag. 2008, 8, 147–153. [Google Scholar] [CrossRef]
  9. Benhin, J.K.A. South African crop farming and climate change: An economic assessment of impacts. Glob. Environ. Chang. 2008, 18, 666–678. [Google Scholar] [CrossRef]
  10. Songoni, A.; Jimoh, M.O.; Kambizi, L.; Laubscher, C.P. The impact of salt stress on plant growth, mineral composition, and antioxidant activity in Tetragonia decumbens Mill: An underutilized edible halophyte in South Africa. Horticulturae 2021, 7, 140. [Google Scholar] [CrossRef]
  11. Pareek, A.; Dhankher, O.P.; Foyer, C.H. Mitigating the impact of climate change on plant productivity and ecosystem sustainability. J. Exp. Bot. 2020, 71, 451–456. [Google Scholar] [CrossRef]
  12. Boyer, J.S. Plant Productivity and Environment. Science 1982, 218, 443–448. [Google Scholar] [CrossRef] [PubMed]
  13. Bradshaw, W.E.; Holzapfel, C.M. Evolutionary response to rapid climate change. Science 2006, 312, 1477–1478. [Google Scholar] [CrossRef] [PubMed]
  14. Nicotra, A.B.; Atkin, O.K.; Bonser, S.P.; Davidson, A.M.; Finnegan, E.J.; Mathesius, U.; Poot, P.; Purugganan, M.D.; Richards, C.L.; Valladares, F.; et al. Plant phenotypic plasticity in a changing climate. Trends Plant Sci. 2010, 15, 684–692. [Google Scholar] [CrossRef] [PubMed]
  15. Matesanz, S.; Milla, R. Differential plasticity to water and nutrients between crops and their wild progenitors. Environ. Exp. Bot. 2018, 145, 54–63. [Google Scholar] [CrossRef]
  16. Sallam, A.; Alqudah, A.M.; Dawood, M.F.A.; Baenziger, P.S.; Börner, A. Drought stress tolerance in wheat and barley: Advances in physiology, breeding and genetic research. Int. J. Mol. Sci. 2019, 20, 3137. [Google Scholar] [CrossRef]
  17. Carrascosa, A.; Silvestre, M.; Morgado, L.; Azcárate, F.M. Diversity and mean specific leaf area of Mediterranean woody vegetation changes in response to summer drought across a double stress gradient: The role of phenotypic plasticity. J. Veg. Sci. 2023, 34, 13180. [Google Scholar] [CrossRef]
  18. Dupont, L.; Thierry, M.; Zinger, L.; Legrand, D.; Jacob, S. Beyond reaction norms: The temporal dynamics of phenotypic plasticity. Trends Ecol. Evol. 2024, 39, 41–51. [Google Scholar] [CrossRef]
  19. Valladares, F.; Wright, S.J.; Lasso, E.; Kitajima, K.; Pearcy, R.W. Plastic phenotypic response to light of 16 congeneric shrubs from a Panamanian rainforest. Ecology 2000, 81, 1925–1936. [Google Scholar] [CrossRef]
  20. Khanam UK, S.; Oba, S. Phenotypic plasticity of vegetable Amaranth, Amaranthus tricolor L. under a natural climate. Plant Prod. Sci. 2014, 17, 166–172. [Google Scholar] [CrossRef]
  21. Enoki, T.; Takagi, M.; Ugawa, S.; Nabeshima, E.; Ishii, H. Regional and topographic growth variation among 45-year-old clonal plantations of Cryptomeria japonica: Effects of genotypes and phenotypic plasticity. J. For. Res. 2020, 25, 329–338. [Google Scholar] [CrossRef]
  22. Duvick, D.N. Plant breeding, an evolutionary concept. Crop Sci. 1996, 36, 539–548. [Google Scholar] [CrossRef]
  23. Duncan, R.R. Tissue culture-induced variation and crop improvement. Adv. Agron. 1997, 58, 201–240. [Google Scholar] [CrossRef]
  24. Bradshaw, J.E. Plant breeding: Past, present and future. Euphytica 2017, 213, 60. [Google Scholar] [CrossRef]
  25. Borlaug, N.E. Contributions of conventional plant breeding to food production. Science 1983, 219, 689–693. [Google Scholar] [CrossRef]
  26. Roy, S.J.; Tucker, E.J.; Tester, M. Genetic analysis of abiotic stress tolerance in crops. Curr. Opin. Plant Biol. 2011, 14, 232–239. [Google Scholar] [CrossRef]
  27. Maleki, M.; Ghorbanpour, M.; Nikabadi, S.; Wani, S.H. In vitro screening of crop plants for abiotic stress tolerance. In Recent Approaches in Omics for Plant Resilience to Climate Change; Wani, S.H., Ed.; Springer: Cham, Switzerland, 2019; pp. 75–91. [Google Scholar] [CrossRef]
  28. Charlesworth, D.; Charlesworth, B. Quantitative genetics in plants: The effects of the breeding system on genetic variability. Evolution 1995, 49, 911–920. [Google Scholar] [CrossRef]
  29. Jain, S.M. Tissue culture-derived variation in crop improvement. Euphytica 2001, 118, 153–166. [Google Scholar] [CrossRef]
  30. Ceccarelli, S. Efficiency of plant breeding. Crop Sci. 2015, 55, 87–97. [Google Scholar] [CrossRef]
  31. Ahmar, S.; Gill, R.A.; Jung, K.H.; Faheem, A.; Qasim, M.U.; Mubeen, M.; Zhou, W. Conventional and Molecular Techniques from Simple Breeding to Speed Breeding in Crop Plants: Recent Advances and Future Outlook. Int. J. Mol. Sci. 2020, 21, 2590. [Google Scholar] [CrossRef]
  32. Slabbert, R.; Spreeth, M.; Krüger, G.H.J. Drought tolerance, traditional crops and biotechnology: Breeding towards sustainable development. S. Afr. J. Bot. 2004, 70, 116–123. [Google Scholar] [CrossRef]
  33. Kumar, B.; Kumar, K.; Jat, S.L.; Srivastava, S.; Tiwari, T.; Kumar, S.; Meenakshi Pradhan, H.R.; Kumar, B.; Chaturvedi, G.; Jha, A.K.; et al. Rapid method of screening for drought stress tolerance in maize (Zea mays L.). Indian J. Genet. Plant Breed. 2020, 80, 16–25. [Google Scholar] [CrossRef]
  34. Munns, R.; James, R.A. Screening methods for salinity tolerance: A case study with tetraploid wheat. Plant Soil 2003, 253, 201–218. [Google Scholar] [CrossRef]
  35. Lin, L.; Liao, M.; Ren, Y.; Luo, L.; Zhang, X.; Yang, D. Effects of mulching tolerant plant straw on soil surface on growth and cadmium accumulation of Galinsoga parviflora. PLoS ONE 2014, 9, e114957. [Google Scholar] [CrossRef]
  36. Sarker, U.; Oba, S. Catalase, superoxide dismutase and ascorbate-glutathione cycle enzymes confer drought tolerance of Amaranthus tricolor. Sci. Rep. 2018, 8, 16496. [Google Scholar] [CrossRef] [PubMed]
  37. Pietrini, F.; Iori, V.; Cheremisina, A.; Shevyakova, N.I.; Radyukina, N.; Kuznetsov, V.V.; Zacchini, M. Evaluation of nickel tolerance in Amaranthus paniculatus L. plants by measuring photosynthesis, oxidative status, antioxidative response and metal-binding molecule content. Environ. Sci. Pollut. Res. 2015, 22, 482–494. [Google Scholar] [CrossRef] [PubMed]
  38. Maseko, I.; Ncube, B.; Mabhaudhi, T.; Tesfay, S.; Chimanyo, V.G.P.; Araya, H.T.; Fessehazian, M.; Du Plooy, C.P. Moisture stress on physiology and yield of some indigenous leafy vegetables under field conditions. S. Afr. J. Bot. 2019, 126, 85–91. [Google Scholar] [CrossRef]
  39. Zhang, M.; Ma, K.; Liu, T.; Tang, L.; Khan, A.A.; Yang, T.; Zheng, P.; Wang, T.; Han, J.; Shi, F. Response in phenotypic plasticity of Amaranthus palmeri and Polygonum orientale to soil factors under different habitats. Clean-Soil Air Water 2020, 48, 1900203. [Google Scholar] [CrossRef]
  40. Lin, L.; Jin, Q.; Liu, Y.; Ning, B.; Liao, M.; Luo, L. Screening of new cadmium hyperaccumulator, Galinsoga parviflora, from winter farmland weeds using the artificially high soil cadmium concentration method. Environ. Toxicol. Chem. 2014, 33, 2422–2428. [Google Scholar] [CrossRef]
  41. Hayat, S.; Mir, B.A.; Wani, A.S.; Hasan, S.A.; Irfan, M.; Ahmad, A. Screening of salt-tolerant genotypes of Brassica juncea based on photosynthetic attributes. J. Plant Interact. 2011, 6, 53–60. [Google Scholar] [CrossRef]
  42. Bibi, A.; Sadaqat, H.A.; Tahir MH, N.; Akram, H.M. Screening of sorghum (Sorghum bicolor Var Moench) for drought tolerance at seedling stage in polyethylene glycol. J. Anim. Plant Sci. 2012, 22, 671–678. [Google Scholar]
  43. Qadir, M.; Bibi, A.; Tahir, M.H.N.; Saleem, M.; Sadaqat, H.A. Screening of sorghum (Sorghum bicolor L.) genotypes under various levels of drought stress. Maydica 2015, 60, M35. [Google Scholar]
  44. Murashige, T.; Skoog, F. A revised medium for rapid growth and bioassays with tobacco tissue culture. Physiol. Plant. 1962, 15, 473–479. [Google Scholar] [CrossRef]
  45. Coste, S.; Baraloto, C.; Leroy, C.; Macron, E.; Renaud, A.; Richardson, A.D.; Roggy, J.C.; Schimann, H.; Uddling, J.; Herault, B. Assessing foliar chlorophyll contents with the SPAD-502 chlorophyll meter: A calibration test with thirteen tree species of tropical rainforest in French Guiana. Ann. For. Sci. 2010, 67, 607. [Google Scholar] [CrossRef]
  46. dos Santos, J.C.C.; Costa, R.N.; Silva, D.M.R.; de Souza, A.A.; de Barros Prado Moura, F.; da Silva Junior, J.M.; Silva, J.V. Use of allometric models to estimate leaf area in Hymenaea courbaril L. Theor. Exp. Plant Physiol. 2016, 28, 357–369. [Google Scholar] [CrossRef]
  47. Yadav, P.; Mina, U.; Bhatia, A. Screening of forty Indian Amanrthus hypochondriacus cultivars for tolerance and susceptibility to tropospheric ozone stress. Nucleus 2020, 63, 281–291. [Google Scholar] [CrossRef]
  48. Areington, C.A.; Neto, M.C.L.; Watt, P.M. Assessing the utility of selected photosynthetic and related traits in screening Amaranthus dubius Mart. ex Thell. and Galinsoga parviflora Cav. 1796 seedlings for elevated temperature stress tolerance. S. Afr. J. Bot. 2022, 145, 444–457. [Google Scholar] [CrossRef]
  49. Kausar, A.; Ashraf, M.Y.; Niaz, M. Some physiological and genetic determinants of salt tolerance in sorghum (Sorghum bicolor (L.) Moench): Biomass production and nitrogen metabolism. Pak. J. Bot. 2014, 44, 47–52. [Google Scholar]
  50. Carvalho, M.; Matos, M.; Castro, I.; Monteiro, E.; Rosa, E.; Lino-Neto, T.; Carnide, V. Screening of worldwide cowpea collection to drought tolerant at a germination stage. Sci. Hortic. 2019, 247, 107–115. [Google Scholar] [CrossRef]
  51. Liu, S.; Zenda, T.; Dong, A.; Yang, Y.; Liu, X.; Wang, Y.; Li, J.; Tao, Y.; Duan, H. Comparative proteomic and morpho-physiological analyses of maize wild-type Vp16 and mutant vp16 germinating seed responses to PEG-induced drought stress. Int. J. Mol. Sci. 2019, 20, 5586. [Google Scholar] [CrossRef]
  52. Sun, J.; He, L.; Li, T. Response of seedling growth and physiology of Sorghum bicolor (L.) Moench to saline-alkali stress. PLoS ONE 2019, 14, e0220340. [Google Scholar] [CrossRef] [PubMed]
  53. Wu, H.; Guo, J.; Wang, C.; Li, K.; Zhang, X.; Yang, Z.; Li, M.; Wang, B. An effective screening method and reliable screening trait for salt tolerance of Brassica napus at the germination stage. Front. Plant Sci. 2019, 10, 530. [Google Scholar] [CrossRef] [PubMed]
  54. Shi, M.Q.; Liao, X.L.; Qian, Y.E.; Zhang, W.; Li, Y.K.; Bhat, J.A.; Kan, G.Z.; Yu, D.Y. Linkage and association mapping of wild soybean (Glycine soja) seeds germinating under salt stress. J. Integr. Agric. 2022, 21, 2833–2847. [Google Scholar] [CrossRef]
  55. Masondo, N.A.; Kulkarni, M.G.; Finnie, J.F.; Van Staden, J. Influence of biostimulants-seed-priming on Ceratotheca triloba germination and seedling growth under low temperatures, low osmotic potential and salinity stress. Ecotoxicol. Environ. Saf. 2018, 147, 43–48. [Google Scholar] [CrossRef] [PubMed]
  56. Rolly, N.K.; Imran, Q.M.; Shahid, M.; Imran, M.; Khan, M.; Lee, S.U.; Hussain, A.; Lee, I.J.; Yun, B.W. Drought-induced AtbZIP62 transcription factors regulates drought stress response in Arabidopsis. Plant Physiol. Biochem. 2020, 156, 384–395. [Google Scholar] [CrossRef] [PubMed]
  57. Goatley, M.; Hensler, K.; Askew, S. Cool-season turfgrass germination and morphological development comparisons at adjusted osmotic potentials. Crop Sci. 2017, 57, 201–208. [Google Scholar] [CrossRef]
  58. Mahlanza, T.; Rutherford, R.S.; Snyman, S.J.; Watt, M.P. In vitro generation of somaclonal variant plants of sugarcane for tolerance to Fusarium sacchari. Plant Cell Rep. 2013, 32, 249–262. [Google Scholar] [CrossRef]
  59. Synman, S.J.; Mhlanga, P.; Watt, M.P. Rapid screening of sugarcane plantlets for in vitro mannitol-induced stress. Sugar Tech 2016, 18, 437–440. [Google Scholar] [CrossRef]
  60. Saraswathi, M.S.; Kannan, G.; Uma, S.; Thangavelu, R.; Backiyarani, S. Improvement of banana cv. Rasthali (Silk, AAB) against Fusarium oxysporum f.sp. cubense (VCG 0124/5) through induced mutagenesis: Determination of LD50 specific to mutagen, explants, toxins and in vitro and in vivo screening for Fusarium wilt resistance. Indian J. Exp. Biol. 2016, 54, 345–353. [Google Scholar]
  61. Koch, A.C.; Ramgareed, S.; Rutherford, R.S.; Snyman, S.J.; Watt, M.P. An in vitro mutagenesis protocol for the production of sugarcane tolerant to herbicide imazapyr. Vitr. Cell. Dev. Biol.-Plant 2012, 48, 417–427. [Google Scholar] [CrossRef]
  62. Peel, A.D.; Waldon, B.L.; Jensen, K.B.; Chatterton, N.J.; Horton, H.; Dudley, L.M. Screening for salinity tolerance in alfalfa: A repeatable method. Crop Sci. 2004, 44, 2049–2053. [Google Scholar] [CrossRef]
  63. Liu, F.; Stützel, H. Biomass partitioning, specific leaf area, and water use efficiency of vegetable amaranth (Amaranthus spp.) in response to drought stress. Sci. Hortic. 2004, 102, 15–27. [Google Scholar] [CrossRef]
  64. Veerappa, R.; Slocum, R.D.; Siegenthaler, A.; Wang, J.; Clark, G.; Roux, S.J. Ectopic expression of a pea apyrase enhances root system architecture and drought survival in Arabidopsis and soybean. Plant Cell Environ. 2019, 42, 337–353. [Google Scholar] [CrossRef]
  65. Isayenkov, S.V.; Maathuis, F.J.M. Plant salinity stress: Many unanswered questions remain. Front. Plant Sci. 2019, 10, 80. [Google Scholar] [CrossRef]
  66. Hoang, L.H.; De Guzman, C.C.; Cadiz, N.M.; Tran, D.H. Physiological and phytochemical responses of red amaranth (Amaranthus tricolor L.) and green amaranth (Amaranthus dubius L.) to different salinity levels. Legume Res. 2020, 43, 206–211. [Google Scholar] [CrossRef]
  67. Hossain, M.N.; Sarker, U.; Raihan, M.S.; Al-Huqail, A.A.; Siddiqui, M.H.; Oba, S. Influence of salinity stress on color parameters, leaf pigmentation, polyphenol and flavonoid contents and antioxidant activity of Amaranthus lividus leafy vegetables. Molecules 2022, 27, 1821. [Google Scholar] [CrossRef] [PubMed]
  68. Hwang, S.G.; Chao, H.C.; Lin, H.L. Differential responses of Pak Choi and edible amaranth to elevated temperature. HortScience 2018, 53, 195–199. [Google Scholar] [CrossRef]
  69. Tripathi, A.K.; Gautam, M. Biochemical parameters of plants as indicators of air pollution. J. Environ. Biol. 2007, 28, 127–132. [Google Scholar] [PubMed]
  70. Areington, C.A.; Varghese, B.; Ramdhani, S.; Sershen. An assessment of morphological, physiological and biochemical biomarkers of industrial air pollution in the leaves of Brachylaena discolor. Water Air Soil Pollut. 2015, 226, 291. [Google Scholar] [CrossRef]
  71. Areington, C.A.; Varghese, B. The utility of biochemical, physiological and morphological biomarkers of leaf sulfate levels in establishing Brachylaena discolor leaves as bioindicator of SO2 pollution. Plant Physiol. Biochem. 2017, 118, 295–305. [Google Scholar] [CrossRef]
  72. Bahrami, F.; Arzani, A.; Rahimmalek, M. Photosynthetic yield performance of wild barley (Hordeum vulgare ssp. spontaneum) under terminal heat stress. Photosynthetica 2019, 57, 9–17. [Google Scholar] [CrossRef]
  73. Hamilton, E.W., III; Heckathorn, S.A.; Joshi, P.; Wang, D.; Barua, D. Interactive effects of elevated CO2 and growth temperatures on the tolerance of photosynthesis to acute heat stress in C3 and C4 species. J. Integr. Plant Biol. 2008, 50, 1375–1387. [Google Scholar] [CrossRef] [PubMed]
  74. Liu, H.; Fu, Y.; Hu, D.; Yu, J. Effect of green, yellow and purple radiation on biomass, photosynthesis, morphology and soluble sugar content of leafy lettuce via spectral wavebands “knock out”. Sci. Hortic. 2018, 236, 10–17. [Google Scholar] [CrossRef]
  75. Zhou, Q.; Wang, Y.; Zhao, X.; Han, L.N.; Yang, S.J.; Li, W.F.; Mao, J.; Ma, Z.H.; Chen, B.H. Effects of CO2 on transplantation of grape plantlets cultured in vitro by promoting photosynthesis. Sci. Hortic. 2021, 287, 110286. [Google Scholar] [CrossRef]
  76. Smethurst, C.F.; Shabala, S. Screening methods for waterlogging tolerance in lucerne: Comparative analysis of waterlogging effects on chlorophyll fluorescence, photosynthesis, biomass and chlorophyll content. Funct. Plant Biol. 2003, 30, 335–343. [Google Scholar] [CrossRef] [PubMed]
  77. Olorunwa, O.; Adhikari, B.; Shi, A.; Barickman, T.C. Screening of cowpea (Vigna unguiculata (L.) Walp.) genotypes for waterlogging tolerance using morpho-physiological traits at early growth stage. Plant Sci. 2022, 315, 111136. [Google Scholar] [CrossRef]
  78. Valladares, F.; Sanchez-Gomez, D.; Zavala, M.A. Quantitative estimation of phenotypic plasticity: Bridging the gap between the evolutionary concept and its ecological applications. J. Ecol. 2006, 94, 1103–1116. [Google Scholar] [CrossRef]
Figure 1. Drought (A), salinity (B), and heat (C) stress dose–response curves for A. dubius seeds based on percentage seed germination and seedling emergence. Values represent mean ± SD (n = 40). Points labelled with different letters indicate significant differences amongst the concentrations (p < 0.05, ANOVA), whilst ‘*’ represents significant differences between germination and seedling emergence at each concentration/temperature (p < 0.05, t-Test).
Ijpb 15 00063 g001
Figure 2. Drought (A), salinity (B), and heat (C) stress dose-response curves for G. parviflora seeds based on percentage seed germination and seedling emergence. Values represent mean ± SD (n = 40). Points labelled with different letters indicate significant differences amongst the concentrations (p < 0.05, ANOVA), whilst ‘*’ represents significant differences between germination and seedling emergence at each concentration/temperature (p < 0.05, t-Test).
Ijpb 15 00063 g002
Table 1. Leaf area, root length, shoot length, chlorophyll content, fresh mass, dry mass, and number of leaves of A. dubius seedlings that showed tolerance to the LD/T50 concentrations/temperatures of drought, salinity, and heat stress in vitro after 21 days. Values represent mean ± SD (n = 40). Values labelled with different letters indicate significant differences amongst the control and stressors (p < 0.05, ANOVA).
StressorLeaf Area (cm2)Root Length (cm)Shoot Length (cm)Chlorophyll Content (SPAD Units)Fresh Mass (g)Dry Mass (g)Number of Leaves
Control0.56 ± 0.29 a3.67 ± 0.84 b1.65 ± 0.51 b12.28 ± 2.98 b0.0619 ± 0.0371 a0.0022 ± 0.0013 a5.83 ± 0.68 a
Drought
(255.43 mM)
0.03 ± 0.01 c0.79 ± 0.26 c0.40 ± 0.08 c2.31 ± 0.67 c0.0051 ± 0.0013 c0.0004 ± 0.0002 b2.00 ± 0.00 c
Salinity
(148.65 mM)
0.07 ± 0.03 b0.47 ± 0.27 c0.59 ± 0.25 c2.26 ± 1.53 c0.0067 ± 0.0030 b0.0004 ± 0.0002 b2.00 ± 0.00 c
Heat
(41.11/30.11 °C)
0.65 ± 0.15 a6.14 ± 1.59 a4.17 ± 0.30 a19.70 ± 3.37 a0.0797 ± 0.0274 a0.0029 ± 0.0007 a4.63 ± 0.49 b
Table 2. Leaf area, root length, shoot length, chlorophyll content, fresh mass, dry mass, and number of leaves of G. parviflora seedlings that showed tolerance to the LD/T50 concentrations/temperatures of drought, salinity, and heat stress in vitro after 21 days. Values represent mean ± SD (n = 40). Values labelled with different letters indicate significant differences amongst the control and stressors (p < 0.05, ANOVA).
StressorLeaf Area (cm2)Root Length (cm)Shoot Length (cm)Chlorophyll Content (SPAD Units)Fresh Mass (g)Dry Mass (g)Number of Leaves
Control0.49 ± 0.40 a3.28 ± 1.47 a0.36 ± 0.24 c17.23 ± 9.29 a0.0769 ± 0.0513 a0.0026 ± 0.0015 a6.25 ± 1.56 a
Drought
(239.91 mM)
0.04 ± 0.02 b1.54 ± 0.64 bc0.43 ± 0.08 b4.90 ± 3.64 b0.0075 ± 0.0073 b0.0006 ± 0.0006 b2.38 ± 0.77 b
Salinity
(102.40 mM)
0.06 ± 0.04 b1.17 ± 0.87 c0.31 ± 0.12 c5.51 ± 3.84 b0.0071 ± 0.0064 b0.0006 ± 0.0006 b2.63 ± 1.33 b
Heat
(34.91/23.91 °C)
0.06 ± 0.03 b1.64 ± 0.62 b0.91 ± 0.17 a2.90 ± 0.92 b0.0077 ± 0.0038 b0.0002 ± 0.0001 c2.50 ± 0.85 b
Table 3. Phenotypic plasticity indices of each of the seven traits measured in A. dubius seedlings that showed tolerance to the LD/T50 concentrations/temperatures of drought, salinity, and heat stress after 14 days. Mean phenotypic plasticity (MPI) was calculated by averaging the indices within each stress and by averaging each trait indices across each stress (n = 40).
StressorLeaf
Area
Root
Length
Shoot LengthChlorophyll ContentFresh
Mass
Dry
Mass
Number of LeavesMPI
Control0.910.580.600.630.940.920.290.70 ± 0.24
Drought
(255.43 mM)
0.550.710.460.710.620.860.000.56 ± 0.28
Salinity
(148.65 mM)
0.900.920.840.950.830.880.000.76 ± 0.34
Heat
(41.11/30.11 °C)
0.550.660.220.450.690.980.200.54 ± 0.28
MPI0.73 ± 0.210.72 ± 0.150.53 ± 0.260.69 ± 0.210.77 ± 0.140.91 ± 0.050.12 ± 0.15
Table 4. Phenotypic plasticity indices of each of the seven traits measured in G. parviflora seedlings that showed tolerance to the LD/T50 concentrations/temperatures of drought, salinity, and heat stress after 14 days. Mean phenotypic plasticity (MPI) was calculated by averaging the indices within each stress and by averaging each trait indices across each stress (n = 40).
StressorLeaf
Area
Root
Length
Shoot LengthChlorophyll ContentFresh
Mass
Dry
Mass
Number of LeavesMPI
Control0.940.810.900.930.970.980.500.86 ± 0.17
Drought
(239.41 mM)
0.830.810.500.970.950.950.500.79 ± 0.21
Salinity
(102.40 mM)
0.970.970.830.970.720.960.830.89 ± 0.10
Heat
(34.91/23.91 °C)
0.910.760.500.670.900.750.500.71 ± 0.17
MPI0.91 ± 0.060.84 ± 0.090.68 ± 0.210.89 ± 0.140.89 ± 0.110.91 ± 0.110.58 ± 0.17
Disclaimer/Publisher’s Note: The statements, opinions and data contained in all publications are solely those of the individual author(s) and contributor(s) and not of MDPI and/or the editor(s). MDPI and/or the editor(s) disclaim responsibility for any injury to people or property resulting from any ideas, methods, instructions or products referred to in the content.

