

Naphthenic Acid Fraction Components-Induced Metabolic and Mitochondrial Alterations in Rat Hepatoma Cells: Monitoring Metabolic Reprogramming with Tryptophan–Kynurenine Ratio

 , ,
, ,  , , and
Abstract
:1. Introduction
2. Materials and Methods
2.1. Preparation and Storage of NAFCs
2.2. Cell Culture Maintenance and Treatment
2.3. qPCR
2.4. Metabolic Function
2.5. Mitochondrial Function
2.6. Apoptosis
2.7. Amino Acid Metabolism
2.8. Statistical Analysis
3. Results
3.1. Exposure to 14.7 and 73.4 mg/L NAFCs Induces Significant Metabolic Shifts in McA-RH7777 Cells
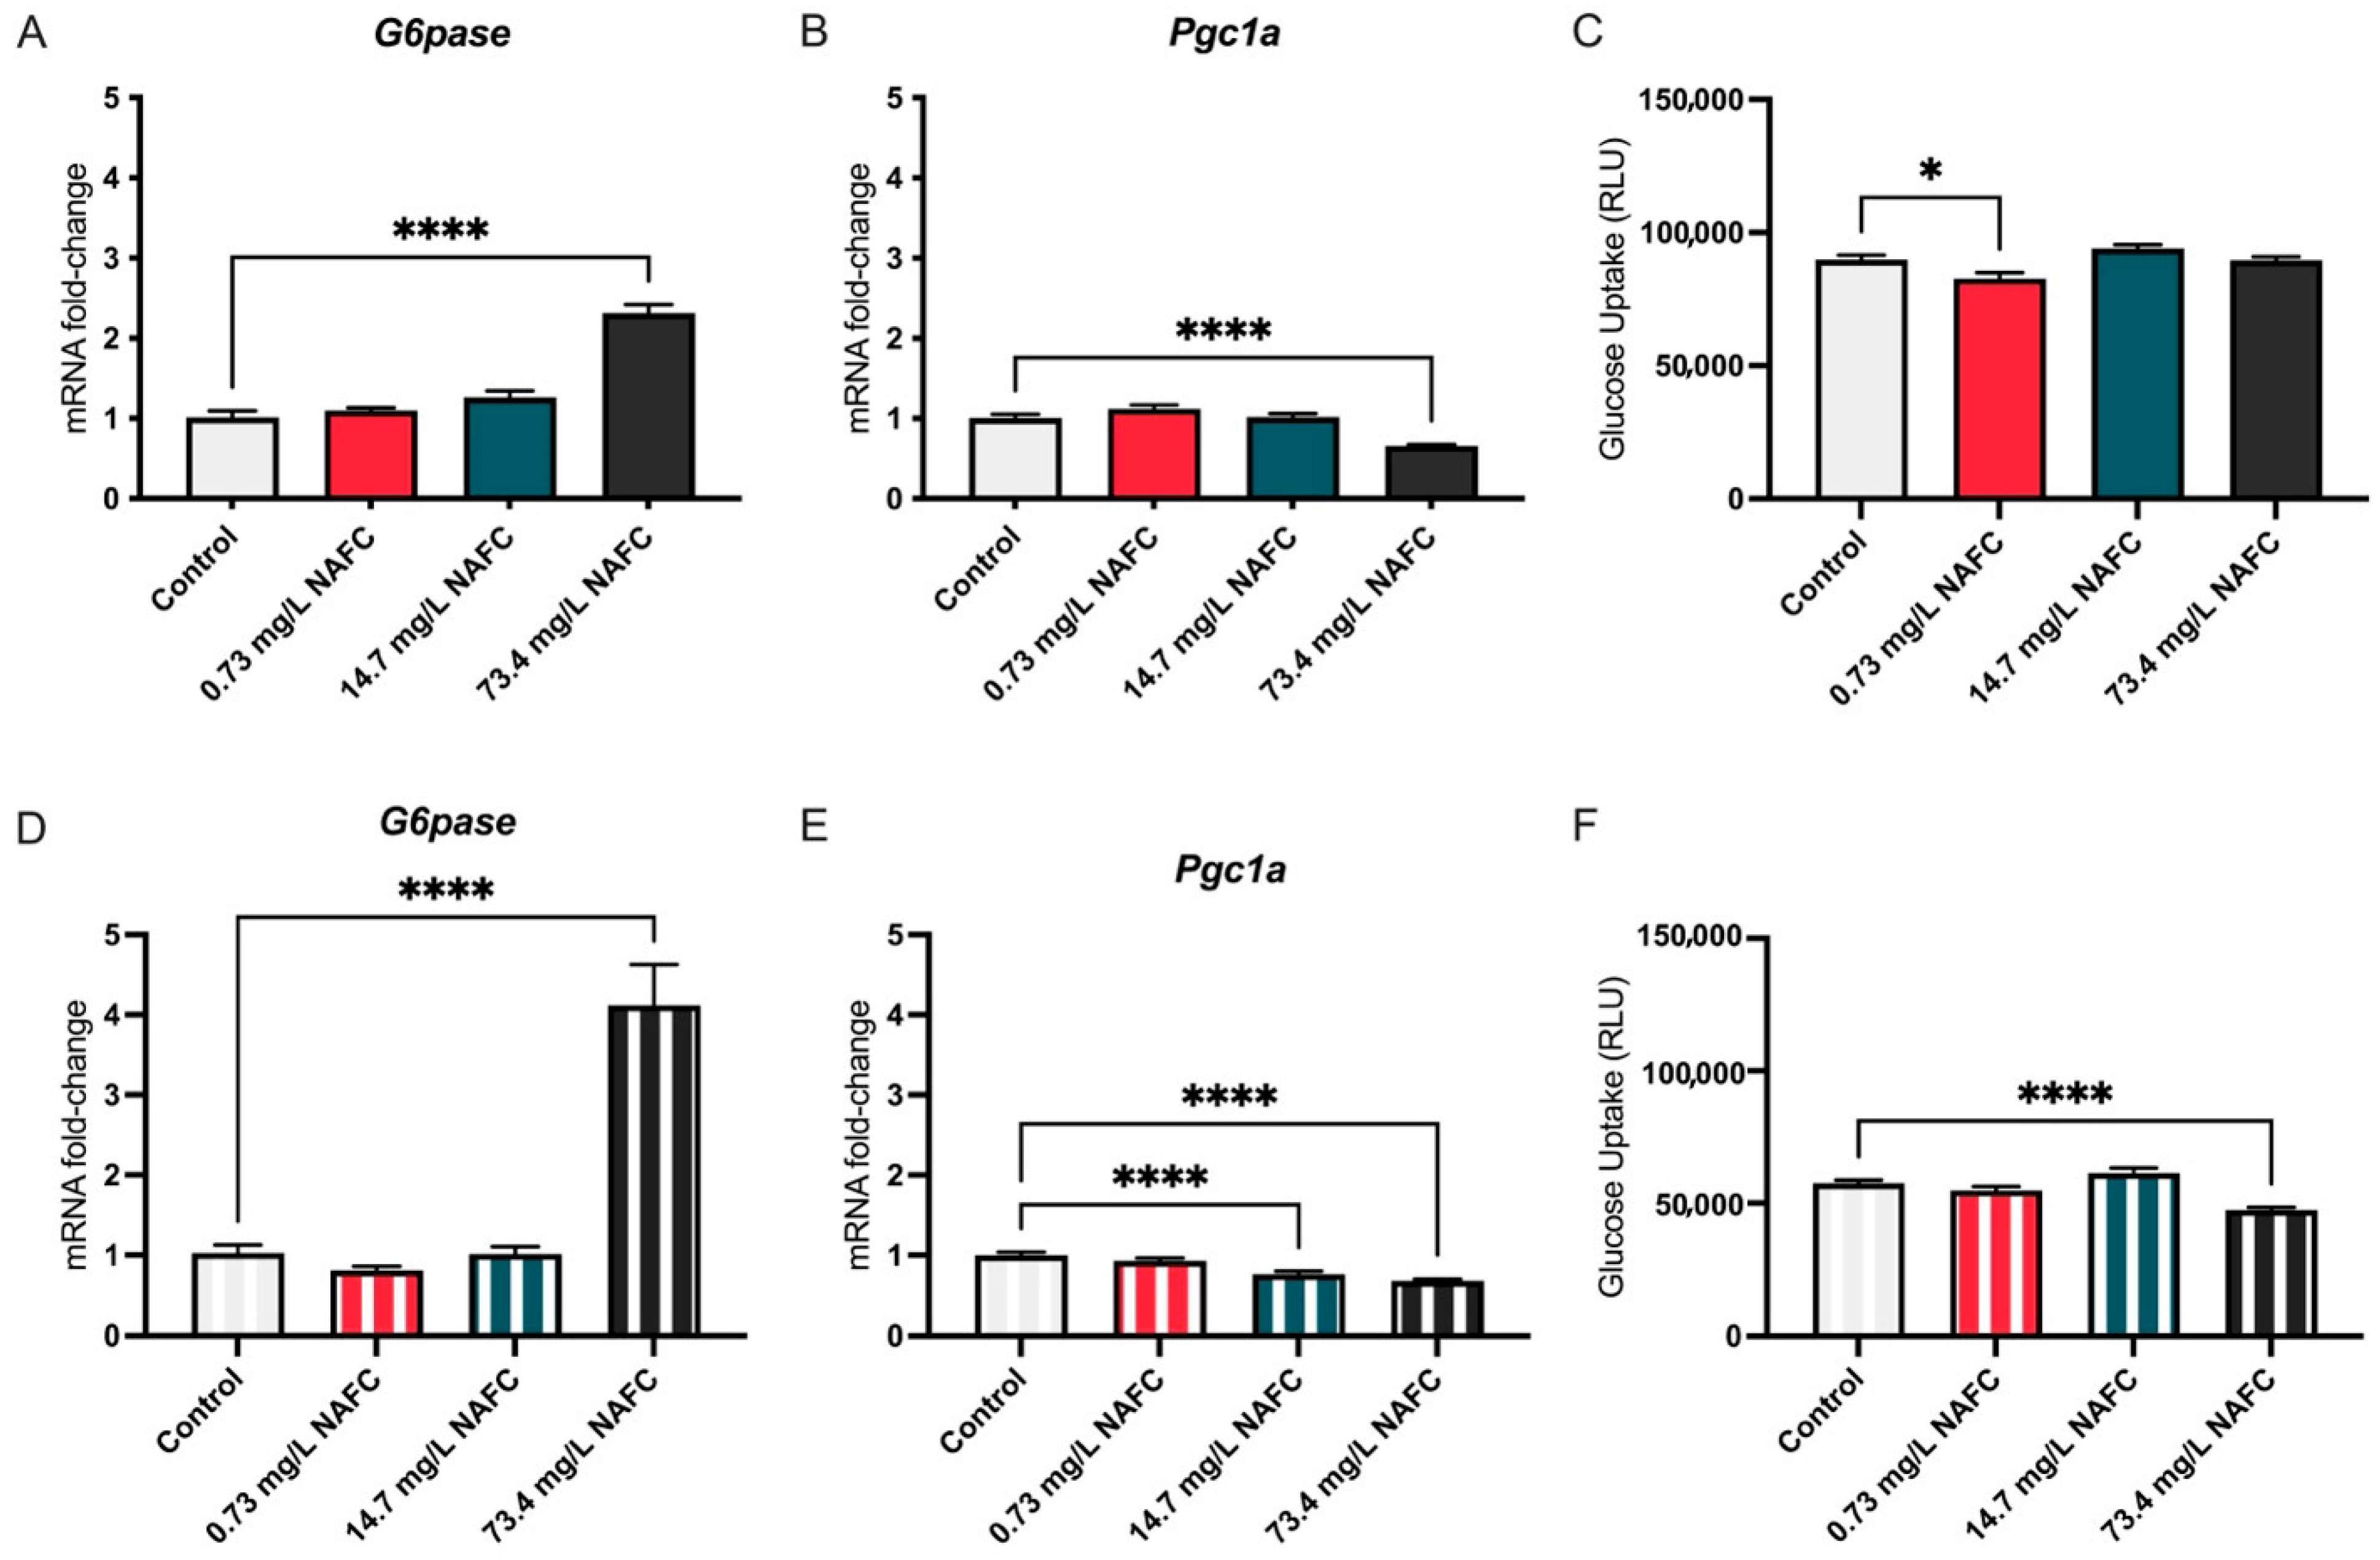
3.1.1. Glucose
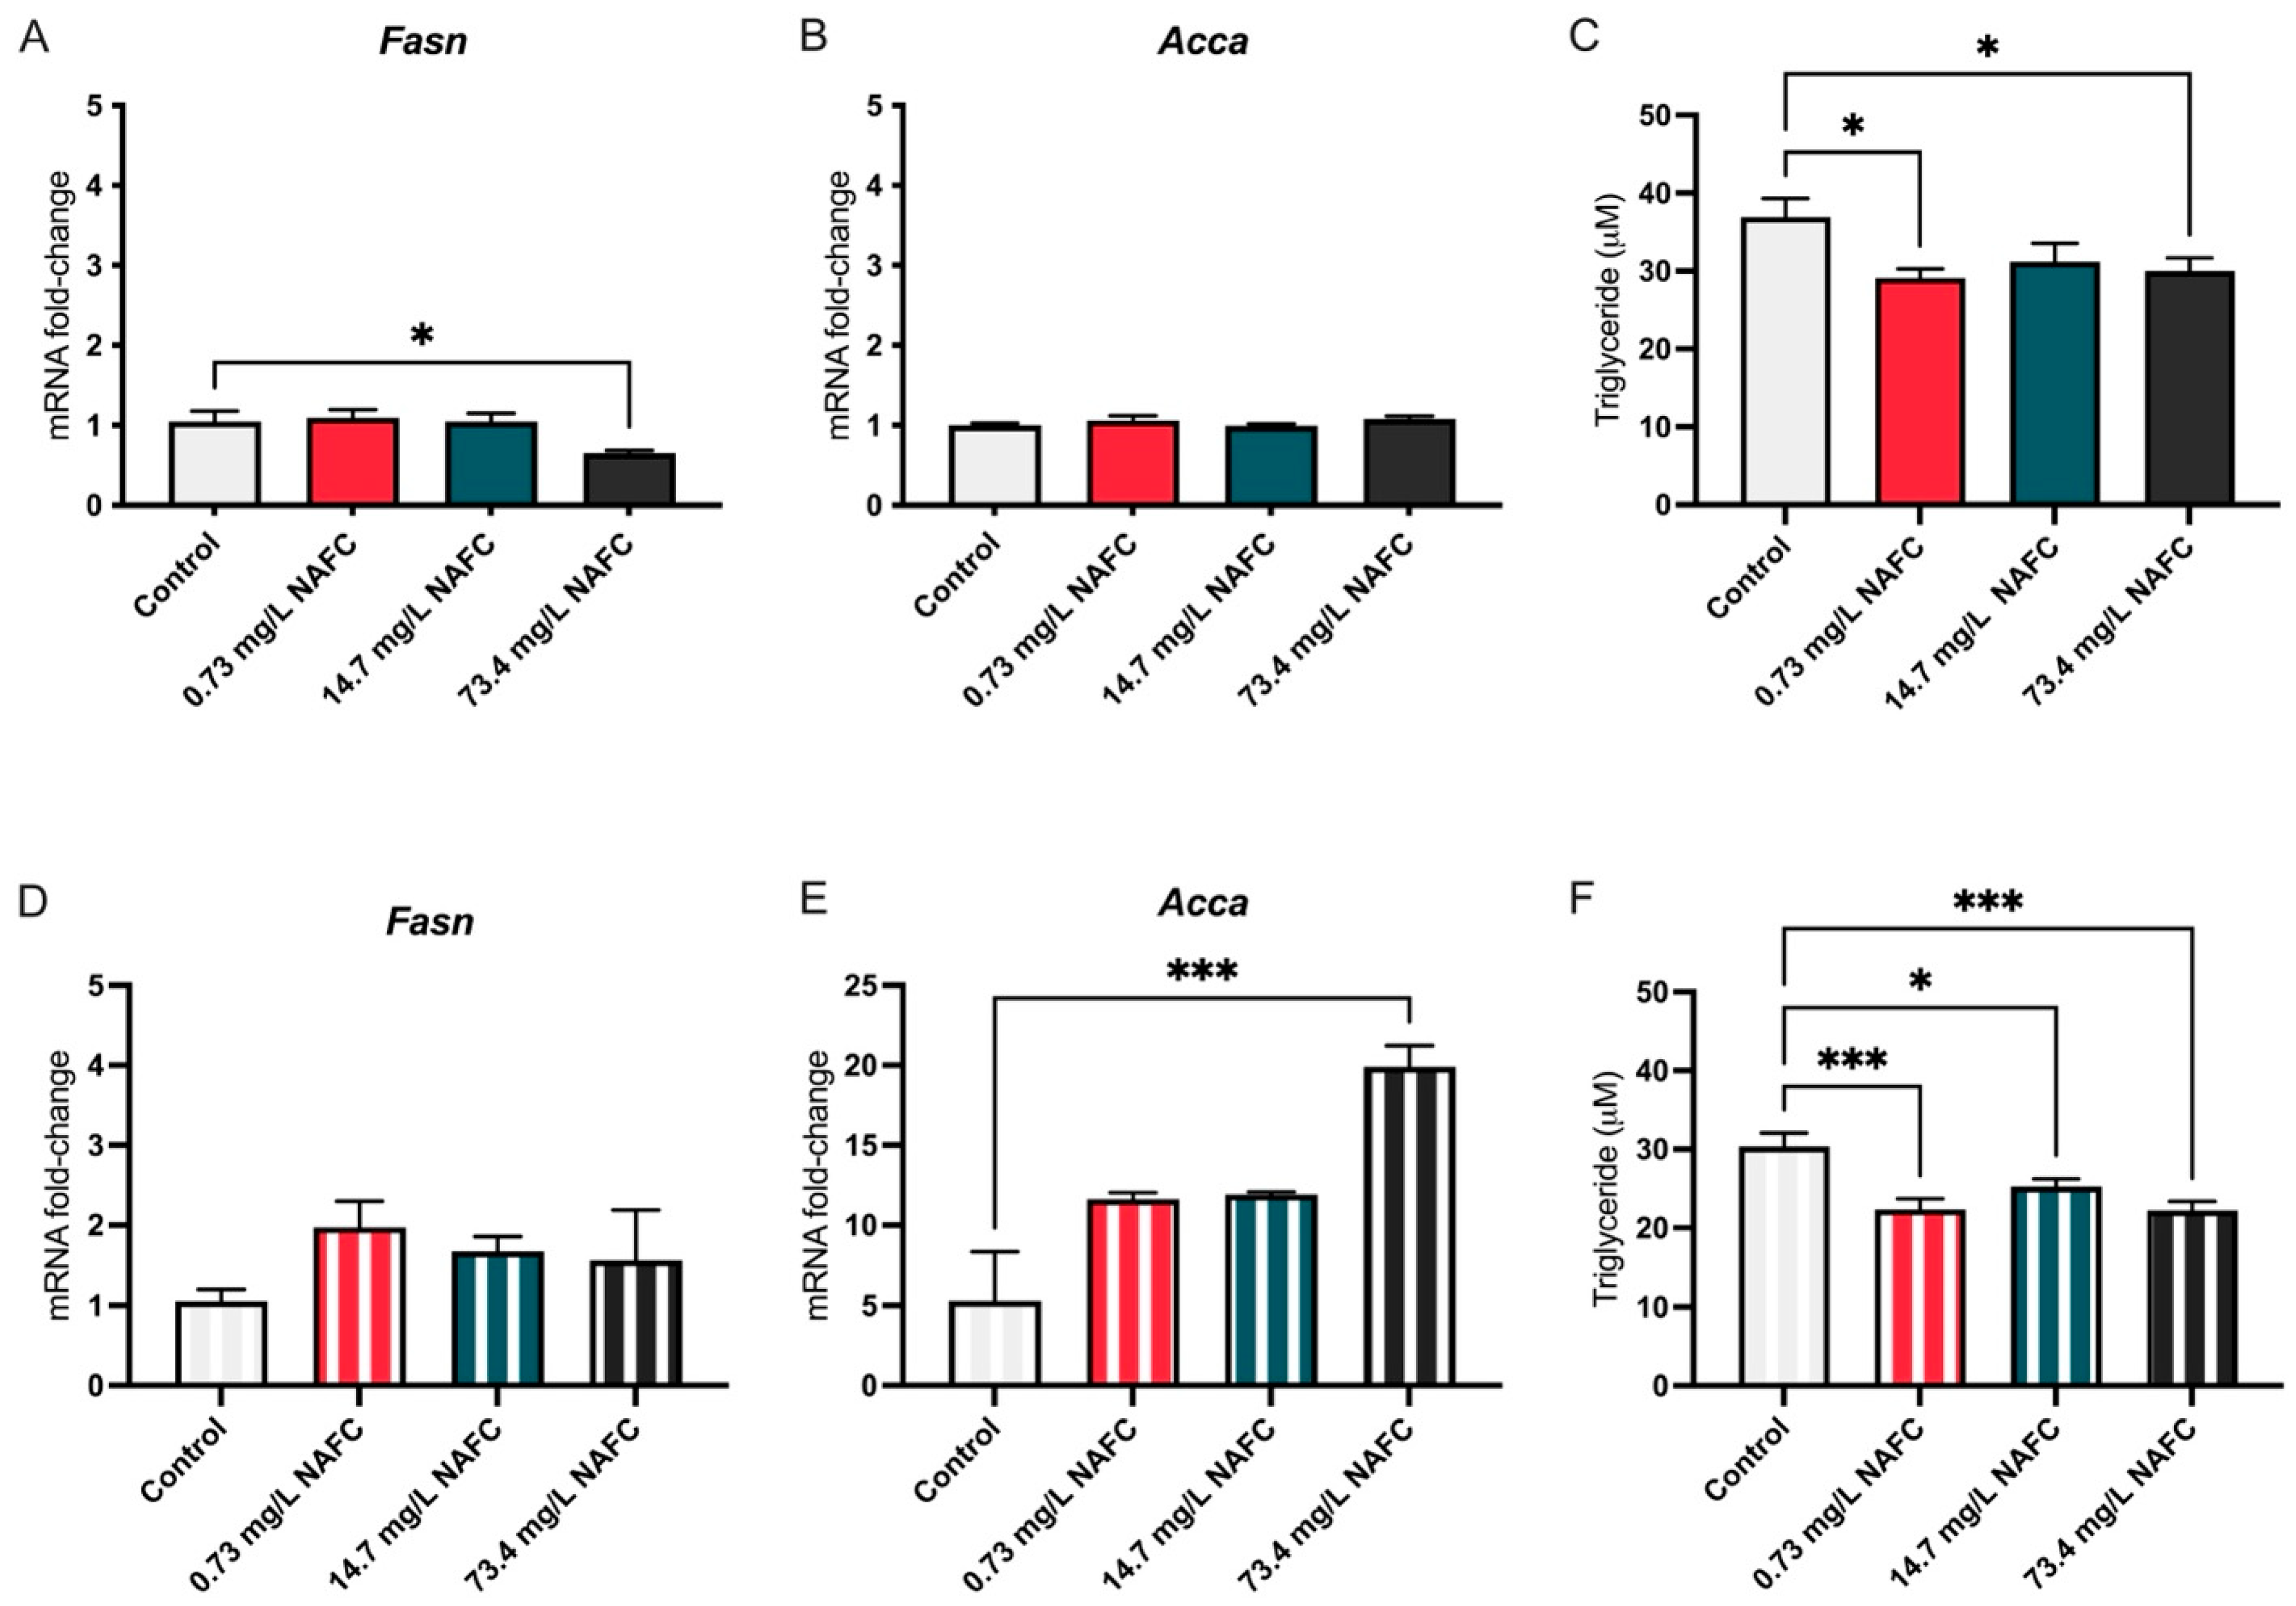
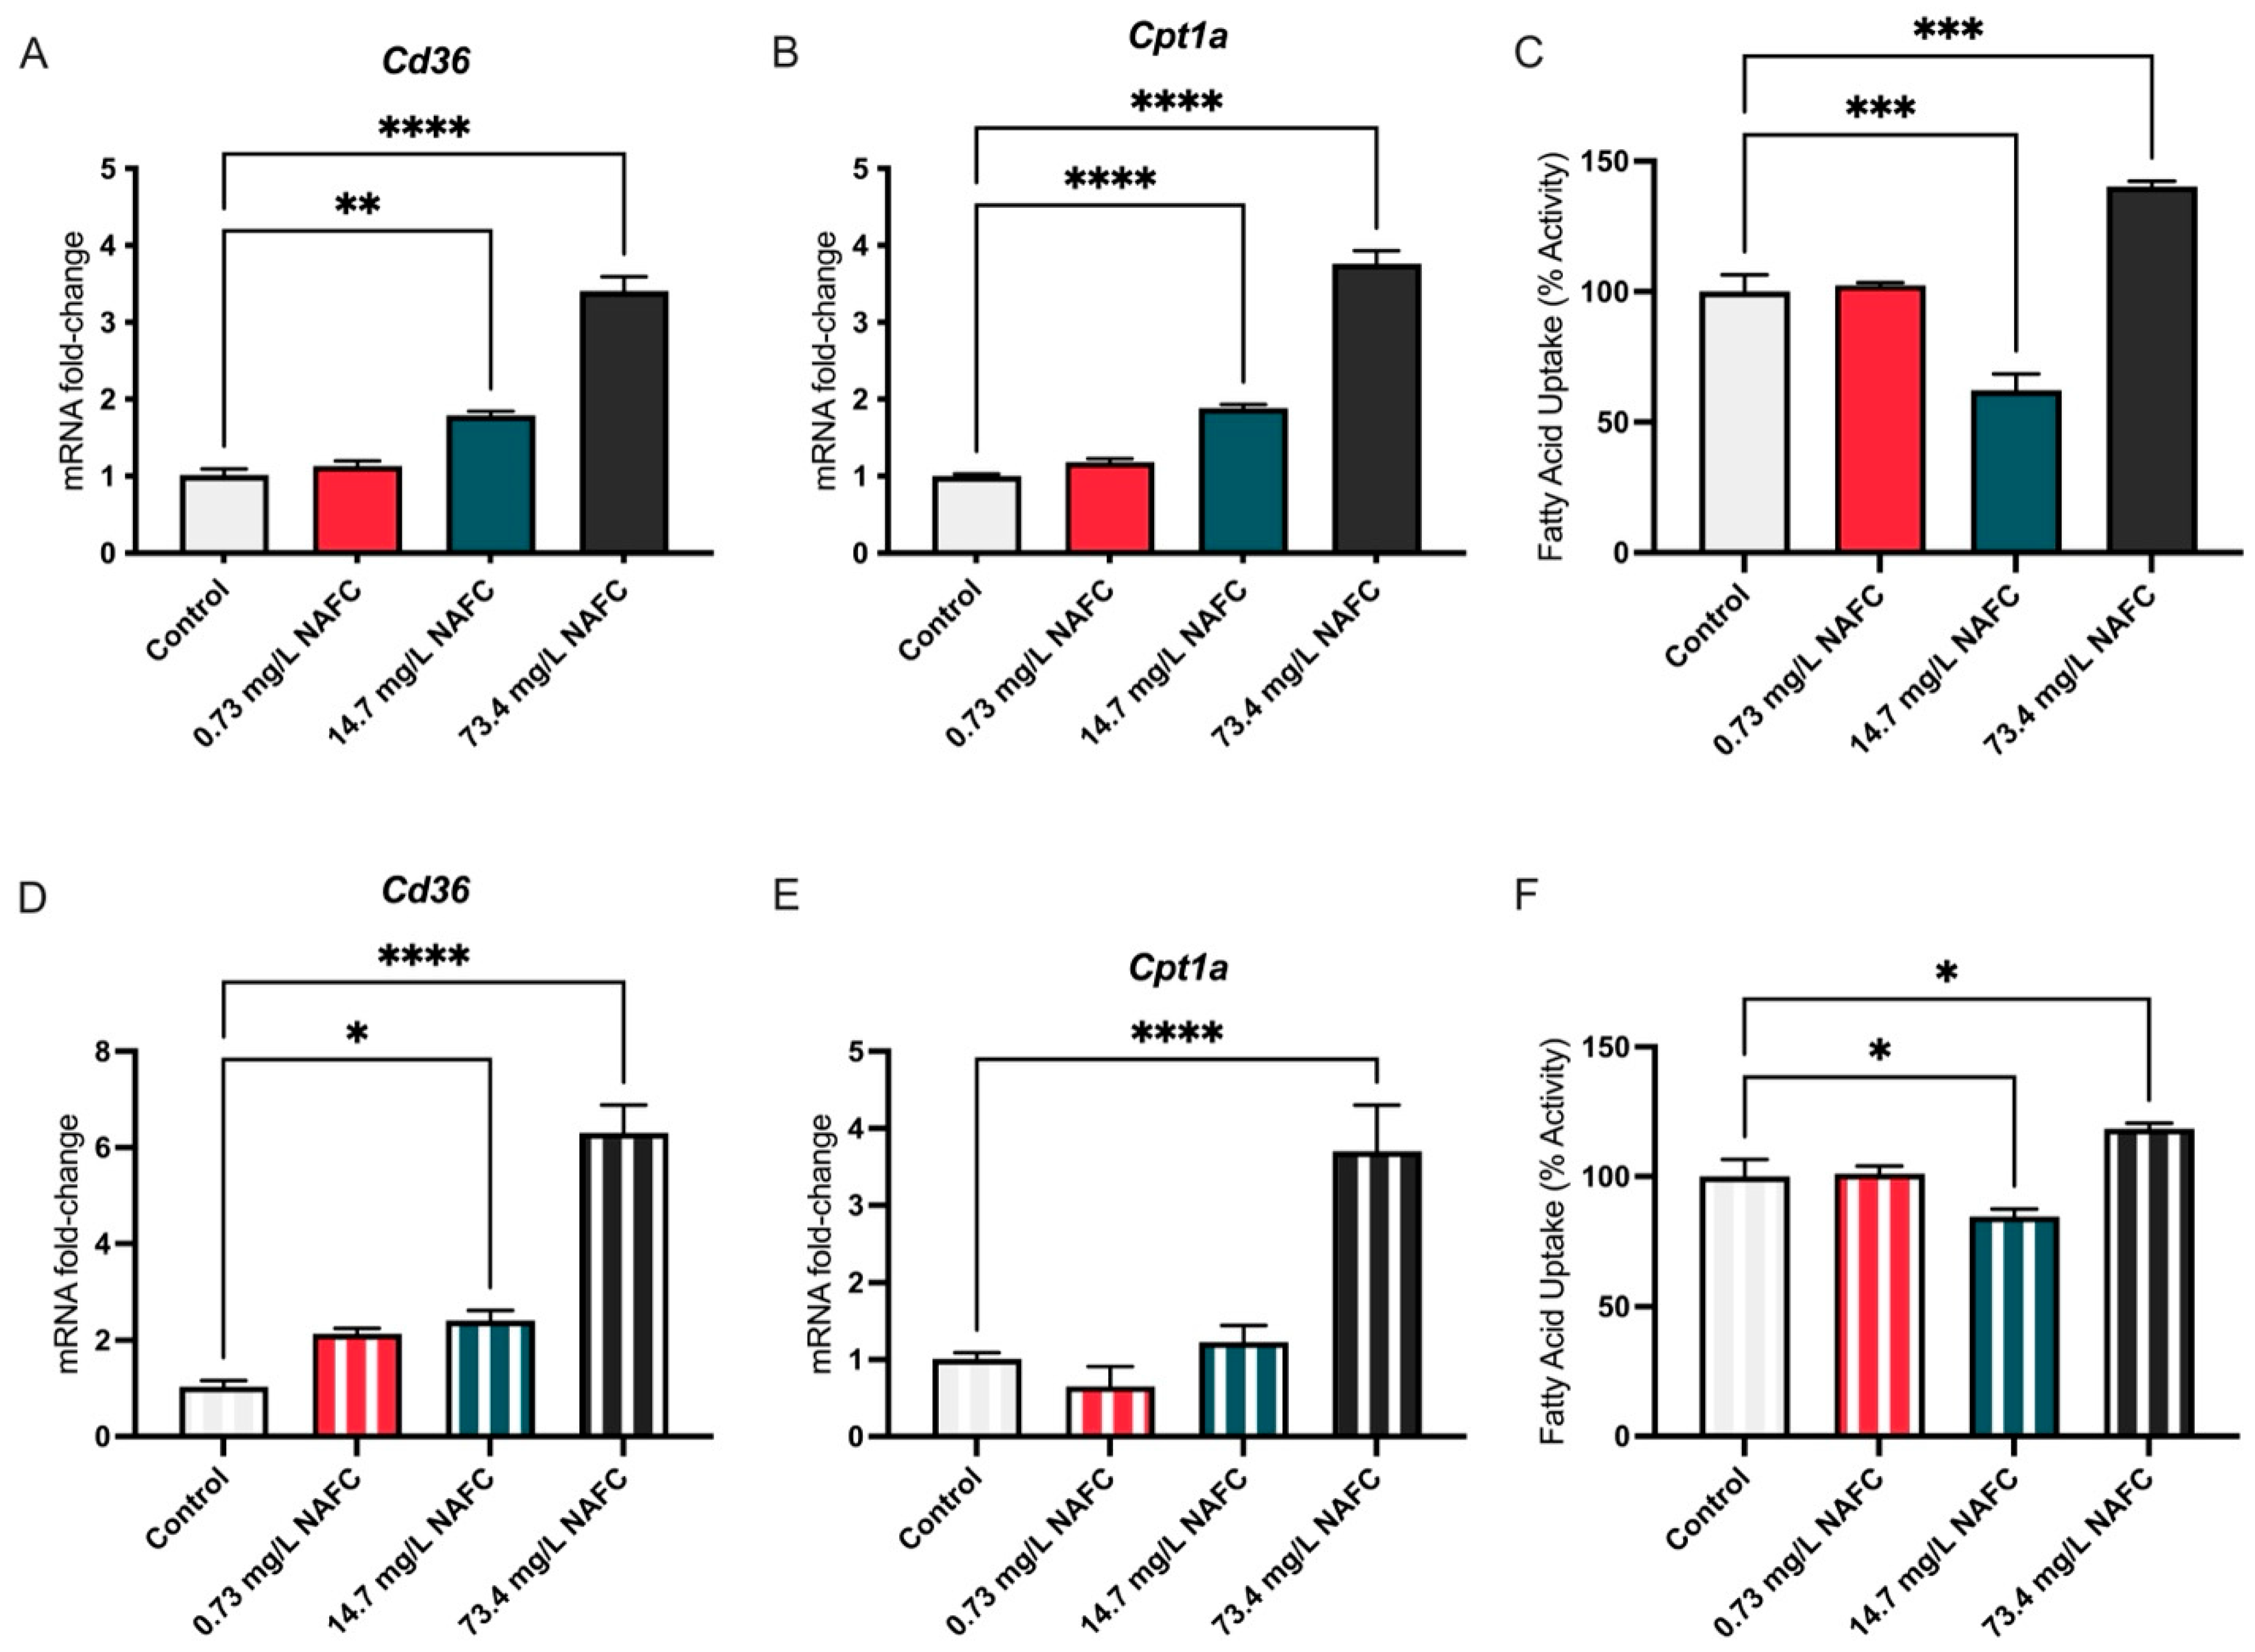
3.1.2. Lipids
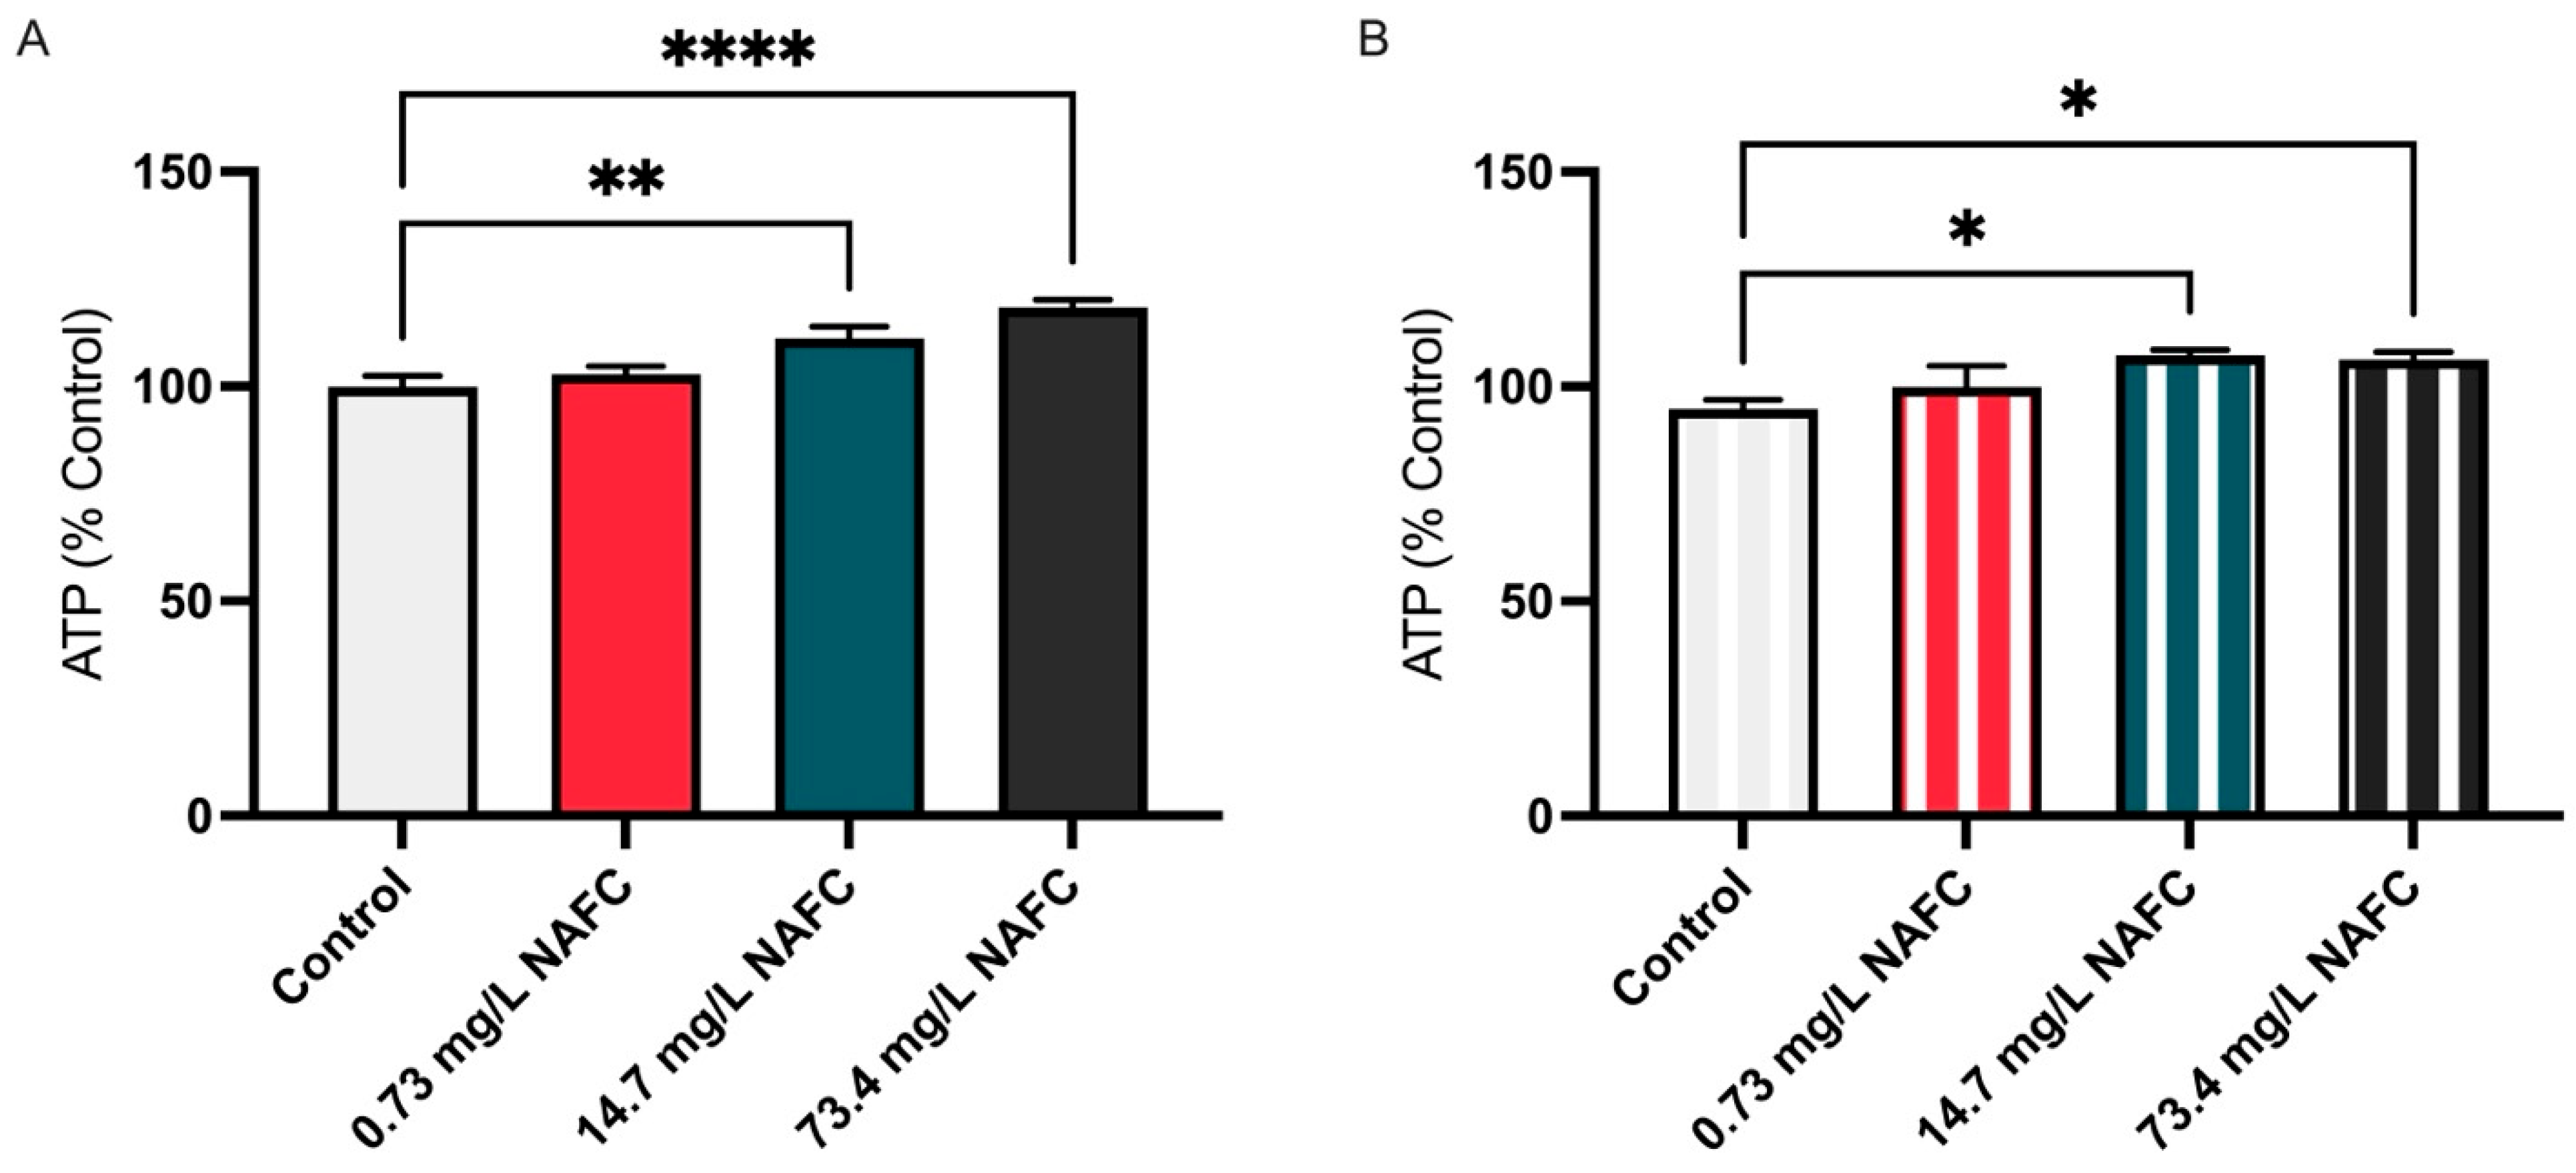
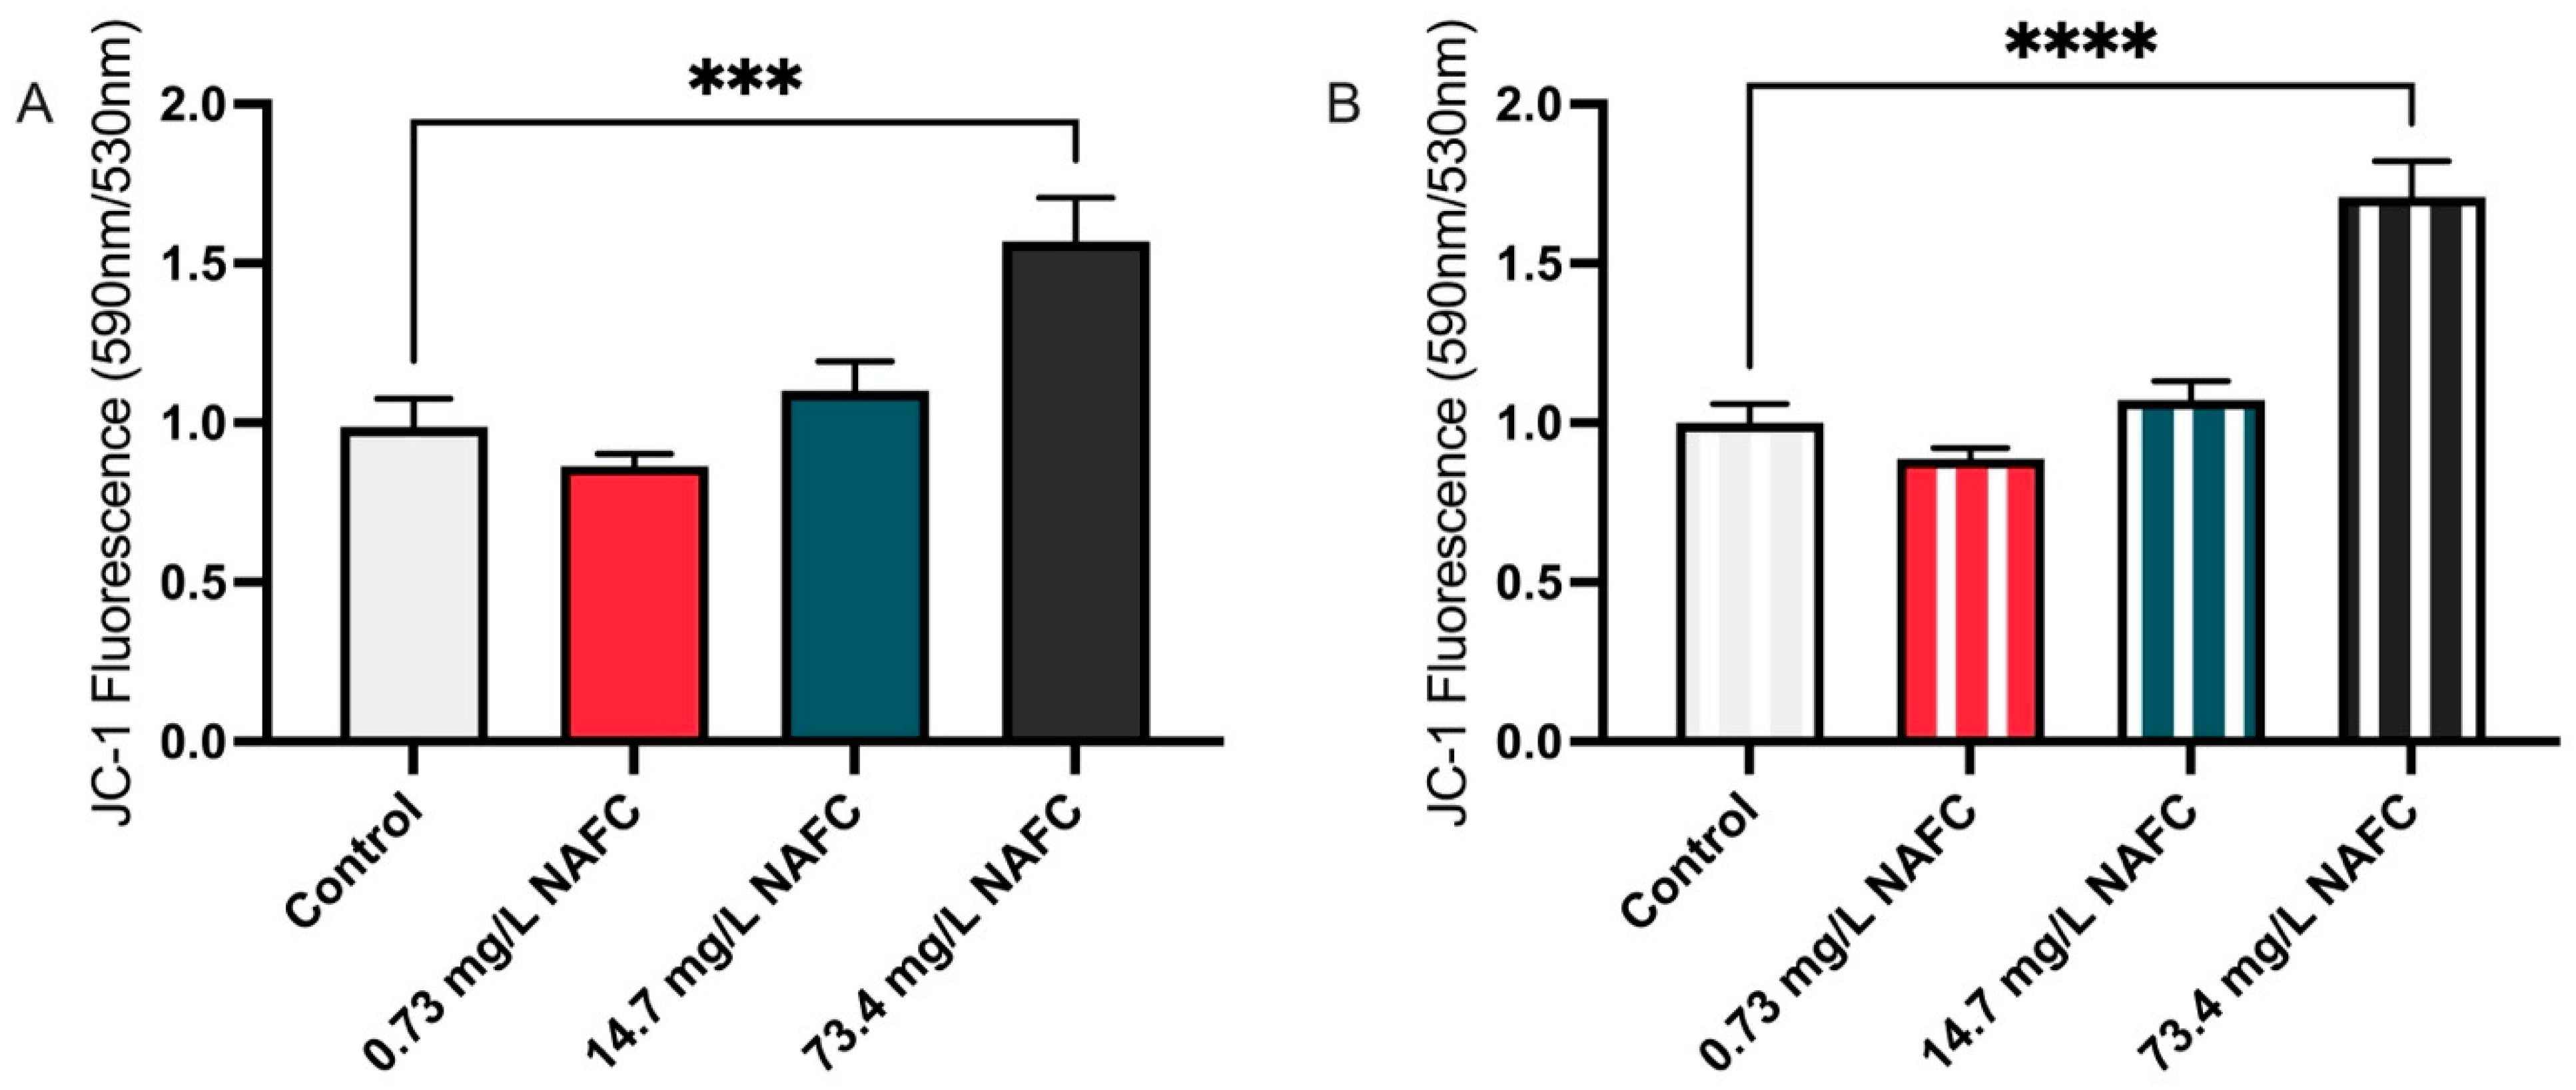
3.2. Metabolic Shifts in NAFC-Exposed McA-RH7777 Cells Suggest Alterations in Mitochondrial Function
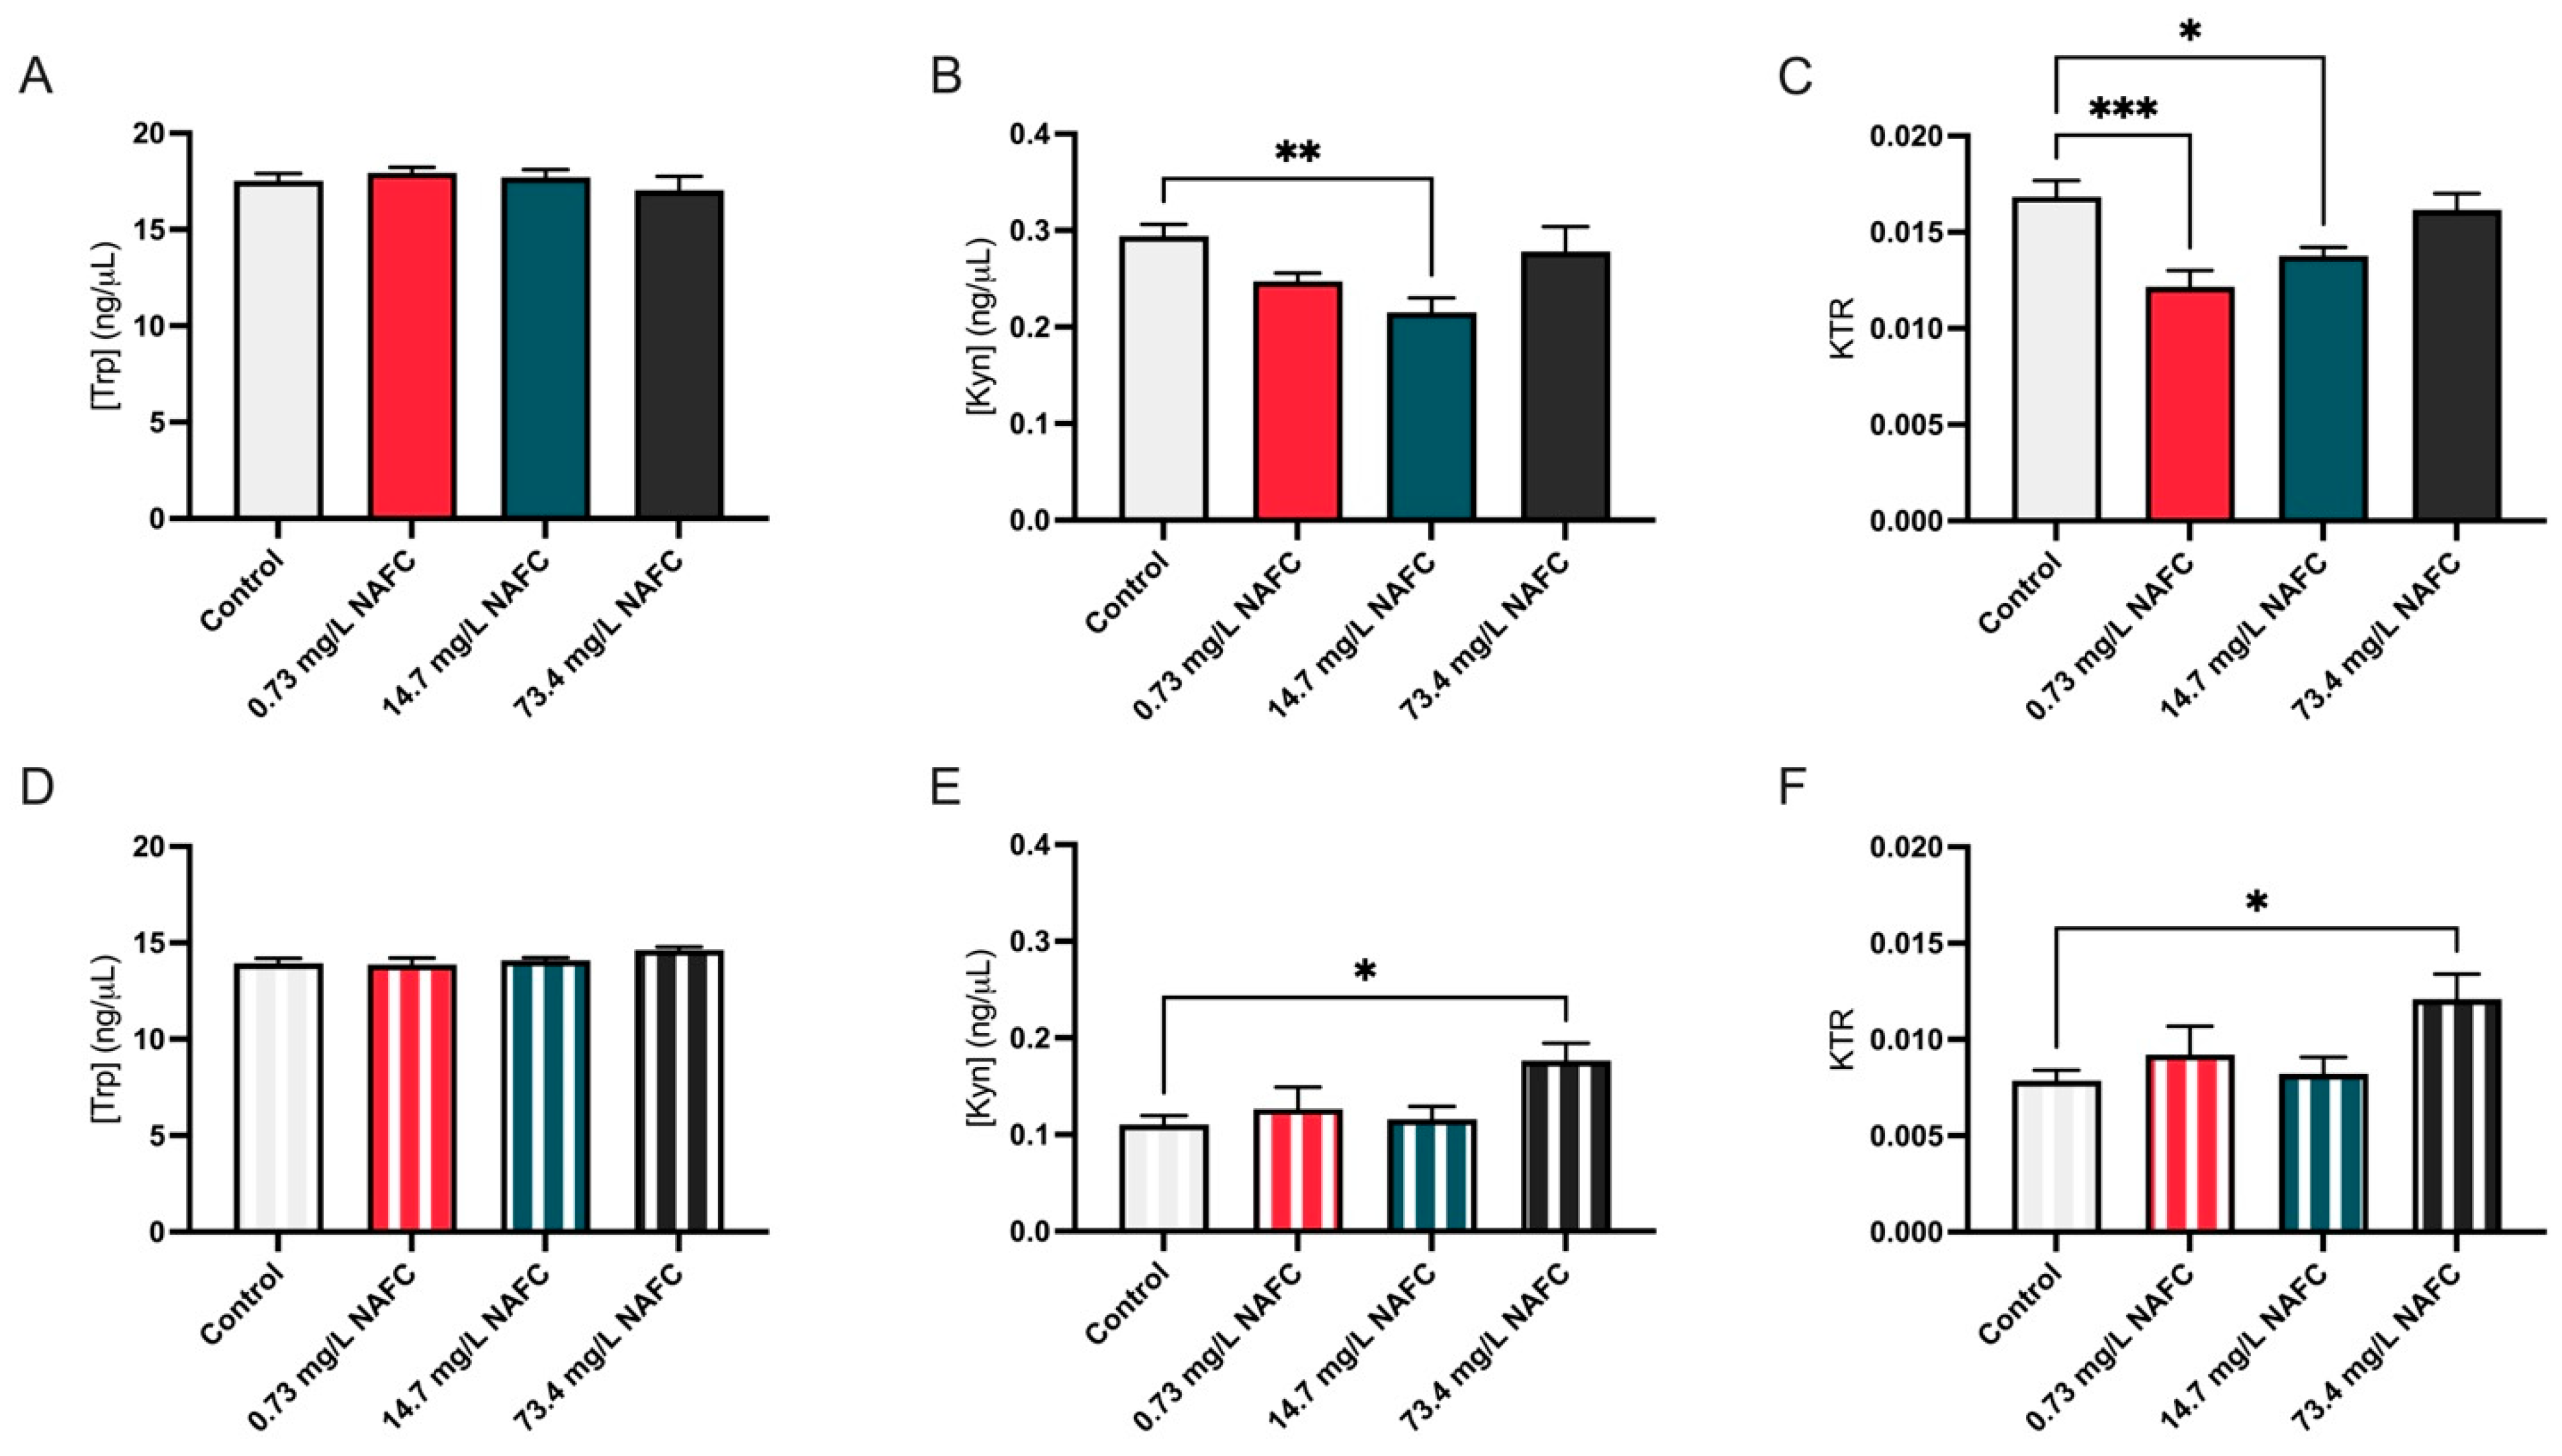
3.3. The Kynurenine–Tryptophan Ratio Was Altered in Association with Changes in Substrate Utilization and Metabolic Alterations in McA-RH7777 Cells Following Exposure to 73.4 mg/L NAFCs
4. Discussion
4.1. Metabolic Substrate Utilization in Response to NAFC Exposure
4.2. Mitochondrial Dysfunction as a ‘Switch’ for NAFC-Induced Metabolic Reprogramming
4.3. Kynurenine–Tryptophan Ratio as a Marker of Metabolic Reprogramming
5. Conclusions
Author Contributions
Funding
Institutional Review Board Statement
Informed Consent Statement
Data Availability Statement
Acknowledgments
Conflicts of Interest
Abbreviations
| AOSR | Alberta Oil Sands Region |
| OSPW | Oil sands process-affected water |
| NAFC | Naphthenic acid fraction component |
| NA | Naphthenic acid |
| ATP | Adenosine triphosphate |
| TUNEL | Terminal deoxynucleotidyl transferase dUTP nick-end labeling |
| KTR | Kynurenine–tryptophan ratio |
| TRP-KYN | Tryptophan–kynurenine |
| PAC | Polycyclic aromatic compound |
| PAH | Polycyclic aromatic hydrocarbon |
| AhR | Aryl hydrocarbon receptor |
| GR | Glucocorticoid receptor |
| TRP | L-tryptophan |
| KYN | L-kynurenine |
| ΔΨm | Mitochondrial membrane potential |
| KYNU | Kynureninase |
| PPAR | Peroxisome proliferator-activated receptor |
| AOP | Adverse outcome pathway |
References
- Ahad, J.M.E.; Pakdel, H.; Gammon, P.R.; Mayer, B.; Savard, M.M.; Peru, K.M.; Headley, J.V. Distinguishing Natural from Anthropogenic Sources of Acid Extractable Organics in Groundwater near Oil Sands Tailings Ponds. Environ. Sci. Technol. 2020, 54, 2790–2799. [Google Scholar] [CrossRef]
- Li, C.; Fu, L.; Stafford, J.; Belosevic, M.; Gamal El-Din, M. The Toxicity of Oil Sands Process-Affected Water (OSPW): A Critical Review. Sci. Total Environ. 2017, 601–602, 1785–1802. [Google Scholar] [CrossRef]
- Frank, R.A.; Roy, J.W.; Bickerton, G.; Rowland, S.J.; Headley, J.V.; Scarlett, A.G.; West, C.E.; Peru, K.M.; Parrott, J.L.; Conly, F.M.; et al. Profiling Oil Sands Mixtures from Industrial Developments and Natural Groundwaters for Source Identification. Environ. Sci. Technol. 2014, 48, 2660–2670. [Google Scholar] [CrossRef] [PubMed]
- Robinson, C.E.; Elvidge, C.K.; Frank, R.A.; Headley, J.V.; Hewitt, L.M.; Little, A.G.; Robinson, S.A.; Trudeau, V.L.; Vander Meulen, I.J.; Orihel, D.M. Naphthenic Acid Fraction Compounds Reduce the Reproductive Success of Wood Frogs (Rana Sylvatica) by Affecting Offspring Viability. Environ. Pollut. 2023, 316, 120455. [Google Scholar] [CrossRef]
- Allen, E.W. Process Water Treatment in Canada’s Oil Sands Industry: I. Target Pollutants and Treatment Objectives. J. Environ. Eng. Sci. 2008, 7, 123–138. [Google Scholar] [CrossRef]
- Alberta Energy Regulator. Kearl Order: Imperial Oil Resources Limited. 2023. Available online: https://www1.aer.ca/compliancedashboard/enforcement/202302-02_Imperial%20Oil%20Resources%20Limited_Kearl_Order.pdf (accessed on 16 April 2025).
- Parks Canada. Peace-Athabasca Delta. Parks Canada. Available online: https://parks.canada.ca/pn-np/nt/woodbuffalo/nature/delta (accessed on 16 April 2025).
- Westman, C.N.; Joly, T.L. Oil Sands Extraction in Alberta, Canada: A Review of Impacts and Processes Concerning Indigenous Peoples. Hum. Ecol. 2019, 47, 233–243. [Google Scholar] [CrossRef]
- Barrow, K.; Escher, B.I.; Hicks, K.A.; König, M.; Schlichting, R.; Arlos, M.J. Water Quality Monitoring with in Vitro Bioassays to Compare Untreated Oil Sands Process-Affected Water with Unimpacted Rivers. Environ. Sci. Water Res. Technol. 2023, 9, 2008–2020. [Google Scholar] [CrossRef]
- Headley, J.V.; Peru, K.M.; Barrow, M.P. Mass Spectrometric Characterization of Naphthenic Acids in Environmental Samples: A Review. Mass Spectrom. Rev. 2009, 28, 121–134. [Google Scholar] [CrossRef] [PubMed]
- Frank, R.A.; Kavanagh, R.; Burnison, B.K.; Headley, J.V.; Peru, K.M.; Der Kraak, G.V.; Solomon, K.R. Diethylaminoethyl-Cellulose Clean-up of a Large Volume Naphthenic Acid Extract. Chemosphere 2006, 64, 1346–1352. [Google Scholar] [CrossRef]
- Hughes, S.A.; Mahaffey, A.; Shore, B.; Baker, J.; Kilgour, B.; Brown, C.; Peru, K.M.; Headley, J.V.; Bailey, H.C. Using Ultrahigh-resolution Mass Spectrometry and Toxicity Identification Techniques to Characterize the Toxicity of Oil Sands Process-affected Water: The Case for Classical Naphthenic Acids. Environ. Toxicol. Chem. 2017, 36, 3148–3157. [Google Scholar] [CrossRef]
- Morandi, G.D.; Wiseman, S.B.; Pereira, A.; Mankidy, R.; Gault, I.G.M.; Martin, J.W.; Giesy, J.P. Effects-Directed Analysis of Dissolved Organic Compounds in Oil Sands Process-Affected Water. Environ. Sci. Technol. 2015, 49, 12395–12404. [Google Scholar] [CrossRef]
- Anderson, J.; Wiseman, S.B.; Moustafa, A.; El-Din, M.G.; Liber, K.; Giesy, J.P. Effects of Exposure to Oil Sands Process-Affected Water from Experimental Reclamation Ponds on Chironomus Dilutus. Water Res. 2012, 46, 1662–1672. [Google Scholar] [CrossRef] [PubMed]
- Ross, M.S.; Pereira, A.D.S.; Fennell, J.; Davies, M.; Johnson, J.; Sliva, L.; Martin, J.W. Quantitative and Qualitative Analysis of Naphthenic Acids in Natural Waters Surrounding the Canadian Oil Sands Industry. Environ. Sci. Technol. 2012, 46, 12796–12805. [Google Scholar] [CrossRef] [PubMed]
- Sun, C.; Shotyk, W.; Cuss, C.W.; Donner, M.W.; Fennell, J.; Javed, M.; Noernberg, T.; Poesch, M.; Pelletier, R.; Sinnatamby, N.; et al. Characterization of Naphthenic Acids and Other Dissolved Organics in Natural Water from the Athabasca Oil Sands Region, Canada. Environ. Sci. Technol. 2017, 51, 9524–9532. [Google Scholar] [CrossRef]
- Vander Meulen, I.J.; Klemish, J.L.; Peru, K.M.; Chen, D.D.Y.; Pyle, G.G.; Headley, J.V. Molecular Profiles of Naphthenic Acid Fraction Compounds from Mine Lease Wetlands in the Athabasca Oil Sands Region. Chemosphere 2021, 272, 129892. [Google Scholar] [CrossRef] [PubMed]
- Zhang, W.S.; Farmer, E.J.; Muhanzi, D.; Trudeau, V.L. Petroleum-Derived Naphthenic Acids Disrupt Hormone-Dependent Sexual Behaviours in Male Western Clawed Frogs. Conserv. Physiol. 2022, 10, coac030. [Google Scholar] [CrossRef]
- Decision 44 COM 7B.190 Wood Buffalo National Park (Canada) (N256) 2021. Available online: https://whc.unesco.org/en/decisions/7906/ (accessed on 16 April 2025).
- Mahaffey, A.; Dubé, M. Review of the Composition and Toxicity of Oil Sands Process-Affected Water. Environ. Rev. 2017, 25, 97–114. [Google Scholar] [CrossRef]
- Li, Q.; Hoppe, T. Role of Amino Acid Metabolism in Mitochondrial Homeostasis. Front. Cell Dev. Biol. 2023, 11, 1127618. [Google Scholar] [CrossRef]
- Dabravolski, S.A.; Bezsonov, E.E.; Baig, M.S.; Popkova, T.V.; Orekhov, A.N. Mitochondrial Lipid Homeostasis at the Crossroads of Liver and Heart Diseases. Int. J. Mol. Sci. 2021, 22, 6949. [Google Scholar] [CrossRef]
- Baghdassarian, H.M.; Lewis, N.E. Resource Allocation in Mammalian Systems. Biotechnol. Adv. 2024, 71, 108305. [Google Scholar] [CrossRef]
- Marentette, J.R.; Frank, R.A.; Bartlett, A.J.; Gillis, P.L.; Hewitt, L.M.; Peru, K.M.; Headley, J.V.; Brunswick, P.; Shang, D.; Parrott, J.L. Toxicity of Naphthenic Acid Fraction Components Extracted from Fresh and Aged Oil Sands Process-Affected Waters, and Commercial Naphthenic Acid Mixtures, to Fathead Minnow (Pimephales promelas) Embryos. Aquat. Toxicol. 2015, 164, 108–117. [Google Scholar] [CrossRef]
- Bartlett, A.J.; Frank, R.A.; Gillis, P.L.; Parrott, J.L.; Marentette, J.R.; Brown, L.R.; Hooey, T.; Vanderveen, R.; McInnis, R.; Brunswick, P.; et al. Toxicity of Naphthenic Acids to Invertebrates: Extracts from Oil Sands Process-Affected Water versus Commercial Mixtures. Environ. Pollut. 2017, 227, 271–279. [Google Scholar] [CrossRef] [PubMed]
- Marentette, J.R.; Frank, R.A.; Hewitt, L.M.; Gillis, P.L.; Bartlett, A.J.; Brunswick, P.; Shang, D.; Parrott, J.L. Sensitivity of Walleye (Sander vitreus) and Fathead Minnow (Pimephales promelas) Early-Life Stages to Naphthenic Acid Fraction Components Extracted from Fresh Oil Sands Process-Affected Waters. Environ. Pollut. 2015, 207, 59–67. [Google Scholar] [CrossRef] [PubMed]
- Clemente, J.S.; Prasad, N.G.N.; MacKinnon, M.D.; Fedorak, P.M. A Statistical Comparison of Naphthenic Acids Characterized by Gas Chromatography–Mass Spectrometry. Chemosphere 2003, 50, 1265–1274. [Google Scholar] [CrossRef] [PubMed]
- Quagraine, E.K.; Peterson, H.G.; Headley, J.V. In Situ Bioremediation of Naphthenic Acids Contaminated Tailing Pond Waters in the Athabasca Oil Sands Region—Demonstrated Field Studies and Plausible Options: A Review. J. Environ. Sci. Health Part A 2005, 40, 685–722. [Google Scholar] [CrossRef]
- Vander Meulen, I.J.; Schock, D.M.; Parrott, J.L.; Mundy, L.J.; Pauli, B.D.; Peru, K.M.; McMartin, D.W.; Headley, J.V. Characterization of Naphthenic Acid Fraction Compounds in Water from Athabasca Oil Sands Wetlands by Orbitrap High-Resolution Mass Spectrometry. Sci. Total Environ. 2021, 780, 146342. [Google Scholar] [CrossRef]
- Brunswick, P.; Shang, D.; Van Aggelen, G.; Hindle, R.; Hewitt, L.M.; Frank, R.A.; Haberl, M.; Kim, M. Trace Analysis of Total Naphthenic Acids in Aqueous Environmental Matrices by Liquid Chromatography/Mass Spectrometry-Quadrupole Time of Flight Mass Spectrometry Direct Injection. J. Chromatogr. A 2015, 1405, 49–71. [Google Scholar] [CrossRef]
- Howell, G.E.; McDevitt, E.; Henein, L.; Mulligan, C.; Young, D. Trans-Nonachlor Increases Extracellular Free Fatty Acid Accumulation and de Novo Lipogenesis to Produce Hepatic Steatosis in McArdle-RH7777 Cells. Toxicol. Vitr. 2018, 50, 285–292. [Google Scholar] [CrossRef]
- Hansson, P.K.; Asztély, A.-K.; Clapham, J.C.; Schreyer, S.A. Glucose and Fatty Acid Metabolism in McA-RH7777 Hepatoma Cells vs. Rat Primary Hepatocytes: Responsiveness to Nutrient Availability. Biochim. Biophys. Acta BBA—Mol. Cell Biol. Lipids 2004, 1684, 54–62. [Google Scholar] [CrossRef]
- Ward, A.B.; Dail, M.B.; Chambers, J.E. In Vitro Effect of DDE Exposure on the Regulation of Lipid Metabolism and Secretion in McA-RH7777 Hepatocytes: A Potential Role in Dyslipidemia Which May Increase the Risk of Type 2 Diabetes Mellitus. Toxicol. Vitr. 2016, 37, 9–14. [Google Scholar] [CrossRef]
- Livak, K.J.; Schmittgen, T.D. Analysis of Relative Gene Expression Data Using Real-Time Quantitative PCR and the 2(-Delta Delta C(T)) Method. Methods San Diego Calif 2001, 25, 402–408. [Google Scholar] [CrossRef]
- Dikshit, A.; Hales, K.; Hales, D.B. Whole Flaxseed Diet Alters Estrogen Metabolism to Promote 2-Methoxtestradiol-Induced Apoptosis in Hen Ovarian Cancer. J. Nutr. Biochem. 2017, 42, 117–125. [Google Scholar] [CrossRef] [PubMed]
- Gu, Q.; Zhang, B.; Zhang, J.; Wang, Z.; Li, Y.; Zhang, Y.; Song, B.; Zhou, Z.; Chang, X. Unraveling Paraquat-Induced Toxicity on Mouse Neural Stem Cells: Dose-Response Metabolomics Insights and Identification of Sensitive Biomarkers for Risk Assessment. Environ. Pollut. 2024, 355, 124211. [Google Scholar] [CrossRef]
- Rojas, I.Y.; Moyer, B.J.; Ringelberg, C.S.; Wilkins, O.M.; Pooler, D.B.; Ness, D.B.; Coker, S.; Tosteson, T.D.; Lewis, L.D.; Chamberlin, M.D.; et al. Kynurenine-Induced Aryl Hydrocarbon Receptor Signaling in Mice Causes Body Mass Gain, Liver Steatosis, and Hyperglycemia. Obesity 2021, 29, 337–349. [Google Scholar] [CrossRef]
- Kiluk, M.; Lewkowicz, J.; Pawlak, D.; Tankiewicz-Kwedlo, A. Crosstalk between Tryptophan Metabolism via Kynurenine Pathway and Carbohydrate Metabolism in the Context of Cardio-Metabolic Risk—Review. J. Clin. Med. 2021, 10, 2484. [Google Scholar] [CrossRef] [PubMed]
- Martin, K.S.; Azzolini, M.; Lira Ruas, J. The Kynurenine Connection: How Exercise Shifts Muscle Tryptophan Metabolism and Affects Energy Homeostasis, the Immune System, and the Brain. Am. J. Physiol.-Cell Physiol. 2020, 318, C818–C830. [Google Scholar] [CrossRef]
- Gutierrez-Villagomez, J.M.; Martyniuk, C.J.; Xing, L.; Langlois, V.S.; Pauli, B.D.; Blais, J.M.; Trudeau, V.L. Transcriptome Analysis Reveals That Naphthenic Acids Perturb Gene Networks Related to Metabolic Processes, Membrane Integrity, and Gut Function in Silurana (Xenopus) Tropicalis Embryos. Front. Mar. Sci. 2019, 6, 533. [Google Scholar] [CrossRef]
- Kindzierski, W.; Jin, J. Review of Health Effects of Naphthenic Acids: Data Gaps and Implications for Understanding Human Health Risk. In Oil Sands Research and Information Network, University of Alberta, School of Energy and the Environment, Edmonton, Alberta. OSRIN Report; No. TR-20; University of Alberta: Edmonton, AB, Cnada, 2012; 43p. [Google Scholar]
- Thomas, K.V.; Langford, K.; Petersen, K.; Smith, A.J.; Tollefsen, K.E. Effect-Directed Identification of Naphthenic Acids As Important in Vitro Xeno-Estrogens and Anti-Androgens in North Sea Offshore Produced Water Discharges. Environ. Sci. Technol. 2009, 43, 8066–8071. [Google Scholar] [CrossRef]
- Gutgesell, R.M.; Jamshed, L.; Frank, R.A.; Hewitt, L.M.; Thomas, P.J.; Holloway, A.C. Naphthenic Acid Fraction Components from Oil Sands Process-affected Water from the Athabasca Oil Sands Region Impair Murine Osteoblast Differentiation and Function. J. Appl. Toxicol. 2022, 42, 2005–2015. [Google Scholar] [CrossRef]
- Jamshed, L.; Perono, G.A.; Yacoub, L.R.; Gutgesell, R.M.; Frank, R.A.; Hewitt, L.M.; Thomas, P.J.; Holloway, A.C. The Effects of Oil Sands Process-Affected Water Naphthenic Acid Fraction Components on GDF15 Secretion in Extravillous Trophoblast Cells. Toxicol. Appl. Pharmacol. 2022, 441, 115970. [Google Scholar] [CrossRef]
- Jamshed, L.; Perono, G.A.; Jamshed, S.; Cheung, K.A.; Thomas, P.J.; Holloway, A. The Effects of Naphthenic Acids on Tryptophan Metabolism and Peripheral Serotonin Signalling. J. Endocr. Soc. 2021, 5, A493. [Google Scholar] [CrossRef]
- Gagné, F.; Bruneau, A.; Turcotte, P.; Gagnon, C.; Lacaze, E. An Investigation of the Immunotoxicity of Oil Sands Processed Water and Leachates in Trout Leukocytes. Ecotoxicol. Environ. Saf. 2017, 141, 43–51. [Google Scholar] [CrossRef] [PubMed]
- Jamshed, L.; Debnath, A.; Jamshed, S.; Wish, J.V.; Raine, J.C.; Tomy, G.T.; Thomas, P.J.; Holloway, A.C. An Emerging Cross-Species Marker for Organismal Health: Tryptophan-Kynurenine Pathway. Int. J. Mol. Sci. 2022, 23, 6300. [Google Scholar] [CrossRef]
- Wish, J.; Bulloch, P.; Oswald, L.; Halldorson, T.; Raine, J.C.; Jamshed, L.; Marvin, C.; Thomas, P.J.; Holloway, A.C.; Tomy, G.T. Kynurenine to Tryptophan Ratio as a Biomarker of Acute Stress in Fish. Chemosphere 2022, 288, 132522. [Google Scholar] [CrossRef]
- Mohseni, P.; Hahn, N.A.; Frank, R.A.; Hewitt, L.M.; Hajibabaei, M.; Van Der Kraak, G. Naphthenic Acid Mixtures from Oil Sands Process-Affected Water Enhance Differentiation of Mouse Embryonic Stem Cells and Affect Development of the Heart. Environ. Sci. Technol. 2015, 49, 10165–10172. [Google Scholar] [CrossRef] [PubMed]
- Melvin, S.D.; Lanctôt, C.M.; Craig, P.M.; Moon, T.W.; Peru, K.M.; Headley, J.V.; Trudeau, V.L. Effects of Naphthenic Acid Exposure on Development and Liver Metabolic Processes in Anuran Tadpoles. Environ. Pollut. 2013, 177, 22–27. [Google Scholar] [CrossRef] [PubMed]
- Roberts, D.R.; Bayne, E.M.; Beausoleil, D.; Dennett, J.; Fisher, J.T.; Hazewinkel, R.O.; Sayanda, D.; Wyatt, F.; Dubé, M.G. A Synthetic Review of Terrestrial Biological Research from the Alberta Oil Sands Region: 10 Years of Published Literature. Integr. Environ. Assess. Manag. 2022, 18, 388–406. [Google Scholar] [CrossRef] [PubMed]
- Natcher, D.; Brunet, N.; Bogdan, A.-M.; Tchir, D. Seeking Indigenous Consensus on the Impacts of Oil Sands Development in Alberta, Canada. Extr. Ind. Soc. 2020, 7, 1330–1337. [Google Scholar] [CrossRef]
- Rodríguez-Estival, J.; Smits, J.E.G. Small Mammals as Sentinels of Oil Sands Related Contaminants and Health Effects in Northeastern Alberta, Canada. Ecotoxicol. Environ. Saf. 2016, 124, 285–295. [Google Scholar] [CrossRef]
- Smits, J.E.G.; Sanders, G.; Charlebois, M. Response of a Small Mammal Population Postremediation for an Accidental Bitumen and Steam Release from a Wellhead in the Athabasca Oil Sands. Environ. Toxicol. Chem. 2019, 38, 1542–1548. [Google Scholar] [CrossRef]
- Smits, J.E.G.; Cruz-Martinez, L. Potential to Use Animals as Monitors of Ecosystem Health in the Oil Sands Region—July 2013 Update; University of Alberta Libraries: Calgary, AB, Canada, 2012. [Google Scholar]
- Rogers, V.V. Acute and Subchronic Mammalian Toxicity of Naphthenic Acids from Oil Sands Tailings. Toxicol. Sci. 2002, 66, 347–355. [Google Scholar] [CrossRef]
- Palmer, B.F.; Clegg, D.J. Metabolic Flexibility and Its Impact on Health Outcomes. Mayo Clin. Proc. 2022, 97, 761–776. [Google Scholar] [CrossRef]
- Olsen, L.; Thum, E.; Rohner, N. Lipid Metabolism in Adaptation to Extreme Nutritional Challenges. Dev. Cell 2021, 56, 1417–1429. [Google Scholar] [CrossRef]
- Selen, E.S.; Choi, J.; Wolfgang, M.J. Discordant Hepatic Fatty Acid Oxidation and Triglyceride Hydrolysis Leads to Liver Disease. JCI Insight 2021, 6, e135626. [Google Scholar] [CrossRef] [PubMed]
- Smith, R.L.; Soeters, M.R.; Wüst, R.C.I.; Houtkooper, R.H. Metabolic Flexibility as an Adaptation to Energy Resources and Requirements in Health and Disease. Endocr. Rev. 2018, 39, 489–517. [Google Scholar] [CrossRef] [PubMed]
- Zorova, L.D.; Popkov, V.A.; Plotnikov, E.Y.; Silachev, D.N.; Pevzner, I.B.; Jankauskas, S.S.; Babenko, V.A.; Zorov, S.D.; Balakireva, A.V.; Juhaszova, M.; et al. Mitochondrial Membrane Potential. Anal. Biochem. 2018, 552, 50–59. [Google Scholar] [CrossRef]
- Rundle, K.I.; Sharaf, M.S.; Stevens, D.; Kamunde, C.; van den Heuvel, M.R. Oil Sands Derived Naphthenic Acids Are Oxidative Uncouplers and Impair Electron Transport in Isolated Mitochondria. Environ. Sci. Technol. 2018, 52, 10803–10811. [Google Scholar] [CrossRef] [PubMed]
- Rundle, K.I.; Sharaf, M.S.; Stevens, D.; Kamunde, C.; Van Den Heuvel, M.R. Adamantane Carboxylic Acids Demonstrate Mitochondrial Toxicity Consistent with Oil Sands-Derived Naphthenic Acids. Environ. Adv. 2021, 5, 100092. [Google Scholar] [CrossRef]
- Kalvani, Z.; Kamunde, C.; Stevens, D.; Van Den Heuvel, M.R. A Model Naphthenic Acid Decouples Oxidative Phosphorylation through Selective Inhibition of Mitochondrial Complex Activity. Environ. Toxicol. Pharmacol. 2024, 107, 104386. [Google Scholar] [CrossRef]
- Muoio, D.M. Metabolic Inflexibility: When Mitochondrial Indecision Leads to Metabolic Gridlock. Cell 2014, 159, 1253–1262. [Google Scholar] [CrossRef]
- Ye, G.; Gao, H.; Wu, Z.; Chen, J.; Zhang, J.; Huang, Q. Comprehensive Metabolomics Insights into Benzo[a]Pyrene-Induced Metabolic Reprogramming Related to H460 Cell Invasion and Migration. Sci. Total Environ. 2021, 774, 145763. [Google Scholar] [CrossRef]
- Hardonnière, K.; Saunier, E.; Lemarié, A.; Fernier, M.; Gallais, I.; Héliès-Toussaint, C.; Mograbi, B.; Antonio, S.; Bénit, P.; Rustin, P.; et al. The Environmental Carcinogen Benzo[a]Pyrene Induces a Warburg-like Metabolic Reprogramming Dependent on NHE1 and Associated with Cell Survival. Sci. Rep. 2016, 6, 30776. [Google Scholar] [CrossRef] [PubMed]
- Sarwar, M.S.; Ramirez, C.N.; Dina Kuo, H.-C.; Chou, P.; Wu, R.; Sargsyan, D.; Yang, Y.; Shannar, A.; Mary Peter, R.; Yin, R.; et al. The Environmental Carcinogen Benzo[a]Pyrene Regulates Epigenetic Reprogramming and Metabolic Rewiring in a Two-Stage Mouse Skin Carcinogenesis Model. Carcinogenesis 2023, 44, 436–449. [Google Scholar] [CrossRef]
- Tian, Y.; Rimal, B.; Gui, W.; Koo, I.; Yokoyama, S.; Perdew, G.H.; Patterson, A.D. Early Life Short-Term Exposure to Polychlorinated Biphenyl 126 in Mice Leads to Metabolic Dysfunction and Microbiota Changes in Adulthood. Int. J. Mol. Sci. 2022, 23, 8220. [Google Scholar] [CrossRef]
- Jia, H.; Zhang, G.; Wu, Y.; Dai, W.; Xu, Q.; Gan, S.; Ju, X.; Feng, Z.; Li, R.; Yuan, B. Evaluation of Negative Effect of Naphthenic Acids (NAs) on Physiological Metabolism and Polycyclic Aromatic Hydrocarbons Adsorption of Phragmites Australis. Chemosphere 2023, 318, 137909. [Google Scholar] [CrossRef]
- Paul, S.; Hussain, N.A.S.; Lillico, D.M.E.; Suara, M.A.; Ganiyu, S.O.; Gamal El-Din, M.; Stafford, J.L. Examining the Immunotoxicity of Oil Sands Process Affected Waters Using a Human Macrophage Cell Line. Toxicology 2023, 500, 153680. [Google Scholar] [CrossRef] [PubMed]
- Leclair, L.A.; Pohler, L.; Wiseman, S.B.; He, Y.; Arens, C.J.; Giesy, J.P.; Scully, S.; Wagner, B.D.; van den Heuvel, M.R.; Hogan, N.S. In Vitro Assessment of Endocrine Disrupting Potential of Naphthenic Acid Fractions Derived from Oil Sands-Influenced Water. Environ. Sci. Technol. 2015, 49, 5743–5752. [Google Scholar] [CrossRef]
- Peng, H.; Sun, J.; Alharbi, H.A.; Jones, P.D.; Giesy, J.P.; Wiseman, S. Peroxisome Proliferator-Activated Receptor γ Is a Sensitive Target for Oil Sands Process-Affected Water: Effects on Adipogenesis and Identification of Ligands. Environ. Sci. Technol. 2016, 50, 7816–7824. [Google Scholar] [CrossRef]


| Accession Number | Gene Name | Symbol | Forward Sequence (5′-3′) | Reverse Sequence (5′-3′) |
|---|---|---|---|---|
| NM_017101.1 | Peptidylprolyl isomerase A | Ppia | CCGCTGTCTCTTTTCGCC | GCTGTCTTTGGAACTTTGTCTGC |
| NM_012512.2 | Beta-2-microglobulin | B2m | AATTCACACCCACCGAGACC | GCTCCTTCAGAGTGACGTGT |
| NM_017332.1 | Fatty acid synthase | Fasn | GGACATGGTCACAGACGATGAC | CGTCGAACTTGGACAGATCCTT |
| NM_022193.1 | Acetyl-CoA carboxylase alpha | Acca | ATTGGGCACCCCAGAGCTA | CCCGCTCCTTCAACTTGCT |
| NM_031559.2 | Carnitine palmitoyl transferase 1A | Cpt1a | CACCCCAACCCATATCCAGG | TCCTCACGGTCTAATGTGCG |
| NM_031561.2 | Fatty acid translocase | Cd36 | TCTCACACAACTCAGATACTGCT | GCACTTGCTTCTTGCCAACT |
| NM_013098.2 | Glucose-6-phosphatase | G6pase | AACTCCAGCATGTACCGCAA | AAACGGAATGGGAGC GAC TT |
| NM_031347.1 | Peroxisome proliferator-activated receptor-γ coactivator | Pgc1a | ATGGAGTGACATAGAGTGTGCT | CACCACTTCAATCCACCCAGA |
Disclaimer/Publisher’s Note: The statements, opinions and data contained in all publications are solely those of the individual author(s) and contributor(s) and not of MDPI and/or the editor(s). MDPI and/or the editor(s) disclaim responsibility for any injury to people or property resulting from any ideas, methods, instructions or products referred to in the content. |
© 2025 by the authors. Licensee MDPI, Basel, Switzerland. This article is an open access article distributed under the terms and conditions of the Creative Commons Attribution (CC BY) license (https://creativecommons.org/licenses/by/4.0/).
Share and Cite
Jamshed, L.; Marie-Lucas, A.; Perono, G.A.; Tomy, G.T.; Petrik, J.J.; Frank, R.A.; Hewitt, L.M.; Thomas, P.J.; Holloway, A.C. Naphthenic Acid Fraction Components-Induced Metabolic and Mitochondrial Alterations in Rat Hepatoma Cells: Monitoring Metabolic Reprogramming with Tryptophan–Kynurenine Ratio. J. Xenobiot. 2025, 15, 61. https://doi.org/10.3390/jox15030061
Jamshed L, Marie-Lucas A, Perono GA, Tomy GT, Petrik JJ, Frank RA, Hewitt LM, Thomas PJ, Holloway AC. Naphthenic Acid Fraction Components-Induced Metabolic and Mitochondrial Alterations in Rat Hepatoma Cells: Monitoring Metabolic Reprogramming with Tryptophan–Kynurenine Ratio. Journal of Xenobiotics. 2025; 15(3):61. https://doi.org/10.3390/jox15030061
Chicago/Turabian StyleJamshed, Laiba, Amica Marie-Lucas, Genevieve A. Perono, Gregg T. Tomy, Jim J. Petrik, Richard A. Frank, L. Mark Hewitt, Philippe J. Thomas, and Alison C. Holloway. 2025. "Naphthenic Acid Fraction Components-Induced Metabolic and Mitochondrial Alterations in Rat Hepatoma Cells: Monitoring Metabolic Reprogramming with Tryptophan–Kynurenine Ratio" Journal of Xenobiotics 15, no. 3: 61. https://doi.org/10.3390/jox15030061
APA StyleJamshed, L., Marie-Lucas, A., Perono, G. A., Tomy, G. T., Petrik, J. J., Frank, R. A., Hewitt, L. M., Thomas, P. J., & Holloway, A. C. (2025). Naphthenic Acid Fraction Components-Induced Metabolic and Mitochondrial Alterations in Rat Hepatoma Cells: Monitoring Metabolic Reprogramming with Tryptophan–Kynurenine Ratio. Journal of Xenobiotics, 15(3), 61. https://doi.org/10.3390/jox15030061