Next Article in Journal
Architectural Design Strategies for Enhancement of Thermal and Energy Performance of PCMs-Embedded Envelope System for an Office Building in a Typical Arid Saharan Climate
Next Article in Special Issue
Correction: Mukherjee et al. Heavy Metal and Metalloid Contamination in Food and Emerging Technologies for Its Detection. Sustainability 2023, 15, 1195
Previous Article in Journal
Sustainable Cultural Innovation Practice: Heritage Education in Universities and Creative Inheritance of Intangible Cultural Heritage Craft
Previous Article in Special Issue
Toxic and Trace Elements in Seaweeds from a North Atlantic Ocean Region (Tenerife, Canary Islands)
 
 
Correction published on 18 February 2024, see Sustainability 2024, 16(4), 1666.
Review

Heavy Metal and Metalloid Contamination in Food and Emerging Technologies for Its Detection

by
Anirban Goutam Mukherjee
1,†,
Kaviyarasi Renu
2,*,†,
Abilash Valsala Gopalakrishnan
1,*,
Vishnu Priya Veeraraghavan
2,
Sathishkumar Vinayagam
3,
Soraya Paz-Montelongo
4,5,
Abhijit Dey
6,
Balachandar Vellingiri
7,8,
Alex George
9,
Harishkumar Madhyastha
10 and
Raja Ganesan
11
1
Department of Biomedical Sciences, School of Biosciences and Technology, Vellore Institute of Technology (VIT), Vellore 632014, Tamil Nadu, India
2
Centre of Molecular Medicine and Diagnostics (COMManD), Department of Biochemistry, Saveetha Dental College and Hospitals, Saveetha Institute of Medical and Technical Sciences, Saveetha University, Chennai 600077, Tamil Nadu, India
3
Department of Biotechnology, Periyar University—Centre for Postgraduate and Research Studies, Dharmapuri 635205, Tamil Nadu, India
4
Area de Toxicologia, Universidad de La Laguna, 38071 La Laguna, Islas Canarias, Spain
5
Grupo Interuniversitariode Toxicología Alimentaria y Ambiental, Universidad de La Laguna, 38071 La Laguna, Islas Canarias, Spain
6
Department of Life Sciences, Presidency University, Kolkata 700073, West Bengal, India
7
Stem Cell and Regenerative Medicine/Translational Research, Department of Zoology, School of Basic Sciences, Central University of Punjab (CUPB), Bathinda 151401, Punjab, India
8
Human Molecular Cytogenetics and Stem Cell Laboratory, Department of Human Genetics and Molecular Biology, Bharathiar University, Coimbatore 641046, Tamil Nadu, India
9
Jubilee Centre for Medical Research, Jubilee Mission Medical College and Research Institute, Thrissur 680005, Kerala, India
10
Department of Cardiovascular Physiology, Faculty of Medicine, University of Miyazaki, Miyazaki 889-1692, Japan
11
Institute for Liver and Digestive Diseases, Hallym University, Chuncheon 24252, Republic of Korea
*
Authors to whom correspondence should be addressed.
These authors contributed equally to this work.
Sustainability 2023, 15(2), 1195; https://doi.org/10.3390/su15021195
Submission received: 31 October 2022 / Revised: 31 December 2022 / Accepted: 5 January 2023 / Published: 9 January 2023 / Corrected: 18 February 2024

Abstract

:
Heavy metal and metalloid poisoning in the environment and food has piqued the public’s interest since it poses significant hazards to the ecological system and human health. In food, several metals, including cadmium (Cd), lead (Pb), mercury (Hg), tin (Sn), manganese (Mn), and aluminum (Al), and metalloids, including arsenic (As), antimony (Sb), and selenium (Se), pose a severe threat to human health. It is of utmost importance to detect even minute quantities of these toxic elements and this must be efficiently determined to understand their risk. Several traditional and advanced technologies, including atomic absorption spectrometry (AAS), spectrofluorimetry, inductively coupled plasma spectrometry, e-tongues, electrochemical aptasensors, Raman spectroscopy, and fluorescence sensors, among other techniques, have proven highly beneficial in quantifying even the minute concentrations of heavy metals and metalloids in food and dietary supplements. Hence, this review aims to understand the toxicity of these metals and metalloids in food and to shed light on the emerging technologies for their detection.

1. Introduction

While our diets and bodies include traces of numerous metals, only a handful are required for health and survival. If we do not get enough vital inorganic nutrients, we may experience biochemical lesions in our cells and recognizable clinical signs. It is typical for the symptoms to improve after a sufficient amount of the missing element has been supplied [1,2]. Manufacturers and processors should care more beyond just satisfying the many regulatory requirements and standards of practice related to metals in food or even making sure their goods do not include any dangerous metals or essential trace elements in proportions high enough to pose health problems for customers. Foods should also be checked for any metals that could hasten spoilage or lower quality [3]. Foods containing even low levels of metals can undergo several unfavorable transformations throughout cooking and storage. Complexes between metal ions and organic compounds can occur in quantities as low as a few mg/kg. Several liquid foods, including fruit juices, milk, beer, and wine, can have their flavor and aroma diminished by iron pollution, according to research by Borocz-Szabo. Steel corrosion by-products, particularly iron salts, are responsible for odor loss and the development of astringent, metallic, or bitter flavors [1,4].
Most people are exposed to harmful metals/metalloids through their diets. Due to factors such as the rising use of metal-contaminated fertilizers and irrigation water sources, gastrointestinal exposures to metallics have become increasingly important in both developed and developing countries due to the globalization of food sources. However, restrictions on cadmium (Cd) in fertilizers and reductions of lead (Pb) use in fuel and food can have helped to lessen people’s exposure to metals. This review will examine these concerns from multiple angles for key hazardous elements—Cd, Pb, mercury (Hg), and arsenic (As). While focusing on Pb, methylmercury (MeHg), and Cd, the “traditional” hazardous metals such as As in food and drinking water are also included due to rising health concerns. Risk to the community from exposures at a level below those creating overt or clinical signs of toxicity is the primary worry, even if there are isolated occurrences of significant metal poisoning from tainted food. Individuals at risk are taken into account throughout their lifetimes of exposure. Food contamination from the environment (including soil, air, and water), human activities (including the preparation and storage of food), and industrial processes are described in this review. The traditional method of presenting the presence of metals and metalloids, such as As, in food is to express concentrations in terms of milligrams per kilogram of fresh weight, which is the basis for regulating contaminants in food. It is essential to remember that fresh weight might differ significantly between foods and samples of the same item [3,5,6,7,8,9,10,11,12].
People’s attention has been drawn to the problem of heavy metal and metalloid toxicity in the environment and food because of the severe threats that it presents to ecosystems and human health. Some metals and metalloids found in food are highly harmful to human health. These include Cd, Pb, Hg, tin (Sn), manganese (Mn), aluminum (Al), and metalloids, including As, antimony (Sb), and selenium (Se). Determining the danger these hazardous elements pose requires accurately detecting even trace amounts. Electrochemical aptasensors, atomic absorption spectrometry, spectrofluorimetry, inductively coupled plasma spectrometry, e-tongues, electrochemical aptasensors, Raman spectroscopy, and fluorescence sensors, among other techniques, have proven helpful in detecting trace amounts of heavy metals and metalloids in food and nutritional supplements. This article intends to inform readers about the growing technologies for detecting these metals and metalloids in food and their toxicity. The detection of heavy metals is currently a hot topic in science. Electronic tongues and bio/chemical sensors are a few examples of novel sensor technologies that have arisen to address the demand for legislative acts on environmental pollution management and early warning. Recent advances in nanotechnology and sensor technologies have become critical enablers of heavy metal detection [13].

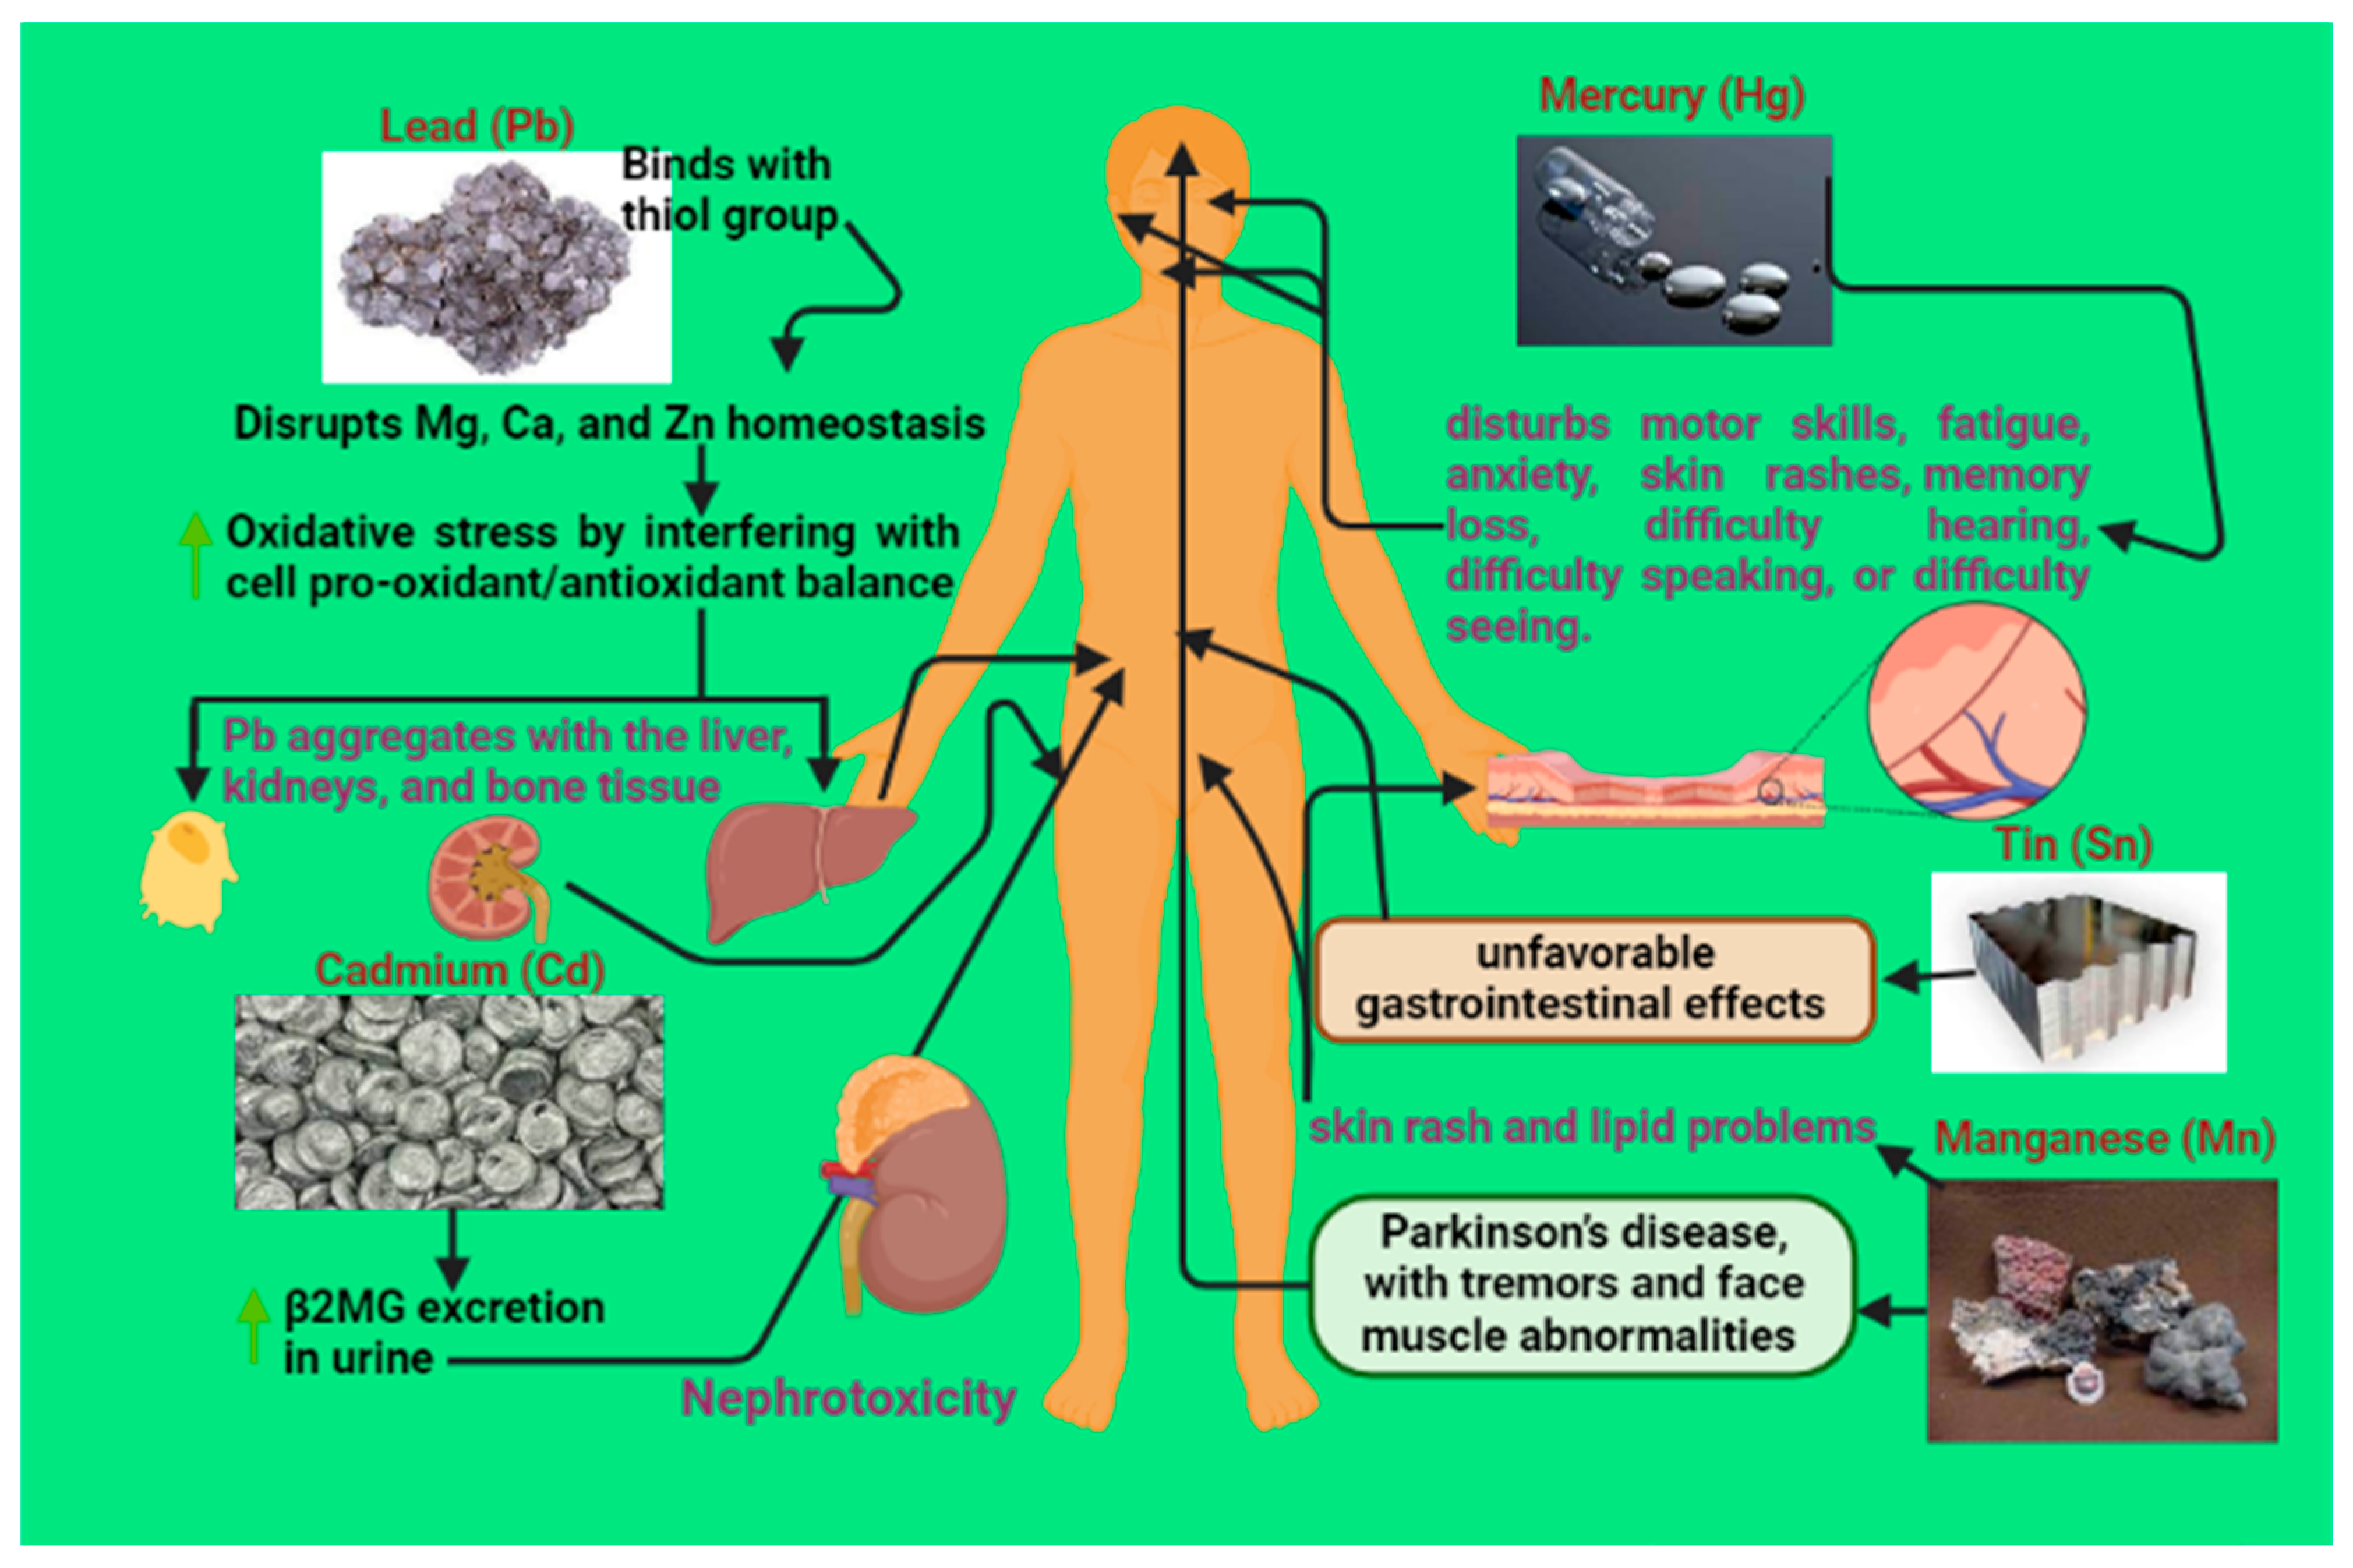
2. Metals in Food Toxicity

2.1. Cadmium (Cd) Toxicity

Cd is discharged into the environment mainly due to human activities and then moves through the ecosystem, resulting in food. As a result of bio-concentration in soil, food is the principal route of exposure to Cd for the public at large. Kidney disease, osteoporosis, diabetes, cardiovascular disease, and cancer are only some of the chronic illnesses linked to long-term Cd exposure [14]. Foods sourced from highly polluted areas have exceptionally high concentrations of the heavy metal Cd. A significant threat to public health in an area may come from a single pollution source. Due to its widespread use as a staple food, rice is the single most significant contributor to a person’s daily intake of Cd [15]. Specific foods, such as animal kidneys, blood cockle, and local vegetables, also enhance the likelihood of Cd exposure. It is a lengthy process for Cd to be removed from the food chain. Cd concentrations in polluted rice samples from Mae Sot have decreased over the previous decade, but they are still high enough to cause medical conditions for users. Analyses of biomarkers suggested a connection between dietary Cd exposure and unfavourable clinical consequences. While there was a correlation between lower Cd levels in the environment and food, there was no causal relationship between the development of health impacts and those lower levels. As a result, protecting people from Cd exposure is crucial for health policy [16,17,18,19].
Cd’s PTWI, or provisional tolerable weekly intake, was set at 7 μg/kg body weight in 1988 by the Joint FAO/WHO Expert Committee on Food Additives (JECFA). Urinary Cd elimination below 5.24 μg Cd/g creatinine was not linked with higher excretion of β2-microglobulin (β2MG), according to significant meta-analytical research examining the dose–response association between β2MG and Cd excretion in urine. Increased Cd concentrations in the urine seemed to be linked to a sharp rise in β2MG excretion. The threshold level of dietary Cd exposure was calculated to be 0.8 μg/kg body weight per day or around 25 μg/kg body weight per month. The board agreed that a monthly number was more realistic given the lengthy half-life of Cd in human kidneys. Consequently, the previous PTWI of 7 μg/kg body weight was eliminated, and a new PTMI of 25 μg/kg body weight was set [16,20].
The European Food Safety Authority’s (EFSA) panel on contaminants in the food chain recommended in 2009 that the PTWI be lowered to the tolerable weekly intake (TWI) level of 2.5 μg/kg body weight [21]. To keep the health risks associated with Cd contamination to a minimum, we must keep our Cd intakes under the PTMI or TWI. As a result, several nations’ primary dietary sources of Cd exposure have been pinpointed. Over a decade, Cd exposure has been highest in rice and grains, seafood, meat, edible offal, and vegetables across all countries [16]. It is worth noting that animals’ kidneys from inside and outside a local contaminated area show Cd levels far beyond the maximum allowable range. Implementing a frequent monitoring program and removing high-risk goods from the food chain will fix the problem. Additionally, caution and awareness of particular food contamination should be mandated because there is no viable therapy or method for reducing Cd deposition in the body. The best defense would be not to ingest any Cd at all. The PTMI was surpassed due to the regular consumption of blood cockle containing Cd at a level near the maximum limit stipulated by the Australian and New Zealand Food Standards. Due to its popularity as a food item, it is essential to assess the Cd concentration of blood cockle sold in all areas of Thailand. The native vegetables in Thailand are revered not only for their nutritional value but also for their curative properties. The possible healthcare hazards to a community that consumes more native veggies should be evaluated. Thus, it is essential to learn more about the Cd concentrations of the varieties of local vegetables in polluted sites and their intake [16,22,23] (represented in Table 1 and Figure 1).

2.2. Lead (Pb) Toxicity

Most occurrences of Pb poisoning in humans result from ingestion and absorption through the digestive tract [24]. Physical factors and the physicochemical nature of the material consumed influence Pb absorption through the gastrointestinal tract [25]. Soft tissue, such as the liver, the kidneys, and bone tissue, aggregates Pb that is absorbed in the intestines over time [24]. To go from the digestive tract to the rest of the body, Pb binds to hemoglobin in red blood cells (RBCs). The erythrocyte compartment contains over 99% of Pb in blood, with the serum and plasma compartments containing around 1%. Pb content in plasma, as opposed to whole blood, is crucial for Pb distribution throughout different organs. Pb has a half-life of 35 days in the blood and 40 days in soft tissue. Bone can store Pb for up to 30 years, and as people age, their teeth and bones accumulate more Pb [24]. It is hypothesized that youngsters have a much longer biological half-time for Pb than adults. Toxic Pb levels are thought to block enzymes and disrupt Mg, Ca, and Zn homeostasis because of the interactions between Pb and the thiol groups in proteins. Pb toxicity causes oxidative stress by interfering with cell pro-oxidant/antioxidant balance. Pb-induced oxidative stress is thought to be mitigated by foods rich in antioxidants [26,27].
According to dose–response analyses, the JECFA estimated a PTWI and found that it was associated with a 3-point drop in intelligence quotient (IQ) in children and an increase of about 3 mmHg (0.4 kPA) in systolic blood pressure in adults [24]. When seen in these terms, the significance of a change in the population’s IQ or blood pressure distribution increases. As a result, the JECFA decided that the PTWI was no longer a sufficient health precaution and revoked it. The JECFA concluded that a new PTWI deemed health protective could not be created because the dose–response study did not provide evidence of a critical threshold for the significant impacts of Pb. The JECFA reaffirmed that Pb’s neuro-developmental consequences are most concerning for developing fetuses, infants, and children [25,28]. Standards for allowable amounts of Pb in certain foods have been established by the European Commission [29]. The effective diminution of Pb in food is widely credited to interventions such as the abolition of leaded gasoline, the prohibition of Pb in wine bottles, and the end of soldered cans [30]. The damage to the Homo sapiens brain is too extensive for treatment to be effective. Hence, the resulting alterations in behavior are permanent and uncurable. The WHO and the FAO have approved daily Pb intakes of up to 7 µg/kg body weight or 490 µg of Pb for adults. Although infants and children are especially vulnerable to low Pb levels, no guidelines are provided for them [27,31].
Pb enters the body via various routes, including inhaling Pb-laden dust carried by the wind, consuming Pb-contaminated soils, oral intake of Pb-contaminated water, and consuming food cultivated in Pb-contaminated areas. There is concern that eating meat from cattle with accumulated Pb in their tissues poses a significant health risk [32,33]. Once into the body, Pb travels through the circulatory system via RBCs. Most of the Pb that enters RBCs is linked to hemoglobin rather than the membrane [27]. As a result of its potential toxicity to the hematological system, Pb exposure has been linked to an increased risk of anemia [34]. Histopathological analysis has shown that Pb ions are taken to the liver, which might cause long-term harm.
Furthermore, Pb poisoning raises blood enzyme levels and lowers protein synthesis. Pb causes kidney toxicity by altering the kidney’s excretory activity and damaging its structure [35,36,37,38]. Other organs and tissue systems impacted by Pb exposure include the neurological, cardiovascular, and reproductive systems [34,38,39]. Heavy mineralization of bones and teeth is a substantial strain on the body caused by Pb poisoning [27,40,41] (represented in Table 1 and Figure 1).

2.3. Mercury (Hg) Toxicity

Before widespread poisoning deaths in the 1950s, Hg was not considered a significant contaminant. More lately, health consequences have been identified at relatively lower levels of exposure, and monitoring information must now be evaluated from this perspective. Hg exposure in humans is thought to occur primarily through the ingestion of fish. Most Hg ends up in the ocean due to natural processes and direct commercial releases. MeHg, a by-product of inorganic Hg’s methylation, accumulates in aquatic organisms and humans through the food chain. MeHg concentrations in fish have steadily risen due to human activities, such as the acidity of freshwater streams and lakes and water impoundment for massive hydroelectric plants. As MeHg goes up the aquatic food chain, it becomes increasingly concentrated. The average MeHg concentration in marine fish is <0.5 ppm, while sharks, sailfish, marlin, and other billfish often have over 1 ppm. A lot more MeHg could be present when there is pollution in the water supply. Dentists are at a higher risk for Hg exposure because they work with Hg amalgams. Researchers have shown that dentists and dental experts have higher levels of Hg in their toenails than the general population or the control group when tested for exposure to the metal through fish consumption [42,43].
Given the unusually high levels of naturally occurring Hg in the Mediterranean basin, it has been intensively researched during the past 20 years. The Hg levels in the bodies of marine animals in this basin are significantly greater than those in the Atlantic for the same (or comparable) species. MeHg is the most common type of Hg in marine life. In coastal fishing villages, pregnant women, in particular, are at risk from the protracted and regular consumption of seafood with high Hg levels. Numerous studies have indicated that fishermen from coastal settlements of the Tyrrhenian Sea have abnormally high levels of Hg in their blood and hair. In certain instances, a rise in blood cell DNA damage has been linked to these quantities. Elevated Hg levels in the hair and blood of people from a fishing community of Madeira have also been detected. There should be a fresh look at these data to determine what preventative measures are required [44]. The incidence of alkyl-Hg poisoning in rural Ghana was studied, totaling 144 cases. The patients had unwittingly consumed maize prepared for planting with ethylmercury chloride. Twenty people were affected and displayed the classic symptoms of alkyl-mercury poisoning. This incident illustrates the grave health risks of using alkyl-Hg compounds as fungicides in agriculture, particularly in a less-educated rural community [45].
A severe infection can develop from Hg exposure. Depending on the kind, dose, manner, and duration of exposure, the most common symptoms of Hg poisoning are impaired motor skills, fatigue, anxiety, skin rashes, memory loss, difficulty hearing, difficulty speaking, or difficulty seeing. In extreme cases of MeHg poisoning, Minamata disease can develop [46]. Hg poisoning has been hypothesized to cause pink disease (acrodynia), characterized by a rosy rash and flaking skin. MeHg exposure in youngsters has been linked to various serious health issues later in life, such as renal disease and cognitive impairment. Long-term, low-dose exposure to MeHg has not been fully elucidated. Hg poisoning is one means by which suicide attempts are carried out. Hg levels can be measured in bodily fluids, such as blood, urine, and hair, but the results are not always accurate [43] (Table 1 and Figure 1).

2.4. Tin (Sn) Toxicity

Around 20% of Europe’s annual production and around 25,000,000,000 food cans contain plain internally (unlacquered) Sn-coated steel bodies. Roughly 80 billion cans are used as food containers annually around the world. Cans for drinks are also commonly made from tinplate. Over fifteen billion internally lacquered tinplate beverage cans are made and used annually in Europe. Sn can leach into the contents of food and drink through containers made from tinplate, especially if the containers’ inside surfaces are left untreated. Maximum allowable levels of Sn in food are usually 250 mg/kg (200 mg/kg in the UK) for solid foods and 150 mg/kg for beverages, with a PTWI of 14 mg/kg body weight [47,48,49,50]. According to environmental research, Sn species (inorganic and organotin) quickly adsorb onto solid particles [49,51]. As a result, Sn in foodstuffs may adhere to either solid particles (fibers) or pectins. Hydrochloric acid is not a simple solution for releasing Sn that has been fixed in this manner [52]. Similarly, it is challenging to dislodge Sn from solid food using artificial gastric juices, and intestinal enzymes do not play a role in the solubilization of Sn bound to proteins. However, 90% of Sn absorbed into the solid component of meals is released by alkaline digestive secretions [53].
Dietary sources account for most people’s exposure to Sn, especially from eating goods stored in unlacquered Sn cans [49,54]. It has been calculated that the average French person consumes 2.7 milligrams of Sn per day, or 0.04 milligrams per kilogram of body weight, from the 5.6% diet of food preserved in Sn cans [54]. As a comparison, the PTWI is 14 mg/kg. Therefore, a daily dose of 2 mg/kg is significantly lower. It has been calculated, however, that a Western adult could consume an additional 109.1 µg of Sn per day, with the vast majority of this amount coming from fruits (fruits contain 500 µg/kg of Sn, while meat contains 2 µg/kg, potatoes contain 22 µg/kg, spinach contains 2 µg/kg, and cereals contain 47 µg/kg) [49,55].
Some documented data suggest that consuming foods or beverages with Sn concentrations at or below 200 ppm has resulted in negative gastrointestinal symptoms in an undetermined but possibly modest percentage of those exposed. The data backing this claim come from claims of negative impacts with either sparse, imprecise, or dubious reliability. Few informative studies have been conducted, although clinical trials provide more assurance on exposure concentration and dose consequences. At slightly beyond 700 ppm, unfavorable gastrointestinal effects were seen in clinical studies. However, two studies at even larger doses revealed no such effects. Consequently, the available research does not provide a notably thorough profile of the hazardous danger to humans due to acute exposure to divalent inorganic Sn. Over 2.5 million canned foods are consumed annually in the UK only, and a poll showed that approximately 4% of bare internal tinplate food cans have over 150 mg/kg of Sn. While this is the case, no acute effects due to Sn poisoning in the range of 100–200 ppm have been reported in the last 25 years. These data imply minimal proof that eating foods with Sn contents up to 200 ppm causes immediate gastrointestinal symptoms. However, only more clinical research will produce unambiguous proof that the existing regulatory restrictions offer safety limits for people in the general population [49,56,57,58,59,60] (represented in Table 1 and Figure 1).

2.5. Manganese (Mn) Toxicity

Even though the body needs it, too much of the mineral Mn can be harmful [61,62,63,64]. The recommended intake of Mn is 1.8 (women) or 2.3 (men) mg/d, while the upper limit is 11 mg/d, according to the National Academy of Sciences [65]. Most individuals acquire Mn through food, with some vegans consuming >10 mg daily. There is still some doubt as to whether or not ambient Mn might be a source of overexposure, according to the Environmental Protection Agency (EPA) and the Food and Drug Administration [66].
Mn deficiency may result in skeletal abnormalities [67] and poor lipid metabolism [68,69], but it is incredibly uncommon in humans [69,70,71]. One participant exhibited skin rash after consuming a diet devoid of Mn [68]. Toxicity, on the other hand, is far more prevalent and is present in Parkinson’s disease, with tremors and face muscle abnormalities [64]. The evidence linking trace element status, particularly Mn status, to abnormal behavior is scant, but it exists [72,73]. Increased levels of Mn in hair are associated with aggression in a prison population [74,75]. However, there are limited data to suggest that Mn from high Mn meals may cause concern, and most cases of Mn toxicity have been documented in people exposed to very high levels of Mn dust (such as miners) [73,75,76] (represented in Table 1 and Figure 1).

2.6. Aluminum (Al) Toxicity

Al is present in every kind of food. Corn, yellow cheese, salt, herbs, spices, tea, and tap water can all be good places to start looking for Al [77]. Al can be abundant in natural and processed foods [78,79,80,81,82,83]. Not all plants have the same Al uptake [84,85]. Plants grown in acidic soil mainly accumulate Al at a higher rate [84,86]. Food contact materials that migrate Al into the food they come into contact with are another possible source of Al in processed foods [87]. Al comes primarily from household wares made of Al. Many metabolic processes, including recycling calcium, phosphorus, and iron, can be hampered by Al, which may contribute to human disease. Al salts may impede enzymes, such as hexokinase, acid and alkaline phosphatase, phosphodiesterase, and phosphooxygenase, and bind to DNA and RNA. Nervous and hematopoietic systems and the skeleton are incredibly vulnerable to the ill effects of Al salts. Food, water, and cosmetics stored in Al containers introduce Al to the body. Al neurotoxic action is likely due to Mg ion substitution in ATP, affecting the activity of all ATP-using enzymes. Evidence from experimental models implicates Al salts in the pathogenesis of Alzheimer’s disease. Because Al is toxic to the skeletal system, it reduces collagen synthesis and slows down mineralization, weakening resistance and leading to a propensity toward breaking. A lack of erythropoietin causes anemia, heme-synthesizing enzymes inhibition, and Al binding to transferrin. Elevated levels of Al have been found in many neoplastic cells, but the carcinogenic effects of Al have neither been confirmed nor refuted. In conclusion, we should implement preventative measures that result in lower Al intake, such as decreasing the consumption of Al-containing foods and beverages and decreasing the use of Al-containing products [77,88,89,90,91,92].
High Al intake has been linked to problems in the nervous system, bones, and blood-forming hematopoiesis. Al intake should be kept below 1 milligram per kilogram of body weight per week, as determined by the European Food Safety Authority. Worldwide, Al consumption varies significantly due to regional differences. An analysis of the findings from different studies demonstrates that people’s exposure to Al in their diets varies considerably. The average weekly exposure in adults was between 0.2 and 1.5 mg/kg of body weight. Maximum exposure of 0.7–2.3 mg/kg body weight was determined for children and adolescents due to their lower body weight. An adult weighing 70 kg would consume 14–105 milligrams of Al per week, while a child weighing 30 kg would consume 21–69 milligrams per week. According to these calculations, some people can obtain their recommended weekly allowance of Al simply by eating the right foods [93]. The FAO/WHO Experts Commission on Food Additives reported in 1989 that the average daily intake of Al for children is 2–6 mg/kg and 6–14 mg/kg for adults. Al has a PTWI value of 7 mg/kg [94] (represented in Table 1).

2.7. Chromium (Cr) Toxicity

Except for refined sugar, it appears that canned and processed foods are higher in Cr than fresh foods. Nonetheless, Cr can be found in abundance in brown sugar and molasses. Sugar cane from the Virgin Islands has been shown to have a lower Cr content (0.07 µg/g) than sugar cane from Colombia (0.35 µg/g) [95]. Cr can be leached from stainless steel equipment, especially in acidic environments, which is likely to be present during the production of these goods [96]. Some European staples, such as wheat and wheat flour, have a Cr content of 5–10 µg/g dry weight, whereas potatoes and cow’s milk have a Cr content of around 5 µg/g dry weight [97]. Weaned toddlers and adults can use these nutritional staples in their diets [98]. Intakes in the general population range from 13 to 49 µg/d, with older adults exhibiting even more significant variation at 27–61 µg/d [99]. Dietary intake above 25 µg (0.5 µmol)/d for adults and between 0.1 and 1.0 µg/kg/d (2 and 19 nmol/k/d) for children and adolescents are considered safe and appropriate. However, any reference nutrient intakes (RNI) for Cr compounds have not yet been established [98,99]. The kidney is the primary organ exposed to some Cr compounds, especially hexavalent Cr compounds, which are carcinogenic and corrosive and are also delayed contact sensitizers. However, Cr is a vital component of human life. The human body can eliminate the compound from its system by being exposed to hexavalent Cr compounds [100] (represented in Table 1).

2.8. Iron (Fe) Toxicity

More than half of all humans rely on lowland rice as their primary source of nutrition. The productivity of lowland rice is severely hampered by Fe toxicity, a common nutritional condition. Submerged or flooded soils have a deteriorated soil condition, increasing the concentration and uptake of Fe, and contributing to Fe’s toxicity [101,102,103]. Toxic effects from intaking too much Fe exist, and therapeutic dosages can induce stomach upset. As seen in primary and secondary hemochromatosis, hepatic fibrosis, diabetes, and heart failure have all been linked to prolonged Fe overload. Sub-Saharan Africans developed cirrhosis and diabetes after regularly ingesting 50–100 mg Fe/day of highly accessible Fe through their home-brewed beer. To prevent this common Fe toxicity endpoint, a safe upper threshold must be carefully calculated [104] (represented in Table 1).

2.9. Nickel (Ni)Toxicity

Ni is a poisonous metal whose primary sources are marine fish and plants watered with untreated sewage. Considering its migration during food processing or packaging, the prospective measurement of Ni levels in food and diet is paramount. Depending on variables such as temperature, pH, contact time, food category, and processing technology, stainless steel appliances and ceramics can be the essential suppliers. Ni intake data are limited and do not reveal significant differences between geographic regions. It is vital to know the bioavailable fraction of Ni and the bioavailable fraction of species that contain it [105]. The adult/lifetime toxicological reference values (TRV) of 20 μg Ni/kg-day are based on post-implantation loss/perinatal death data from a two-generation rat reproductive study [106]. Exposure to Ni carbonyl is the cause of nearly all occurrences of acute Ni poisoning. The earliest consequences include nonspecific symptoms and inflammation of the respiratory tract. Patients who have been severely poisoned may experience significant respiratory and digestive damage. Death typically results from cerebral edema or diffuse interstitial pneumonitis. When Ni carbonyl has been inhaled, sodium diethyldithiocarbamate, an experimental medication, chelates the metal [107]. Consumption of 325 mg causes vomiting, dizziness, and a slowing heart rate [107,108,109] (represented in Table 1).
Table 1. The role of heavy metals, the sources of heavy metals, recommended usage of heavy metals, and their side effects.
MetalSourcesRecommendation of IntakeSide EffectsReference
Cadmium (Cd)staple food, rice, and several specific foods, such as animal kidneys, blood cockle, and local vegetablesThe European Food Safety Authority’s (EFSA) panel on contaminants in the food chain recommended in 2009 that the PTWI be lowered to the tolerable weekly intake (TWI) level of 2.5 μg/kg body weight.Kidney disease, osteoporosis, diabetes, cardiovascular disease, and cancer[21]
Lead (Pb)wind, consumption of Pb-contaminated soils, oral intake of Pb-contaminated water, and consumption of food cultivated in Pb-contaminated areasThe WHO and the FAO have approved daily Pb intakes of up to 7 µg/kg body weight or 490 µg of Pb for adults.liver, kidneys, and bone tissue[32,33]
Mercury (Hg)ingestion of fish, whale sharks, sailfish, marlin, other billfish, and mercury amalgams-impaired motor skills, fatigue, anxiety, skin rashes, memory loss, difficulty hearing, difficulty speaking, difficulty seeing, Minamata disease, and acrodynia[42,43]
Tin (Sn)Cans for drinks are commonly made from tinplate. Over fifteen billion internally lacquered tinplate beverage cans are made and used annually in EuropeMaximum allowable levels of Sn in food are usually 250 mg/kg (200 mg/kg in the UK) for solid foods and 150 mg/kg (2.5 mmol/L) for beverages, with a PTWI of 14 mg/kg body weight.unfavorable gastrointestinal effects[47,48,49,50]
Manganese (Mn)foods, with some vegans consuming >10 mg dailyRecommended intake of Mn is 1.8 (women) or 2.3 (men) mg/d, while the upper limit is 11 mg/d, according to the National Academy of Sciences.Parkinson’s disease, with tremors and facial muscle problems[64]
Aluminum (Al)Corn, yellow cheese, salt, herbs, spices, tea, and tap waterAl intake should be kept below 1 milligram per kilogram of body weight per week, as determined by the European Food Safety Authority. Food Additives reported in 1989 that the average daily intake of aluminum for children is 2–6 mg/kg, and for adults, 6–14 mg/kg. Al has a PTWI value of 7 mg/kg.pathogenesis of Alzheimer’s disease, impaired skeletal system, reduced collagen synthesis, slowed-down mineralization, weakening resistance, and a propensity toward breaking[77]
Chromium (Cr)canned and other processed foods, brown sugar, and molassesDietary intake above 25 µg (0.5 µmol)/d for adults and between 0.1 and 1.0 µg/kg/d (2 and 19 nmol/k/d) for children and adolescents are considered safe and appropriate. However, the Panel has not established reference nutrient intakes (RNI) for Cr compounds.carcinogenic, corrosive, and delayed contact sensitizers[98,99]
Iron (Fe)lowland riceA safe upper threshold of 25–50 mg Fe/day can be calculated by applying a safety factor of 2 to prevent this common iron toxicity endpoint.stomach upset, primary and secondary hemochromatosis, hepatic fibrosis, diabetes, and heart failure[104]
Nickel (Ni)marine fish and plants watered with untreated sewage Consumption of 325 mg causes vomiting, dizziness, and a slowing heart rate. respiratory and digestive damage, cerebral edema, or diffuse interstitial pneumonitis[107,108,109]

3. Metalloids in Food Toxicity

3.1. Arsenic (As) Toxicity

Millions of people worldwide are at risk from exposure to carcinogenic As. Humans can be exposed to these chemicals through various foods and drinks, including tap water, crops, processed foods, vegetables, mushrooms, animal products, and more. In As pollution hotspots, Bangladesh and West Bengal, India, are at the most significant risk. Researchers have discovered that even rice grown in relatively clean areas, such as Australia, can have dangerous amounts of the toxic element As. Many countries import and export rice, a worldwide issue [9,110,111,112,113].
In rural communities of West Bengal, where clean drinking water was already being delivered, Halder et al. (2013) evaluated the risk of exposure to As [114]. It was discovered that the total daily intake of inorganic arsenic (iAs) was surpassed in 35% of cases, the As concentration in drinking water was <10 μg/L and in 100% of cases, and the As concentration in water was >10 μg/L when the PTDI limit of 2.1 μg/day/kg body weight was taken into account [110,115]. In reality, the WHO suggested a Benchmark Dose Lower Limit (BMDL0.5; suggesting a 0.5% increased incidence of cancer) for As in 2011 after withdrawing the PTDI and PTWI values for As. Lung cancer, bladder cancer, and skin lesion BMDL0.5 values were established in the study to be 3 μg day/kg/body weight, 5.2 μg/day/kg/body weight, and 5.4 μg day/kg/body weight, respectively [116,117,118].
In a study, turnip was grown in soilless circumstances to examine its ability to absorb As. Four As species were used in a 4 × 3 factorial experiment examining the effects of As concentrations (1.0, 2.0, and 5.0 mg/L). As speciation was the primary determinant of As’s phytoavailability and phytotoxicity, this turnip variety was phytotoxic to organic arsenicals [96]. Higher upward translocation was seen for organic arsenicals compared to inorganic arsenicals, which likely contributed to the greater phytotoxicity and lowered dry matter outputs of these organic treatments. Concentrations in the inner and outer root skin were significantly higher than the regulatory threshold for As in crops used for human consumption (1.0 mg/kg). If turnip plants are grown in polluted nutrient solutions, they will accumulate residues of As at unsafe levels for ingestion by animals or humans [119].

3.2. Antimony (Sb) Toxicity

Sb can leach from food contact polymers into foods or drinks after long storage periods at high temperatures [120]. Sb oxide is in the List of Indirect Additives Used in Food Contact Substances (LIAUFCS) maintained by the U.S. Food and Drug Administration (FDA) [121]. Sb trioxide is not included in the LIAUFCS chemical database. The FDA predicts Sb trioxide’s Cumulated Estimated Daily Intake (CEDI) from food contact items to be 0.0001 mg/kg body weight daily [120,122,123].
In one study, the researchers used atomic fluorescence spectrometry (AFS) coupled with a hydride generation device (HG-AFS) to examine the levels of Sb leached from polyethylene terephthalate (PET) bottle material in 12 different brands of bottled water sold in Mexican supermarkets. Sb was preconcentrated from the water samples using a Dowex® 1X8-100 ion-exchange resin. Waltham, MA, A The chronic daily intake (CDI) induced by the release of Sb in one brand was 514.3 and 566.2 ng/kg/day, respectively, which is higher than the USEPA-regulated CDI threshold of 400 ng/kg/day. Thus, it appears that the manufacture of PET bottles utilizing an appropriately selected polymer ensures low Sb levels in water samples [124]. The short-term experiments lasted up to 15 days, and the long-term trials lasted up to 220 days, both examined the impact of storage time and temperature on Sb migration from PET bottles into mineral water. Measurements of Sb migration were performed using HG-AFS for total determination and using high-performance liquid chromatography (HPLC) in combination with inductively coupled plasma mass spectrometry (ICP-MS) (HPLC-ICP-MS) for speciation analysis. According to this migratory research, no Sb movement in waters was kept at 4 and 20 °C. After 30 days of storage at 60 °C, substantial Sb migration was seen, but at 40 °C, the maximum limit imposed by the European Union (5.0 μg/L) was not surpassed in any of the samples. In this example, Sb (V) and Sb (III) were found to exceed the EU’s maximum limit [125].

3.3. Selenium (Se) Toxicity

Food is the primary source of Se for human beings. Toxic Se levels in the body have been linked to Se-rich food consumed in seleniferous regions [126]. Soil Se levels are a good indicator of the Se levels in food and the population. Geography, weather, the availability of specific proteins, and how meals are prepared all play a role in determining the overall Se content. Se levels in soil and food supply must be tracked regularly. Most Se comes from diet, with absorption rates ranging from 70 to 80%. Generally speaking, organic forms of Se are more bioavailable than inorganic forms of Se. However, this does depend on a person’s Se source and nutritional state [127,128,129]. Symptoms of prolonged Se exposure in humans include hair loss and nail deformities. Human Se status and exposure over the long term can be evaluated by measuring the amount of Se in hair and toenails; this can be contrasted with a short-term evaluation of Se status using blood and urine levels [126,130]. Intriguing research has linked Se consumption to a lower chance of developing prostate and colon cancers. Nevertheless, randomized trials for other forms of cancer have shown mixed results. Males and females are advised to consume 55 μg/day (0.7 μmol/day). The plasma isoform of glutathione peroxidase (GPx) activity plateaus at a particular concentration; thus, this suggestion depends on that value. Based on selenosis being the adverse consequence, the Tolerable Upper Intake Level (UL) for adults is 400 μg/day (5.1 μmol/day) [127,131].

4. Detection of Heavy Metal and Metalloid Contaminants in Food Toxicity

4.1. Atomic Absorption Spectrometry (AAS)

Since each element has its own unique set of energy levels, AAS relies heavily on the ability to detect its atoms selectively. To obtain a linear calibration curve (Beers’ Law), the monochromator’s bandwidth must be larger than the light source’s, which is challenging to perform with conventional monochromators. Because of the thousands of lines produced by all of the elements in a sample, the monochromator is a crucial component of an AAS [132].
Experimental findings from 16 different labs have resulted in a technique for detecting Pb, Cd, Zn, Cu, and Fe in meals using AAS following dry ashing at 450 degrees Celsius. Before the actual study began, familiarization samples were used for practice, solutions were passed out, and metal concentrations were evaluated using AAS. Liver paste, apple sauce, minced fish, wheat bran, and milk powder were the five foods tested in this study. Every specimen underwent the same analysis. When calculating the repeatability standard deviation, the researchers employed appropriate sample combinations as split-level combinations. Pb concentrations of 0.040–0.25 mg/kg had a repeatability relative standard deviation of 20–50%, and Cd concentrations of 0.001–0.51 mg/kg had a range of 12–352%. Ranges were from 4 to 8% for zinc concentrations of 0.7–38 mg/kg, from 7 to 45% for Cu concentrations of 0.51–45 mg /kg, and from 11 to 14% for Fe concentrations of 4–216 mg/kg [133]. It has been claimed that Cr3+, Fe3+, Cu2+, Ni2+, Co2+, and Zn2+ may all be preconcentrated in genuine samples using a straightforward and sensitive technique. Adsorption of analytes onto activated carbon loaded with bis salicyl aldehyde, 1,3-propane diimine (BSPDI) is the basis of this technique. Nitric acid in acetone is used to elute the metals adsorbed onto the modified activated carbon. Analytical variables, including sample volume and pH, are studied for their effects on the results. Matrix ion effects on analyte retentions are also investigated. Most analyte recoveries are measured in decimal quantities. Some food samples have been tested using this method to effectively determine the amount of these metals in them [134]. Analytical parameters, such as thulium concentration, pH, reaction time, and others that affected the quantitative coprecipitation of analytes, were studied. Research was also conducted to determine how alkali and certain transition metals impacted the recoveries. For each analyte, the detection limits improved from 0.1 to 1.6 μg/L under the ideal conditions. Certified reference materials were analyzed to verify the validity of the presented coprecipitation process. Cu, Co, Cd, Ni, Mn, Fe, and Pb have all been correctly identified in food and environmental samples using the suggested coprecipitation approach [135]. Altering Fe oxide-silica magnetic particles with a freshly synthesized Schiff base (Fe3O4/SiO2/L) resulted in a flexible and robust solid phase with magnetic properties and a very high adsorption capacity, as reported in another study. X-ray diffraction (XRD) spectrometry, transmission electron microscopy (TEM), and Fourier-transform infrared spectroscopy (FT-IR) spectra all validated the structure of the final product (TEM). The lowest detectable concentrations of Pb(II), Cd(II), and Cu(II), at optimal circumstances, were 0.14, 0.19, and 0.12 μg/L, respectively. Real-world samples have been effectively analyzed using the developed approach, with encouraging outcomes. All of these facts point to the immense potential of this magnetic phase in ecological and biological contexts [136]. Another work displayed that graphite furnace AAS was used to compare the results of dry and wet ashing to calculate the amounts of heavy metals (Pb, Cd, Fe, Cu, Mn, and Zn) in fish samples [137] (represented in Figure 2). Unfortunately, AAS can only be used to analyze solutions, so it has some restrictions. It is also less sensitive than a graphite furnace, calls for a lot of sample material (around 1–3 mL), and has many issues with refractory substances. Its tremendous sample throughput and user-friendliness more than make up for its flaws [138,139,140]. Many spectrometers were developed over the years with the addition of new technology, but many were eventually abandoned because of issues with sensitivity, background adjustments, and other factors. As a result of prior work, however, high-resolution continuum-source atomic absorption spectrometry (HR-CS AAS) with flame and furnace atomizers is already well established. It paves the way for the development of highly sensitive and effectively background-corrected sequential and simultaneous methods for the determination of a wide range of elements [13,141].

4.2. Spectrofluorimetry

The study of substances that emit light, or fluorescence, is the focus of spectrofluorimetry. It takes advantage of the fact that electrons get even more excited when they collide with other excited electrons or high-energy objects such as photons [142,143].
In one study, Al and Zn traces were effectively extracted using cloud point methods before being determined by spectrofluorimetry. Al and Zn in a surfactant solution react with 8-hydroxyquinoline to form a hydrophobic compound, which is subsequently trapped in surfactant micelles. Factors that influenced complexation and phase separation were optimized. Preconcentration of 25 mL of the sample in the presence of 0.12% (v/v) Triton X-114 enabled the detection of 0.79 μg/L of Al and 1.2 μg/L of Zn. Five independent determinations yielded 2.72 and 2.1% relative standard deviations for Al and Zn, respectively, at concentrations of 40 and 100 μg/L. Recoveries for the spiked samples were very high, between 95% and 104%. This strategy determined Al and Zn concentrations in various samples [144].
A study utilized stopped-flow injection spectrofluorimetry (SFIS) and an effective in situ solvent formation microextraction (ISFME) to measure Cu. The ionic liquid was used as an extractant phase after thiamine was oxidized with Cu(II) to produce hydrophobic and extremely luminous thiochrome (TC). Phase separation followed centrifugation, and SFIS was used to identify the enriched analyte. ISFME is an effective technique for removing metal ions from high-ionic-strength aqueous solutions and concentrating them beforehand. An analysis of performance variables was investigated and optimized. The suggested approach’s limit of detection (LOD) was 0.024 μg/L under ideal experimental circumstances, with a relative standard deviation (RSD) of 2.1%. Recovery trials and analysis of standard reference materials were used to gauge the efficacy of the combined process (GBW 07605 Tea). Cu concentrations in water and food samples were satisfactorily determined using the proposed approach [145]. With the help of some cutting-edge reaction strategies, the spectrofluorimetric reagent 2-(-pyridyl)-thioquinaldinamide (PTQA) was recently produced and described. Using PTQA, a new spectrofluorimetric approach for detecting vanadium (V) at Pico-trace levels has been devised. This method is extremely straightforward, ultra-sensitive, and highly selective without extractive chemistry. Direct non-extractive spectrofluorimetric V detection using PTQA has been suggested as a new analytical reagent. In a mildly acidic V solution in 20% ethanol, PTQA is oxidized to form a highly fluorescent oxidized product, making it a novel fluorimetric reagent. V was effectively determined using the proposed model in a wide variety of environmental waters (potable and polluted), biological fluids (human blood, urine, hair, and milk), soil samples, food samples (vegetables, rice, and wheat), and complex synthetic mixtures containing V (IV) and V (V). An analysis of the biological, food, and vegetable samples using the suggested method yielded findings similar to those obtained using inductively coupled plasma-optical emission spectroscopy (ICP-OES) and AAS [146]. A bright blue-green color complex between Al(III) and salicylaldehyde picolinoylhydrazone (SAPH) has been examined as a simple and inexpensive spectrofluorimetric substitute for Al detection in bivalve mollusks. Numerous samples of fresh and canned bivalve mollusks showed that this approach accurately and reliably determined the amount of Al present. The findings revealed that Al concentration was lowest in commercially available fresh wild items (6–27 mg per 100 g dry weight) and highest in bivalves preserved in cans (75 mg per 100 g dry weight). That is how the study has clarified that there are processing-related variations in Al concentration. Its results demonstrate a straightforward, low-cost, and trustworthy method for routinely determining Al content in seafood for quality control [147]. This method’s incredible sensitivity and specificity are some of its main benefits. The speed and accuracy of its diagnosis are other advantages. One major drawback is that not all chemicals exhibit fluorescent properties [144,145]. Compared to HPLC and similar technologies, which have lengthy run times and complicated operation processes, this one is easier to use and more convenient. In addition, the sensitivity of this approach is significantly better than that of HPLC. Substances can be analyzed to the nanogram scale. As a result, this method’s high sensitivity and specificity are undeniable benefits. Quantitative methods can be developed further, allowing for simple measurements of the analyte concentration in the mixture [148] (Figure 2).

4.3. Inductively Coupled Plasma Mass Spectrometry (ICP-MS)

Samples are ionized when using an inductively coupled plasma in ICP-MS. After atomizing the material, atomic and minute polyatomic ions are detected. This method is recognized and exploited for its ability to detect metals and various non-metals in liquid samples at extremely low concentrations. It can detect many isotopes of a single element, making it a versatile tool for isotopic tagging [149,150]. Carrots and other food samples from Latvian farmlands and allotment gardens were analyzed for their levels of 15 heavy metals (Ag, As, Ba, Cd, Co, Cr, Cu, Mn, Ni, Pb, Rb, Se, Sr, V, and Zn) using inductively coupled plasma mass spectrometry (ICP-MS) and AAS. Highly hazardous metals were discovered: Ni at 0.28 mg/kg, Cr at 0.16 mg/kg, Pb at 0.05 mg/kg, and Cd at 0.12 mg/kg (mean values, dry weight). Furthermore, some trace elements (Mn, Rb, and Zn) were found in garden-grown carrot samples that were considerably greater than those found in farmland-grown carrot samples [151,152]. As, Cd, Cr, Cu, Hg, Mo, Ni, Pb, Se, and Zn were among the 19 trace elements examined by ICP-MS and atomic fluorescence in carrots grown on a reclaimed silt from the Illinois River and in reference soil [152,153]. Various sections of plants are harvested for their spices, which are then employed in various dishes. They make for easy samples when gauging daily intakes and examining how components are distributed throughout the plants. Cd is considered hazardous to human health, while As and Se are considerd both necessary and potentially dangerous. Se RDAs are between 50 and 200 μg/day. Adults should consume between 100 and 200 micrograms of As daily. Selenium is harmful at doses higher than 750 μg/day, while the weekly safe intake levels for Cd and As are 7 and 15 μg/day, respectively. With daisies (ChamomillaeVulgaris), bay leaves (Folium Lauri), mint leaves (Folium Menthane), rosehips (RosaeCaninae), sages (Folium Salviae Officinalis), thyme (HerbaThymi), cumin (Fructus Cummuni), sumac (Folium RhoisCoriariae), linden flowers (FlosTilliae) (ICP-MS) as the samples, Na, K, Mg, Ca, Li, Zn, Fe, Cu, B, Hg, Pb, and Mn were determined using ICP-OES and AAS. The results were compared to those of earlier investigations. Microwave oven digestion was performed using HNO3 and H2O2 at optimal quantities. The digestion efficiency of the microwave oven was improved by finetuning the temperature. The influence of HNO3 concentration on ICP-MS signals was considered as the samples were examined using the direct calibration method for Cd and the standard addition technique for As and Se. Oyster Tissue 1566b SRM was used to verify the procedures for Cd and As, while BCR Human Hair 397 SRM was used to verify the techniques for Se. While most samples had Cd concentrations between 10 and 100 μg/kg, most samples had As and Se concentrations in the 100–500 μg/kg range. Experiments with HCl, NaCl, NaNO3, CsCl, CsNO3, LiCl, and LiNO3 were conducted to examine the impact of spectral and nonspectral interferences on As signals [154]. ICP-MS has various benefits, including high throughput (approximately 40 specimens per hour), the capacity to measure many elements simultaneously, and low detection limits (0.01 to 0.1 micrograms/L for many elements). The significant initial investment required by the instruments is a crucial drawback. ICP-MS analysis works well with heavier elements, such as Pb, whereas it has trouble with lighter elements due to interferences. Cr and iron are lighter elements that cannot be assayed using ICP-MS. Mass spectrometry techniques have a distinct benefit in that they can measure isotopes, which could increase their utility for analyzing trace elements [155] (Figure 2).

4.4. Liquid Chromatography–Inductively Coupled Plasma Mass Spectrometry (LC–ICP-MS)

LC–ICP-MS is a crucial method for examining components in biological samples, especially since many modern proteomic methods are inadequate for this purpose. The sensitivity and specificity of ICP-MS for elements can be included in discovery and quantitative proteomic procedures through LC–ICP-MS. About half of all enzymes rely on metals, such as redox-active iron, copper, and manganese, for their biochemical activity [156]. Classical proteomics often misses reduced performance due to the loss of metal-binding ability since strong denaturing reagents remove metals from their parent biomolecules. ICP-MS excels in element-specific identification for many reasons, but its ability to detect endogenous metals is just one of them. After high-resolution chromatographic separation, online atomic spectrometry may detect covalently bound minor and trace elements, such as Se, S, and P. Exogenous metal exposures to biological systems, including those induced by chronic environmental toxicants such as Pb, can be studied in great detail with the help of element-specific detection techniques [157]. It is common knowledge that some elements are crucial to human survival, while others pose serious health risks. A thorough characterization of an element is necessary when considering its advantages and risks. As a result, research into the oxidation states, chemical ligand associations, and complex forms of numerous elements has seen a surge in popularity. The sample analysis to determine the presence or absence of a specific chemical species of an element, known as “elemental speciation,” often requires a separation technique coupled with an element-specific detector. Numerous techniques have been devised, each employing a unique mechanism for separation and a unique set of detecting tools. However, the combination of liquid chromatography and LC–ICP–MS has quickly become a favorite method for elemental speciation research due to its adaptability, robustness, sensitivity, and multi-elemental capabilities [158,159]. This technique was used to determine the Hg species in seafood from the Brazilian market [160,161]. Using nontargeted and tailored speciation approaches, such as LC/ICP-MS and complementing techniques, gives a complete picture of metal and metalloid speciation in food [162]. Research has proposed a quick approach for As speciation in food samples using LC–ICP-MS. An anion exchange column was used to distinguish the species by LC. This approach was used to identify As in food samples [163]. ICP-MS was used to determine As, Pb, and Cd; ICP-OES was used to determine Al; DMA was used to determine Hg; and LC–ICP-MS was used to speciate As [164]. This method also measured MeHg and inorganic divalent Hg levels in fish, vegetables, herbs, and cereal goods [165]. Traditional Korean fermented dishes prepared with shrimp and tiny fishes are salted foods. They have a unique taste as well as a long shelf life. However, the complex matrix with high salt concentration makes it challenging to examine their As content [164]. ICP-MS is a practical approach for analyzing these kinds of samples. Interferences must be eliminated before performing As analysis using ICP-MS since the salt (NaCl) has the same mass-to-charge ratio as As [166,167,168]. One of the hybrid methods must involve the instrumentation required to conduct speciation investigations. It illustrates why ICP-MS has increased the use of standard separation equipment as sample introduction devices during the past decade. Although other hybrid methods have been tried, one of the most effective is HPLC paired with ICP-MS. Because of the many diverse separation processes that may be created with a range of mobile and stationary phases, HPLC is arguably the most widespread and versatile separation technology paired with an ICP-MS. There are a few reasons why this mixture has become so popular. In the conventional mode of operation of an ICP-OES or ICP-MS, sample solutions are pumped into a nebulizer, transformed into fine aerosols, and then transferred to a spray chamber, where the larger aerosol particles are removed and finally introduced to the plasma, where they are ionized. The plasma spectrochemical community has optimized the spray chamber and nebulizer to be reliable, versatile, and user-friendly [159]. The many separation methods and the numerous devices for detecting individual elements have been the subject of several scholarly works. Yet, the combination of liquid chromatography and LC–ICP–MS has become the most preferred approach for elemental speciation research due to its versatility, robustness, sensitivity, and multi-elemental capabilities. Some common LC–ICP–MS applications include the speciation of environmental, biological, and clinical samples [159] (Figure 2).

4.5. E-Tongues

The need for affordable, rapid-response monitoring systems to detect heavy metals and toxins in water supplies has developed alongside rising public awareness of the importance of these issues. E-tongues are multi-sensory displays that use electroanalytical procedures and multivariate statistical approaches to help people see data in new ways, qualitatively and quantitatively [169]. E-tongues are sensor arrays that use the notion of global selectivity, in which the variation in electrical response between materials acts as a fingerprint for the analyzed sample to tell apart chemically identical liquids. They have found widespread application in analyzing a variety of beverages, including wine, fruit juice, coffee, milk, and other beverages, and in detecting minute quantities of contaminants or pollutants in water. Electrochemical measurements and impedance spectroscopy are two of the most used detection principles. For the most part, ultrathin films fabricated in a layer-by-layer method are used as the materials for the sensing units because they provide increased sensitivity and allow for greater control over the molecular architecture of the film. Biosensing utilizes sensing units susceptible to molecular recognition, such as films containing immobilized antigens or enzymes with special recognition for clinical diagnosis, expanding the idea of e-tongues. Since sample recognition is fundamentally a classification task, there has been a recent push to improve e-tongues by applying artificial intelligence (AI) and data visualization techniques [170]. E-tongues are an attractive possibility to confront several current environmental monitoring obstacles, especially those about major contaminants such as heavy metals, due to their simple working, fast reaction, low cost, and effortless integration with other systems (microfluidic, optical, etc.) [169]. The development of e-tongues in the sensor age has sparked a new golden age for tasting and rating food [171]. Potential techniques for quick food assessment include gas chromatography-olfactory (GC-O), chemical sensor technology (electronic nose and tongue), and multivariate data processing techniques [172].
To perform complex liquid analysis, it has been found that a sensor array consisting of several electrodes with no selectivity or poor selectivity is superior to a sensor array consisting of highly selective electrodes [173]. For this reason, an electronic tongue system to detect heavy metal ions in complex liquid media has emerged as a promising option. Sensitive and chemically stable ion-selective chalcogenide glass sensors were created by Vlasov and Legin [174,175,176,177,178]. Furthermore, their study showed how flow injection analysis (FIA) might be combined with a potentiometric e-tongue later. Seven chalcogenide glass sensors were used to take real-time readings of Pb2+, Cr6+, Cu2+, and Cd2+ ions at a waste incineration pilot facility [169,179]. In addition to being an enticing alternative to conventional methods, it has other advantages, including low cost, portability, and rapid answers. One of e-tongues’ primary advantages is their ability to determine the total phenolic content and the individual speciation of specified groups or compounds. Consequently, this is advantageous since the same device may perform both functions without cumbersome laboratory equipment, whereas with conventional approaches, each task must be performed individually [180] (Figure 2).

4.6. Electrochemical Aptasensors

While conventional heavy metal detecting technologies, such as AAS, have a low detection limit, they also have several drawbacks. Consequently, creating a quick method for online and real-time detection of heavy metals is crucial. As a result of its high sensitivity, specificity, and reliability, the electrochemical aptasensor-based technique holds great promise in detecting heavy metals. Though progress is being made quickly, additional study is needed before this technology can be used for on-site detection. Electrochemical aptasensors for heavy metal detection are a growing area of study and industrial use [181,182,183,184,185].
Aptamers are single-stranded deoxyribonucleic acid (ssDNA) or ribonucleic acid (RNA) generated using the SELEX (Systematic Evolution of Ligands by Exponential Enrichment) technique [186,187]. Fixed sequences at both ends and random sequences in between characterize the oligonucleotide library in the basic process of SELEX [188]. Primers can bind to a specific place in the fixed sequence in polymerase chain reaction amplification. The heterogeneity of the library is ensured by the fact that each nucleic acid molecule has a unique spatial configuration, which is defined by a random sequence of 30-60 nucleotides [189]. SELEX’s four most common processes are binding, separation, amplification, and purification [190]. The SELEX procedure [191] improves the purity of oligonucleotides by isolating them from a vast, randomly assembled library by selecting those with a high affinity for the target. The number of SELEX cycles necessary to terminate the process is determined by measuring the enrichment of the DNA library after each cycle [192]. The researchers obtain a targeted aptamer by cloning and sequencing the SELEX fragment, analyzing its secondary structure to establish its affinity, and eventually purifying it [193]. Aptamers are superior to conventional antibodies because of their high specificity and affinity to the targets and ease of production, stability, and labeling [194]. Aptamers have been utilized extensively for detecting cells, viruses, proteins, carbohydrates, antibodies, and insecticides since their discovery in the 1990s [195,196,197]. Due to their low molecular weight and unique binding location, metal ions significantly complicate aptamer selection and aptamer-based sensor (aptasensor) development [198,199,200,201,202,203]. Due to the mass shift and steric hindrance effect, heavy metal ions and aptamers cannot combine [204]. This mixture reduces the versatility and sensitivity of many aptasensors [205]. Heavy metal ions, particularly Pb2+, Cd2+, and Hg+, are commonly utilized detection targets in aptasensors [182,206,207,208]. Aptamers are particularly interesting to scientists because they are versatile binding molecules that are simple to create and alter. Aptamer biosensor research is seeing a rise in the use of electrochemical technologies. The advancement of electrochemical aptasensors has entered a new phase with new materials. Not only do they supply numerous novel approaches to sensor design, but they also give superb nano-sensitive materials. The usage of nanoparticles in electrochemical aptamer sensors is expected to grow as their significance in electroanalysis grows. Given its exceptional properties in electron transmission, graphene is poised to become a crucial material for modifying electrodes. Although most aptamers have been described for a single analyte, future research should concentrate on aptamers that can be employed for the simultaneous, efficient, quick, and precise detection of numerous analytes. Although these sensors operate admirably in a lab, aptamers are easily damaged or deteriorated when subjected to real-world circumstances. Thus, subsequent work must be done to improve the sensors’ reliability. It is time-consuming to pretreat food samples, an ongoing challenge for scientists. Presently, testing is expensive when conducted in a lab. It is envisaged that electrochemical aptamer sensors based on nanotechnology will play an increasingly important role in detecting and finding applications in many other areas as research progresses [181,209,210,211,212]. As biorecognition elements in sensor creation, aptamers provide numerous advantages over affinity-based (antibody) sensors. Aptasensors are tiny, chemically stable, and affordable. In addition, they offer exceptional elasticity and efficiency in constructing their assemblies, which has resulted in new sensors with exceptional sensitivity and selectivity [213]. The Microenvironment will influence an aptamer’s structure and its interactions with the ligand-target, which is a restriction. In addition, the salt content substantially impacts the configuration of aptamers [214] (Figure 2).

4.7. Raman Spectroscopy

Raman spectroscopy uses the inelastic scattering of light phenomena to identify an analyte through molecular bond vibrations. Exposure of a sample to laser light results in scattering a tiny number of photons. Elastic scattering (i.e., Rayleigh scattering) accounts for most of the scattering, and its light has the same frequency as the incident light. In elastic scattering (i.e., Raman scattering), about 1 in 106–108 photons are scattered, causing frequency variations (i.e., Raman shifts) between the incident and scattered photons. In this case, either energy is obtained by the photons in the incident light (anti-Stokes Raman scattering) or energy is lost (Stokes Raman scattering) [215,216,217]. Based on the observed Raman shifts, Raman spectra can be derived. Because each Raman peak in the spectrum indicates a distinct molecular bond, a unique vibrational fingerprint can be generated and used to identify an analyte [218]. Micro-Raman spectroscopy, Raman imaging, and surface-enhanced Raman spectroscopy (SERS) are all examples of Raman spectroscopic techniques often employed to detect food safety issues [219].
Raman spectroscopy is based on the interaction of matter and light and, hence, is non-elastic [220]. The molecules of interest interact with rough metals, such as copper, gold, or silver, resulting in a 4–7-fold boost in Raman spectral strength and SERS [221]. The magnitude of the surface-enhanced Raman spectral signal is, as a system, initially determined by the size of the nanostructure. The enhancement effect is maximized when the metal size is less than the wavelength of the incident light and more than the typical electron-free path [222]. The substrates need ultrahigh sensitivity, excellent stability, convenient sampling, and rapid response time, making it challenging to apply SERS for heavy metals detection in food [223,224]. With the help of tip-enhanced Raman spectroscopy (TERS), a nanometric substrate can be precisely manipulated for an ultra-sensitive surface-enhanced Raman scattering (SERS) examination [225,226].
As a non-invasive, user-friendly, sensitive, and quick technique, Raman spectroscopy has the potential to revolutionize the way food safety is evaluated worldwide. Its uses in food safety have been significantly bolstered by the recent development of Raman spectroscopy technologies, dramatically improving their detection capacities of food pollutants. When detecting pollutants, Raman spectroscopy is one of the few methods to do so quickly, sensitively, non-destructively, and cheaply across all three categories [215,218,219,227].
The use of SERS techniques to detect Hg ions has been the subject of several published reports. It was shown that using a wide range of SERS substrates was the most effective way to detect low levels of As. To further modify the SERS signal of Raman reporters, As ions can coordinate with certain atoms or aptamers to affect nanoparticle aggregation [228,229,230,231,232,233]. The coordination of Cu ions with other atoms, such as nitrogen and oxygen, allows for the modification of Raman characteristic peaks or the induction of metal nanoparticle aggregation, both of which are necessary for accurately quantifying copper ions [228,234,235,236,237,238]. Zinc ions may form bonds with nitrogen and oxygen atoms, while Cd ions predominantly form complexes with oxygen atoms; these properties distinguish between the two metals. Zn and Cd, having similar electrical structures, will interfere with one another in the actual detecting application. Therefore, an ultrasensitive and selective SERS sensor must assess trace Zn and Cd ions [239,240,241,242]. To detect Pb ions, researchers can either utilize a cofactor, Pb2+-dependent DNAzyme, which has solid catalytic activity for Pb ions, or they can employ a Raman reporter, which can either approach or avoid the noble metal substrate by cleaving the DNA. Another strategy is to indicate the self-aggregation of nanoparticles and produce a higher SERS signal via the coordination of lead ions with certain groups or atoms [228,243,244,245,246]. Quantitative detection of Cr ions is based on the fact that Cr ions undergo a shift in the Raman signal when they are complexed with functional groups or reduced to trivalent Cr [247,248]. Combining SERS with other technologies, such as colorimetry, fluorescence, and microextraction, has been described in recent years for detecting heavy metal ions to produce more consistent and accurate results. The detection results may be more reliable if these methods are used together [228,249]. Heavy metal ions come in various forms, and it is common for there to be more than one in complex environmental systems. With proper setup, simultaneous detection of numerous heavy metal ions can reduce the workload and open new avenues for innovation in various fields. For this reason, it is crucial to create reliable SERS sensors that can detect numerous heavy metal ions at once in real-world samples [228,250].
Detecting heavy metal ions using SERS in conjunction with other technologies, such as fluorescence, colorimetry, microfluidics, microextraction, immunoassay, and density functional theory (DFT), is becoming increasingly popular as science and technology advance. On the one hand, the limitations of SERS can be compensated for by other technologies. However, the results are more persuasive when two or three technologies work together. Since several heavy metal ions commonly coexist in real-world samples, interference-free detection of numerous heavy metal ions simultaneously is an essential direction for future progress. Field testing is the most crucial part of heavy metal ion detection. Thus, the size and price of Raman equipment will be the focus of future research. In conclusion, SERS technology shows promising results in detecting heavy metal ions, and it is believed to mature into one of the standard detection methods shortly [223,228,251]. Raman spectroscopy has attracted increasing research and clinical facility interest over the past decade. As a technique for vibrational spectroscopy, it complements well-established infrared spectroscopy. Substances can be recognized, and chemical changes can be monitored with high specificity using spectral patterns. Raman spectroscopy paired with microscopy is efficient for imaging biological samples due to the excellent spatial resolution of excitation wavelengths in the visible and near-infrared spectrum [252]. Poor repeatability is a problem of Raman spectroscopy, making it exceedingly difficult to acquire reliable quantitative observations [253].

4.8. Fluorescence Sensors

Recently, much work has been done on creating rapid, sensitive, and selective sensors for detecting heavy metal ions. Because of their unique properties, such as high specificity, sensitivity, and reversibility, fluorescence sensors have recently attracted much attention. Optical sensors, in particular, have many advantages; for example, they can be easily integrated into microfluidic platforms [254] and used to monitor dangerous conditions [255]. Recently, fluorescent optical sensors have become increasingly popular due to their excellent specificity, low detection limits, fast response time, and technological simplicity [256,257]. Their underlying premise is based on the fact that a substance (fluorophore) emits light when activated at shorter wavelengths [258]. This emission fluctuates in strength (or lifespan) according to the concentration of the analyte of interest [259]. Several different materials have been created for the detection of heavy metal ions in water, including porphyrins [260], metal-organic frameworks [261], DNAzymes [262], fluorescent aptamers [263], quantum dots [264], and organic dyes [265].
Since the shift in fluorescence due to coordination occurs quickly and is non-destructive, selective, sensitive, and amenable to screening, methods based on fluorescence detection using small molecules are ideal. These techniques are centered on synthesizing and designing fluorophores that contain coordination ligands and the binding mechanism necessary to detect metal ions in solution. The core fluorophores, including rhodamine, pyrene, anthracene, naphthalimide, aminoquioline, bithiophene, and coumarin, are used with appropriate probes to create fluorescence sensors for Hg2+, Cu2+, Zn2+, Cd2+, Fe3+, Ni2+, and Cr2+ [266,267,268,269]. This approach’s excellent sensitivity and specificity are its most outstanding features. Another feature is its speedy diagnostic capability. Not all chemicals fluoresce, which is the biggest disadvantage [270].

5. Conclusions

Pb, Cd, and Hg are the primary metals, and As is the primary metalloid of potential health concerns found in foods and dietary supplements. Toxic metal contaminants in pharmaceuticals and nutritional supplements are infrequently detected by routine screening [271]. Setting heavy metal limits is appropriate when heavy metals are likely or certain to contaminate a given product. As a result of their widespread presence in the environment, the constraints of existing analytical techniques, and other factors, setting reasonable health-based limits for some of these metals is difficult. There are several ways to detect heavy metal ions, from time-tested techniques to advanced biosensors [181]. Conventional techniques for detection include but are not limited to, atomic absorption/emission spectrometry, atomic fluorescence spectroscopy, inductively coupled plasma mass spectrometry, high-performance liquid chromatography, and so on [272,273,274,275,276]. Although these techniques have a high sensitivity for quantifying heavy metal ions, their widespread use is hindered because they necessitate the expertise of trained personnel, are time-consuming and costly to implement, and require specialized laboratory equipment. Several advanced techniques have been rescued, such as aptasensors and many others. Compendial tests for metals in food provide several problems for compendial scientists. Current instrumental techniques detect metals at concentrations well below the indicated permissible daily exposures (PDEs). Therefore, to prevent superfluous testing, it is essential that the evolving criteria for metal levels in compendial therapeutic products be clear about the choice of metals and stated PDE.

Author Contributions

Conceptualization, A.D., B.V. and A.V.G.; resources and data curation, A.G.M. and K.R.; writing—original draft preparation, V.P.V., S.V., A.G.M. and K.R.; writing—review and editing, S.P.-M., K.R. and A.G.M.; visualization, A.V.G.; supervision, S.P.-M., A.D., R.G., A.G., H.M. and A.V.G.; project administration, A.D., B.V. and A.V.G. All authors have read and agreed to the published version of the manuscript.

Funding

This research received no external funding.

Institutional Review Board Statement:

Not applicable.

Informed Consent Statement

Not applicable.

Data Availability Statement

Data are available from the authors upon request (A.V.G. & K.R.).

Acknowledgments

The authors thank the VIT, Vellore, and Saveetha dental college, Chennai Tamil Nadu, India, for supporting this work.

Conflicts of Interest

The authors declared no potential conflicts of interest concerning this article’s research, authorship, and publication.

References

  1. Reilly, C. Metal Contamination of Food: Its Significance for Food Quality and Human Health; John Wiley & Sons: New York, NY, USA, 2008. [Google Scholar]
  2. Massoud, R.; Hadiani, M.R.; Hamzehlou, P.; Khosravi-Darani, K. Bioremediation of heavy metals in food industry: Application of Saccharomyces cerevisiae. Electron. J. Biotechnol. 2019, 37, 56–60. [Google Scholar] [CrossRef]
  3. Fowler, B.A.; Alexander, J.; Oskarsson, A. Toxic metals in food. In Handbook on the Toxicology of Metals; Elsevier: Amsterdam, The Netherlands, 2015; pp. 123–140. [Google Scholar]
  4. Borocz-Szabo, M. Effects of metals on sensory qualities of food. Acta Aliment. 1980, 9, 341–356. [Google Scholar]
  5. Rai, P.K.; Lee, S.S.; Zhang, M.; Tsang, Y.F.; Kim, K.-H. Heavy metals in food crops: Health risks, fate, mechanisms, and management. Environ. Int. 2019, 125, 365–385. [Google Scholar] [CrossRef] [PubMed]
  6. Chen, L.; Zhou, S.; Shi, Y.; Wang, C.; Li, B.; Li, Y.; Wu, S. Heavy metals in food crops, soil, and water in the Lihe River Watershed of the Taihu Region and their potential health risks when ingested. Sci. Total Environ. 2018, 615, 141–149. [Google Scholar] [CrossRef] [PubMed]
  7. Onakpa, M.M.; Njan, A.A.; Kalu, O.C. A review of heavy metal contamination of food crops in Nigeria. Ann. Glob. Health 2018, 84, 488. [Google Scholar] [CrossRef] [PubMed]
  8. Qin, G.; Niu, Z.; Yu, J.; Li, Z.; Ma, J.; Xiang, P. Soil heavy metal pollution and food safety in China: Effects, sources and removing technology. Chemosphere 2021, 267, 129205. [Google Scholar] [CrossRef] [PubMed]
  9. Mukherjee, A.G.; Wanjari, U.R.; Renu, K.; Vellingiri, B.; Gopalakrishnan, A.V. Heavy metal and metalloid-induced reproductive toxicity. Environ. Toxicol. Pharmacol. 2022, 92, 103859. [Google Scholar] [CrossRef] [PubMed]
  10. Nkwunonwo, U.C.; Odika, P.O.; Onyia, N.I. A review of the health implications of heavy metals in food chain in Nigeria. Sci. World J. 2020, 2020, 6594109. [Google Scholar] [CrossRef]
  11. Roleda, M.Y.; Marfaing, H.; Desnica, N.; Jónsdóttir, R.; Skjermo, J.; Rebours, C.; Nitschke, U. Variations in polyphenol and heavy metal contents of wild-harvested and cultivated seaweed bulk biomass: Health risk assessment and implication for food applications. Food Control 2019, 95, 121–134. [Google Scholar] [CrossRef]
  12. Goutam Mukherjee, A.; Ramesh Wanjari, U.; Eladl, M.A.; El-Sherbiny, M.; Elsherbini, D.M.A.; Sukumar, A.; Kannampuzha, S.; Ravichandran, M.; Renu, K.; Vellingiri, B.; et al. Mixed Contaminants: Occurrence, Interactions, Toxicity, Detection, and Remediation. Molecules 2022, 27, 2577. [Google Scholar] [CrossRef]
  13. Mukherjee, S.; Bhattacharyya, S.; Ghosh, K.; Pal, S.; Halder, A.; Naseri, M.; Mohammadniaei, M.; Sarkar, S.; Ghosh, A.; Sun, Y. Sensory development for heavy metal detection: A review on translation from conventional analysis to field-portable sensor. Trends Food Sci. Technol. 2021, 109, 674–689. [Google Scholar] [CrossRef]
  14. Genchi, G.; Sinicropi, M.S.; Lauria, G.; Carocci, A.; Catalano, A. The effects of cadmium toxicity. Int. J. Environ. Res. Public Health 2020, 17, 3782. [Google Scholar] [CrossRef]
  15. Song, Y.; Wang, Y.; Mao, W.; Sui, H.; Yong, L.; Yang, D.; Jiang, D.; Zhang, L.; Gong, Y. Dietary cadmium exposure assessment among the Chinese population. PLoS ONE 2017, 12, e0177978. [Google Scholar] [CrossRef] [PubMed]
  16. Chunhabundit, R. Cadmium exposure and potential health risk from foods in contaminated area, Thailand. Toxicol. Res. 2016, 32, 65–72. [Google Scholar] [CrossRef] [PubMed]
  17. Suwatvitayakorn, P.; Ko, M.-S.; Kim, K.-W.; Chanpiwat, P. Human health risk assessment of cadmium exposure through rice consumption in cadmium-contaminated areas of the Mae Tao sub-district, Tak, Thailand. Environ. Geochem. Health 2020, 42, 2331–2344. [Google Scholar] [CrossRef] [PubMed]
  18. Aendo, P.; De Garine-Wichatitsky, M.; Mingkhwan, R.; Senachai, K.; Santativongchai, P.; Krajanglikit, P.; Tulayakul, P. Potential health effects of heavy metals and carcinogenic health risk estimation of pb and cd contaminated eggs from a closed gold mine area in northern Thailand. Foods 2022, 11, 2791. [Google Scholar] [CrossRef]
  19. Rahimzadeh, M.R.; Rahimzadeh, M.R.; Kazemi, S.; Moghadamnia, A.-a. Cadmium toxicity and treatment: An update. Casp. J. Intern. Med. 2017, 8, 135. [Google Scholar] [CrossRef]
  20. Joint FAO; WHO Expert Committee on Food Additives; World Health Organization. Safety Evaluation of Certain Food Additives and Contaminants: Prepared by The Seventy-Third Meeting of the Joint FAO/WHO Expert Committee on Food Additives (JECFA); World Health Organization: Geneva, Switzerland, 2011. [Google Scholar]
  21. EFSA Panel on Contaminants in the Food Chain. Statement on tolerable weekly intake for cadmium. EFSA J. 2011, 9, 1975. [Google Scholar] [CrossRef]
  22. Bernhoft, R.A. Cadmium toxicity and treatment. Sci. World J. 2013, 2013, 394652. [Google Scholar] [CrossRef]
  23. Egger, A.E.; Grabmann, G.; Gollmann-Tepeköylü, C.; Pechriggl, E.J.; Artner, C.; Türkcan, A.; Hartinger, C.G.; Fritsch, H.; Keppler, B.K.; Brenner, E. Chemical imaging and assessment of cadmium distribution in the human body. Metallomics 2019, 11, 2010–2019. [Google Scholar] [CrossRef]
  24. Kabata-Pendias, A.; Szteke, B. Trace Elements in Abiotic and Biotic Environments; Taylor & Francis: London, UK, 2015. [Google Scholar]
  25. WHO. Safety Evaluation of Certain Food Additives and Contaminants; WHO Food Additives Series: Geneva, Switzerland, 1998. [Google Scholar]
  26. Hsu, P.-C.; Guo, Y.L. Antioxidant nutrients and lead toxicity. Toxicology 2002, 180, 33–44. [Google Scholar] [CrossRef] [PubMed]
  27. Kumar, A.; Kumar, A.; MMS, C.-P.; Chaturvedi, A.K.; Shabnam, A.A.; Subrahmanyam, G.; Mondal, R.; Gupta, D.K.; Malyan, S.K.; Kumar, S.S. Lead toxicity: Health hazards, influence on food chain, and sustainable remediation approaches. Int. J. Environ. Res. Public Health 2020, 17, 2179. [Google Scholar] [CrossRef] [PubMed]
  28. WHO. Childhood Lead Poisoning; WHO: Geneva, Switzerland, 2010. [Google Scholar]
  29. Commission, E. Commission Regulation (EC) No 1881/2006 of 19 December 2006 setting maximum levels for certain contaminants in foodstuffs. Off. J. Eur. Union 2006, 364, 5–24. [Google Scholar]
  30. Bellinger, D.C.; Malin, A.; Wright, R.O. The neurodevelopmental toxicity of lead: History, epidemiology, and public health implications. In Advances in Neurotoxicology; Elsevier: Amsterdam, The Netherlands, 2018; Volume 2, pp. 1–26. [Google Scholar]
  31. Wani, A.; Ara, A.; Usmani, J. Lead toxicity: A review. Interdiscip Toxicol. 2015, 8, 55–64. [Google Scholar] [CrossRef] [PubMed]
  32. Rumbeiha, W.K.; Braselton, W.E.; Donch, D. A retrospective study on the disappearance of blood lead in cattle with accidental lead toxicosis. J. Vet. Diagn. Investig. 2001, 13, 373–378. [Google Scholar] [CrossRef] [PubMed]
  33. Sharpe, R.; Livesey, C. Lead poisoning in cattle and its implications for food safety. Vet. Rec. 2006, 159, 71–74. [Google Scholar] [CrossRef] [PubMed]
  34. Flora, S. Nutritional components modify metal absorption, toxic response and chelation therapy. J. Nutr. Environ. Med. 2002, 12, 53–67. [Google Scholar] [CrossRef]
  35. Yuan, G.; Dai, S.; Yin, Z.; Lu, H.; Jia, R.; Xu, J.; Song, X.; Li, L.; Shu, Y.; Zhao, X. Toxicological assessment of combined lead and cadmium: Acute and sub-chronic toxicity study in rats. Food Chem. Toxicol. 2014, 65, 260–268. [Google Scholar] [CrossRef]
  36. Cobbina, S.J.; Chen, Y.; Zhou, Z.; Wu, X.; Zhao, T.; Zhang, Z.; Feng, W.; Wang, W.; Li, Q.; Wu, X. Toxicity assessment due to sub-chronic exposure to individual and mixtures of four toxic heavy metals. J. Hazard. Mater. 2015, 294, 109–120. [Google Scholar] [CrossRef]
  37. El-Neweshy, M.S.; El-Sayed, Y.S. Influence of vitamin C supplementation on lead-induced histopathological alterations in male rats. Exp. Toxicol. Pathol. 2011, 63, 221–227. [Google Scholar] [CrossRef]
  38. Abdou, H.M.; Hassan, M.A. Protective role of omega-3 polyunsaturated fatty acid against lead acetate-induced toxicity in liver and kidney of female rats. BioMed. Res. Int. 2014, 2014, 435857. [Google Scholar] [CrossRef] [PubMed]
  39. Carocci, A.; Catalano, A.; Lauria, G.; Sinicropi, M.S.; Genchi, G. Lead toxicity, antioxidant defense and environment. Rev. Environ. Contam. Toxicol. 2016, 238, 45–67. [Google Scholar] [CrossRef] [PubMed]
  40. Tarrago, O.; Brown, M. Case Studies in Environmental Medicine (CSEM) Lead Toxicity. Agency Toxic Subst. Dis. Regist. 2017. Available online: https://www.atsdr.cdc.gov/csem/lead/docs/CSEM-Lead_toxicity_508.pdf (accessed on 30 October 2022).
  41. Loomis, D.; Guha, N.; Hall, A.L.; Straif, K. Identifying occupational carcinogens: An update from the IARC Monographs. Occup. Environ. Med. 2018, 75, 593–603. [Google Scholar] [CrossRef] [PubMed]
  42. Pacyna, E.G.; Pacyna, J.M.; Steenhuisen, F.; Wilson, S. Global anthropogenic mercury emission inventory for 2000. Atmos. Environ. 2006, 40, 4048–4063. [Google Scholar] [CrossRef]
  43. Sattar, T. Brief Discussion on Mercury Poisoning, Its Sources and Remedies to Cure It. J. Chem. Health Risks 2020, 12, 131–142. [Google Scholar] [CrossRef]
  44. Renzoni, A.; Zino, F.; Franchi, E. Mercury levels along the food chain and risk for exposed populations. Environ. Res. 1998, 77, 68–72. [Google Scholar] [CrossRef] [PubMed]
  45. Derban, L.K. Outbreak of food poisoning due to alkyl-mercury fungicide. Arch. Environ. Health Int. J. 1974, 28, 49–52. [Google Scholar] [CrossRef]
  46. George, T.S. Minamata: Pollution and the Struggle for Democracy in Postwar JAPAN; Harvard University Asia Center: Cambridge, MA, USA, 2001; Volume 194. [Google Scholar]
  47. Joint, F.A.O.; WHO Expert Committee on Food Additives. Toxicological Evaluation of Certain Food Additives and Contaminants in Foods; WHO Food Additives Series: Geneva, Switzerland, 1996. [Google Scholar]
  48. Joint, F.A.O.; WHO Expert Committee on Food Additives. Toxicological Evaluation of Certain Food Additives and Contaminants; World Health Organization: Geneva, Switzerland, 1993. [Google Scholar]
  49. Blunden, S.; Wallace, T. Tin in canned food: A review and understanding of occurrence and effect. Food Chem. Toxicol. 2003, 41, 1651–1662. [Google Scholar] [CrossRef]
  50. Codex Committee on Contaminants in Foods (CCCF). Joint FAO/WHO Food Standards Programme Codex Committee on Contaminants in Foods; 5th session; Codex Committee on Contaminants in Foods (CCCF): Washington, DC, USA, 2011; pp. 21–25. [Google Scholar]
  51. Adams, F.; Blunden, S.J.; van Cleuvenbergen, R.; Evans, C.; Fishbein, L.; Rickenbacher, U.-J.; Schlatter, C.; Steinegger, A. Anthropogenic Compounds; Springer: Berlin, Germany, 2013; Volume 3. [Google Scholar]
  52. Weber, G. Speciation of tin in lemon juice: An example of trace metal speciation in food. Anal. Chim. Acta 1987, 200, 79–88. [Google Scholar] [CrossRef]
  53. Horio, T.; Iwamoto, Y.; Miyazaki, M. Studies on the internal corrosion of plain tinplate cans. In Proceedings of the 6th International Congress on Canned Foods, Tangerang, Indonesia, 4–5 August 2021. [Google Scholar]
  54. Biégo, G.; Joyeux, M.; Hartemann, P.; Debry, G. Determination of dietary tin intake in an adult French citizen. Arch. Environ. Contam. Toxicol. 1999, 36, 227–232. [Google Scholar] [CrossRef] [PubMed]
  55. Rojas, E.; Herrera, L.A.; Poirier, L.A.; Ostrosky-Wegman, P. Are metals dietary carcinogens? Mutat. Res. Genet. Toxicol. Environ. Mutagen. 1999, 443, 157–181. [Google Scholar] [CrossRef]
  56. Fišera, M.; Kráčmar, S.; Velichová, H.; Fišerová, L.; Burešová, P.; Tvrzník, P. Tin compounds in food-their distribution and determination. Potravin. Slovak J. Food Sci. 2019, 13, 369–377. [Google Scholar] [CrossRef] [PubMed]
  57. Ostrakhovitch, E.A. Tin. In Handbook on the Toxicology of Metals; Elsevier: Amsterdam, The Netherlands, 2022; pp. 807–856. [Google Scholar]
  58. Alamri, M.; Qasem, A.A.; Mohamed, A.A.; Hussain, S.; Ibraheem, M.A.; Shamlan, G.; Alqah, H.A.; Qasha, A.S. Food packaging’s materials: A food safety perspective. Saudi J. Biol. Sci. 2021, 28, 4490–4499. [Google Scholar] [CrossRef] [PubMed]
  59. Sharma, M.; Kumar, P. Biochemical alteration of mustard grown under tin contaminated soil. Plant Arch. 2020, 20, 3487–3492. [Google Scholar]
  60. Greger, J.L. Tin and aluminum. In Trace Minerals in Foods; CRC Press: Boca Raton, FL, USA, 2020; pp. 291–323. [Google Scholar]
  61. Markesbery, W.R. Elevated manganese levels associated with dementia and extrapyramidal signs. Neurology 1977, 27, 213. [Google Scholar] [CrossRef]
  62. Calne, D.; Chu, N.; Huang, C.; Lu, C.; Olanow, W. Manganism and idiopathic parkinsonism: Similarities and differences. Neurology 1994, 44, 1583–1586. [Google Scholar] [CrossRef]
  63. Chia, S.-E.; Gan, S.-L.; Chua, L.-H.; Foo, S.-C.; Jeyaratnam, J. Postural stability among manganese exposed workers. Neurotoxicology 1995, 16, 519–526. [Google Scholar]
  64. Cook, D.G.; Fahn, S.; Brait, K.A. Chronic manganese intoxication. Arch. Neurol. 1974, 30, 59–64. [Google Scholar] [CrossRef]
  65. Russell, R.; Beard, J.L.; Cousins, R.J.; Dunn, J.T.; Ferland, G.; Hambidge, K.; Lynch, S.; Penland, J.; Ross, A.; Stoecker, B. Dietary Reference Intakes for Vitamin A, Vitamin K, Arsenic, Boron, Chromium, Copper, Iodine, Iron, Manganese, Molybdenum, Nickel, Silicon, Vanadium, and Zinc. 2001; p. 797. Available online: https://www.ncbi.nlm.nih.gov/books/NBK222310/?report=reader (accessed on 30 October 2022).
  66. Gibson, R.S. Content and bioavailability of trace elements in vegetarian diets. Am. J. Clin. Nutr. 1994, 59, 1223S–1232S. [Google Scholar] [CrossRef]
  67. Hurley, L.S. Teratogenic aspects of manganese, zinc, and copper nutrition. Physiol. Rev. 1981, 61, 249–295. [Google Scholar] [CrossRef] [PubMed]
  68. Friedman, B.; Freeland-Graves, J.H.; Bales, C.W.; Behmardi, F.; Shorey-Kutschke, R.L.; Willis, R.A.; Crosby, J.B.; Trickett, P.C.; Houston, S.D. Manganese balance and clinical observations in young men fed a manganese-deficient diet. J. Nutr. 1987, 117, 133–143. [Google Scholar] [CrossRef] [PubMed]
  69. Freeland-Graves, J.; Llanes, C. Models to Study Manganese Deficiency; CRC Press: Boca Raton, FL, USA, 1994. [Google Scholar]
  70. Freeland-Graves, J.; Mertz, W.; Abernathy, C.; Olin, S. Derivation of manganese safe and adequate daily dietary intakes. In Risk Assessment of Essential Elements; ILSI Press: Washington, DC, USA, 1994; pp. 237–252. [Google Scholar]
  71. Klimis-Tavantzis, D.; Leach, R., Jr.; Kris-Etherton, P. The effect of dietary manganese deficiency on cholesterol and lipid metabolism in the Wistar rat and in the genetically hypercholesterolemic RICO rat. J. Nutr. 1983, 113, 328–336. [Google Scholar] [CrossRef] [PubMed]
  72. Schoenthaler, S.J.; Bier, I.D. The effect of vitamin-mineral supplementation on juvenile delinquincy among American schoolchildren: A randomized, double-blind placebo-controlled trial. J. Altern. Complement. Med. 2000, 6, 7–17. [Google Scholar] [CrossRef]
  73. Cromwell, P.F.; Abadie, B.R.; Stephens, J.T.; Kyler, M. Hair mineral analysis: Biochemical imbalances and violent criminal behavior. Psychol. Rep. 1989, 64, 259–266. [Google Scholar] [CrossRef] [PubMed]
  74. Gottschalk, L.A.; Rebello, T.; Buchsbaum, M.S.; Tucker, H.G.; Hodges, E.L. Abnormalities in hair trace elements as indicators of aberrant behavior. Compr. Psychiatry 1991, 32, 229–237. [Google Scholar] [CrossRef] [PubMed]
  75. Finley, J.W.; Penland, J.G.; Pettit, R.E.; Davis, C.D. Dietary manganese intake and type of lipid do not affect clinical or neuropsychological measures in healthy young women. J. Nutr. 2003, 133, 2849–2856. [Google Scholar] [CrossRef]
  76. Greger, J. Dietary standards for manganese: Overlap between nutritional and toxicological studies. J. Nutr. 1998, 128, 368S–371S. [Google Scholar] [CrossRef]
  77. Ochmański, W.; Barabasz, W. Aluminum—occurrence and toxicity for organisms. Przegla̧d Lek. 2000, 57, 665–668. [Google Scholar]
  78. Bratakos, S.M.; Lazou, A.E.; Bratakos, M.S.; Lazos, E.S. Aluminium in food and daily dietary intake estimate in Greece. Food Addit. Contam. Part B 2012, 5, 33–44. [Google Scholar] [CrossRef]
  79. Sato, K.; Suzuki, I.; Kubota, H.; Furusho, N.; Inoue, T.; Yasukouchi, Y.; Akiyama, H. Estimation of daily aluminum intake in Japan based on food consumption inspection results: Impact of food additives. Food Sci. Nutr. 2014, 2, 389–397. [Google Scholar] [CrossRef]
  80. Al Zubaidy, E.A.; Mohammad, F.S.; Bassioni, G. Effect of pH, salinity and temperature on aluminum cookware leaching during food preparation. Int. J. Electrochem. Sci. 2011, 6, 6424–6441. [Google Scholar] [CrossRef]
  81. Ieggli, C.V.; Bohrer, D.; do Nascimento, P.C.; de Carvalho, L.M.; Gobo, L.A. Determination of aluminum, copper and manganese content in chocolate samples by graphite furnace atomic absorption spectrometry using a microemulsion technique. J. Food Compos. Anal. 2011, 24, 465–468. [Google Scholar] [CrossRef]
  82. Nanda, B.; Biswal, R.; Acharya, R.; Rao, J.; Pujari, P. Determination of aluminium contents in selected food samples by instrumental neutron activation analysis. J. Radioanal. Nucl. Chem. 2014, 302, 1471–1474. [Google Scholar] [CrossRef]
  83. Stahl, T.; Taschan, H.; Brunn, H. Aluminium content of selected foods and food products. Environ. Sci. Eur. 2011, 23, 37. [Google Scholar] [CrossRef]
  84. Pennington, J.A. Aluminium content of foods and diets. Food Addit. Contam. 1988, 5, 161–232. [Google Scholar] [CrossRef] [PubMed]
  85. López, F.F.; Cabrera, C.; Lorenzo, M.L.; López, M.C. Aluminium levels in spices and aromatic herbs. Sci. Total Environ. 2000, 257, 191–197. [Google Scholar] [CrossRef]
  86. Aguilar, F.; Autrup, H.; Barlow, S.; Castle, L.; Crebelli, R.; Dekant, W.; Engel, K.-H.; Gontard, N.; Gott, D.; Grilli, S. Annex of the opinion on Safety of aluminium from dietary intake Scientific Opinion of the Panel on Food Additives, Flavourings, Processing Aids and Food Contact Materials (AFC). EFSA J. 2008, 754, 1–34. [Google Scholar]
  87. Stahl, T.; Falk, S.; Rohrbeck, A.; Georgii, S.; Herzog, C.; Wiegand, A.; Hotz, S.; Boschek, B.; Zorn, H.; Brunn, H. Migration of aluminum from food contact materials to food—A health risk for consumers? Part I of III: Exposure to aluminum, release of aluminum, tolerable weekly intake (TWI), toxicological effects of aluminum, study design, and methods. Environ. Sci. Eur. 2017, 29, 19. [Google Scholar] [CrossRef]
  88. Soni, M.G.; White, S.M.; Flamm, W.G.; Burdock, G.A. Safety evaluation of dietary aluminum. Regul. Toxicol. Pharmacol. 2001, 33, 66–79. [Google Scholar] [CrossRef]
  89. Yokel, R.A. Aluminum in Food–the Nature and Contribution of Food Additives; Intech: Rijeka, Croatia, 2012; Volume 203. [Google Scholar]
  90. Greger, J. Aluminum metabolism. Annu. Rev. Nutr. 1993, 13, 43–63. [Google Scholar] [CrossRef] [PubMed]
  91. Stahl, T.; Falk, S.; Rohrbeck, A.; Georgii, S.; Herzog, C.; Wiegand, A.; Hotz, S.; Boschek, B.; Zorn, H.; Brunn, H. Migration of aluminum from food contact materials to food—A health risk for consumers? Part III of III: Migration of aluminum to food from camping dishes and utensils made of aluminum. Environ. Sci. Eur. 2017, 29, 17. [Google Scholar] [CrossRef] [PubMed]
  92. Zhang, H.; Zhang, J.Y.; Wang, H.L.; Luo, P.J.; Zhang, J.B. The revision of aluminum-containing food additive provisions in China. Biomed. Environ. Sci. 2016, 29, 461–466. [Google Scholar] [CrossRef] [PubMed]
  93. Stahl, T.; Falk, S.; Taschan, H.; Boschek, B.; Brunn, H. Evaluation of human exposure to aluminum from food and food contact materials. Eur. Food Res. Technol. 2018, 244, 2077–2084. [Google Scholar] [CrossRef]
  94. Starska, K. Aluminum in food. Rocz. Panstw. Zakl. Hig. 1993, 44, 55–63. [Google Scholar]
  95. Doisy, R.; Streeten, D.; Freiberg, J.; Schneider, A. Chromium metabolism in man and biochemical effects. Trace Elem. Hum. Health Dis. 2013, 2, 79–104. [Google Scholar]
  96. Brown, M.L. Present knowledge in nutrition. In International Life Science Institute-Nutrition Foundation; John Wiley & Sons: Hoboken, NJ, USA, 1990. [Google Scholar]
  97. Kumpulainen, J. Chromium content of foods and diets. Biol. Trace Elem. Res. 1992, 32, 9–18. [Google Scholar] [CrossRef] [PubMed]
  98. Mutuma, S.; Amuna, P.; Shukla, H.; Sumar, S. Chromium in food, nutrition and health-an introduction. Nutrition & Food Science 1999, 99, 81–88. [Google Scholar] [CrossRef]
  99. Values, G.B.P.o.D.R.; Health, G.B.D.o. Dietary Reference Values for Food Energy and Nutrients for the United Kingdom: Report of the Panel on Dietary Reference Values of the Committee on Medical Aspects of Food Policy; HM Stationery Office: Richmond, UK, 1991; Volume 41. [Google Scholar]
  100. Gad, S.C. Acute and chronic systemic chromium toxicity. Sci. Total Environ. 1989, 86, 149–157. [Google Scholar] [CrossRef]
  101. Fageria, N.; Santos, A.; Barbosa Filho, M.; Guimarães, C. Iron toxicity in lowland rice. J. Plant Nutr. 2008, 31, 1676–1697. [Google Scholar] [CrossRef]
  102. Audebert, A.; Sahrawat, K.L. Mechanisms for iron toxicity tolerance in lowland rice. J. Plant Nutr. 2000, 23, 1877–1885. [Google Scholar] [CrossRef]
  103. Becker, M.; Asch, F. Iron toxicity in rice—Conditions and management concepts. J. Plant Nutr. Soil Sci. 2005, 168, 558–573. [Google Scholar] [CrossRef]
  104. Schümann, K. Safety aspects of iron in food. Ann. Nutr. Metab. 2001, 45, 91–101. [Google Scholar] [CrossRef] [PubMed]
  105. Arias, V.O.; Som, L.V.; Rodríguez, V.Q.; Romero, R.G.; Muñoz, N.; Alarcón, M.N.; Vique, C.C. Nickel in food and influencing factors in its levels, intake, bioavailability and toxicity: A review. CyTA J. Food 2015, 13, 87–101. [Google Scholar] [CrossRef]
  106. Haber, L.T.; Bates, H.K.; Allen, B.C.; Vincent, M.J.; Oller, A.R. Derivation of an oral toxicity reference value for nickel. Regul. Toxicol. Pharmacol. 2017, 87, S1–S18. [Google Scholar] [CrossRef] [PubMed]
  107. Barceloux, D.G.; Barceloux, D. Nickel. J. Toxicol. Clin. Toxicol. 1999, 37, 239–258. [Google Scholar] [CrossRef] [PubMed]
  108. Da Costa, J.M. Observations on the Salts of Nickel, Especially the Bromide of Nickel; Sidney Kimmel Medical College: Philadelphia, PA, USA, 1883. [Google Scholar]
  109. Sunderman, F.W., Jr.; Dingle, B.; Hopfer, S.M.; Swift, T. Acute nickel toxicity in electroplating workers who accidently ingested a solution of nickel sulfate and nickel chloride. Am. J. Ind. Med. 1988, 14, 257–266. [Google Scholar] [CrossRef]
  110. Upadhyay, M.K.; Shukla, A.; Yadav, P.; Srivastava, S. A review of arsenic in crops, vegetables, animals and food products. Food Chem. 2019, 276, 608–618. [Google Scholar] [CrossRef]
  111. Duxbury, J.; Mayer, A.; Lauren, J.; Hassan, N. Food chain aspects of arsenic contamination in Bangladesh: Effects on quality and productivity of rice. J. Environ. Sci. Health Part A 2003, 38, 61–69. [Google Scholar] [CrossRef]
  112. Rehman, M.U.; Khan, R.; Khan, A.; Qamar, W.; Arafah, A.; Ahmad, A.; Ahmad, A.; Akhter, R.; Rinklebe, J.; Ahmad, P. Fate of arsenic in living systems: Implications for sustainable and safe food chains. J. Hazard. Mater. 2021, 417, 126050. [Google Scholar] [CrossRef]
  113. Mondal, D.; Rahman, M.M.; Suman, S.; Sharma, P.; Siddique, A.B.; Rahman, M.A.; Bari, A.F.; Kumar, R.; Bose, N.; Singh, S.K.; et al. Arsenic exposure from food exceeds that from drinking water in endemic area of Bihar, India. Sci. Total Environ. 2021, 754, 142082. [Google Scholar] [CrossRef] [PubMed]
  114. Halder, D.; Bhowmick, S.; Biswas, A.; Chatterjee, D.; Nriagu, J.; Guha Mazumder, D.N.; Šlejkovec, Z.; Jacks, G.; Bhattacharya, P. Risk of arsenic exposure from drinking water and dietary components: Implications for risk management in rural Bengal. Environ. Sci. Technol. 2013, 47, 1120–1127. [Google Scholar] [CrossRef] [PubMed]
  115. WHO. Guidelines for Drinking-Water Quality; World Health Organization: Geneva, Switzerland, 2004; Volume 1. [Google Scholar]
  116. WHO. Guidelines for Drinking Water Quality; WHO: Geneva, Switzerland, 2011; Volume 4. [Google Scholar]
  117. Tyagi, N.; Raghuvanshi, R.; Upadhyay, M.K.; Srivastava, A.K.; Suprasanna, P.; Srivastava, S. Elemental (As, Zn, Fe and Cu) analysis and health risk assessment of rice grains and rice based food products collected from markets from different cities of Gangetic basin, India. J. Food Compos. Anal. 2020, 93, 103612. [Google Scholar] [CrossRef]
  118. Liu, J.; Song, W.; Li, Y.; Wang, Y.; Cui, Y.; Huang, J.; Wang, Q.; Wei, S. Burden of Coronary Heart Disease and Cancer from Dietary Exposure to Inorganic Arsenic in Adults in China, 2016. Ann. Glob. Health 2022, 88, 28. [Google Scholar] [CrossRef] [PubMed]
  119. Carbonell-Barrachina, Á.A.; Burló, F.; Valero, D.; López, E.; Martínez-Romero, D.; Martínez-Sánchez, F. Arsenic toxicity and accumulation in turnip as affected by arsenic chemical speciation. J. Agric. Food Chem. 1999, 47, 2288–2294. [Google Scholar] [CrossRef]
  120. Snedeker, S.M. Antimony in food contact materials and household plastics: Uses, exposure, and health risk considerations. In Toxicants in Food Packaging and Household Plastics; Springer: Berlin, Germany, 2014; pp. 205–230. [Google Scholar]
  121. FDA. List of Indirect Additives Used in Food Contact Substances; FDA: Silver Spring, MA, USA, 2011. [Google Scholar]
  122. Pearson, A.J.; Ashmore, E. Risk assessment of antimony, barium, beryllium, boron, bromine, lithium, nickel, strontium, thallium and uranium concentrations in the New Zealand diet. Food Addit. Contam. Part A 2020, 37, 451–464. [Google Scholar] [CrossRef]
  123. Ekhator, O.; Udowelle, N.; Igbiri, S.; Asomugha, R.; Igweze, Z.; Orisakwe, O. Safety evaluation of potential toxic metals exposure from street foods consumed in mid-west Nigeria. J. Environ. Public Health 2017, 2017, 8458057. [Google Scholar] [CrossRef]
  124. Chapa-Martínez, C.; Hinojosa-Reyes, L.; Hernández-Ramírez, A.; Ruiz-Ruiz, E.; Maya-Treviño, L.; Guzmán-Mar, J. An evaluation of the migration of antimony from polyethylene terephthalate (PET) plastic used for bottled drinking water. Sci. Total Environ. 2016, 565, 511–518. [Google Scholar] [CrossRef]
  125. Carneado, S.; Hernández-Nataren, E.; López-Sánchez, J.; Sahuquillo, A. Migration of antimony from polyethylene terephthalate used in mineral water bottles. Food Chem. 2015, 166, 544–550. [Google Scholar] [CrossRef]
  126. Tinggi, U. Selenium toxicity and its adverse health effects. In Reviews in Food and Nutrition Toxicity; CRC Press: Boca Raton, FL, USA, 2005; pp. 29–56. [Google Scholar]
  127. Navarro-Alarcon, M.; Cabrera-Vique, C. Selenium in food and the human body: A review. Sci. Total Environ. 2008, 400, 115–141. [Google Scholar] [CrossRef]
  128. Reilly, C. Selenium in Food and Health; Kluwer Academic/Plenum Publishers: Amsterdam, The Netherlands, 1996. [Google Scholar]
  129. Kieliszek, M. Selenium–fascinating microelement, properties and sources in food. Molecules 2019, 24, 1298. [Google Scholar] [CrossRef] [PubMed]
  130. Thiry, C.; Ruttens, A.; De Temmerman, L.; Schneider, Y.-J.; Pussemier, L. Current knowledge in species-related bioavailability of selenium in food. Food Chem. 2012, 130, 767–784. [Google Scholar] [CrossRef]
  131. Board, F.N. Dietary reference intakes for vitamin C, vitamin E, selenium, and carotenoids. Natl. Acad. Sci. 2000, 19, 95–185. [Google Scholar]
  132. García, R.; Báez, A. Atomic absorption spectrometry (AAS). At. Absorpt. Spectrosc. 2012, 1, 1–13. [Google Scholar]
  133. Jorhem, L. Determination of metals in foods by atomic absorption spectrometry after dry ashing: NMKL1 collaborative study. J. AOAC Int. 2000, 83, 1204–1211. [Google Scholar] [CrossRef] [PubMed]
  134. Ghaedi, M.; Shokrollahi, A.; Kianfar, A.; Mirsadeghi, A.; Pourfarokhi, A.; Soylak, M. The determination of some heavy metals in food samples by flame atomic absorption spectrometry after their separation-preconcentration on bis salicyl aldehyde, 1, 3 propan diimine (BSPDI) loaded on activated carbon. J. Hazard. Mater. 2008, 154, 128–134. [Google Scholar] [CrossRef] [PubMed]
  135. Soylak, M.; Aydin, A. Determination of some heavy metals in food and environmental samples by flame atomic absorption spectrometry after coprecipitation. Food Chem. Toxicol. 2011, 49, 1242–1248. [Google Scholar] [CrossRef]
  136. Bagheri, H.; Afkhami, A.; Saber-Tehrani, M.; Khoshsafar, H. Preparation and characterization of magnetic nanocomposite of Schiff base/silica/magnetite as a preconcentration phase for the trace determination of heavy metal ions in water, food and biological samples using atomic absorption spectrometry. Talanta 2012, 97, 87–95. [Google Scholar] [CrossRef]
  137. Tüzen, M. Determination of heavy metals in fish samples of the middle Black Sea (Turkey) by graphite furnace atomic absorption spectrometry. Food Chem. 2003, 80, 119–123. [Google Scholar] [CrossRef]
  138. Wagner, K.; Batchelor, J.; Jones, B. A Rowland Circle, multielement graphite furnace atomic absorption spectrometer. Spectrochim. Acta Part B At. Spectrosc. 1998, 53, 1805–1813. [Google Scholar] [CrossRef]
  139. Harvey, D. Modern Analytical Chemistry; McGraw-Hill: New York, NY, USA, 2000; Volume 1. [Google Scholar]
  140. Skoog, D.A.; Holler, F.J.; Crouch, S.R. Principles of Instrumental Analysis, 5th ed.; Thomson Brooks: Sydney, Australia, 1998. [Google Scholar]
  141. Ferreira, S.L.; Bezerra, M.A.; Santos, A.S.; dos Santos, W.N.; Novaes, C.G.; de Oliveira, O.M.; Oliveira, M.L.; Garcia, R.L. Atomic absorption spectrometry–A multi element technique. TrAC Trends Anal. Chem. 2018, 100, 1–6. [Google Scholar] [CrossRef]
  142. Gore, M. Spectrophotometry and Spectrofluorimetry: A Practical Approach; OUP: Oxford, UK, 2000; Volume 225. [Google Scholar]
  143. Andrade-Eiroa, A.; de-Armas, G.; Estela, J.-M.; Cerda, V. Critical approach to synchronous spectrofluorimetry. II. TrAC Trends Anal. Chem. 2010, 29, 902–927. [Google Scholar] [CrossRef]
  144. Tabrizi, A.B. Cloud point extraction and spectrofluorimetric determination of aluminium and zinc in foodstuffs and water samples. Food Chem. 2007, 100, 1698–1703. [Google Scholar] [CrossRef]
  145. Zeeb, M.; Ganjali, M.R.; Norouzi, P.; Kalaee, M.R. Separation and preconcentration system based on microextraction with ionic liquid for determination of copper in water and food samples by stopped-flow injection spectrofluorimetry. Food Chem. Toxicol. 2011, 49, 1086–1091. [Google Scholar] [CrossRef] [PubMed]
  146. Ahmed, M.J.; Afrin, A.; Akhtar, Y. A Highly Sensitive and Selective Spectrofluorimetric Method for the Determination of Vanadium at Pico-Trace Levels in Some Real, Environmental, Biological, Soil and Food Samples Using 2-(α-Pyridyl)-Thioquinaldinamide. Am. J. Anal. Chem. 2019, 10, 528–561. [Google Scholar] [CrossRef]
  147. López-López, J.A.; Borrego-Corchado, C.; Mánuel, M.P.; Espada-Bellido, E. A simple and economical spectrofluorimetric alternative for Al routine analysis in seafood. Talanta 2018, 182, 210–217. [Google Scholar] [CrossRef]
  148. Nahata, A. Spectrofluorimetry as an analytical tool. Pharm Anal Acta 2011, 2, 1–2. [Google Scholar] [CrossRef]
  149. Ammann, A.A. Inductively coupled plasma mass spectrometry (ICP MS): A versatile tool. J. Mass Spectrom. 2007, 42, 419–427. [Google Scholar] [CrossRef]
  150. Pröfrock, D.; Prange, A. Inductively coupled plasma-mass spectrometry (ICP-MS) for quantitative analysis in environmental and life sciences: A review of challenges, solutions, and trends. Appl. Spectrosc. 2012, 66, 843–868. [Google Scholar] [CrossRef]
  151. Vincevica-Gaile, Z.; Klavins, M.; Rudovica, V.; Viksna, A. Research review trends of food analysis in Latvia: Major and trace element content. Environ. Geochem. Health 2013, 35, 693–703. [Google Scholar] [CrossRef]
  152. Stasinos, S.; Nasopoulou, C.; Tsikrika, C.; Zabetakis, I. The bioaccumulation and physiological effects of heavy metals in carrots, onions, and potatoes and dietary implications for Cr and Ni: A review. J. Food Sci. 2014, 79, R765–R780. [Google Scholar] [CrossRef] [PubMed]
  153. Ebbs, S.; Talbott, J.; Sankaran, R. Cultivation of garden vegetables in Peoria Pool sediments from the Illinois River: A case study in trace element accumulation and dietary exposures. Environ. Int. 2006, 32, 766–774. [Google Scholar] [CrossRef]
  154. Şenol, F. Determination of Arsenic, Selenium and Cadmium in Some Turkish Spices by Inductively Coupled Plasma Mass Spectrometry. Ph.D. Thesis, Middle East Technical University, Çankaya/Ankara, Turkey, 2010. [Google Scholar]
  155. Nuttall, K.L.; Gordon, W.H.; Ash, K.O. Inductively coupled plasma mass spectrometry for trace element analysis in the clinical laboratory. Ann. Clin. Lab. Sci. 1995, 25, 264–271. [Google Scholar] [PubMed]
  156. Waldron, K.J.; Rutherford, J.C.; Ford, D.; Robinson, N.J. Metalloproteins and metal sensing. Nature 2009, 460, 823–830. [Google Scholar] [CrossRef] [PubMed]
  157. Bishop, D.P.; Hare, D.J.; Clases, D.; Doble, P.A. Applications of liquid chromatography-inductively coupled plasma-mass spectrometry in the biosciences: A tutorial review and recent developments. TrAC Trends Anal. Chem. 2018, 104, 11–21. [Google Scholar] [CrossRef]
  158. Montes-Bayón, M.a.; DeNicola, K.; Caruso, J.A. Liquid chromatography–inductively coupled plasma mass spectrometry. J. Chromatogr. A 2003, 1000, 457–476. [Google Scholar] [CrossRef] [PubMed]
  159. Wang, T. Liquid chromatography–inductively coupled plasma mass spectrometry (LC–ICP–MS). J. Liq. Chromatogr. Relat. Technol. 2007, 30, 807–831. [Google Scholar] [CrossRef]
  160. Batista, B.L.; Rodrigues, J.L.; De Souza, S.S.; Souza, V.C.O.; Barbosa, F., Jr. Mercury speciation in seafood samples by LC–ICP-MS with a rapid ultrasound-assisted extraction procedure: Application to the determination of mercury in Brazilian seafood samples. Food Chem. 2011, 126, 2000–2004. [Google Scholar] [CrossRef] [PubMed]
  161. Ferreira, S.L.; Lemos, V.A.; Silva, L.O.; Queiroz, A.F.; Souza, A.S.; da Silva, E.G.; dos Santos, W.N.; das Virgens, C.F. Analytical strategies of sample preparation for the determination of mercury in food matrices—A review. Microchem. J. 2015, 121, 227–236. [Google Scholar] [CrossRef]
  162. Lorenc, W.; Hanć, A.; Sajnóg, A.; Barałkiewicz, D. LC/ICP-MS and complementary techniques in bespoke and nontargeted speciation analysis of elements in food samples. Mass Spectrom. Rev. 2022, 41, 32–50. [Google Scholar] [CrossRef]
  163. Batista, B.; Nacano, L.; De Souza, S.; Barbosa, F., Jr. Rapid sample preparation procedure for As speciation in food samples by LC-ICP-MS. Food Addit. Contam. Part A 2012, 29, 780–788. [Google Scholar] [CrossRef] [PubMed]
  164. Khan, N.; Ryu, K.Y.; Choi, J.Y.; Nho, E.Y.; Habte, G.; Choi, H.; Kim, M.H.; Park, K.S.; Kim, K.S. Determination of toxic heavy metals and speciation of arsenic in seaweeds from South Korea. Food Chem. 2015, 169, 464–470. [Google Scholar] [CrossRef] [PubMed]
  165. Koplik, R.; Klimešová, I.; Mališová, K.; Mestek, O. Determination of Mercury Species in Foodstuffs using LC-ICP-MS: The Applicability and Limitations of the Method. Czech J. Food Sci. 2014, 32, 249–259. [Google Scholar] [CrossRef]
  166. Jackson, B.P.; Liba, A.; Nelson, J. Advantages of reaction cell ICP-MS on doubly charged interferences for arsenic and selenium analysis in foods. J. Anal. At. Spectrom. 2015, 30, 1179–1183. [Google Scholar] [CrossRef]
  167. Hwang, I.M.; Lee, H.M.; Lee, H.-W.; Jung, J.-H.; Moon, E.W.; Khan, N.; Kim, S.H. Determination of Toxic Elements and Arsenic Species in Salted Foods and Sea Salt by ICP–MS and HPLC–ICP–MS. ACS Omega 2021, 6, 19427–19434. [Google Scholar] [CrossRef]
  168. Zmozinski, A.V.; Llorente-Mirandes, T.; López-Sánchez, J.F.; da Silva, M.M. Establishment of a method for determination of arsenic species in seafood by LC-ICP-MS. Food Chem. 2015, 173, 1073–1082. [Google Scholar] [CrossRef]
  169. Shimizu, F.M.; Braunger, M.L.; Riul, A., Jr. Heavy metal/toxins detection using electronic tongues. Chemosensors 2019, 7, 36. [Google Scholar] [CrossRef]
  170. Riul, A., Jr.; Dantas, C.A.; Miyazaki, C.M.; Oliveira, O.N., Jr. Recent advances in electronic tongues. Analyst 2010, 135, 2481–2495. [Google Scholar] [CrossRef]
  171. Wadehra, A.; Patil, P.S. Application of electronic tongues in food processing. Anal. Methods 2016, 8, 474–480. [Google Scholar] [CrossRef]
  172. Wardencki, W.; Chmiel, T.; Dymerski, T. Gas chromatography-olfactometry (GC-O), electronic noses (e-noses) and electronic tongues (e-tongues) for in vivo food flavour measurement. Instrum. Assess. Food Sens. Qual. 2013, 195–229. [Google Scholar] [CrossRef]
  173. Mourzina, Y.G.; Schubert, J.; Zander, W.; Legin, A.; Vlasov, Y.G.; Lüth, H.; Schöning, M.J. Development of multisensor systems based on chalcogenide thin film chemical sensors for the simultaneous multicomponent analysis of metal ions in complex solutions. Electrochim. Acta 2001, 47, 251–258. [Google Scholar] [CrossRef]
  174. Di Natale, C.; Macagnano, A.; Davide, F.; D’amico, A.; Legin, A.; Vlasov, Y.; Rudnitskaya, A.; Selezenev, B. Multicomponent analysis on polluted waters by means of an electronic tongue. Sens. Actuators B Chem. 1997, 44, 423–428. [Google Scholar] [CrossRef]
  175. Vlasov, Y.G.; Legin, A.; Rudnitskaya, A.; Di Natale, C.; D’AMICO, A. Multisensor system with an array of chemical sensors and artificial neural networks (electronic tongue) for quantitative analysis of multicomponent aqueous solutions. Russ. J. Appl. Chem. 1996, 69, 848–853. [Google Scholar]
  176. Legin, A.; Rudnitskaya, A.; Vlasov, Y.; Di Natale, C.; Davide, F.; D’Amico, A. Tasting of beverages using an electronic tongue. Sens. Actuators B Chem. 1997, 44, 291–296. [Google Scholar] [CrossRef]
  177. Men, H.; Zou, S.; Li, Y.; Wang, Y.; Ye, X.; Wang, P. A novel electronic tongue combined MLAPS with stripping voltammetry for environmental detection. Sens. Actuators B Chem. 2005, 110, 350–357. [Google Scholar] [CrossRef]
  178. Vlasov, Y.; Legin, A.; Rudnitskaya, A. Cross-sensitivity evaluation of chemical sensors for electronic tongue: Determination of heavy metal ions. Sens. Actuators B Chem. 1997, 44, 532–537. [Google Scholar] [CrossRef]
  179. Mortensen, J.; Legin, A.; Ipatov, A.; Rudnitskaya, A.; Vlasov, Y.; Hjuler, K. A flow injection system based on chalcogenide glass sensors for the determination of heavy metals. Anal. Chim. Acta 2000, 403, 273–277. [Google Scholar] [CrossRef]
  180. Cetó, X.; Del Valle, M. Phenolic compounds analyzed with an electronic tongue. In Electronic Noses and Tongues in Food Science; Elsevier: Amsterdam, The Netherlands, 2016; pp. 235–244. [Google Scholar]
  181. Wang, L.; Peng, X.; Fu, H.; Huang, C.; Li, Y.; Liu, Z. Recent advances in the development of electrochemical aptasensors for detection of heavy metals in food. Biosens. Bioelectron. 2020, 147, 111777. [Google Scholar] [CrossRef]
  182. Guo, W.; Zhang, C.; Ma, T.; Liu, X.; Chen, Z.; Li, S.; Deng, Y. Advances in aptamer screening and aptasensors’ detection of heavy metal ions. J. Nanobiotechnol. 2021, 19, 166. [Google Scholar] [CrossRef]
  183. Duan, N.; Wu, S.; Dai, S.; Gu, H.; Hao, L.; Ye, H.; Wang, Z. Advances in aptasensors for the detection of food contaminants. Analyst 2016, 141, 3942–3961. [Google Scholar] [CrossRef]
  184. Ye, B.-F.; Zhao, Y.-J.; Cheng, Y.; Li, T.-T.; Xie, Z.-Y.; Zhao, X.-W.; Gu, Z.-Z. Colorimetric photonic hydrogel aptasensor for the screening of heavy metal ions. Nanoscale 2012, 4, 5998–6003. [Google Scholar] [CrossRef]
  185. Zhang, K.; Li, H.; Wang, W.; Cao, J.; Gan, N.; Han, H. Application of multiplexed aptasensors in food contaminants detection. ACS Sens. 2020, 5, 3721–3738. [Google Scholar] [CrossRef]
  186. Poolsup, S.; Kim, C.-Y. Therapeutic applications of synthetic nucleic acid aptamers. Curr. Opin. Biotechnol. 2017, 48, 180–186. [Google Scholar] [CrossRef]
  187. Zhang, Y.; Lai, B.S.; Juhas, M. Recent advances in aptamer discovery and applications. Molecules 2019, 24, 941. [Google Scholar] [CrossRef]
  188. Yan, J.; Xiong, H.; Cai, S.; Wen, N.; He, Q.; Liu, Y.; Peng, D.; Liu, Z. Advances in aptamer screening technologies. Talanta 2019, 200, 124–144. [Google Scholar] [CrossRef]
  189. Liu, Q.; Wang, H.; Han, P.; Feng, X. Fluorescent aptasensing of chlorpyrifos based on the assembly of cationic conjugated polymer-aggregated gold nanoparticles and luminescent metal–organic frameworks. Analyst 2019, 144, 6025–6032. [Google Scholar] [CrossRef]
  190. Komarova, N.; Andrianova, M.; Glukhov, S.; Kuznetsov, A. Selection, characterization, and application of ssDNA aptamer against furaneol. Molecules 2018, 23, 3159. [Google Scholar] [CrossRef]
  191. Ho, L.S.J.; Fogel, R.; Limson, J.L. Generation and screening of histamine-specific aptamers for application in a novel impedimetric aptamer-based sensor. Talanta 2020, 208, 120474. [Google Scholar] [CrossRef]
  192. Luo, Z.; He, L.; Wang, J.; Fang, X.; Zhang, L. Developing a combined strategy for monitoring the progress of aptamer selection. Analyst 2017, 142, 3136–3139. [Google Scholar] [CrossRef]
  193. Boussebayle, A.; Groher, F.; Suess, B. RNA-based capture-SELEX for the selection of small molecule-binding aptamers. Methods 2019, 161, 10–15. [Google Scholar] [CrossRef]
  194. Xiong, Y.; Zhang, J.; Yang, Z.; Mou, Q.; Ma, Y.; Xiong, Y.; Lu, Y. Functional DNA regulated CRISPR-Cas12a sensors for point-of-care diagnostics of non-nucleic-acid targets. J. Am. Chem. Soc. 2019, 142, 207–213. [Google Scholar] [CrossRef]
  195. Babu, E.; Bhuvaneswari, J.; Mareeswaran, P.M.; Thanasekaran, P.; Lee, H.-M.; Rajagopal, S. Transition metal complexes based aptamers as optical diagnostic tools for disease proteins and biomolecules. Coord. Chem. Rev. 2019, 380, 519–549. [Google Scholar] [CrossRef]
  196. Ding, J.; Qin, W. Recent advances in potentiometric biosensors. TrAC Trends Anal. Chem. 2020, 124, 115803. [Google Scholar] [CrossRef]
  197. Liu, M.; Khan, A.; Wang, Z.; Liu, Y.; Yang, G.; Deng, Y.; He, N. Aptasensors for pesticide detection. Biosens. Bioelectron. 2019, 130, 174–184. [Google Scholar] [CrossRef]
  198. Alkhamis, O.; Canoura, J.; Yu, H.; Liu, Y.; Xiao, Y. Innovative engineering and sensing strategies for aptamer-based small-molecule detection. TrAC Trends Anal. Chem. 2019, 121, 115699. [Google Scholar] [CrossRef]
  199. Liu, B.; Liu, J. Sensors and biosensors based on metal oxide nanomaterials. TrAC Trends Anal. Chem. 2019, 121, 115690. [Google Scholar] [CrossRef]
  200. Mao, K.; Zhang, H.; Wang, Z.; Cao, H.; Zhang, K.; Li, X.; Yang, Z. Nanomaterial-based aptamer sensors for arsenic detection. Biosens. Bioelectron. 2020, 148, 111785. [Google Scholar] [CrossRef]
  201. Liu, Y.; Deng, Y.; Dong, H.; Liu, K.; He, N. Progress on sensors based on nanomaterials for rapid detection of heavy metal ions. Sci. China Chem. 2017, 60, 329–337. [Google Scholar] [CrossRef]
  202. Lan, L.; Yao, Y.; Ping, J.; Ying, Y. Recent progress in nanomaterial-based optical aptamer assay for the detection of food chemical contaminants. ACS Appl. Mater. Interfaces 2017, 9, 23287–23301. [Google Scholar] [CrossRef]
  203. Chen, Y.; Zhu, Q.; Zhou, X.; Wang, R.; Yang, Z. Reusable, facile, and rapid aptasensor capable of online determination of trace mercury. Environ. Int. 2021, 146, 106181. [Google Scholar] [CrossRef]
  204. Zhang, N.; Liu, B.; Cui, X.; Li, Y.; Tang, J.; Wang, H.; Zhang, D.; Li, Z. Recent advances in aptasensors for mycotoxin detection: On the surface and in the colloid. Talanta 2021, 223, 121729. [Google Scholar] [CrossRef] [PubMed]
  205. Kaur, H.; Shorie, M. Nanomaterial based aptasensors for clinical and environmental diagnostic applications. Nanoscale Adv. 2019, 1, 2123–2138. [Google Scholar] [CrossRef] [PubMed]
  206. Chen, X.; Zhao, Y.; Zhao, X.; Wu, J.; Zhu, L.; Zhang, X.; Wei, Z.; Liu, Y.; He, P. Selective pressures of heavy metals on microbial community determine microbial functional roles during composting: Sensitive, resistant and actor. J. Hazard. Mater. 2020, 398, 122858. [Google Scholar] [CrossRef]
  207. Li, L.; Xing, H.; Zhang, J.; Lu, Y. Functional DNA molecules enable selective and stimuli-responsive nanoparticles for biomedical applications. Acc. Chem. Res. 2019, 52, 2415–2426. [Google Scholar] [CrossRef]
  208. Sahai, N.; Gogoi, M.; Ahmad, N. Mathematical modeling and simulations for developing nanoparticle-based cancer drug delivery systems: A review. Curr. Pathobiol. Rep. 2021, 9, 1–8. [Google Scholar] [CrossRef]
  209. Arghya, S.; Suradip, D.; Pragya, S.; Utpal, B. Aptasensors in health, environment and food safety monitoring. Open J. Appl. Biosens. 2012, 2012, 21880. [Google Scholar] [CrossRef]
  210. Ullah, S.; Zahra, Q.u.a.; Mansoorianfar, M.; Hussain, Z.; Ullah, I.; Li, W.; Kamya, E.; Mehmood, S.; Pei, R.; Wang, J. Heavy Metal Ions Detection Using Nanomaterials-Based Aptasensors. Crit. Rev. Anal. Chem. 2022, 1–17. [Google Scholar] [CrossRef]
  211. Li, Z.; Mohamed, M.A.; Vinu Mohan, A.; Zhu, Z.; Sharma, V.; Mishra, G.K.; Mishra, R.K. Application of electrochemical aptasensors toward clinical diagnostics, food, and environmental monitoring. Sensors 2019, 19, 5435. [Google Scholar] [CrossRef]
  212. Rapini, R.; Marrazza, G. Electrochemical aptasensors for contaminants detection in food and environment: Recent advances. Bioelectrochemistry 2017, 118, 47–61. [Google Scholar] [CrossRef]
  213. Mishra, G.K.; Sharma, V.; Mishra, R.K. Electrochemical Aptasensors for Food and Environmental Safeguarding: A Review. Biosensors 2018, 8, 28. [Google Scholar] [CrossRef]
  214. Abd-Ellatief, R.; Abd-Ellatief, M.R. Electrochemical Aptasensors: Current Status and Future Perspectives. Diagnostics 2021, 11, 104. [Google Scholar] [CrossRef] [PubMed]
  215. Yaseen, T.; Sun, D.-W.; Cheng, J.-H. Raman imaging for food quality and safety evaluation: Fundamentals and applications. Trends Food Sci. Technol. 2017, 62, 177–189. [Google Scholar] [CrossRef]
  216. Lorenz, B.; Wichmann, C.; Stöckel, S.; Rösch, P.; Popp, J. Cultivation-Free Raman Spectroscopic Investigations of Bacteria. Trends Microbiol. 2017, 25, 413–424. [Google Scholar] [CrossRef] [PubMed]
  217. Jones, R.R.; Hooper, D.C.; Zhang, L.; Wolverson, D.; Valev, V.K. Raman Techniques: Fundamentals and Frontiers. Nanoscale Res. Lett. 2019, 14, 231. [Google Scholar] [CrossRef] [PubMed]
  218. Bodelón, G.; Montes-García, V.; Pérez-Juste, J.; Pastoriza-Santos, I. Surface-Enhanced Raman Scattering Spectroscopy for Label-Free Analysis of P. aeruginosa Quorum Sensing. Front. Cell Infect. Microbiol. 2018, 8, 143. [Google Scholar] [CrossRef]
  219. Petersen, M.; Yu, Z.; Lu, X. Application of Raman Spectroscopic Methods in Food Safety: A Review. Biosensors 2021, 11, 187. [Google Scholar] [CrossRef] [PubMed]
  220. Jiang, Y.; Sun, D.-W.; Pu, H.; Wei, Q. Surface enhanced Raman spectroscopy (SERS): A novel reliable technique for rapid detection of common harmful chemical residues. Trends Food Sci. Technol. 2018, 75, 10–22. [Google Scholar] [CrossRef]
  221. Huang, Y.; Wang, X.; Lai, K.; Fan, Y.; Rasco, B.A. Trace analysis of organic compounds in foods with surface-enhanced Raman spectroscopy: Methodology, progress, and challenges. Compr. Rev. Food Sci. Food Saf. 2020, 19, 622–642. [Google Scholar] [CrossRef]
  222. Wu, Y.; Jiang, T.; Wu, Z.; Yu, R. Novel ratiometric surface-enhanced raman spectroscopy aptasensor for sensitive and reproducible sensing of Hg(2). Biosens. Bioelectron. 2018, 99, 646–652. [Google Scholar] [CrossRef]
  223. Fan, M.; Andrade, G.F.S.; Brolo, A.G. A review on recent advances in the applications of surface-enhanced Raman scattering in analytical chemistry. Anal Chim Acta 2020, 1097, 1–29. [Google Scholar] [CrossRef]
  224. Song, D.; Yang, R.; Long, F.; Zhu, A. Applications of magnetic nanoparticles in surface-enhanced Raman scattering (SERS) detection of environmental pollutants. J. Environ. Sci. 2019, 80, 14–34. [Google Scholar] [CrossRef] [PubMed]
  225. Sacco, A.; Mangino, S.; Portesi, C.; Vittone, E.; Rossi, A.M. Novel Approaches in Tip-Enhanced Raman Spectroscopy: Accurate Measurement of Enhancement Factors and Pesticide Detection in Tip Dimer Configuration. J. Phys. Chem. C 2019, 123, 24723–24730. [Google Scholar] [CrossRef]
  226. Guo, Z.; Chen, P.; Yosri, N.; Chen, Q.; Elseedi, H.R.; Zou, X.; Yang, H. Detection of heavy metals in food and agricultural products by surface-enhanced Raman spectroscopy. Food Rev. Int. 2021, 1–22. [Google Scholar] [CrossRef]
  227. Yang, T.; Wang, P.; Guo, H.; He, L. Surface-Enhanced Raman Spectroscopy: A Tool for All Classes of Food Contaminants. 2017. Available online: https://www.tandfonline.com/doi/abs/10.1080/87559129.2021.1934005?journalCode=lfri20 (accessed on 10 June 2021).
  228. Xu, G.; Song, P.; Xia, L. Examples in the detection of heavy metal ions based on surface-enhanced Raman scattering spectroscopy. Nanophotonics 2021, 10, 4419–4445. [Google Scholar] [CrossRef]
  229. Sun, B.; Jiang, X.; Wang, H.; Song, B.; Zhu, Y.; Wang, H.; Su, Y.; He, Y. Surface-enhancement Raman scattering sensing strategy for discriminating trace mercuric ion (II) from real water samples in sensitive, specific, recyclable, and reproducible manners. Anal. Chem. 2015, 87, 1250–1256. [Google Scholar] [CrossRef]
  230. Kang, T.; Yoo, S.M.; Yoon, I.; Lee, S.; Choo, J.; Lee, S.Y.; Kim, B. Au nanowire-on-film SERRS sensor for ultrasensitive Hg2+ detection. Chemistry 2011, 17, 2211–2214. [Google Scholar] [CrossRef]
  231. Ding, X.; Kong, L.; Wang, J.; Fang, F.; Li, D.; Liu, J. Highly sensitive SERS detection of Hg2+ ions in aqueous media using gold nanoparticles/graphene heterojunctions. ACS Appl. Mater. Interfaces 2013, 5, 7072–7078. [Google Scholar] [CrossRef]
  232. Liu, M.; Wang, Z.; Zong, S.; Chen, H.; Zhu, D.; Wu, L.; Hu, G.; Cui, Y. SERS detection and removal of mercury(II)/silver(I) using oligonucleotide-functionalized core/shell magnetic silica sphere@Au nanoparticles. ACS Appl. Mater. Interfaces 2014, 6, 7371–7379. [Google Scholar] [CrossRef]
  233. Cecchini, M.P.; Turek, V.A.; Demetriadou, A.; Britovsek, G.; Welton, T.; Kornyshev, A.A.; Wilton-Ely, J.D.; Edel, J.B. Heavy metal sensing using self-assembled nanoparticles at a liquid–liquid interface. Adv. Opt. Mater. 2014, 2, 966–977. [Google Scholar] [CrossRef]
  234. Sarkar, S.; Pradhan, M.; Sinha, A.K.; Basu, M.; Pal, T. Selective and sensitive recognition of Cu2+ in an aqueous medium: A surface-enhanced Raman scattering (SERS)-based analysis with a low-cost Raman reporter. Chemistry 2012, 18, 6335–6342. [Google Scholar] [CrossRef]
  235. Ndokoye, P.; Ke, J.; Liu, J.; Zhao, Q.; Li, X. L-cysteine-modified gold nanostars for SERS-based copper ions detection in aqueous media. Langmuir ACS J. Surf. Colloids 2014, 30, 13491–13497. [Google Scholar] [CrossRef]
  236. Tang, W.; Chase, D.B.; Sparks, D.L.; Rabolt, J.F. Selective and Quantitative Detection of Trace Amounts of Mercury(II) Ion (Hg²⁺) and Copper(II) Ion (Cu²⁺) Using Surface-Enhanced Raman Scattering (SERS). Appl. Spectrosc. 2015, 69, 843–849. [Google Scholar] [CrossRef] [PubMed]
  237. Zamarion, V.M.; Timm, R.A.; Araki, K.; Toma, H.E. Ultrasensitive SERS nanoprobes for hazardous metal ions based on trimercaptotriazine-modified gold nanoparticles. Inorg. Chem. 2008, 47, 2934–2936. [Google Scholar] [CrossRef] [PubMed]
  238. Szlag, V.M.; Rodriguez, R.S.; He, J.; Hudson-Smith, N.; Kang, H.; Le, N.; Reineke, T.M.; Haynes, C.L. Molecular Affinity Agents for Intrinsic Surface-Enhanced Raman Scattering (SERS) Sensors. ACS Appl. Mater. Interfaces 2018, 10, 31825–31844. [Google Scholar] [CrossRef]
  239. Cheng, T.; Xu, Y.; Zhang, S.; Zhu, W.; Qian, X.; Duan, L. A highly sensitive and selective OFF-ON fluorescent sensor for cadmium in aqueous solution and living cell. J. Am. Chem. Soc. 2008, 130, 16160–16161. [Google Scholar] [CrossRef] [PubMed]
  240. Szabó, L.; Leopold, L.F.; Cozar, B.I.; Leopold, N.; Herman, K.; Chiş, V. SERS approach for Zn (II) detection in contaminated soil. Cent. Eur. J. Chem. 2011, 9, 410–414. [Google Scholar] [CrossRef]
  241. Jin, L.; She, G.; Mu, L.; Shi, W. Highly uniform indicator-mediated SERS sensor platform for the detection of Zn2+. RSC Adv. 2016, 6, 16555–16560. [Google Scholar] [CrossRef]
  242. Yin, J.; Wu, T.; Song, J.; Zhang, Q.; Liu, S.; Xu, R.; Duan, H. SERS-active nanoparticles for sensitive and selective detection of cadmium ion (Cd2+). Chem. Mater. 2011, 23, 4756–4764. [Google Scholar] [CrossRef]
  243. Tian, A.; Liu, Y.; Gao, J. Sensitive SERS detection of lead ions via DNAzyme based quadratic signal amplification. Talanta 2017, 171, 185–189. [Google Scholar] [CrossRef]
  244. Fu, C.; Xu, W.; Wang, H.; Ding, H.; Liang, L.; Cong, M.; Xu, S. DNAzyme-based plasmonic nanomachine for ultrasensitive selective surface-enhanced Raman scattering detection of lead ions via a particle-on-a-film hot spot construction. Anal. Chem. 2014, 86, 11494–11497. [Google Scholar] [CrossRef]
  245. Wang, Y.; Irudayaraj, J. A SERS DNAzyme biosensor for lead ion detection. Chem. Commun. 2011, 47, 4394–4396. [Google Scholar] [CrossRef] [PubMed]
  246. Du, J.; Jing, C. Preparation of Fe3O4@Ag SERS substrate and its application in environmental Cr(VI) analysis. J. Colloid Interface Sci. 2011, 358, 54–61. [Google Scholar] [CrossRef] [PubMed]
  247. Lv, B.; Sun, Z.; Zhang, J.; Jing, C. Multifunctional satellite Fe3O4-Au@ TiO2 nano-structure for SERS detection and photo-reduction of Cr (VI). Colloids Surf. A Physicochem. Eng. Asp. 2017, 513, 234–240. [Google Scholar] [CrossRef]
  248. Ji, W.; Wang, Y.; Tanabe, I.; Han, X.; Zhao, B.; Ozaki, Y. Semiconductor-driven “turn-off” surface-enhanced Raman scattering spectroscopy: Application in selective determination of chromium(vi) in water. Chem. Sci. 2015, 6, 342–348. [Google Scholar] [CrossRef] [PubMed]
  249. Zhang, Z.; Ma, P.; Li, J.; Sun, Y.; Shi, H.; Chen, N.; Zhang, X.; Chen, H. Colorimetric and SERS dual-mode detection of lead Ions based on Au-Ag core-shell nanospheres: Featuring quick screening with ultra-high sensitivity. Opt. Express 2019, 27, 29248–29260. [Google Scholar] [CrossRef]
  250. Li, S.; Xu, L.; Ma, W.; Kuang, H.; Wang, L.; Xu, C. Triple Raman Label-Encoded Gold Nanoparticle Trimers for Simultaneous Heavy Metal Ion Detection. Small 2015, 11, 3435–3439. [Google Scholar] [CrossRef]
  251. Li, D.; Ma, Y.; Duan, H.; Jiang, F.; Deng, W.; Ren, X. Fluorescent/SERS dual-sensing and imaging of intracellular Zn(2). Anal Chim Acta 2018, 1038, 148–156. [Google Scholar] [CrossRef]
  252. Eberhardt, K.; Stiebing, C.; Matthäus, C.; Schmitt, M.; Popp, J. Advantages and limitations of Raman spectroscopy for molecular diagnostics: An update. Expert Rev. Mol. Diagn. 2015, 15, 773–787. [Google Scholar] [CrossRef]
  253. Baranska, M.; Schütze, W.; Schulz, H. Determination of lycopene and beta-carotene content in tomato fruits and related products: Comparison of FT-Raman, ATR-IR, and NIR spectroscopy. Anal. Chem. 2006, 78, 8456–8461. [Google Scholar] [CrossRef]
  254. Kuswandi, B.; Nuriman; Huskens, J.; Verboom, W. Optical sensing systems for microfluidic devices: A review. Anal Chim Acta 2007, 601, 141–155. [Google Scholar] [CrossRef]
  255. Aiestaran, P.; Dominguez, V.; Arrue, J.; Zubia, J. A fluorescent linear optical fiber position sensor. Opt. Mater. 2009, 31, 1101–1104. [Google Scholar] [CrossRef]
  256. Vendrell, M.; Zhai, D.; Er, J.C.; Chang, Y.T. Combinatorial strategies in fluorescent probe development. Chem. Rev. 2012, 112, 4391–4420. [Google Scholar] [CrossRef] [PubMed]
  257. Tan, D.; He, Y.; Xing, X.; Zhao, Y.; Tang, H.; Pang, D. Aptamer functionalized gold nanoparticles based fluorescent probe for the detection of mercury (II) ion in aqueous solution. Talanta 2013, 113, 26–30. [Google Scholar] [CrossRef] [PubMed]
  258. Lakowicz, J.R. Principles of Fluorescence Spectroscopy; Springer: Berlin, Germany, 2006. [Google Scholar]
  259. Elosua, C.; De Acha, N.; Lopez-Torres, D.; Matias, I.; Arregui, F. Luminescent optical fiber oxygen sensor following layer-by-layer method. Procedia Eng. 2014, 87, 987–990. [Google Scholar] [CrossRef]
  260. Caselli, M. Porphyrin-based electrostatically self-assembled multilayers as fluorescent probes for mercury (ii) ions: A study of the adsorption kinetics of metal ions on ultrathin films for sensing applications. RSC Adv. 2015, 5, 1350–1358. [Google Scholar] [CrossRef]
  261. Yang, J.; Wang, Z.; Li, Y.; Zhuang, Q.; Zhao, W.; Gu, J. Porphyrinic MOFs for reversible fluorescent and colorimetric sensing of mercury (II) ions in aqueous phase. RSC Adv. 2016, 6, 69807–69814. [Google Scholar] [CrossRef]
  262. He, J.-L.; Zhu, S.-L.; Wu, P.; Li, P.-P.; Li, T.; Cao, Z. Enzymatic cascade based fluorescent DNAzyme machines for the ultrasensitive detection of Cu (II) ions. Biosens. Bioelectron. 2014, 60, 112–117. [Google Scholar] [CrossRef]
  263. Zhu, Y.F.; Wang, Y.S.; Zhou, B.; Yu, J.H.; Peng, L.L.; Huang, Y.Q.; Li, X.J.; Chen, S.H.; Tang, X.; Wang, X.F. A multifunctional fluorescent aptamer probe for highly sensitive and selective detection of cadmium(II). Anal. Bioanal. Chem. 2017, 409, 4951–4958. [Google Scholar] [CrossRef]
  264. Xu, H.; Miao, R.; Fang, Z.; Zhong, X. Quantum dot-based “turn-on” fluorescent probe for detection of zinc and cadmium ions in aqueous media. Anal. Chim. Acta 2011, 687, 82–88. [Google Scholar] [CrossRef]
  265. Cai, S.; Lu, Y.; He, S.; Wei, F.; Zhao, L.; Zeng, X. A highly sensitive and selective turn-on fluorescent chemosensor for palladium based on a phosphine-rhodamine conjugate. Chem. Commun. 2013, 49, 822–824. [Google Scholar] [CrossRef]
  266. Saleem, M.; Rafiq, M.; Hanif, M. Organic Material Based Fluorescent Sensor for Hg(2+): A Brief Review on Recent Development. J. Fluoresc. 2017, 27, 31–58. [Google Scholar] [CrossRef] [PubMed]
  267. Bai, C.B.; Xu, P.; Zhang, J.; Qiao, R.; Chen, M.Y.; Mei, M.Y.; Wei, B.; Wang, C.; Zhang, L.; Chen, S.S. Long-Wavelength Fluorescent Chemosensors for Hg(2+) based on Pyrene. ACS Omega 2019, 4, 14621–14625. [Google Scholar] [CrossRef]
  268. Bai, C.B.; Wang, W.G.; Zhang, J.; Wang, C.; Qiao, R.; Wei, B.; Zhang, L.; Chen, S.S.; Yang, S. A Fluorescent and Colorimetric Chemosensor for Hg(2+) Based on Rhodamine 6G With a Two-Step Reaction Mechanism. Front. Chem. 2020, 8, 14. [Google Scholar] [CrossRef] [PubMed]
  269. Lian, J.; Xu, Q.; Wang, Y.; Meng, F. Recent Developments in Fluorescent Materials for Heavy Metal Ions Analysis From the Perspective of Forensic Chemistry. Front. Chem. 2020, 8, 593291. [Google Scholar] [CrossRef] [PubMed]
  270. Shahzad, A.; Köhler, G.; Knapp, M.; Gaubitzer, E.; Puchinger, M.; Edetsberger, M. Emerging applications of fluorescence spectroscopy in medical microbiology field. J. Transl. Med. 2009, 7, 99. [Google Scholar] [CrossRef]
  271. Abernethy, D.R.; DeStefano, A.J.; Cecil, T.L.; Zaidi, K.; Williams, R.L. Metal impurities in food and drugs. Pharm. Res. 2010, 27, 750–755. [Google Scholar] [CrossRef] [PubMed]
  272. Buledi, J.A.; Amin, S.; Haider, S.I.; Bhanger, M.I.; Solangi, A.R. A review on detection of heavy metals from aqueous media using nanomaterial-based sensors. Environ. Sci. Pollut. Res. Int. 2021, 28, 58994–59002. [Google Scholar] [CrossRef]
  273. Hao, Y.; Wu, X.; Guo, Y. Study on test and detection method of mechanical properties of heavy metal contaminated soil. Soil Sediment Contam. Int. J. 2020, 29, 929–939. [Google Scholar] [CrossRef]
  274. Zhang, L.; Peng, D.; Liang, R.-P.; Qiu, J.-D. Graphene-based optical nanosensors for detection of heavy metal ions. TrAC Trends Anal. Chem. 2018, 102, 280–289. [Google Scholar] [CrossRef]
  275. Liu, X.; Yu, K.; Zhang, H.; Zhang, X.; Zhang, H.; Zhang, J.; Gao, J.; Li, N.; Jiang, J. A portable electromagnetic heating-microplasma atomic emission spectrometry for direct determination of heavy metals in soil. Talanta 2020, 219, 121348. [Google Scholar] [CrossRef]
  276. Pyo, J.; Hong, S.M.; Kwon, Y.S.; Kim, M.S.; Cho, K.H. Estimation of heavy metals using deep neural network with visible and infrared spectroscopy of soil. Sci. Total Environ. 2020, 741, 140162. [Google Scholar] [CrossRef] [PubMed]
Figure 1. The mechanism of Pb, Cd, Hg, Sn, and Mn and their side effects in different organs.
Sustainability 15 01195 g001
Figure 2. Different emerging techniques, including electrochemical aptasensors, AAS, spectrofluorimetry, inductively coupled plasma spectrometry, LC–ICP-MS, and e-tongues, and their role in determining heavy metals in different samples.
Sustainability 15 01195 g002
Disclaimer/Publisher’s Note: The statements, opinions and data contained in all publications are solely those of the individual author(s) and contributor(s) and not of MDPI and/or the editor(s). MDPI and/or the editor(s) disclaim responsibility for any injury to people or property resulting from any ideas, methods, instructions or products referred to in the content.

