Abstract
Continuous aggregation of socioeconomic factors is the key issue of sustainable development in urban agglomerations. To date, more attention has been paid to single urban agglomeration than to multiple agglomerations. In this paper, China’s 19 urban agglomerations were selected as the case study and their spatial differences in factors aggregating ability were portrayed comparatively. Firstly, the spatial pattern of urban factors aggregating ability is relatively well distributed in all China’s cases, most noticeably in the Yangtze River Delta urban agglomeration, closely followed by the Beijing-Tianjin-Hebei and the Pearl River Delta urban agglomerations. However, more significant differences on factors aggregating ability are noticeably seen between cities than among urban agglomerations. Meanwhile, the rank-size structure distribution of factors aggregating ability in China’s 19 cases is in line with the Zipf’s law of their urban systems, and divided into three types: Optimized, balanced, and discrete. Furthermore, the urban factors aggregation ability in one urban agglomeration is roughly negatively correlated with its primacy ratio of factors aggregating ability distribution. Lastly, urban agglomerations with higher average values of factors aggregating ability are concentrated on the three major urban agglomerations: The Yangtze River Delta, the Beijing-Tianjin-Hebei and the Pearl River Delta. Otherwise, high-high clusters in the three urban agglomerations are distinctly observed as well.
1. Introduction
Currently, a magnitude of socioeconomic factors, such as capital, labor, technology and information etc., are accelerating centralization in densely-populous and developed urbanized regions, which results in a higher ability to aggregate factors in these regions. Furthermore, the factors aggregating process positively accelerates the emergence and growth of various urban agglomerations [1], noticeably in high-speed developing countries like China. Therefore, factors aggregating ability is widely regarded as a way of identifying their sustainable development.
An urban agglomeration is a highly developed urbanized area consisted of integrated cities [2], similar to various terms including megalopolis [3], metropolitan belt [4], urban clusters [5], metropolitan regions [6], metropolitan areas [7], and others. Although it is still difficult to obtain a unified definition, it is generally viewed as an urbanized area filled by an integration of cities with huge population density and close interaction flows. In China, urban agglomerations are gradually becoming vital growth poles of new-style urbanization development and the main body of China’s participation in global competition, which depends on the support of continuous factor flows. Driven by “rent-seeking behavior” [8], variety of factors such as talents, technology, knowledge, information, and capital obey profit-seeking law, which leads to their continuous concentration on advantageous places [9]. As a result, the more competitive urban agglomerations tend to occupy a higher position in national urban systems and thus gain more developing opportunities. Moreover, their competitiveness and potential are accumulatively enlarged under the cyclical cumulative causal effect or Matthew effect. Therefore, the factors aggregating ability has become a key criterion to measure the sustainable competitiveness of urban agglomerations in national and inter-country competition contexts.
Although factors aggregating ability is specially measured and documented by few scholars at present, much more attention is paid to theoretically refer to factors and their aggregation, such as factor endowment theory and factor flow theory. Generally, factors were classified to primary production factors (i.e., general natural resources such as land, water, forests, minerals) and created production factors (including knowledge and technology, innovation, capital and facility, etc.) by Porter [10]. Oskenbayev et al. further pointed out that the role of the first factors such as land, oil and coal in promoting regional development has gradually weakened, while the later including capital, science and technology, talent, information, and institution factors has become increasingly decisive for regional development [11]. In the 1930s, Ohlin and Heckscher [12] proposed the factor endowment theory (H-O model), which indicates that one region with abundant low-cost production factors has an obvious cost advantage and competitive advantage. Russo & Musolino [13], and Trippl et al. [14] argued that urban economic growth depends on whether the city has factor endowments that are different from other cities. Then, the significant role of factors flows in economic development was extensively revealed. Chang & Oxley found that the inflow of young, energetic and skilled labor outside the region would form an agglomeration advantage and increase the growth rate of the entire national economy [15]. Hochman’s research on inter-city factor flows evidenced a significant difference in factor aggregating abilities between different levels and different regional cities [16]. Fu & Gabriel [17] certified that that in a stage with rapid development, the ability of a city to gather various factors was gradually enhanced, particularly in the clustering of capital and human resources. In recent decades, the agglomeration of factors has been well documented. More concerns are focused on created production factors than on primary factors, such as financial factors [18], talent factors [19], and technological innovation factors [20], among others. Some quantitative methods are introduced into the field. Alfaro & Chen [21] used the EDA method to construct a factors aggregation benefit evaluation model. Ellision [22] constructed the agglomerating index to comprehensively calculate and analyze the inter-urban differences of factors aggregating ability. Alternatively, a network analysis was introduced to visualize the factors clustering pattern in geospatial by Catini et al. [23].
In summary, the factors aggregating ability, referring to the ability of a city or urban region to aggregate socioeconomic factors flows, is extensively viewed as an indicator evaluating the competitiveness and sustainability of urban agglomerations. It has been well documented in the nexus with urban growth and regional development, along with national competition. However, to date, its measurement and mapping in urban agglomerations has been little done in detail. On the one hand, because of the limits of data mining, the calculation of factors aggregating ability needs still be improved. On the other hand, as pointed out by Hochman [16], there widely exists differences of ability between cities or regions, which isn’t portrayed well in spatial forms. Less attention has been paid to the geographical differences among urban agglomerations with different levels. So, several questions need to be answered urgently: How to comprehensively measure the factors aggregating ability based on the context of China’s urban agglomerations? What are their differences and on what grounds are these differences viewed? How can this be explained? Answers to these questions will bring new insights to sustainable development in urban agglomerations. Therefore, in this paper, first of all, we constructed a set of comprehensive index system for evaluating factors aggregating ability in urban agglomerations. Then, 19 major urban agglomerations in China were introduced to comparatively investigate their differences of factors aggregating ability from three perspectives, including hierarchical distribution, rank-size distribution, and spatial distribution.
2. Study Area and Data
2.1. Study Area
China’s “13th Five-Year Plan” issued by the National Development and Reform Commission of China (http://www.ndrc.gov.cn/zcfb/zcfbghwb/), has been proposed to promote the sustainable development of 19 key urban agglomerations, such as the Beijing-Tianjin-Hebei, the Yangtze River Delta, the Pearl River Delta, the Shandong Peninsula, West Coast of the Straits, Harbin-Changchun, Central-southern of Liaoning, Central Plains, the middle reaches of the Yangtze River, Chengdu-Chongqing, Central Shaanxi Plain, Beibu Gulf, the Jinzhong regions, Hohhot-Baotou-Ordos-Yulin, Central Guizhou, Central Yunnan, Lanzhou-Xining, and the areas along the Huanghe River in Ningxia, and the northern slopes of the Tianshan Mountains urban agglomerations (Figure 1), which include a total of 198 cities. In 2016, the 19 urban agglomerations had a population of 907 million, accounting for 65.58% of total GDP in China; their total GDP was 63.57 trillion CNY and 85.44% of total China. These urban agglomerations are the most fundamental areas supporting China’s land development and also play a vital role in China’s participation in global competition.
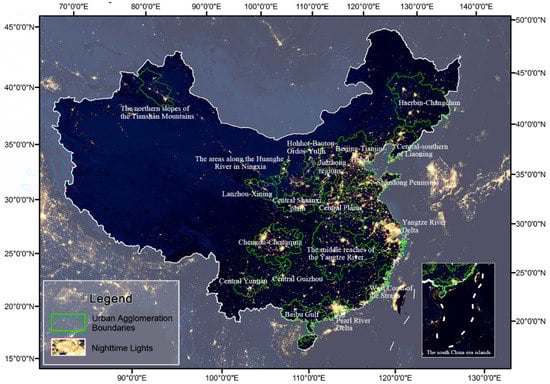
Figure 1.
Location of 19 urban agglomerations in China.
2.2. Data Sources
In the paper, the data of index system originated from two sources. Some statistical data were derived from the authoritative statistical yearbooks, including the 2017 China Urban Statistical Yearbook and the 2017 Provincial and Municipal Statistical Yearbook. The remainder of the data came from the Point of Interest (POI) data from AMAP (open electronic map) of the Alibaba Group (https://lbs.amap.com/console/show/picker), similar to Google. A POI data refers to a spatial landmark point on an electronic map based on Location Based Services (LBS) [24], and includes attribute features such as name, category, latitude and longitude, etc. As some of the most essential data for urban spatial analysis, POIs data could directly and effectively reflect the aggregation of various urban factors [25]. Since a POI data has a position attribute, it can be regarded as a point of a certain kind of factors, and the number of POIs (factors) in different areas can be obtained by the use of spatial statistics. For that reason, this paper used ArcGIS software to count the number of POIs of a certain kind of factors in China and an urban agglomeration, and calculated the proportion of the number of factors of the urban agglomeration to the total number of factors in China. As such, we obtained the index value of this kind of factors in the urban agglomeration. In the same way, the calculation of urban factors aggregating ability also adopted this method, that is, the values of evaluation indices were obtained by calculating the proportion of the number of factors of the city to the total number of factors in the urban agglomeration. By using data mining technology of web crawler, a total of 1.479 million POIs data was captured and retrieved in December 2016. To data processing, the basic data of each city were collected from the statistical yearbook and the electronic map POIs, and then aggregated into the data of the urban agglomerations. While, the national level data was directly obtained from the national statistical yearbook and the POIs in the country.
The vector data used in the mapping of this paper is derived from the 1:1 million basic geographic database (2015) of the National Basic Geographic Information Center in China (http://www.webmap.cn/commres.do?method=dataDownload), and the map projection type is Gauss-Kruger projection.
3. Methodologies
The purpose of this paper is to analyze the differences of factors aggregating ability among 19 urban agglomerations in China. In order to achieve this goal, as shown in Figure 2, we mainly designed the research framework from three methods: The evaluation model of factors aggregating ability, the Rank-size model and the Kernel Density Estimation model. Firstly, we constructed the evaluation model of factors aggregating ability by designing a comprehensive evaluation index system, in order to obtain the basic calculation result of the factors aggregating ability in urban agglomerations. Secondly, we used the calculation result data as the analysis source and introduced the Rank-size model and the Kernel Density Estimation model, to achieve the main research objective of this paper--interpreting the rank-size and the spatial differences of the factors aggregating ability among China’s urban agglomerations. Finally, we draw our conclusions. In the research process, the construction of the evaluation model of factors aggregating ability is the precondition and analysis basis for the use of the Rank-size model and the Kernel Density Estimation model.
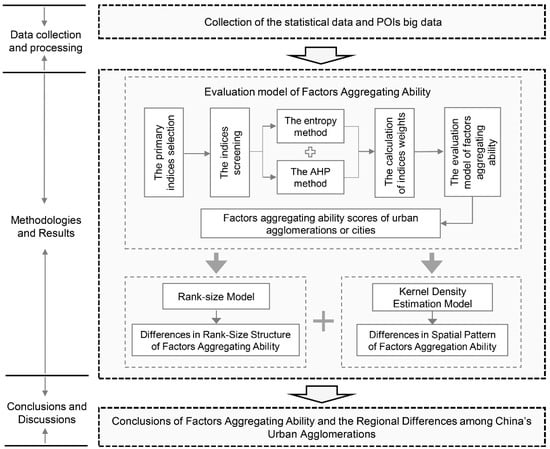
Figure 2.
Research framework.
3.1. Evaluation Model of Factors Aggregating Ability
In this paper, we constructed a measurement model of factors aggregating ability by designing a comprehensive evaluation indicator system and determining indices weights as follows: the primary indices selection, the indices screening, and the calculation of indices weights. First of all, in order to avoid subjectivity, the frequency statistics and expert consultation methods were implemented to design the index system. Plenty of indicators with high-frequency adoption or occurrence in literature were firstly selected and constructed a preliminary index system by using the frequency statistical method. Then, the preliminary indices were further modified based on expert comments in the expert consultation method. As a result, we initially identified an evaluation index system with 40 indices, including population, land, economy, facility, ecology, science and technology, and finance aspects, and so on.
We also re-screened and reduced the primary indices by calculating correlation coefficients, coefficient of variation and factor analysis, to avoid interdependence and duplication between indices. First, the indices value was standardized. Secondly, the correlation coefficient and coefficient of variation of each index were calculated separately. Then, those indices with correlation coefficient greater than 0.9 and lower coefficient of variation were excluded. Thirdly, factor analysis was used to determine the principal components of the index system that cannot be deleted. Finally, on the basis of the above, we deleted 14 indices, and constructed the comprehensive index system containing 26 indices (Table 1).

Table 1.
Comprehensive evaluation index system and index weight of factors aggregating ability.
Last but not least, we obtained the weights of indices by integrating subjective AHP weighting method and objective entropy weighting method, for the sake of avoiding their own disadvantages. Amongst them, the AHP method exists subjective judgments and random scoring problems despite of certain rationality in judging information importance. The entropy method may avoid the subjective problem, but easily ignores the difference in the actual importance of the indices.
First, the entropy method was used to calculate the index weights. The proportion yij of sample i under the j indicator was calculated by:
where n denotes the number of samples, m denotes the number of indicators, and x″ij represents the value of sample i of index j.
The information entropy ej of the j indicator was defined as:
where k = 1/ln(n), with 0 ≤ ej ≤ 1.
The difference coefficient gi of the j indicator gi was denoted as follows:
After normalizing the difference coefficient of each indicator, the entropy weight of the j indicator was calculated by [26]:
Besides, on the basis of the entropy weights, the AHP method is used to calculate the relative importance of each index to the criterion layer index. The weight coefficient ωbj of each index is determined.
Furthermore, the index weights ωaj and ωbj obtained from the two methods further determined the final weight of the index, defined as:
where , ωj > 0. By using the Lagrangian multiplier method, the final weight ωj was obtained as:
where ωaj is the index weight determined by the entropy method, and ωbj is the index weight determined by the AHP method.
On this basis, the evaluation model of factors aggregating ability was constructed as follows:
Factors aggregating ability of urban agglomerations represented the factors aggregating ability of one urban agglomeration in China compared to that of other urban agglomerations. Its main significance was reflected in the relative advantages or disadvantages of factors aggregation ability between urban groups [27]. The factors aggregating ability of urban agglomerations ranged from 0 to 1. The larger the A value is, the greater is the factors aggregating ability of urban agglomerations, and the stronger is the concentration of various factors.
3.2. Rank-Size Model
An urban agglomeration is a typical multi-level urban system composed of large, medium, and small cities. Consequently, in this study, the Lotka rank-size model was introduced into revealing the hierarchical distribution and the scale structure of urban factors aggregating ability [28,29,30], written by:
where n represents the number of cities and Ri represents the rank of factors aggregating ability of the city i in the urban agglomeration. Pi denotes the value of urban factors aggregating ability with the rank of Ri after sorting from the large to the small. P1 denotes the factors aggregating ability value of the first city. The parameter q denotes the Zipf’s coefficient. Through the logarithm processing, equator (7) was further transformed to:
where if q = 1, the aggregating characteristics of the urban factor aggregating ability is in an optimal distribution satisfying the Zipf’s criterion at this time. If q < 1, the scale distribution of urban factors aggregating ability is relatively concentrated with many middle-rank cities. If q > 1, the urban factors aggregating ability tends to be dispersed, and the differences among urban agglomerations are quite significant. The first city has a strong monopoly of factors aggregating ability as well.
3.3. Kernel Density Estimation
Kernel Density Estimation (KDE) analysis is a process of interpolating by the discrete point data or line data using the kernel function [31]. In this study, KDE was used to estimate the density distribution of urban factors aggregating ability. Let x1, …, xn be independent distribution samples extracted from the population with a distribution density function of f. Estimate the value f(x) of f at a point x, usually with the Rosenblatt-Parzen kernel estimation equation [32]:
where k denotes the kernel function; h > 0 denotes the bandwidth; (x − xi) denotes the distance from the estimated point to the sample xi; n is the number of known points in the bandwidth; and d is the dimension of the data.
In the KDE analysis, the bandwidth h has a greater impact on final calculation results. Generally, the smaller bandwidth is suitable to reflect local variation of the density distribution, and the larger bandwidth can effectively reflect spatial variation at global scale. In this study, the distributional difference of China’s 19 urban agglomerations needs be considered. The smallest length among the 19 urban agglomerations is about 400–500 km, therefore, it is necessary to avoid the spatial differentiation being over-enhanced or weakened. According to the study of bandwidth [33], we repeated test with several bandwidth of 80, 100, 120, 150 and 180 km, respectively and found that the KDEs remain stable between 100–180 km. Accordingly, a bandwidth of 120 km is more reasonable and appropriate to be adopted in this study.
4. Results
4.1. Differences in Hierarchical Distribution of Factors Aggregating Ability
Figure 3 shows the difference and hierarchical distribution of the factors aggregating ability among 19 urban agglomerations in China based on Equation (6). Statistically, as shown in Figure 3a, the difference of factors aggregating ability among the 19 cases isn’t relatively significant, except for the first-rank Yangtze River Delta urban agglomeration. The top three, consistent with current development status, are the three national-level urban agglomerations of the Yangtze River Delta, Beijing-Tianjin-Hebei and the Pearl River Delta. They are economically developed, densely populated, and open to the outside world. The cases in the middle rank include the middle reaches of the Yangtze River, Shandong Peninsula, Chengdu-Chongqing, West Coast of the Straits, Central Plains, Central-southern of Liaoning, and Harbin-Changchun, which are the key development areas in national land functional planning. The group with lower orders consisted of Central Shaanxi Plain, the northern slopes of Tianshan Mountains, Hohhot-Baotou-Ordos-Yulin, Lanzhou-Xining, Central Guizhou province, the Jinzhong regions, Central Yunnan, and the areas along the Huanghe River in Ningxia province. The vast majority of these areas are located in the western regions of China, and are viewed as the growth poles of their local regions.
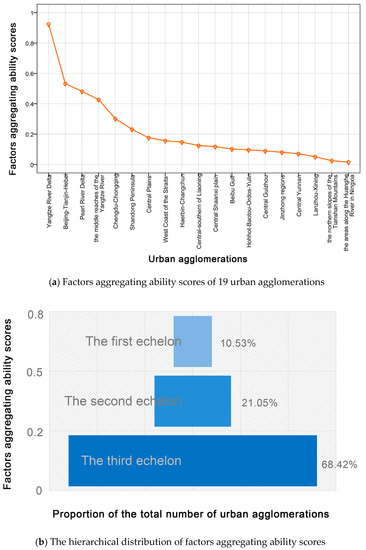
Figure 3.
The hierarchical distribution of factors aggregating ability among the 19 urban agglomerations.
On the basis of the comprehensive factors aggregating ability scores, China’s 19 major urban agglomerations can be roughly divided into three tiers (Figure 3b): In the first echelon, there are two cases accounting for 10.53%, that’s, the Yangtze River Delta and the Beijing-Tianjin-Hebei urban agglomerations, and their scores of the factors aggregating ability are above 0.5; the second echelon is composed of four urban agglomerations whose average scores are between 0.2 and 0.5, accounting for 21.05% of total number; the third echelon includes the rest of 19 cases with average sore below 0.2, accounting for 68.42%. According to their proportion, the three echelons are visualized as the “pyramid” distribution as shown in Figure 3b, which is in accordance with the current development level of China’s urban agglomerations. Most of urban agglomerations are still in the early and middle industrialization stages, with relatively lower factors aggregating ability. It will take a long period of improvement to continuously gather the various factors and further to promote the integration of urban agglomeration.
Table 2 illustrates the aggregating abilities between comprehensive factors and various factors. In the same way as the comprehensive factors, the aggregating ability of all kinds of factors among the 19 cases follows a decreasing gradient trend from the east to the west. That is, the factors aggregating ability of urban agglomerations in the eastern coastal areas is mostly at the highest level, which is followed by the cases in central China and in the western regions in turn. Meanwhile, the pyramid structure consisted of the three echelons is also observed in the aggregating ability distribution of all kinds of factors. Amongst them, the first echelon group of all factors is almost entirely composed of the three-big national urban agglomerations of the Yangtze River Delta, the Pearl River Delta, and the Beijing-Tianjin-Hebei regions. However, the number and distribution of urban agglomerations in the second echelon and the third echelon exhibit some differences among various factors. Specifically, there are larger differences in the second and third echelons of these factors including population, land, economy, public facilities, and ecological environment. Similar findings are seen in the third echelon of such factors as finance, scientific and technological innovation, economic openness, and culture.
Table 2.
Factors aggregating ability scores of 19 urban agglomerations in China.
Similarly, an obvious heterogeneity (polarization and hierarchy) of the factors aggregating ability among 198 cities is observed as well, as shown in Figure 4. The urban factors aggregating ability tends to exhibit a scale-free trait with better-fitting power-law distributions (Figure 4a), that’s, a few cities have higher scores of factors aggregating ability, which is similar to the rule of Pareto’s distribution. Only two megacities, Shanghai and Beijing, score above 0.5. Almost all of the cities have a lower factors aggregating ability. Obviously, the scores of 141 cities are much lower than the average of 0.0915 and there exists a huge gap with a few megacities such as Shanghai, Beijing, Guangzhou, and Shenzhen. As exhibited as Figure 3b, according to urban scores, these cities are divided into five echelons (greater than 0.5, 0.3–0.5, 0.2–0.3, 0.1–0.2, and less than 0.1), accounting for 1.01%, 3.03%, 5.05%, 16.16%, and 74.75%, respectively (Figure 4b).

Figure 4.
The hierarchical distribution of factors aggregating ability among the 198 cities.
To more intuitively compare the agglomeration characteristics of different factors, we calculated the variation coefficient of the 10 factors aggregating ability scores among 19 urban agglomerations and among 198 cities. Whether at the inter-city or inter-group level, the variation coefficient of the ability of technological innovation, opening-up, and finance factors are higher, indicating the pattern to be unevenly distributed, especially in larger cities and urban groups. Because of convenient interactions, well-developed public facilities, developed economies, and high input-output efficiency, they are appropriate to obtain more advantageous competitiveness when these factors are concentrated. At the same time, other kinds of factors with lower aggregating ability tend toward decentralization, such as population, economy, and public facilities, due to low requirements for location conditions and environmental factors.
4.2. Differences in Rank-Size Structure of Factors Aggregating Ability
Table 3 indicates the rank-size structure of factors aggregating ability in the 19 cases. In Table 3, most of the R2 values are mostly above 0.9, and the minimum R2 value is 0.764, with a good fitting degree, which indicates that the hierarchical distribution is basically in line with the Zipf’s law (Table 3). In accordance with their q values, the 19 urban agglomerations are divided into the five types with different characteristics of statistical distribution as follows. The first is optimized type structure, in line with 0.9 < q ≤ 1. There are 5 urban agglomerations, including the Beijing-Tianjin-Hebei, Chengdu-Chongqing, Central-southern of Liaoning, Central Shaanxi Plain, and Jinzhong urban agglomerations. It represents a more optimal rank-size structure that exhibits a well-fitting power-law distribution. The number of cities with high, medium, and low factors aggregating ability in urban agglomerations are relatively appropriate. The second is balanced type structure with q < 0.9. This type includes 5 urban agglomerations located in the western inland such as the northern slopes of the Tianshan Mountains, Lanzhou-Xining, Central Guizhou, Central Yunnan, and the areas along the Huanghe River in Ningxia. For this type, there are a majority of medium-and-small with weaker degree factors aggregating ability in these urban agglomerations, which is related to their development levels. The third is discrete type structure (q > 1) and includes 9 urban agglomerations such as the Yangtze River Delta, Pearl River Delta, the middle reaches of the Yangtze River, Shandong Peninsula, West Coast of the Straits, Central Plains, Harbin-Changchun, Beibu Gulf, Hohhot-Baotou-Ordos-Yulin. The distribution of urban factors aggregating ability in these urban agglomerations tends to be discrete. Few hub cities have stronger factors aggregating ability in the region, and greater magnetic forces to attract socioeconomic factors or flows, resulting in the cumulative Matthew effect.
Table 3.
Rank-size structures of factors aggregating ability of 19 urban agglomerations in China.
From the perspective of the primacy ratio, the factors aggregation ability of one urban agglomeration is negatively related to its primacy ratio (Table 3). Specifically, those urban agglomerations with larger factors aggregation ability, such as the Yangtze River Delta, the Pearl River Delta, Beijing-Tianjin-Hebei, the middle reaches of the Yangtze River, Shandong Peninsula, Chengdu-Chongqing, West Coast of the Straits, Central Plains, Central-southern of Liaoning, and Harbin-Changchun, their primacy ratios are much lower. Generally, one urban agglomeration with higher primacy ratio is often underdeveloped, because magnitude of factors is over aggregative in its primacy or central city, defined as the Siphon effect between its primacy city and its peripheral regions.
4.3. Differences in Spatial Pattern of Factors Aggregation Ability
Figure 5 portrays the spatial distribution of kernel density and factors aggregating density of factors aggregating ability in the 19 groups. From Figure 5, a declining gradient from the East to the West is observed clearly. In detail, the urban agglomerations with the greatest values of factors comprehensive aggregating ability are mainly centralized in the eastern coastal regions of the Yangtze River Delta, the Pearl River Delta, and Beijing-Tianjin-Hebei urban agglomerations. Following the three-big urban groups, the urban agglomerations, such as the middle reaches of the Yangtze River and Central Plains in Central China, along with Chengdu-Chongqing in Western China, hold a higher average ability of factors aggregation. At the same time, almost all of the western urban agglomerations have the lowest comprehensive ability, including Central Guizhou, Central Yunnan, the areas along the Huanghe River in Ningxia, the northern slopes of the Tianshan Mountains, Lanzhou-Xining, and Hohhot-Baotou-Ordos-Yulin urban agglomerations. Overall, the declining gradient pattern from east to west is consistent with the regional differences of China’s socioeconomic geography, such as GDP and population distributions.
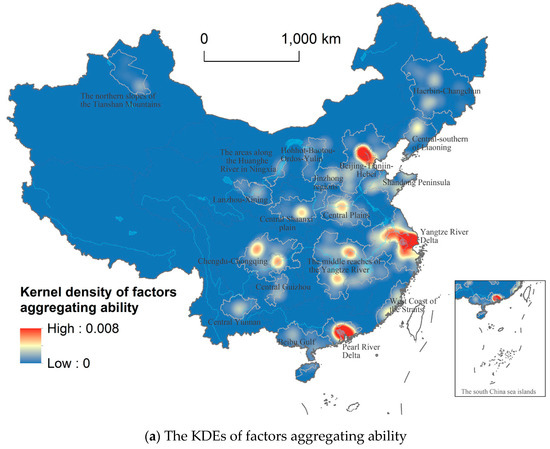
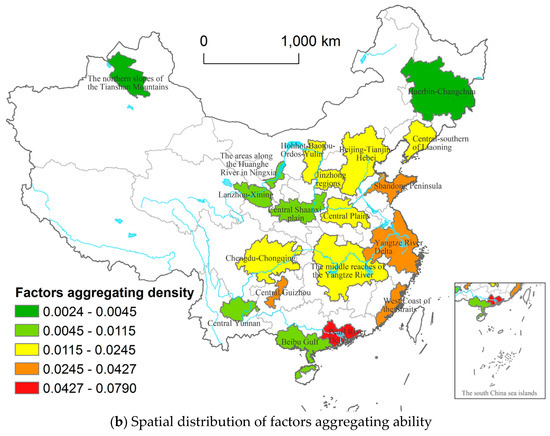
Figure 5.
Spatial patterns of factors aggregating ability of 19 urban agglomerations in China.
Figure 6 maps the spatial pattern of urban factors aggregating ability at the city level. It can be seen that the cities with higher factors aggregating ability are densely distributed in the urban agglomerations such as Yangtze River Delta, Pearl River Delta, Beijing-Tianjin-Hebei, the middle reaches of the Yangtze River, Shandong Peninsula, Chengdu-Chongqing, Central Plains, and Central-southern of Liaoning. This aggregative pattern is basically consistent with the spatial distribution of China’s population density. Most of cities with higher-degree factors aggregating ability are concentrating on the southeastern orientation of the “Hu Huanyong population dividing line” (In a paper published in 1935 entitled “Population Distribution in China,” Hu Huanyong found that spatial distribution of population in China is divided into two basic areas: Southeast China and Northwest China, with the dividing line named as the Heihe-Tengchong line (or Hu line for short)), where about 95% of inhabitants reside. Recently in China, various socioeconomic factors are accelerative flowing into densely-populated cities, to seek greater economic efficiency under a consumer-based orientation.
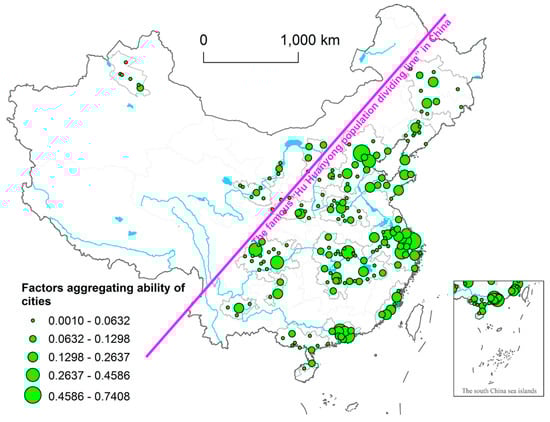
Figure 6.
Spatial patterns of factors aggregating ability of 198 cities in China.
Figure 7 depicts the local clusters of factors aggregating ability of 198 cities by the local spatial autocorrelation analysis. At a glance, there is not significant spatial interdependence of factors aggregating ability in many cities. A few cities have a stronger spatial autocorrelation, and exhibit mainly high-high agglomeration. They are mainly centralized in the Yangtze River Delta, Beijing-Tianjin-Hebei, and the Pearl River Delta urban agglomerations (Figure 7a). In addition, from the cold spots and hotspots distribution as shown in Figure 7b, it is clear that hotspots (high-high clusters) under 99% confidence are polarizing in the Yangtze River Delta, the Pearl River Delta, and the Beijing-Tianjin-Hebei urban agglomerations, with higher factors aggregating ability. However, cold spots (low-low clusters) and other outliers are almost absent in China, which indicates further that the socioeconomic factors are continuously clustering in the three-big urban agglomerations, but that other urban agglomerations are not significant at the factors aggregation.
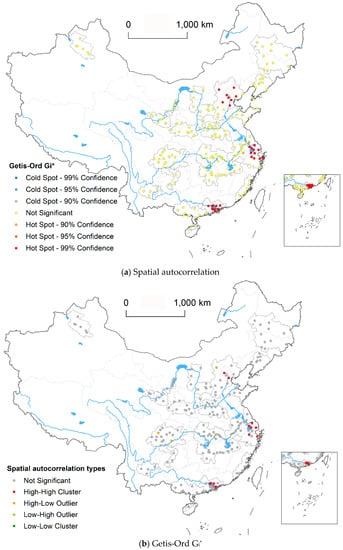
Figure 7.
Spatial clusters of factors aggregation ability of 198 cities in China.
5. Conclusions and Discussion
5.1. Conclusions
Currently, the relationship between factors aggregation and sustainable development in urban agglomerations has been an important issue in urban sustainability research. Much less attention is paid to comprehensive measurements and geographical differences of factors aggregating ability among urban agglomerations. Then, the two questions need to be answered: How to evaluate comprehensively factors aggregating ability? What are the differences among urban agglomerations with different geographical contexts?
To fill this gap, in this paper, China’s 19 major urban agglomerations were selected as the case study. On the basis of POIs data mining, we constructed a comprehensive index system to measure factors aggregating ability. A comparative analysis of factors aggregating ability among the 19 cases were further conducted from the perspectives of structural and spatial differences.
Firstly, the statistical differences of factors aggregating ability among 19 urban agglomerations in China aren’t relatively significant. The most powerful cases are the three state-level urban agglomerations of the Yangtze River Delta, Beijing-Tianjin-Hebei, and the Pearl River Delta. Otherwise, the average factors aggregating ability of urban agglomerations can be roughly divided into three echelons, exhibiting the stable “pyramid” structure. The aggregating ability of all kinds of factors among urban agglomerations exhibit differences as well, noticeably in the technological innovation, economic openness, and financial factors. At city level, the hierarchical distribution of urban factors aggregating ability is more obviously polarized. Higher values of factors aggregating ability are centralized in a few megacities such as Shanghai, Beijing, Guangzhou and Shenzhen. At the same time, most of cities have far lower factors aggregating ability.
Secondly, the rank-size distribution of factors aggregating ability is in line with the rank-size rule of the urban system in China. The rank-size structure of factors aggregating ability in urban agglomerations can be divided into three types: Optimized, balanced, and discrete. Beijing-Tianjin-Hebei, Chengdu-Chongqing, Central-southern of Liaoning, Central Shaanxi Plain and Jinzhong urban agglomerations are of the optimized structure type. The distribution of factors aggregating ability in five urban agglomerations in the western China is balanced. Nine urban agglomerations in the Yangtze River Delta, the Pearl River Delta, the middle reaches of the Yangtze River, Shandong Peninsula, West Coast of the Straits, Central Plains, Haerbin-Changchun, Beibu Gulf, Hohhot-Baotou-Ordos-Yulin have a discrete structure. Furthermore, urban factors aggregating ability in one urban agglomeration is roughly negatively correlated with its primacy ratio of factors aggregating ability distribution.
Thirdly, the spatial distribution of factors aggregating ability presents a gradient declining from the East to the West in China, forming the three-big centers with higher values of factors aggregating ability including the Yangtze River Delta, the Pearl River Delta, and Beijing-Tianjin-Hebei urban agglomerations. Moreover, the distribution of factors aggregating ability at city level coincides with the geographical distribution law of “Hu’s Line”, which is essentially consistent with the spatial distribution of China’s population density. Furthermore, there is slightly spatial interdependence of factors aggregating ability, particularly in the three-big urban agglomerations. The high-high clusters and hotspots are concentrated in the Yangtze River Delta, the Pearl River Delta, and the Beijing-Tianjin-Hebei urban agglomerations.
5.2. Discussion
To date, factors flows and aggregation have played the key role in sustainable development in urban agglomerations. Due to different geographical context of urban agglomerations, there are obvious differences of factors aggregating ability between urban agglomerations. So, a comparative analysis of the differences on factor aggregating ability among China’s 19 major urban agglomerations brings new insights to sustainable development in urban agglomerations. However, further research is needed as follows. The first is the construction of the comprehensive evaluation index system. Although the POIs big data mining is introduced to supplement the lack of indicators data, it still needs further improvement at city and county scales. The second is the dynamic analysis of factors aggregating ability. Due to the huge difficulty in data collection, we have not conducted the spatiotemporal evolution of factors aggregating ability on long-term dynamics. Additionally, the changing differences of factors aggregating ability and their reasons or drivers need to be revealed in detail, which will facilitate the understanding of driving mechanism of factors aggregating ability under different urban agglomerations. The third is the spatial effect of factors aggregating ability. In future research, it would be interesting and important to examine the spatial spillover effects of factors aggregation in urban agglomerations, and to explore its impact on economic development, spatial expansion, environmental sustainability, and urbanization, etc.
Author Contributions
Conceptualization, C.L.; Data curation, T.W.; Formal analysis, T.W.; Funding acquisition, Q.G.; Investigation, C.L.; Methodology, C.L.; Project administration, Q.G.; Software, T.W.; Supervision, Q.G.
Funding
This research was jointly funded by the [National Nature Science Foundation of China] grant number [41571123], [National Social Science Fund of China] grant number [18BJL056], and [Shanghai Pujiang Program] grant number [17PJC030].
Conflicts of Interest
The authors declare no conflicts of interest.
References
- Fang, C.L.; Yu, D.L. Urban agglomeration: An evolving concept of an emerging phenomenon. Landsc. Urban Plan. 2017, 162, 126–136. [Google Scholar] [CrossRef]
- Polyan, P.M. Large urban agglomerations of the Soviet Union. Sov. Geogr. 1982, 23, 707–718. [Google Scholar] [PubMed]
- Gottmann, J. Megalopolis, or the urbanization of the North-eastern seaboard. Econ. Geogr. 1957, 33, 189–200. [Google Scholar] [CrossRef]
- Kunzmann, K.R.; Wegener, M. The pattern of urbanization in Western Europe. Ekistics 1991, 50, 156–178. [Google Scholar]
- Portnov, B.A.; Schwartz, M. Urban clusters as growth foci. J. Region. Sci. 2009, 49, 287–310. [Google Scholar] [CrossRef]
- Chapple, K. The fiscal trade-off: Sprawl, the conversion of land, and wage decline in California’s metropolitan regions. Landsc. Urban Plan. 2018, 177, 294–302. [Google Scholar] [CrossRef]
- Bagheri, B.; Tousi, S.N. An explanation of urban sprawl phenomenon in Shiraz Metropolitan Area (SMA). Cities 2018, 73, 71–90. [Google Scholar] [CrossRef]
- Katherine, H. Urban infrastructure and natural resource flows: Evidence from Cape Town. Sci. Total Environ. 2013, 461, 839–845. [Google Scholar]
- Guo, Q.B.; Liu, Q. Research progress review on urban factors aggregating ability. J. Hubei Univ. 2016, 43, 122–129. (In Chinese) [Google Scholar]
- Porter, M.E. Location, competition and economic development: Local clusters in a global economy. Econ. Dev. Quart. 2000, 14, 15–34. [Google Scholar] [CrossRef]
- Oskenbayev, Y.; Yilmaz, M.; Abdulla, K. Resource concentration, institutional quality and the natural resource curse. Econ. Syst. 2013, 37, 254–270. [Google Scholar] [CrossRef]
- Ohlin, B. Interregional and International Trade; Harvard University Press: Cambridge, MA, USA, 1933. [Google Scholar]
- Russo, F.; Musolino, G. A unifying modelling framework to simulate the spatial economic transport interaction process at urban and national scales. J. Transp. Geogr. 2012, 24, 189–197. [Google Scholar] [CrossRef]
- Trippl, M.; Grillitsch, M.; Isaksen, A.; Sinozic, T. Perspectives on cluster evolution: Critical review and future research issues. Eur. Plan. Stud. 2015, 23, 2028–2044. [Google Scholar] [CrossRef]
- Chang, C.; Oxley, L. Industrial agglomeration, geographic innovation and total factor productivity: The case of Taiwan. Math. Comput. Simul. 2009, 79, 2787–2796. [Google Scholar] [CrossRef]
- Hochman, O. Efficient agglomeration of spatial clubs. J. Urban Econ. 2011, 69, 118–135. [Google Scholar] [CrossRef]
- Fu, Y.M.; Gabriel, S.A. Labor migration, human capital agglomeration and regional development in China. Region. Sci. Urban Econ. 2012, 42, 473–484. [Google Scholar] [CrossRef]
- Papi, L.; Sarno, E.; Zazzaro, A. The Geographical Network of Bank Organizations: Issues and Evidence for Italy. In Handbook of Geographies of Money and Finance; Martin, R., Pollard, J., Eds.; CSEF Working Paper, 403; Edward Elgar: Cheltenam, UK, 2015. [Google Scholar]
- Bhaumik, S.K.; Dimova, R. Does Human Capital Endowment of Foreign Direct Investment Recipient Countries Really Matter Evidence from Cross-country Firm Level. Data Rev. Dev. Econ. 2013, 17, 559–570. [Google Scholar] [CrossRef]
- Yang, C.; Lin, H.; Li, H. Influences of production and R&D agglomeration on productivity: Evidence from Chinese electronics firms. China Econ. Rev. 2013, 27, 162–178. [Google Scholar]
- Alfaro, L.; Chen, M.X. The global agglomeration of multinational firms. J. Int. Econ. 2014, 94, 263–276. [Google Scholar] [CrossRef]
- Ellision, G. Geographic concentration in U. S. manufacturing industrial: A dartboard approach. J. Urban Econ. 2000, 9, 48–67. [Google Scholar]
- Catini, R.; Karamshuk, D.; Penner, O.; Riccaboni, M. Identifying geographic clusters: A network analytic approach. Res. Policy 2015, 44, 1749–1762. [Google Scholar] [CrossRef]
- Scioscia, F.; Binetti, M.; Ruta, M.; Ieva, S.; Di Sciascio, E. A framework and a tool for semantic annotation of POIs in Open Street Map. Procedia 2014, 111, 1092–1101. [Google Scholar]
- Zhang, X.Y.; Du, S.H.; Wang, Q. Hierarchical semantic cognition for urban functional zones with VHR satellite images and POI data. ISPRS J. Photogramm. Remote Sens. 2017, 132, 170–184. [Google Scholar] [CrossRef]
- He, Y.X.; Yang, J.J. Comprehensive evaluation of global clean energy development index based on the improved entropy method. Ecol. Indic. 2018, 88, 305–321. [Google Scholar] [CrossRef]
- Guo, Q.B.; Zhang, Z.H. Spatial-temporal evolution of factors aggregating ability in urban agglomeration in the middle reaches of the Yangtze River. Acta Geogr. Sin. 2017, 72, 1746–1761. (In Chinese) [Google Scholar]
- Arshad, S.; Hu, S.; Ashraf, B.N. Zipf’s law and city size distribution: A survey of the literature and future research agenda. Physica A 2018, 492, 75–92. [Google Scholar] [CrossRef]
- Chen, Y.G. The evolution of Zipf’s law indicative of city development. Physica A 2016, 443, 555–567. [Google Scholar] [CrossRef]
- Giesen, K.; Südekum, J. Zipf’s law for cities in the regions and the country. J. Econ. Geogr. 2011, 11, 667–686. [Google Scholar] [CrossRef]
- Spencer, C.J.; Yakymchuk, C.; Ghaznavi, M. Visualizing data distributions with kernel density estimation and reduced chi-squared statistic. Geosci. Front. 2017, 8, 1247–1252. [Google Scholar] [CrossRef]
- Hu, Y.J.; Wang, F.H.; Guin, C.; Zhu, H.J. A spatial-temporal kernel density estimation framework for predictive crime hotspot mapping and evaluation. Appl. Geogr. 2018, 99, 89–97. [Google Scholar] [CrossRef]
- Heidenreich, N.B.; Schindler, A.; Sperlich, S. Bandwidth selection for kernel density estimation: A review of fully automatic selectors. Adv. Stat. Anal. 2013, 97, 403–433. [Google Scholar] [CrossRef]


© 2018 by the authors. Licensee MDPI, Basel, Switzerland. This article is an open access article distributed under the terms and conditions of the Creative Commons Attribution (CC BY) license (http://creativecommons.org/licenses/by/4.0/).