Abstract
Based on the scientific calculation of carbon emissions from energy consumption in Nanjing, this paper analyzed the driving forces of carbon emissions from 2000 to 2016 by using the stochastic impacts by regression on population, affluence and technology (STIRPAT) model. The results show that from 2000 to 2016, the energy carbon emissions of Nanjing were on the rise; the urbanization rate, population, GDP per capita, and energy intensity had a significant positive impact on the growth of carbon emissions in Nanjing, China. Based on this, we presented five development scenarios to analyze the future trend of carbon emissions of the city. By contrast, the growth rate of carbon emissions from energy consumption is the slowest when the population maintains a low growth rate and the GDP per capita and technical level maintain high growth. This indicates a better urban development strategy in which industrial restructuring must be associated with talent structure adjustment to decarbonize the urban economy, and the extensive urban sprawl development approach might need to be changed.
1. Introduction
With rapid economic and population growth, we have come to rely more and more on massive energy consumption for survival and development. However, increased energy consumption has caused huge carbon emissions which now threaten our living environment. The Fourth Assessment Report from the Intergovernmental Panel on Climate Change (IPCC) indicates that carbon emissions from global energy consumption in 2006 accounted for 86% of total carbon emissions. According to the statistics from the International Energy Agency (IEA), China replaced the United States as the world’s largest carbon emitter in 2007. At the Copenhagen conference, the Chinese government promised that greenhouse gas (GHGs) emissions per unit of GDP will fall by 40–45% compared with 2005 emissions by 2020. Thus, “effective control of total carbon emissions” and “implementation of carbon emission reduction commitments” have been included directly in the 13th Five-Year Plan by the Chinese central government. Because cities are the key carbon emitters [1], Chinese cities, especially inshore developed cities, face severe challenges in reducing carbon emissions while striving to keep the economy growing [2].
However, not all researches believe that economic growth linking height with carbon emissions and energy using. Environmental Kuznets Curve (EKC), one of the most influential theories, propose that environmental degradation tends to rise in the first stage and then decrease with increasing income per capita [3]. Beyond that, the neutrality hypothesis insists that increasing energy using and carbon emissions do not necessarily create economic growth and vice versa [4]. Magazzino’s quantitative research on Asia Pacific Economic Cooperation (APEC) countries [5], Middle East countries [6], and some European countries [7] also bear out this hypothesis. Nevertheless, the correlation between economic growth and carbon emissions is hard to reach a consensus. As the increasing urbanization and carbon emissions are obvious worldwide during past decades, research has reinforced previous work analyzing the driving forces of increasing carbon emissions in the process of urban development [8,9,10,11,12]. These studies showed that the urbanization rate [13,14,15], population [16] as well as GDP per capita have a significant impact on regional carbon emissions [17,18,19,20]. In other words, the unidirectional causality from economic growth to carbon emissions also has been tested and widely verified [21] (defined as “conservation hypothesis”, see Dykhuizen [22]). Besides, the unidirectional causality from carbon emissions to economic growth [23] (defined as “growth hypothesis” which indicates carbon emissions promote economic growth) and the bidirectional causality between them [24] (defined as “feedback hypothesis”) also have been proved by some other studies.
All of the studies are not trials, which means that a causal relationship between economic growth and carbon emissions has not been establish. Moreover, the effects of these factors on different regions are not the same, indicating a significant spatial heterogeneity in the driving forces of carbon emissions [25]. How to respond to the confusions? We argue that the process of urbanization, economic growth as well as industrial structure are highly dependent upon each other, and their interdependence determines the energy consumption and carbon emissions. In other words, high-pollution, high-energy-consumption industries driven urbanization and economic growth would inevitably ensue increasing carbon emissions [26]. As a result, discussion about the influence of energy policy on economic growth is inseparable from the analysis of the association between urban development strategy and readjustment of industrial structure. However, little amount of studies devoted to the research from this perspective.
This paper addresses this gap. In the following section, we introduced the research area, data sources as well as the reason that why we chose Nanjing as the case area. In the Section 3, we first analyze the trends of carbon emissions during past decades and the related influencing factors. At the end of this section, we presented five development scenarios to analyze the future trend of carbon emissions of the city in different developmental modes. In the part of discussion, we discussed the lock-in effects of carbon economy in Nanjing from the perspective of industrial structure and argued that this development mode is unsustainable under the pressure of carbon reduction. Finally, a sustainable urban development model aimed at carbon reduction was suggested.
2. Materials and Methods
2.1. Study Area
Nanjing is in the southwest of Jiangsu Province (Figure 1). As a second-tier city, the process of urbanization is different from other first-tier cities of China, such as Beijing and Shanghai. Because Beijing is the political center and Shanghai is the economic center. Their process of urban development and industrial upgrading not only have their endogenous motive forces, but also have the input and support of external economic and political resources from center government. Thus, Nanjing’s urban development strategy is more in line with the general pattern of other large cities in China, which makes the study more representative.
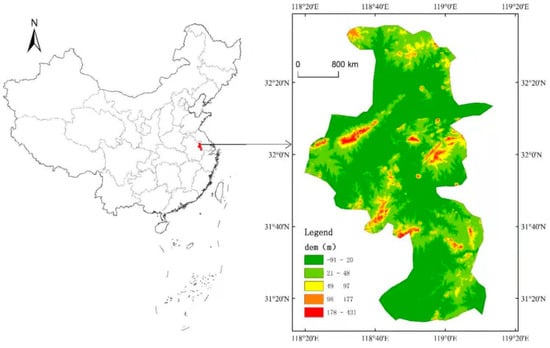
Figure 1.
Study area.
2.2. Methodology
2.2.1. Calculation Method for Energy Carbon Emissions
The energy consumption of the industrial economy is the main source of carbon emissions. Study of the characteristics of the energy consumption carbon emissions of the urban industrial economy and the factors that affect the energy consumption of the urban industrial economy is therefore very illustrative. In the energy consumption structure of Nanjing, industrial energy consumption accounts for most of the total energy consumption and represents the trend of energy consumption in Nanjing. This paper selects the energy consumption of Industrial Enterprises above Designated Size in Nanjing for the years 2000–2016 as the energy consumption of Nanjing, so as to study the energy carbon emissions of Nanjing. According to the calculation method for carbon emissions from the “IPCC national greenhouse gas emission guide list” established in 2006, the calculation formula of energy consumption carbon emissions in Nanjing is as follows:
where represents the total amount of energy carbon emissions, is the energy type, is the consumption of energy , and is the carbon emission coefficient of energy as shown in Table 1.

Table 1.
Carbon emission coefficients of various energy sources (104t/104t).
2.2.2. STIRPAT Model
Dietz and Rosa proposed “Impact = Population·Affluence·Technology” (IPAT) model for environmental impact [27]. On this basis, York, Rosa, and Dietz established the stochastic impacts by regression on population, affluence and technology (STIRPAT) model by improving the IPAT equation and studied the change in the nonequal proportion of the population and carbon emissions [28]. The model is as follows:
In this model, refers to environmental pressure, with population, economic development, and technological progress, expressed by , , and , respectively, being the driving factors of environmental pressure. As mentioned above, Nanjing is an important central city and industrial base in China. While maintaining rapid economic development, adjusting and optimizing the industrial structure is of great significance to the coordinated development of society. Therefore, this paper introduces several industrial structural indicators in combination with the actual situation in Nanjing, and expands the model to build the following model:
In the formula, is the carbon emissions from Nanjing’s energy consumption (ten thousand tons); , , and are the factors affecting the energy carbon emissions in Nanjing, and denote the population, affluence, energy intensity, and urbanization rate. The population is the resident population (10,000 persons), the affluence is expressed as GDP per capita (yuan/person), the energy intensity is the ratio of energy consumption to GDP (tons of standard coal per 104 yuan), and the rate of urbanization is the ratio of urban population to resident population.
We take the natural logarithm on both sides of the model. This can not only reduce the heteroscedasticity, but also directly obtain the elasticity of the explanatory variable to the explanatory variable. The equation then becomes
The treated model was multivariate linearly fitted using as the dependent variable; , ,, and as the independent variables; as the constant term; and as the error term. According to the concept of the elasticity coefficient, every 1% change in , , , and will cause changes of ,,,, in , respectively. In order to test whether there is an inverted u-shaped curve between economic growth and carbon emissions, decomposing in Equation (4) into and terms, the model becomes:
From Equation (5), the elastic coefficient of per capita GDP to energy consumption carbon emissions can be obtained as . If is negative, then there is an inverted u-shaped curve between per capita GDP and energy carbon emissions, and vice versa.
2.2.3. Ridge Regression
The high correlation between independent variables makes the parameter robustness of the least squares estimation method worse. Ridge regression is a biased estimation regression method that is specifically used for collinear data analysis, and its essence is an improved least squares regression method. By obtaining a regression result that is closer to the actual situation by sacrificing part of the information and reducing the accuracy, the fitting of the relevant data is better than that by the ordinary least square method [29].
2.3. Data Sources
The energy consumption in this study is defined as the sum of various energy sources in the material production department, non-material production department, and living consumption in Nanjing over a fixed period of time. In order to dynamically analyze the carbon emissions from energy consumption in Nanjing, this study selected the carbon sources and social and economic data of Nanjing from 2000 to 2016; the sources include raw coal, clean coal, other coal washing, coke, coke oven gas, blast furnace gas, crude oil, gasoline, kerosene, diesel, fuel oil, liquefied petroleum gas, refinery dry gas, other petroleum products, heat, and electricity, and the data include urbanization rate, population, wealth, energy intensity, etc. The coal breakage coefficients of all kinds of energy sources were found in the China Energy Statistics Yearbook (2016), and the carbon emission sources and socio-economic data were found in the Nanjing Statistical Yearbook (2001–2017) and the Jiangsu Statistical Yearbook (2001–2017). GDP and GDP per capita were converted into 2010 comparable prices using GDP index and GDP per capita index, respectively.
3. Results
3.1. Energy Carbon Emissions and Energy Intensity
According to the formula for carbon emission calculations above and the energy consumption in Nanjing, the main energy carbon emissions in Nanjing were obtained. The specific conditions are shown in Table 2. The energy carbon emissions and energy consumption per unit of GDP in Nanjing during 2000–2016 are shown in Figure 2.
Table 2.
Descriptive statistics of the data.

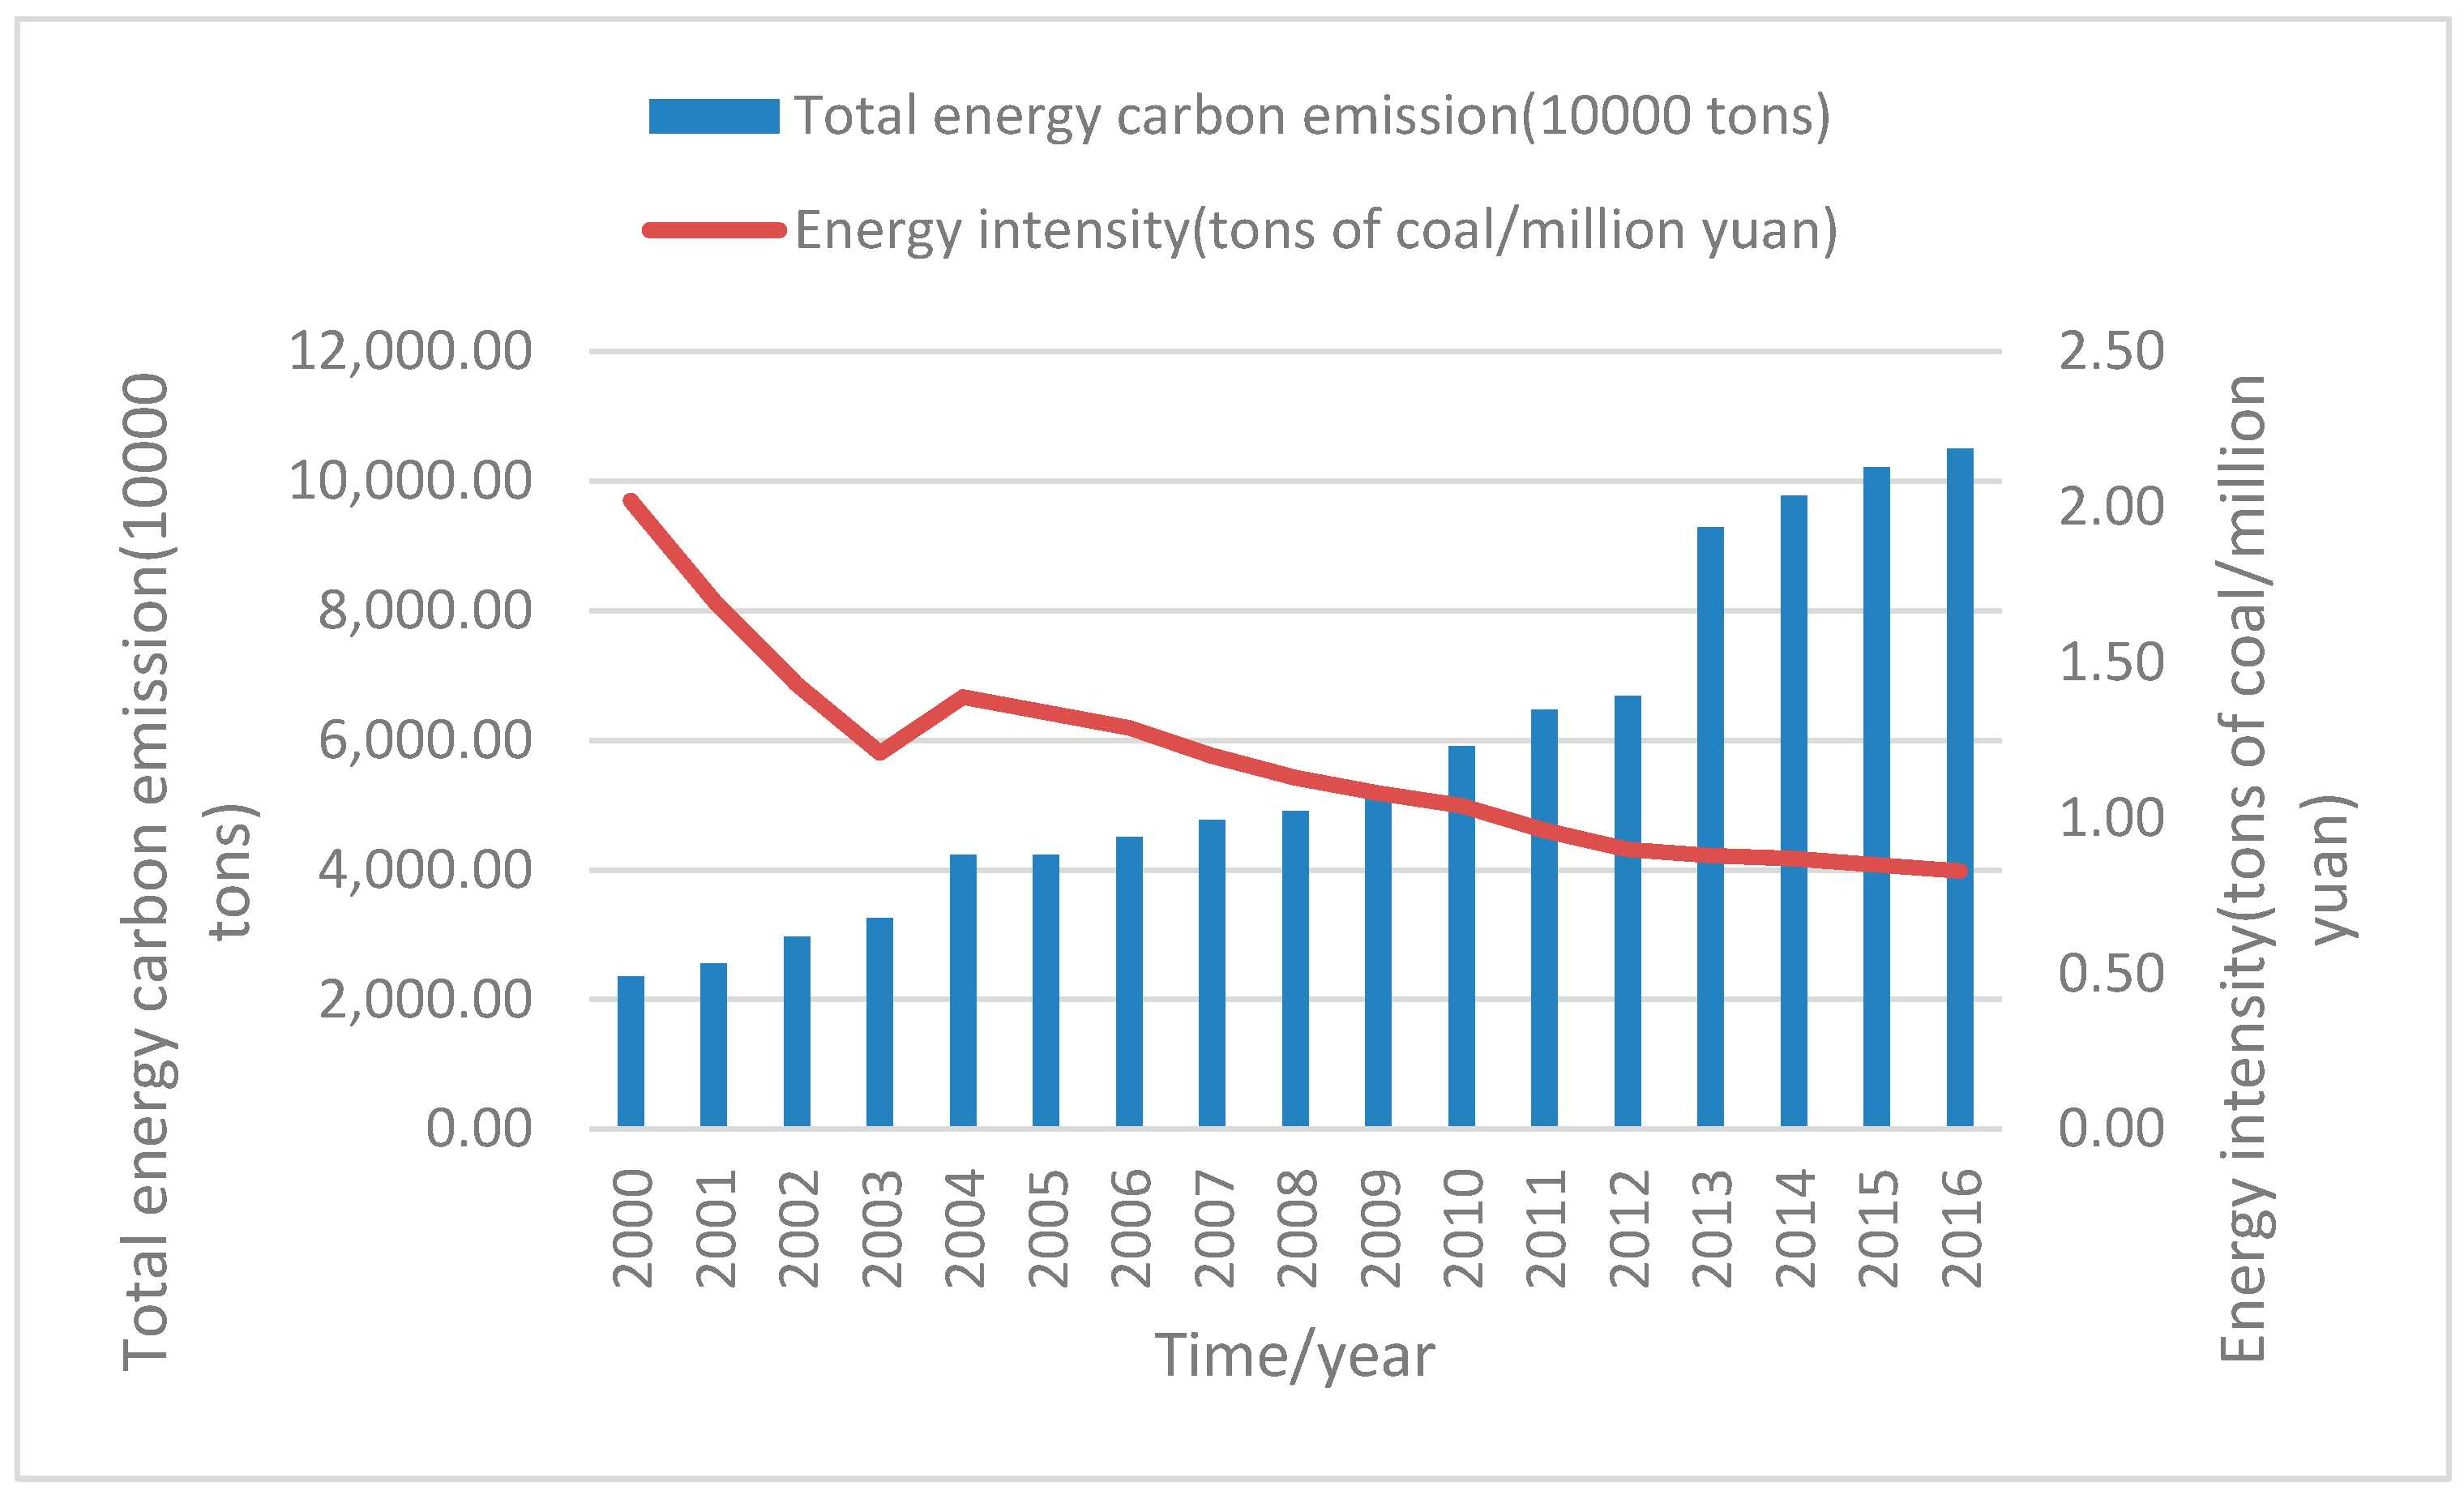
Figure 2.
Energy carbon emissions and energy intensity in Nanjing from 2000 to 2016.
From Figure 2, we can observe the specific situation of Nanjing’s energy carbon emissions in the 17 years from 2000 to 2016. On the whole, by the end of 2016, Nanjing’s total carbon emissions and energy intensity showed a reversing trend. As can be seen from Figure 2, the total amount of carbon emissions from the city of Nanjing showed a rising trend from 2000 to 2016, especially after 2012, when the carbon emissions grew faster than previously. Energy carbon emissions maintained a rapid growth rate, and the average annual growth rate from 2000 to 2016 was 9.79%. During this period, the growth rate was relatively slow from 2000 to 2012. In 2013 and later, the carbon emissions increased more rapidly. In 2013, the carbon emissions from energy consumption were 92.93 million tons, which was 1.4 times the carbon emissions in 2012. Carbon emissions from various sources of energy consumption basically maintained an upward trend, with an average annual growth rate of more than 8%. In particular, emissions from petroleum and related products and heat increased rapidly. This is related to the adjustment of the industrial structure of Nanjing and the transformation of the energy consumption structure. The proportion of coal carbon emissions is the largest among all types of carbon sources, and coal is still the main energy source in Nanjing, followed by carbon emissions from electricity, gas, heat, and petroleum and related products.
Energy intensity fluctuates, but it generally maintains a downward trend. The energy intensity in Nanjing fell from 2.02 tons of standard coal/104 yuan in 2000 to 0.83 tons of standard coal/104 yuan in 2016, a drop of 58.91%, with an average annual growth rate of −5.43. The decline in energy intensity can be roughly divided into two stages. In the first stage, from 2000 to 2004, the energy intensity fluctuation at this stage decreased and fell sharply. It increased in 2004, which is related to changes in the proportion of secondary industry in Nanjing. The second stage is 2004–2016; the energy intensity shows a gentle downward trend in this stage because the proportion of secondary industry continued to decline and the level of science and technology continued to improve.
3.2. STIRPAT-Based Modeling
According to the constructed Equation (5), using linear regression analysis in SPSS.22 to fit the model, it was found that there is severe multicollinearity between the variables. In order to eliminate the influence of multicollinearity, this paper uses the ridge regression method to regress the data [30,31]. The specific results are shown in Table 3. Among them, the value is 0.96, indicating that the fit is in line with the standard, and the statistics passed the 1% significance level test. Each variable passed the 1% significance level test, so Equation (5) can better explain the relationship between Nanjing’s energy carbon emissions and their respective variables. The formula can be expressed as follows:
Table 3.
The results of ridge regression.
3.3. Analysis of STIRPAT Model Results
As described in Table 3, according to the absolute value of the regression coefficient, the urbanization rate has the greatest impact on the carbon emissions from energy consumption in Nanjing, followed by the population and GDP per capita, and GDP energy intensity has the smallest impact. The quadratic coefficient of the logarithm of GDP per capita is positive, indicating that in the years 2000–2016, there was no inverted U-shaped curve for GDP per capita and carbon emissions from energy consumption in Nanjing. Judging from the positive and negative regression coefficients, the population, GDP per capita, GDP energy intensity, and urbanization rate play a catalytic role in the carbon emissions from energy consumption in Nanjing. The most influential factor on energy carbon emissions in Nanjing is the urbanization rate. When other conditions are unchanged, an increase in the urbanization rate of 1% will increase the carbon emissions by 2.214%. Population, GDP per capita, and GDP energy intensity also contribute to the promotion of energy carbon emissions in Nanjing. When the population, GDP per capita, and GDP energy intensity are increased by 1%, the energy carbon emissions increase by 0.596%,, and 0.128%, respectively. Nanjing is an important city in the Yangtze River Delta of China and an important capital city. The resident population has increased continuously from 6.13 million in 2000 to 8.27 million in 2016, an increase of 35%, and the level of urbanization has continued to increase. After entering the 21st century, the economy of Nanjing has continued to develop, and people’s living standards have improved. The GDP per capita reached 133,300 in 2016. The improvement in the urbanization level, the rapid development of the economy, and the increase in the population have made Nanjing’s demand for energy greater and greater, so energy consumption and energy carbon emissions have increased. Since 2000, the energy intensity relative to GDP has been decreasing in Nanjing. From 0.8 tons of standard coal/104 yuan in 2000 to 0.12 tons of standard coal/104 yuan in 2016, the decrease in energy intensity relative to GDP shows that with the progress and improvement of science and technology, including production technology, overall saving and efficient utilization of resources has been promoted. Therefore, Nanjing should actively improve the level of production technology, improve the utilization rate of energy, and reduce the intensity of GDP energy.
3.4. Scenario Analysis
Scenario analysis is a method of prediction that combines qualitative and quantitative analysis. Simulations based on historical carbon emissions and socio-economic development can provide useful information for the sustainable development of energy in the future [32,33]. According to the simulation results of the STIRPAT model, this study is based on the prediction of energy consumption carbon emissions in Nanjing from 2000 to 2016, which can be expressed as follows:
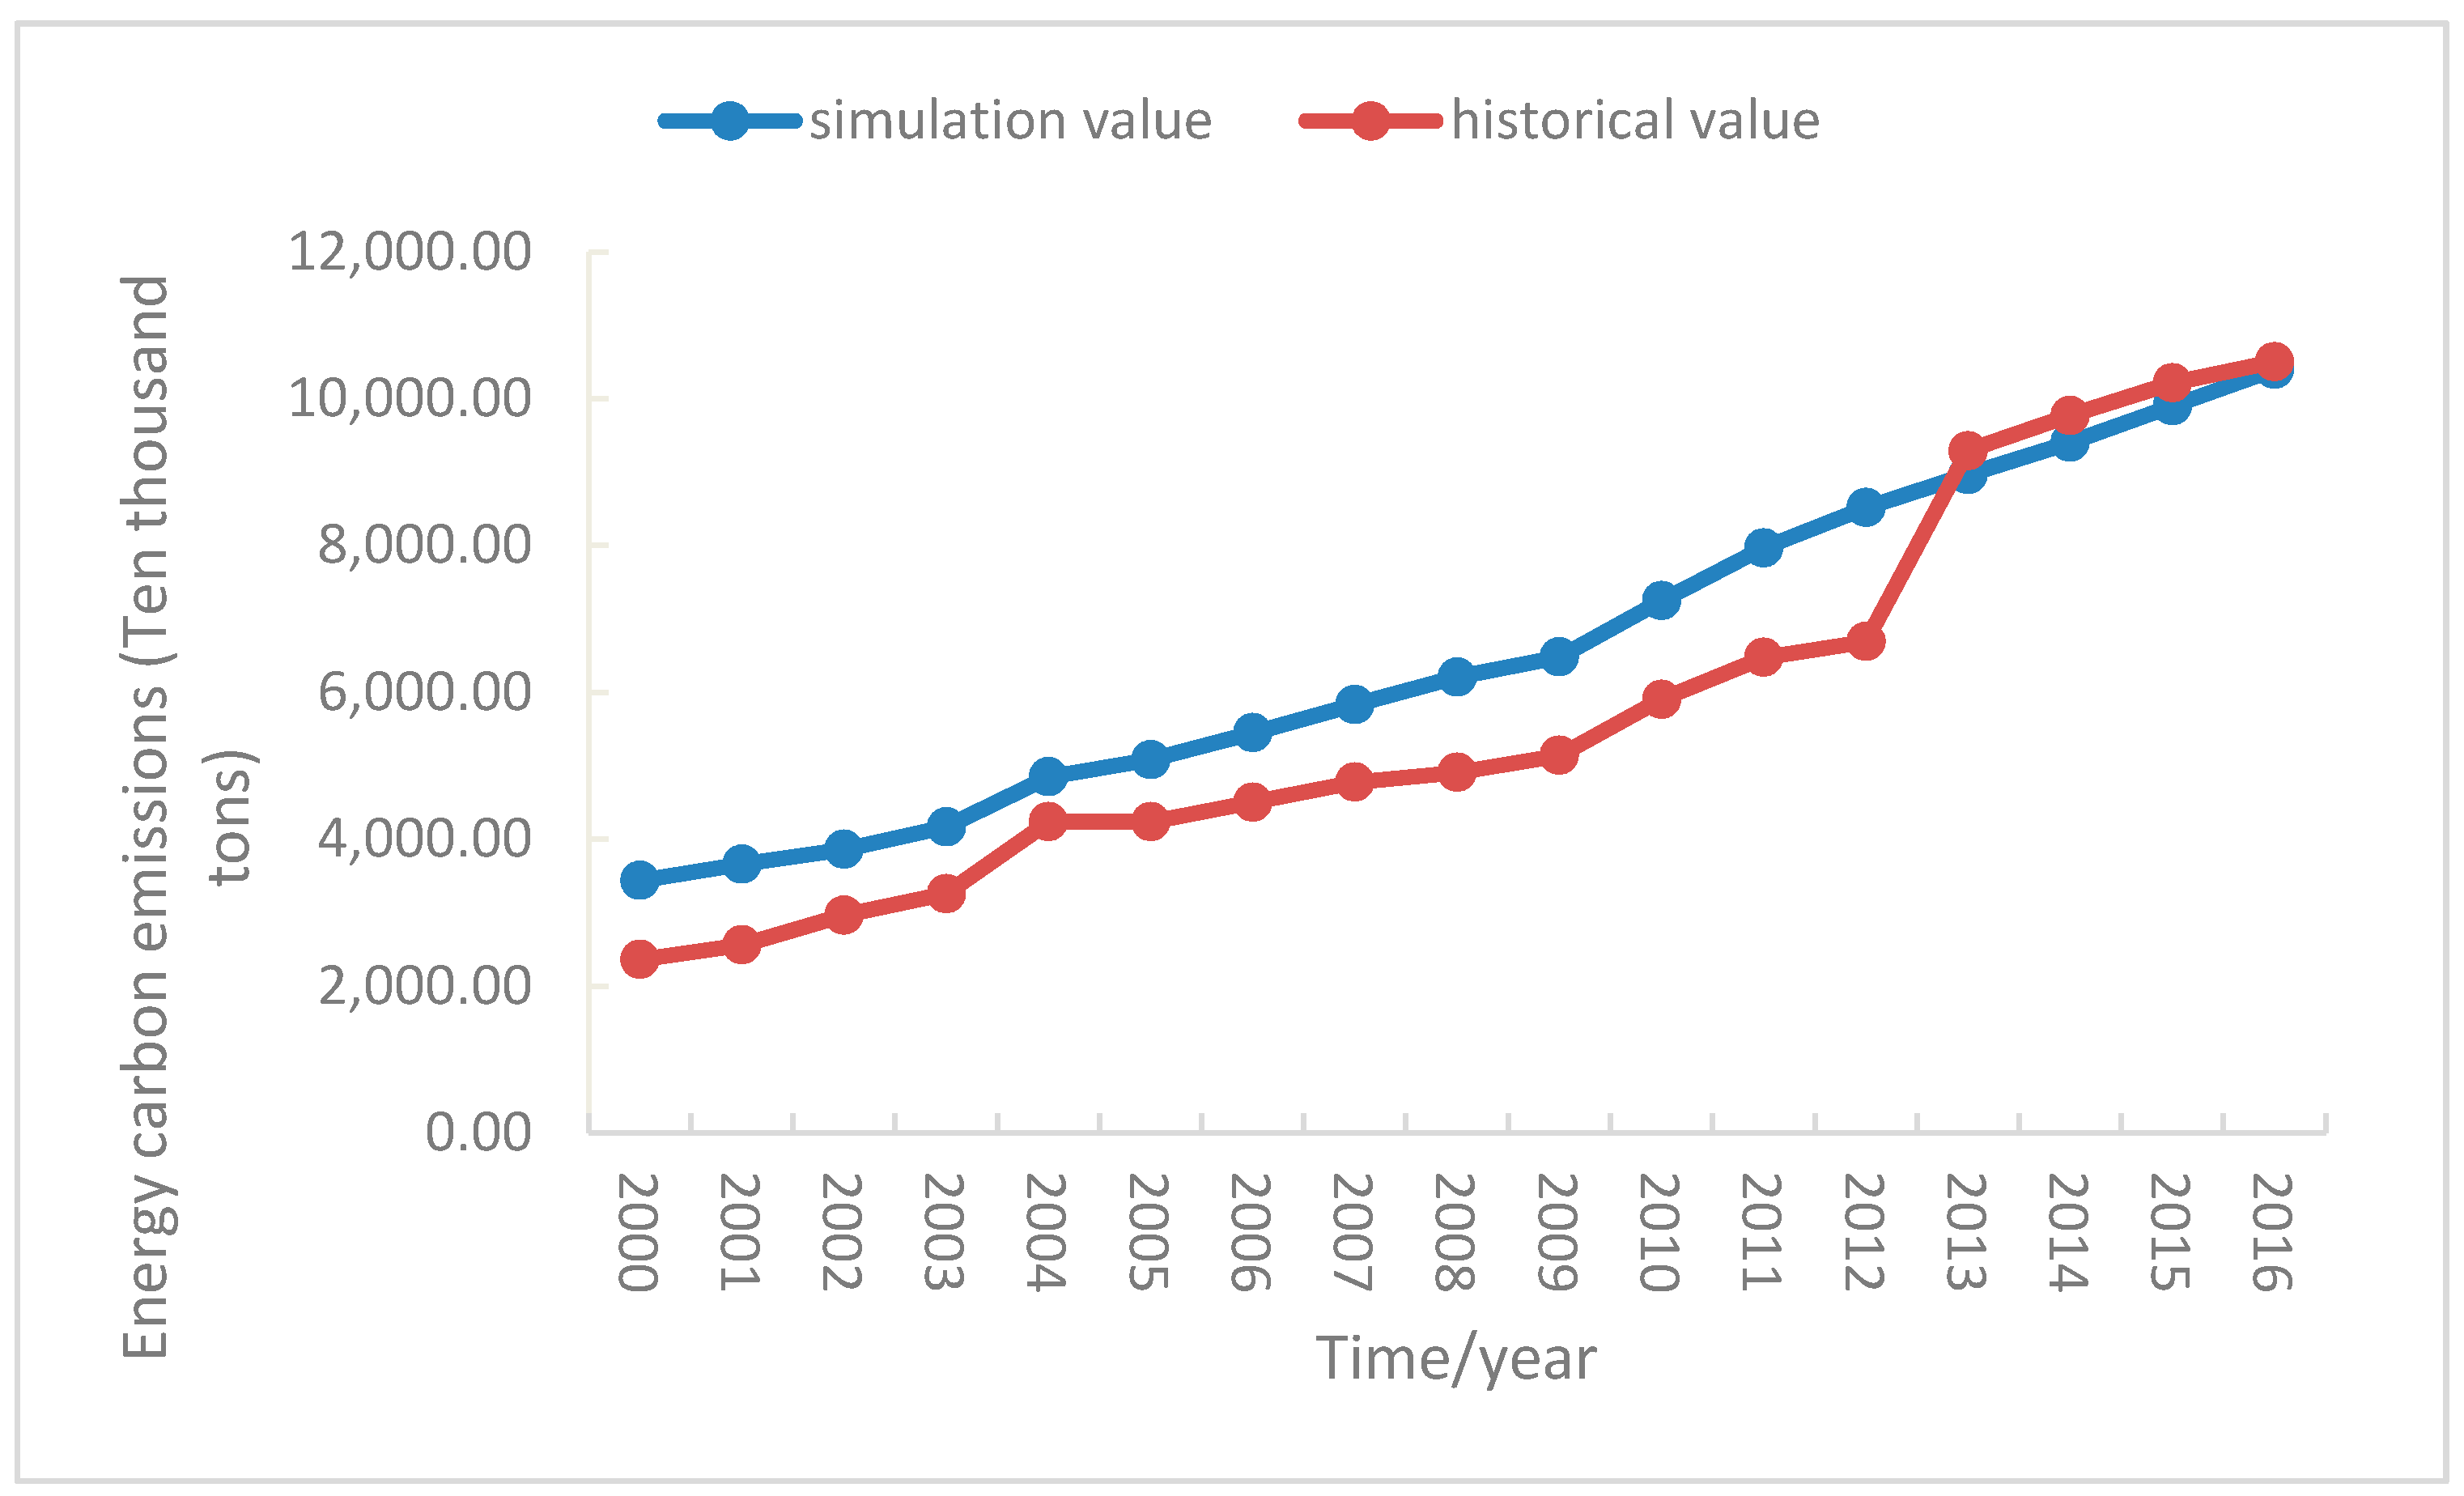
According to the number of permanent residents, GDP per capita, GDP energy intensity, and urbanization level of Nanjing from 2000 to 2016, the model given by Equation (7) was used to simulate the carbon emissions from energy consumption in Nanjing over the years. The simulated values were regressed with the historical values and gave an value of 0.96, indicating that the model fits well. Therefore, it is feasible to use Equation (7) to predict the carbon emissions from future energy consumption in Nanjing. It can be seen from Figure 3 that the simulated and actual value curves of carbon emissions in Nanjing basically coincide with each other; there are differences in individual years, but the difference is small, and the simulation results have high precision.
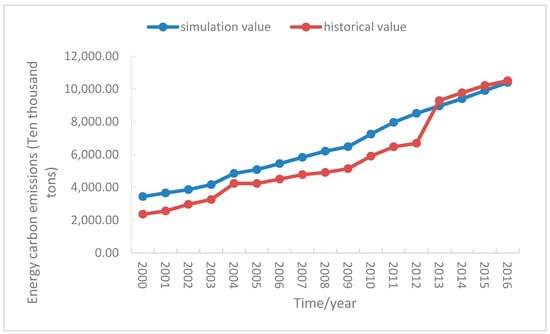
Figure 3.
Comparison between simulated and actual values of carbon emissions from energy consumption in Nanjing.
In order to determine the urbanization rate of Nanjing, a variety of sources were considered. On 20 January 2018, the General Office of the Nanjing Municipal Government announced the “Thirteenth Five-Year Plan for Population Development in Nanjing”. It is expected that the urbanization rate of the city’s population will reach about 85% during the 13th Five-Year Plan period. According to United Nations estimates, the urbanization rate of developed countries in the world will reach 86% by 2050. In China, Shanghai has the highest urbanization rate. In 2013, its urbanization rate reached 90%, but in recent years it has maintained a slow decline to around 87%. In view of the “13th Five-Year” population planning in Nanjing and the urbanization rate of Shanghai, the urbanization rates of the future major years of 2020, 2030, 2040, and 2050 were set to 85%, 87%, 89%, and 90%, respectively. According to the set urbanization rate, the growth rate of the urbanization rate in each stage was calculated, and the urbanization rate of Nanjing from 2017 to 2050 was calculated. According to the historical data for Nanjing from 2000 to 2016, the population growth rate and per capita GDP growth rate were calculated. The maximum and minimum population growth rates and per capita GDP growth rates were used as their respective high growth rate and low growth rate. The future population and per capita GDP of Nanjing were estimated. In addition, the energy intensity relative to GDP represents the technical level of Nanjing [34]; we calculated the annual decline rate of energy intensity relative to GDP and selected the maximum and minimum decline rates as the high tech growth rate and low tech growth rate, respectively, to estimate the future GDP energy intensity of Nanjing. The specific scenario settings are shown in Table 4.
Table 4.
Nanjing development scenario set.
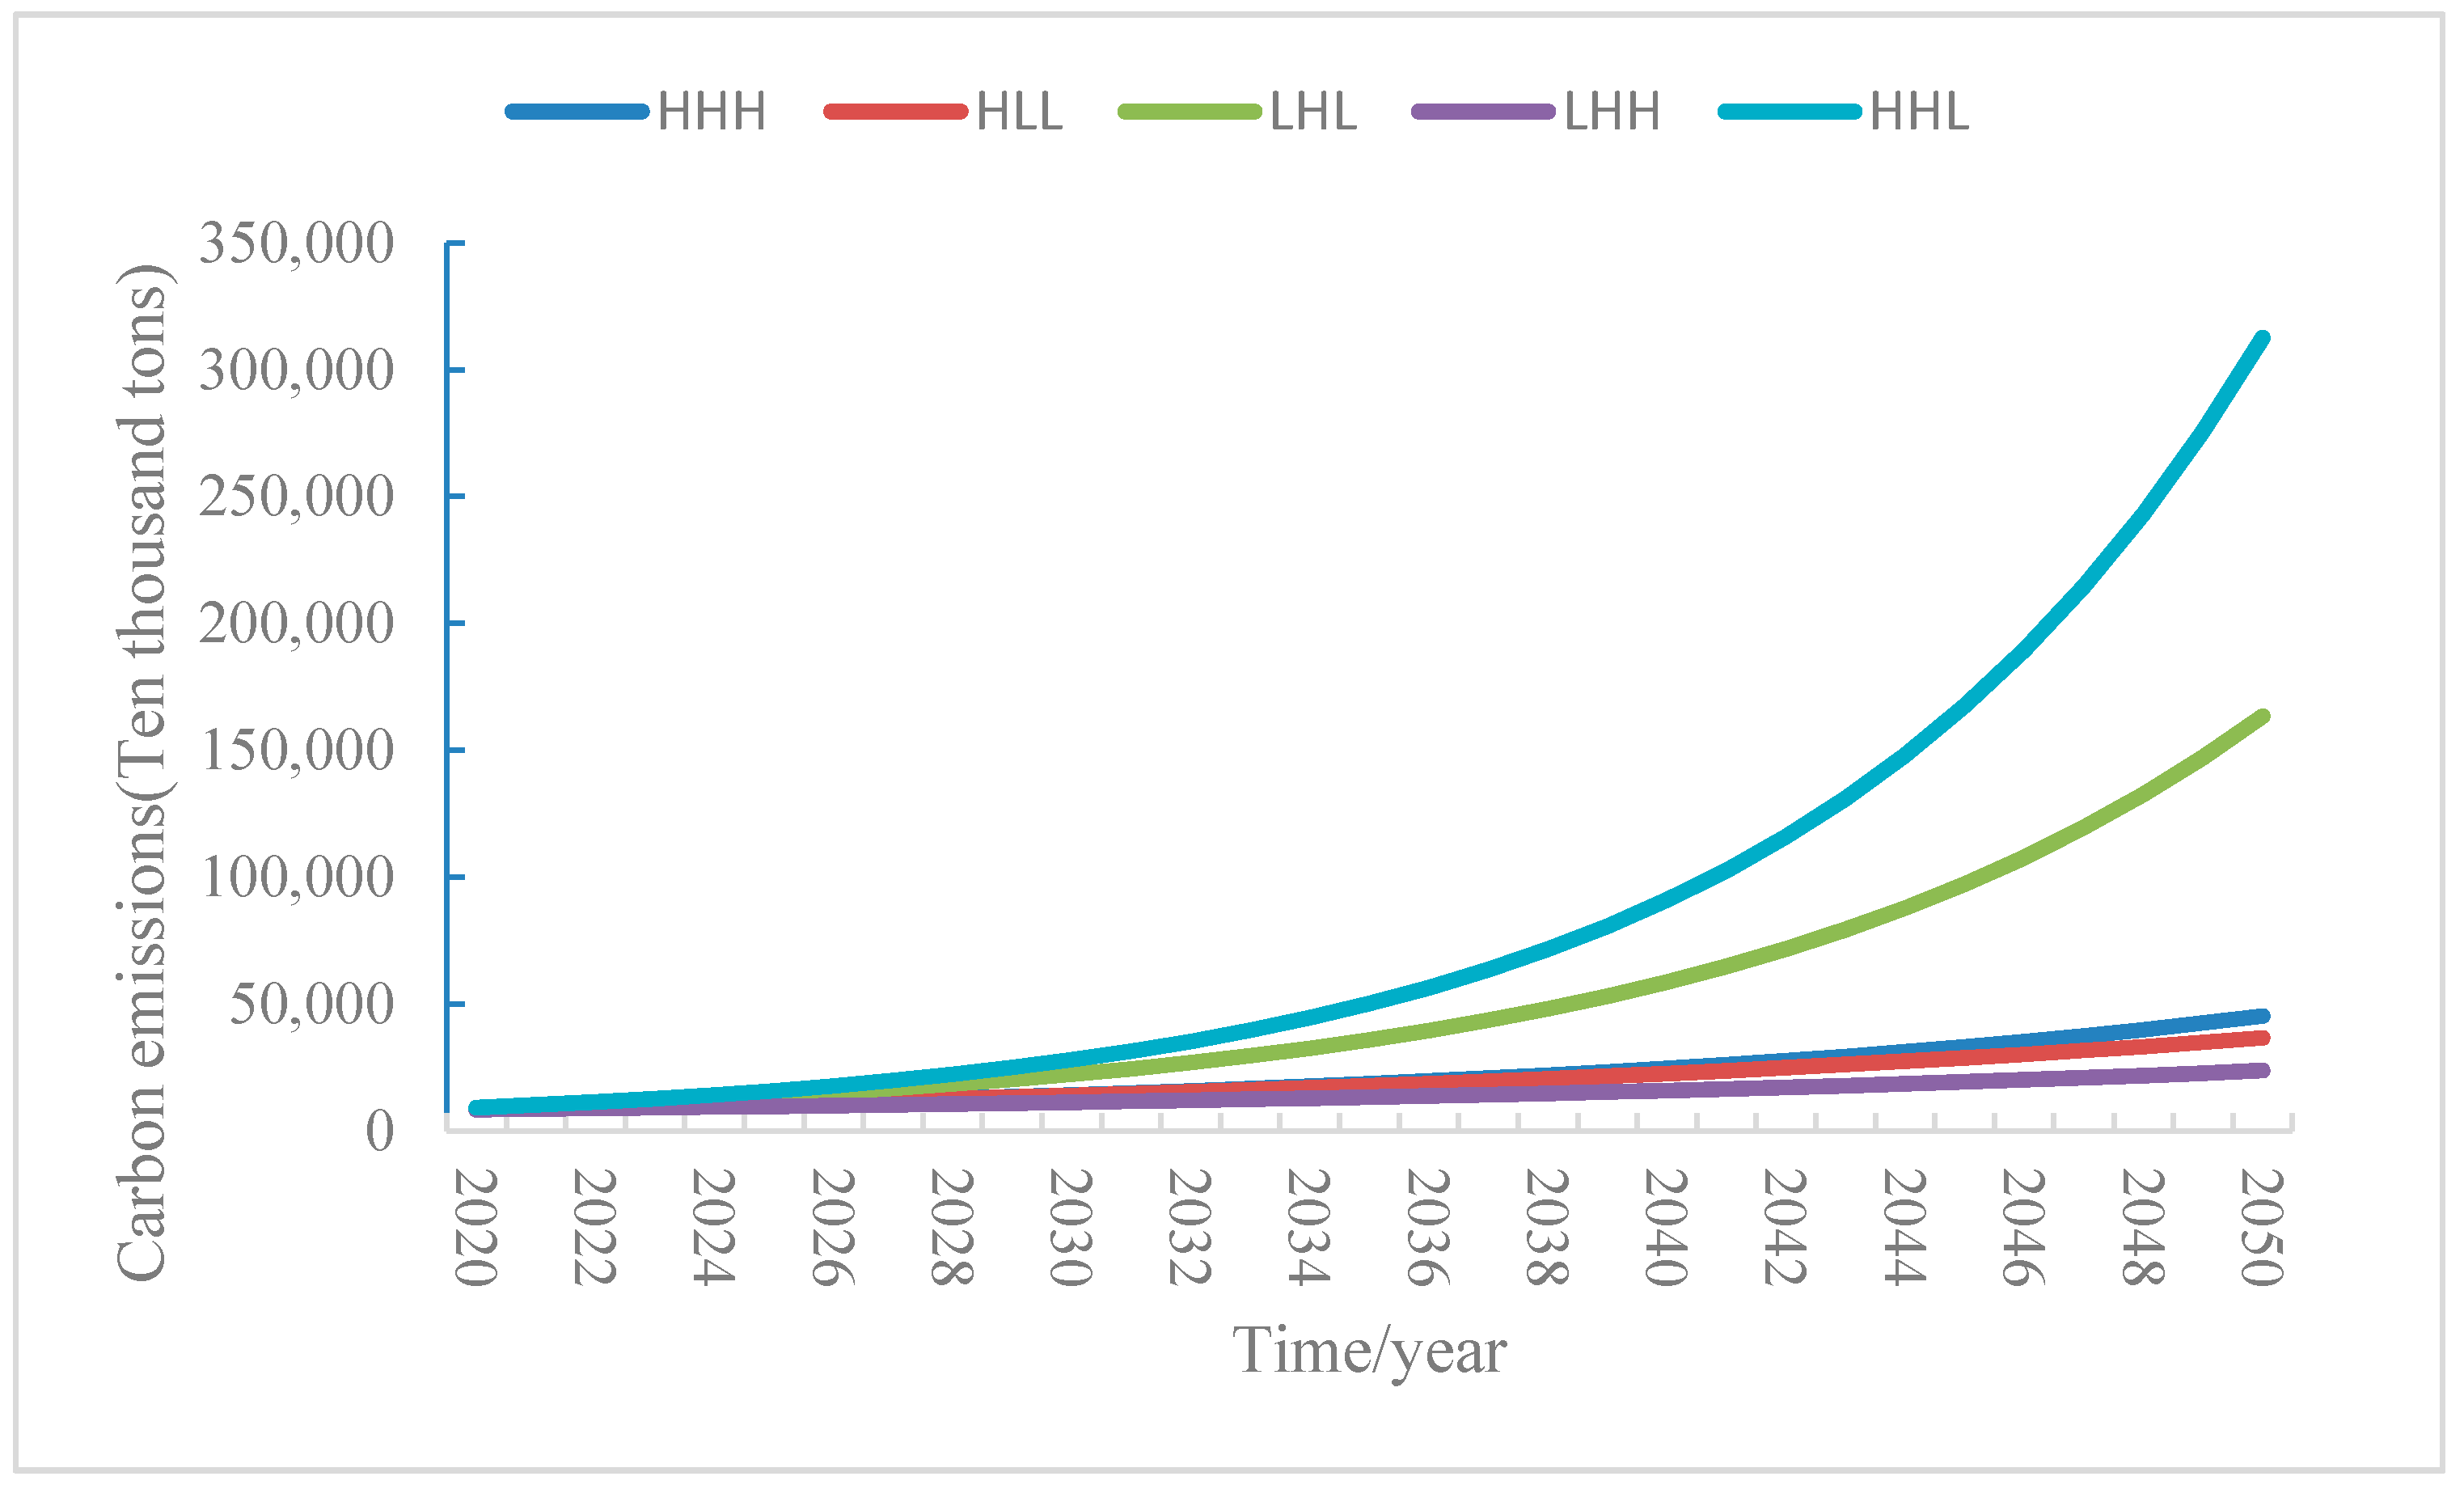
According to the five scenarios for the development of Nanjing shown in Table 4, the carbon emissions from future energy consumption in Nanjing were predicted using Equation (7). The prediction results are expressed in Figure 4. The carbon emissions from energy consumption in major years under different scenarios are shown in Table 5.
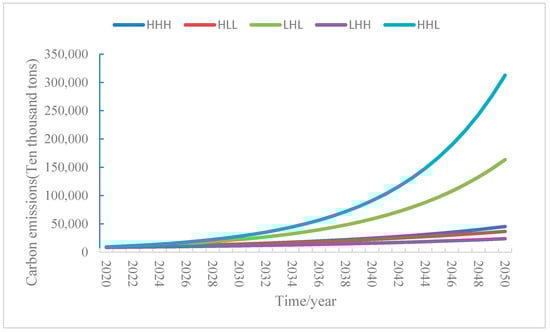
Figure 4.
Future energy carbon emissions in Nanjing under different situations.
Table 5.
Future energy carbon emissions in major years in Nanjing under different situations.
From Figure 4, it can be seen that future carbon emissions from energy consumption in Nanjing will increase the least under Scenario 4. By 2050, carbon emissions will be 236.89 million tons. Under Scenario 5, the future carbon emissions from energy consumption in Nanjing will increase fastest, reaching 3124.59 million tons by 2050, 2887.7 million tons more than or 13.19 times the result from Scenario 4. Under the development model represented by Scenario 2, carbon emissions are also very low. However, this development model requires Nanjing to maintain a low per capita GDP growth rate and maintain a low level of technology. This backward economic development model runs counter to the current trend of China’s development.
By comparing Scenario 1 and Scenario 4, both with high GDP per capita growth and high technological level, we see that when the population maintains low growth, the energy carbon emissions growth rate is slower. By comparing Scenario 3 and Scenario 4, both with low population growth and high GDP per capita growth, we see that reducing the growth rate of the technological level will reduce carbon emissions from energy consumption by 6.03% in 2020 and by 85.50% in 2050. Therefore, in order to control the future energy carbon emissions of Nanjing, we should not only control the population, but also raise the technological level. This means that in the future Nanjing should change the current mode of population growth, relieve the pressure of the population structure while maintaining balanced growth of the population, improve the supply and demand structure of human resources and the age structure of the population, and constantly promote the adjustment and optimization of industrial structure, improve the efficiency of resource utilization, and reduce the energy intensity relative to GDP.
4. Discussion: How to Produce a Win–Win Situation for Urban Development and Reduction of Carbon Emissions
The rapid acceleration in urban economic activity triggers dramatically increased urban demands for energy consumption. As a result, rapid urbanization of Nanjing is producing more carbon emissions with a corresponding rise in urban economic growth. Although the energy intensity of Nanjing declined each year during the past decade (Figure 2), the per capita urban energy use of Nanjing is still higher than those of other major cities in Western countries. For example, the per capita emission of Nanjing was 12.7 (tons/person) in 2016; this emission level is well above those of Tokyo (4.9 tons/person for 2012), London (9.6 tons/person for 2012), Singapore (7.9 tons/person for 2012), and others.
This is mostly because secondary industry, especially petrochemical industry, is a much bigger part of Nanjing’s economy. According to the statistics, in 2016, the petrochemical industry was responsible for releasing 86.39 million tons of carbon emissions, which accounted for 82 percent of the total industrial carbon emissions. Although petrochemical industry is considered as high pollution and carbon emissions industry, it plays a vital role in the process of industrialization-based urbanization, as its ability to absorb employments and integrate various industries [35]. Nanjing is no exception. In fact, the share of industrial output by value of 42 designed size petrochemical enterprises in Nanjing accounted for 16.4 percent in 2014, and their profits contributed over 9 billion government revenue. As a result, Wu et al. [36] argued that there is a pro-growth coalition of petrochemical industry in Nanjing.
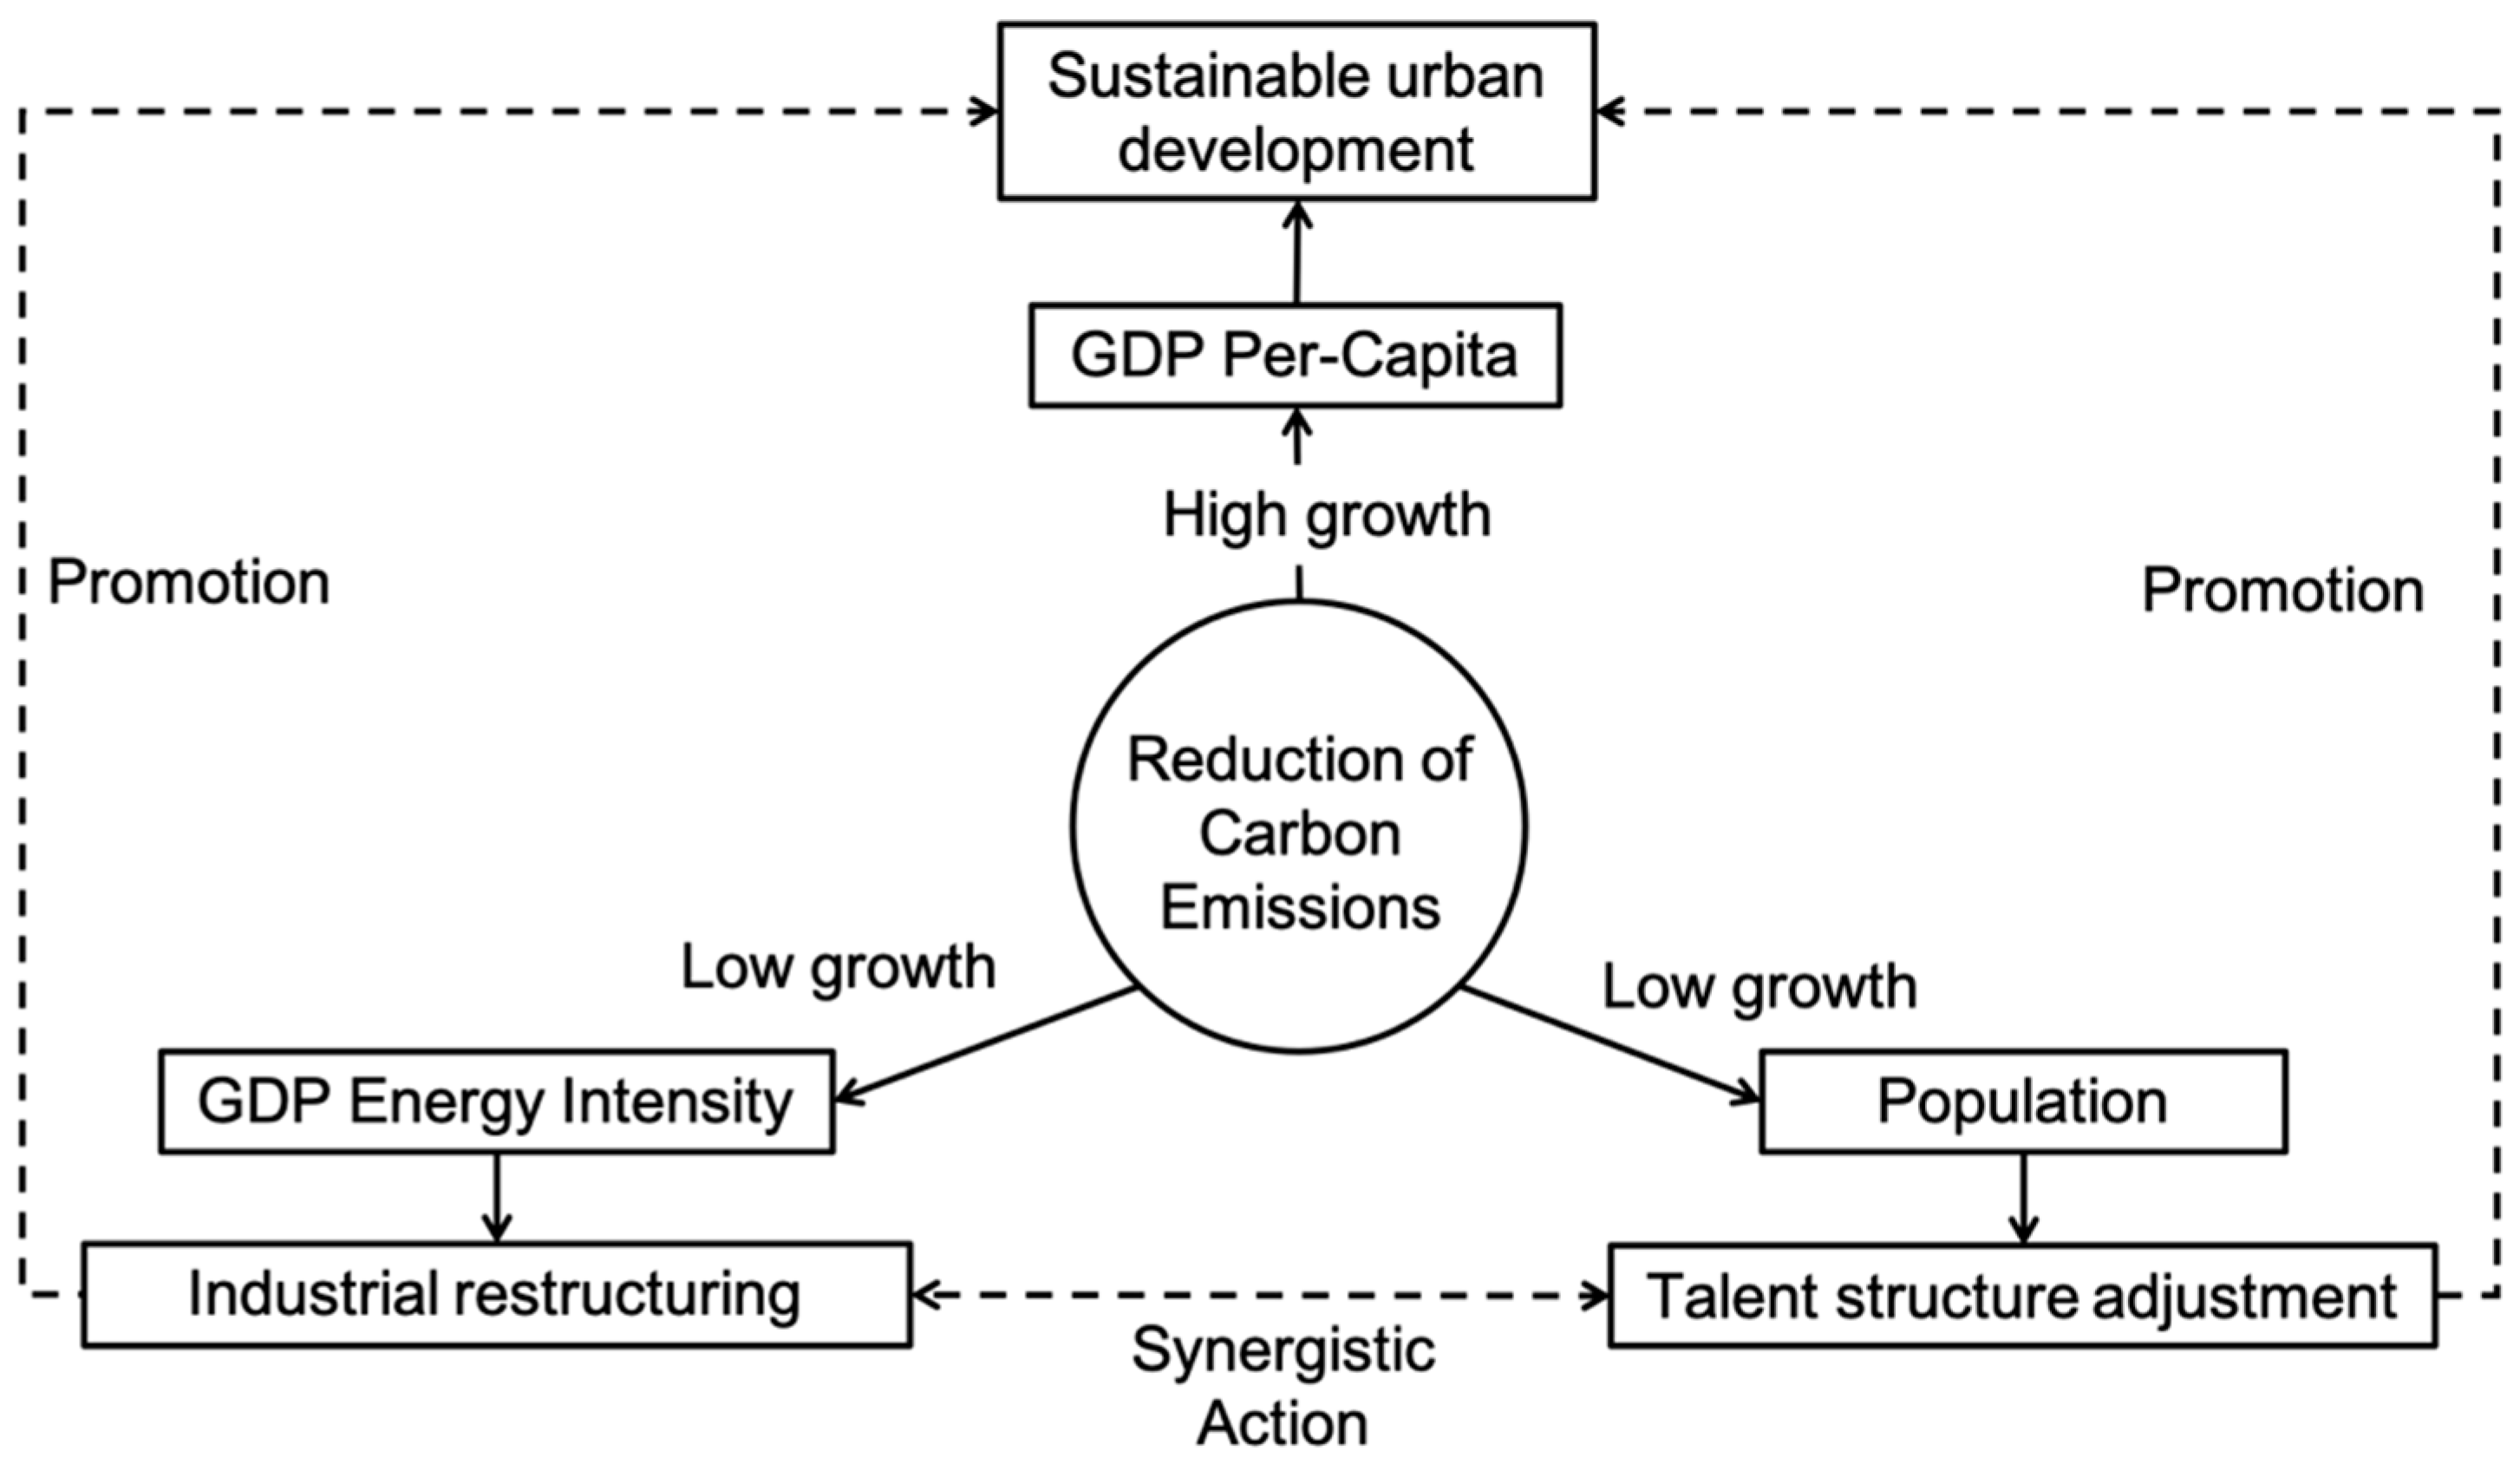
Reviewing the process of Chinese urbanization since the great reform and opening 40 years ago, it began with the rural reform that rural surplus labor moves into urban area and engages in manufacturing and service activities [37,38,39,40]. Expansion of the industrial sector then drives the urban economy, urbanization level, and population growth, and also results in constantly escalating carbon emissions in the process of urban development [41]. Thus, the association between the path of urban development and carbon emissions in Nanjing is an epitome of that in most big cities of China, and is consistent with the first half curve of EKC. Based on the scenario analysis, whether the curve of environmental degradation as well as the path dependence of carbon economy can meet a new inflexion depend on the adjustment and upgrade Nanjing’s industrial structure for a low growth of GDP energy intensity. Beyond that, industrial restructuring can benefit not only talent structure adjustment [42], but the promotion of development and use of clean energy [43]. Hence, new forces for sustainable urban development will be formed by the synergistic effect from these structural regulations (Figure 5).

Figure 5.
New forces for sustainable urban development.
5. Conclusions
Through the research, we can find that, Nanjing’s carbon emissions are related to population, GDP Per-Capita and GDP energy intensity. The most important reason is that secondary industry, especially petrochemical industry, contributes most of the carbon emissions. However, it is undeniable that these industries have provided Nanjing with the power of economic growth in the past decades. As a result, it can be said that the development of Nanjing in the past is a typical carbon economy. Therefore, the issue of carbon reduction is actually a debate about the urban development strategy. Our trend analysis also proves that if Nanjing continues the previous development strategy, Nanjing’s carbon emissions will continue to grow. Under the pressure of carbon reduction, this development model can be considered unsustainable.
In response to this, our trend analysis believes that to achieve a win-win situation for economic growth and carbon reduction, we must reduce GDP energy intensity while maintaining high GDP Per-Capita growth. In order to achieve this goal, the adjustment of industrial structure and the accompanying talent introduction strategy will be inevitable. The study of Nanjing enriches the research on the relationship between carbon emissions and economic development. Moreover, due to the typical nature of Nanjing, it also provides a useful reference for China and other industrialization-based developing countries to resolve the contradiction between carbon emissions and economic growth.
Author Contributions
Conceptualization, K.-Q.L. and R.L.; Data curation, R.-W.C.; Formal analysis, K.-Q.L.; Investigation, R.L.; Methodology, D.-D.M.; Resources, D.-D.M.; Software, R.-W.C.; Validation, K.-Q.L., R.L. and D.-D.M.; Writing–original draft, R.L.; Writing–review & editing, K.-Q.L. and L.-Q.Z.
Funding
This research was funded by National Natural Science Foundation of China (71704081), the Ministry of education of Humanities and Social Science project (15YJCZH246), the Jiangsu Provincial Social Science Foundation (18EYC007), the National Postdoctoral Fund (2017M621767,2015M570463), the Jiangsu Provincial Postdoctoral Fund (2018K061B), and Nanjing Agricultural University Fund Project (SKYC2017019, SKTS2017015, KJQN201850).
Acknowledgments
We thank Chunhui Liu for their suggestions on the paper.
Conflicts of Interest
The authors declare no conflicts of interest.
References
- Dhakal, S. Urban energy use and carbon emissions from cities in china and policy implications. Energy Policy 2009, 37, 4208–4219. [Google Scholar] [CrossRef]
- Zhang, Y.-J.; Da, Y.-B. The decomposition of energy-related carbon emission and its decoupling with economic growth in china. Renew. Sustain. Energy Rev. 2015, 41, 1255–1266. [Google Scholar] [CrossRef]
- Stern, D.I. The rise and fall of the environmental kuznets curve. World Dev. 2004, 32, 1419–1439. [Google Scholar] [CrossRef]
- Menegaki, A.N. Growth and renewable energy in europe: A random effect model with evidence for neutrality hypothesis. Energy Econ. 2011, 33, 257–263. [Google Scholar] [CrossRef]
- Magazzino, C. The relationship among economic growth, CO2 emissions, and energy use in the apec countries: A panel var approach. Environ. Syst. Decis. 2017, 37, 353–366. [Google Scholar] [CrossRef]
- Magazzino, C. Co2 emissions, economic growth, and energy use in the middle east countries: A panel var approach. Energy Sources Part B 2016, 11, 960–968. [Google Scholar] [CrossRef]
- Magazzino, C. Economic growth, CO2 emissions and energy use in the south caucasus and turkey: A pvar analyses. Int. Energy J. 2017, 16, 153–162. [Google Scholar]
- Moya, J.A.; Pardo, N.; Mercier, A. The potential for improvements in energy efficiency and CO2, emissions in the eu27 cement industry and the relationship with the capital budgeting decision criteria. J. Clean. Prod. 2011, 19, 1207–1215. [Google Scholar] [CrossRef]
- Wang, Z.; Wang, C.; Yin, J. Strategies for addressing climate change on the industrial level: Affecting factors to CO2, emissions of energy-intensive industries in china. Nat. Hazards 2015, 75, 303–317. [Google Scholar] [CrossRef]
- York, R.; Rosa, E.A.; Dietz, T. Bridging environmental science with environmental policy: Plasticity of population, affluence, and technology. Soc. Sci. Q. 2002, 83, 18–34. [Google Scholar] [CrossRef]
- Al-Mulali, U.; Ozturk, L. The effect of energy consumption, urbanization, trade openness, industrial output, and the political stability on the environmental degradation in the mena (middle east and north african) region. Energy 2015, 84, 382–389. [Google Scholar] [CrossRef]
- Munir, K.; Ameer, A. Effect of economic growth, trade openness, urbanization, and technology on environment of asian emerging economies. Manag. Environ. Qual. Int. J. 2018, 29, 1123–1134. [Google Scholar] [CrossRef]
- Wang, S.; Li, Q.; Fang, C.; Zhou, C. The relationship between economic growth, energy consumption, and CO2 emissions: Empirical evidence from china. Sci. Total Environ. 2016, 542, 360–371. [Google Scholar] [CrossRef] [PubMed]
- Han, Y.F.; Li, Q. Analysis on influencing factors of energy intensity in anhui province. Appl. Mech. Mater. 2012, 253–255, 203–206. [Google Scholar] [CrossRef]
- Xu, S.-C.; He, Z.-X.; Long, R.-Y. Factors that influence carbon emissions due to energy consumption in china: Decomposition analysis using lmdi. Appl. Energy 2014, 127, 182–193. [Google Scholar] [CrossRef]
- Lazarou, S.; Ekonomou, L.; Dagoumas, A. Correlation between representative concentration pathways and paris agreement. Int. J. Renew. Energy Res. 2018, 8, 929–940. [Google Scholar]
- Huang, R.; Zhang, S.; Liu, C. Comparing urban and rural household CO2 emissions—Case from china’s four megacities: Beijing, tianjin, shanghai, and chongqing. Energies 2018, 11, 1257. [Google Scholar] [CrossRef]
- Liang, Q.-M.; Fan, Y.; Wei, Y.-M. Multi-regional input–output model for regional energy requirements and CO2 emissions in china. Energy Policy 2007, 35, 1685–1700. [Google Scholar] [CrossRef]
- Chen, Y.; Lin, S. Decomposition and allocation of energy-related carbon dioxide emission allowance over provinces of china. Nat. Hazards 2015, 76, 1893–1909. [Google Scholar] [CrossRef]
- Lu, W.; Chen, C.; Su, M.; Chen, B.; Cai, Y.; Xing, T. Urban energy consumption and related carbon emission estimation: A study at the sector scale. Front. Earth Sci. 2013, 7, 480–486. [Google Scholar] [CrossRef]
- Akpan, G.E.; Akpan, U.F. Electricity consumption, carbon emissions and economic growth in Nigeria. Int. J. Energy Econ. Policy 2012, 2, 292–306. [Google Scholar]
- Dykhuizen, D. Selection for tryptophan auxotrophs of escherichia coli in glucose-limited chemostats as a test of the energy conservation hypothesis of evolution. Evolution 1978, 32, 125–150. [Google Scholar] [CrossRef] [PubMed]
- Magazzino, C. The relationship among real gdp, CO2 emissions, and energy use in south caucasus and turkey. Int. J. Energy Econ. Policy 2016, 6, 672–683. [Google Scholar]
- Magazzino, C. The relationship between CO2 emissions, energy consumption and economic growth in italy. Int. J. Sustain. Energy 2016, 35, 844–857. [Google Scholar] [CrossRef]
- Wang, S.; Fang, C.; Wang, Y.; Huang, Y.; Ma, H. Quantifying the relationship between urban development intensity and carbon dioxide emissions using a panel data analysis. Ecol. Indic. 2015, 49, 121–131. [Google Scholar] [CrossRef]
- Unruh, G.C. Understanding carbon lock-in. Energy Policy 2000, 28, 817–830. [Google Scholar] [CrossRef]
- Dietz, T.; Rosa, E.A. Effects of population and affluence on CO2 emissions. Proc. Natl. Acad.Sci. USA 1997, 94, 175–179. [Google Scholar] [CrossRef] [PubMed]
- York, R.; Rosa, E.A.; Dietz, T. Stirpat, ipat and impact: Analytic tools for unpacking the driving forces of environmental impacts. Ecol. Econ. 2003, 46, 351–365. [Google Scholar] [CrossRef]
- ArthurE, H.; Robert, W.K. Ridge regression: Biased estimation for nonorthogonal problems. Technometrics 2012, 42, 80–86. [Google Scholar]
- Zhao, W.; Niu, D. Prediction of CO2 emission in china’s power generation industry with gauss optimized cuckoo search algorithm and wavelet neural network based on stirpat model with ridge regression. Sustainability 2017, 9, 2377. [Google Scholar] [CrossRef]
- Wang, P.; Wu, W.; Zhu, B.; Wei, Y. Examining the impact factors of energy-related CO2 emissions using the stirpat model in guangdong province, china. Appl. Energy 2013, 106, 65–71. [Google Scholar] [CrossRef]
- Xiang, N.; Xu, F.; Sha, J. Simulation analysis of china’s energy and industrial structure adjustment potential to achieve a low-carbon economy by 2020. Sustainability 2013, 5, 5081–5099. [Google Scholar] [CrossRef]
- Swart, R.J.; Raskin, P.; Robinson, J. The problem of the future: Sustainability science and scenario analysis. Glob. Environ. Chang. 2004, 14, 137–146. [Google Scholar] [CrossRef]
- Zhang, P.; He, J.; Hong, X.; Zhang, W.; Qin, C.; Pang, B.; Li, Y.; Liu, Y. Regional-level carbon emissions modelling and scenario analysis: A stirpat case study in henan province, china. Sustainability 2017, 9, 2342. [Google Scholar] [CrossRef]
- Xu, B.; Lin, B. How industrialization and urbanization process impacts on CO2 emissions in china: Evidence from nonparametric additive regression models. Energy Econ. 2015, 48, 188–202. [Google Scholar] [CrossRef]
- Wu, Q.; Zhang, X.; Li, H.; Chen, H.; Li, Z.; Shang, Z. Pro-growth giant business, lock in, sustainable urban development and effect on local political economy: The case of petrochemical industry at nanjing. J. Clean. Prod. 2015, 107, 324–332. [Google Scholar] [CrossRef]
- Lin, G.C.S. Transformation of a rural economy in the zhujiang delta. The China Quarterly 1997, 149, 56–80. [Google Scholar] [CrossRef]
- Lo, C.P. Recent spatial restructuring in zhujiang delta, south china: A study of socialist regional development strategy. Ann. Assoc. Am. Geogr. 1989, 79, 293–308. [Google Scholar] [CrossRef]
- Gollin, D.; Jedwab, R.; Vollrath, D. Urbanization with and without industrialization. J. Econ. Growth 2016, 21, 35–70. [Google Scholar] [CrossRef]
- Liu, C.; Song, W.; Zhou, C. Unsuccessful urban governance of brownfield land redevelopment: A lesson from the toxic soil event in changzhou, china. Sustainability 2017, 9, 824. [Google Scholar] [CrossRef]
- Sadorsky, P. Do urbanization and industrialization affect energy intensity in developing countries? Energy Econ. 2013, 37, 52–59. [Google Scholar] [CrossRef]
- Kuruvilla, S. Linkages between industrialization strategies and industrial relations/human resource policies: Singapore, malaysia, the philippines, and india. ILR Rev. 1996, 49, 635–657. [Google Scholar] [CrossRef]
- Lazarou, S.; Vita, V.; Diamantaki, M.; Karanikolou-Karra, D.; Fragoyiannis, G.; Makridis, S.; Ekonomou, L. A simulated roadmap of hydrogen technology contribution to climate change mitigation based on representative concentration pathways considerations. Energy Sci. Eng. 2018, 6, 116–125. [Google Scholar] [CrossRef]

© 2018 by the authors. Licensee MDPI, Basel, Switzerland. This article is an open access article distributed under the terms and conditions of the Creative Commons Attribution (CC BY) license (http://creativecommons.org/licenses/by/4.0/).