Abstract
Energy consumption in water supply systems is closely connected with the demand for water, since energy is mostly consumed in the process of water transport and distribution, in addition to the energy that might be needed to pump the water from its sources. Existing studies have been carried out on optimizing the pump operations to attain appropriate pressure and on controlling the water level of storage facilities to transfer the required demand and to reduce the energy cost. The idea is to reduce the amount of the water being supplied when the unit price of energy is high and to increase the supply when the unit price is low. To realize this scheme, the energy consumption of water supply systems, the amount of water transfer, the organization of energy cost structure, the utilization of water tanks, and so forth are investigated and analyzed to establish a model of optimized water demand management based on the application of water tanks in supplied areas. In this study, with the assumption that energy cost can be reduced by the redistribution of a demand pattern, a numerical analysis is conducted on transferring water demand at storage facilities from the peak energy cost hours to the lower energy cost hours. This study was applied at the Bupyeong 2 reservoir catchment, Incheon, Korea.
1. Introduction
These days, it is always necessary to make big efforts to save energy costs. In addition, energy savings in South Korea are always an important matter. Nationwide, South Koreans were reminded of this issue after suffering traumatic damage from a major blackout throughout the country in 2011. In addition, energy issues relating to climate change and emission reductions are currently treated as part of the national competitiveness strategy (IEA, Paris, France, 2012) [1].
In terms of water distribution networks (WDNs), water saving strategies (e.g., water demand control and water efficient design) are generally implemented as part of energy saving efforts by water saving company projects, water saving utilities, and different campaigns. These programs are favorably progressing since water use is naturally connected with energy consumption.
Previous studies on demand management have established various data sets on water consumption patterns for different purposes of water use. Furthermore, several strategies have emerged and have been tested in previous studies [2,3,4,5,6,7]. In addition, Kim et al. (2007) and Kanakoudis and Tsitsifli (2013) monitored water demand patterns and their side effects in terms of hours in the day, days in the week, season, and weather [8,9]. Myeong et al. (2011) studied water demand with spatial patterns, such as the house type, number of rooms in the house, house area, and population in the house, by statistical analysis [10]. In addition, Kim et al. (2012) studied leakage as one of the reasons for energy overconsumption and developed a strategic model of leakage detection by demand pattern analysis [11]. Kanakoudis and Gonelas (2016) studied the economic leakage level in a water distribution system [12], and the same authors (2015) studied the joint effect of cost and water pressure. Seo (2011) developed a water savings index to evaluate strategies driven by local authorities and Kanakoudis and Gonelas (2015) studied water price changes based on pressure management [13,14].
Several preliminary studies on water storage facilities have been conducted. Previous studies have mainly focused on assessing storage facilities throughout the country [15,16]. The results have provided data on water tanks and their hydraulic characteristics, downtime, and water quality. Generally, the downtime averaged 0.3–3.9 days, and generally only 37.6% of total storage capacity was used.
Most of the studies on WDNs have focused on water safety (quality), stable distribution (quantity), future water demand estimates, and efficient management [17,18,19,20]. To date, however, the primary subjects of the current study (e.g., control of water demand patterns and energy savings) have not been extensively researched.
The major purpose of the current study is to develop a strategy of controlling the hourly patterns of water consumption by using storage facilities in order to reduce water use during high energy price hours (peak time) by distributing water use from peak times to low energy price hours. The purpose and scope of this study include the following: (a) investigate storage facilities in South Korea and especially Incheon, which is a metropolitan city; (b) develop a MATLAB (MATLAB R2013a, MathWork, Natick, MA, USA) optimization model with a genetic algorithm (GA) for energy cost minimization; (c) apply an EPANET (EPANET 2.0, US EPA, Cincinnati, OH, USA) model to assess WDNs; and (d) apply an EPANET model as a variable of a MATLAB optimization model to finalize the results.
2. Materials and Methods
2.1. Energy Consumption
Generally, energy costs reflect geomorphological conditions from the source to the consumers; however, energy consumption in WDNs varies in location and process [21]. For instance, most energy consumption at a water treatment plant (WTP) is for facility operation, as it uses gravity-dominant flow, while water distribution pipelines use most of the energy for pumping using pressure flow. Energy consumption at a WTP will remain unconditionally compulsory and uncontrollable until new energy efficient machines are developed. However, pumping energy can be varied and reduced by its cost optimization. In addition, pumping energy, which uses electricity, incurs variable costs by the season and hour of the day; therefore, it is necessary to understand the electricity price system when investigating how to minimize the energy cost [22,23]. It is essential to secure stable electricity in the daytime as higher consumption is needed, and this phenomenon is connected with high-cost materials for power generation and high costs for energy consumption [24]. For example, in South Korea, unit cost per kilowatt-hour (Kw h) varies from 0.059 US dollar (USD) to 0.193 USD depending on the time of day (the cost is approximately 3.25 times higher at peak versus low usage times), and it could be possible to reduce around 69.2% of the energy cost by optimization. Table 1 shows an example of the energy consumption at the peak, intermediate, and low cost levels of water supply systems.

Table 1.
Energy consumption at a water supply system (example of South Korea).
According to the characteristics of the price of electricity, it is necessary to consider the hour of the day, demand distribution, and storage facility type (tank or reservoir). In terms of the hour of day, the peak hour varies depending on the season, and hourly energy consumption patterns also vary according to the season. However, seasonal water consumption patterns are similar to one another unless demand patterns are properly managed for energy cost savings by using a storage facility, such as a water storage tank at an apartment complex. The storage facility could be filled with water during low-cost hours and could supply water during high-cost hours from the facility without (or partially) using the main water supply [9]. Furthermore, WDNs with different WTPs might have distinct differences, and each WDN has its own storage facilities. Therefore, energy cost can be minimized through optimal operations of demand pattern control, WTPs, and storage facilities [25,26]. Although the price of water supply does not vary with time, the minimized, by optimization, energy cost can affect the improvement of water pricing policy [27].
2.2. Water Storage Facilities
Water supply by WDNs is occasionally operated by different supply methods, such as (1) direct water supply (i.e., water coming directly from the water supply); (2) indirect water supply (i.e., through storage facilities such as a tank); and (3) combinations of direct-indirect water supplies. In general, storage facilities are used to ensure a stable water supply with constant water supply through securing water pressure. Table 2 presents the current state of installed water storage facilities in Incheon metropolitan city.
Table 2.
Water distribution storage facilities (water tank) in Incheon city.
Most of the storage facilities are installed in the apartments or in large buildings with areas greater than 2000 m2. The storage facilities are operated by individual buildings, and there is no special code on storage facility operations; therefore, the operation of facilities occasionally depend on the practically based rule of meeting water demand. Kwak et al. (2005) studied the hydraulic characteristics of water storage facilities [16]. In their study, downtime averaged 0.3–3.9 days and the water level average was 37.6% of height. At this level, and operating inefficiently, less than 40% of the storage facility is being used. However, water demand is typically less than 40% of the capacity of a water storage facility, and the rest (60% of storage) of the capacity can be used as research capacity for this study.
2.3. EPANET
Since the EPANET model was developed by the US Environment Protection Agency in 1994, hydraulic simulations of WDNs have been routinely implemented. EPANET has been extensively used as a tool for research implementation in terms of network design optimization [28,29]. EPANET can be used through a graphical user interface (GUI) as standalone software or can be used through a toolkit library using open source user-specific software. The library and source code can be called through external programming language [29]. In this study, the MATLAB toolkit for the EPANET model was used [30]. MATLAB allows connections to external software libraries, which can help researchers use tools and simulators developed originally in a different language. The EPANET source code was originally formulated in C language.
2.4. Genetic Algorithms
GAs are widely used for the optimization of water-related problems [28,31,32,33]. This optimization technique searches for a solution with minimum costs given as the objective goal of the target problem [33]. Prasad et al. (2003) presented a GA with multivariable functions for an optimal design of WDNs using a Pareto-optimal approach [34]. Prasad and Park (2004) outlined a multi-objective GA for an optimal WDN design [35]. Deb and Jain (2014) developed a nondominated sorting approach for Multi-objective Genetic Algorithm (MOGA) for multi-objective optimization [36]. The considered objectives minimize the error among real and simulated values and maximize reliability. In this study, a GA was selected and coded by simple revision. The GA, based on Deb and Jain’s (2014) work [36], included the following considerations: (1) minimum and maximum values for mutation and cross-over; (2) the EPANET model as its variable; (3) many variables with multiple objectives; and a (4) simultaneously fixed bug at mutation with 10+ variables. The GA model was applied for emitter calibration by minimizing errors because the number of variables to be calibrated in WDN was the same as the number of junctions in the network. The EPANET model was applied as the general solver for variables to be calibrated in conjunction with GA. The Pareto front (known as the nondominated solution set) is the fully optimal solution in a multi-objective sense, and the GA is a robust optimization approach for multi-objective purposes with the Pareto front [37].
3. Development of the Optimization Tool
3.1. Objective Function
A formula was developed based on the concept of energy costs for water transfer in WDNs. Energy costs are closely related to water flow and its unit energy cost, and water flow is generated based on water consumption, which has occasionally similar patterns in terms of the energy cost hourly patterns. A possible assumption is that the energy cost could be minimized by redistributing pattern within the concept of GA optimization. The basic concept for optimization is described in Figure 1.
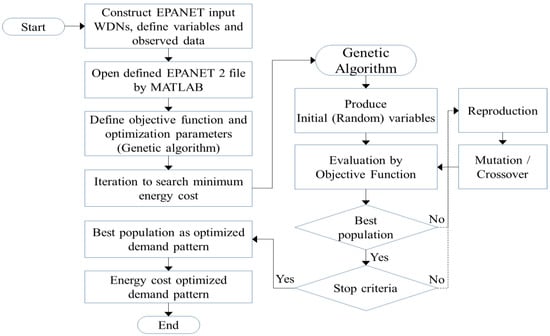
Figure 1.
General framework for energy cost optimization.
As shown in Figure 1, the demand pattern is considered as a variable, and they become input variables for EPANET to produce the variation of water flow rate. Produced water flow rate as an hourly pattern becomes a new water consumption pattern, and the calculation is iterated through GA optimization. In addition, the energy cost by each pattern is calculated, and the iteration continues until the tool finds the minimum cost as specified.
The water consumption at peak cost time can be classified by consumption through a direct water supply or an indirect water supply (by tank). A direct water supply cannot control the consumption pattern, while an indirect water supply can control it by storage operation. A water supply with high-cost pumping energy during peak price hours can be moved to low-cost hours through tank storage operations. Thus, the daily water supply can be expressed through the summation of a controllable water supply and an uncontrollable water supply, and the energy cost is the summation of hourly water supply multiplied by hourly energy cost, as depicted in Equations (1) and (2):
where is the daily total water consumption, is the daily water consumption by direct water supply (without a storage facility), is the daily water consumption by the indirect water supply (with a water storage facility), is the dimensionless pattern of water consumption for the direct water supply (uncontrollable) at time step and can be determined through hourly water consumption by direct water supply divided by the , is the dimensionless pattern of water consumption for the indirect water supply (controllable) at time step and can be determined by hourly water consumption (indirect with a water storage facility) divided by , and is the energy cost for water transfer at time step . and are dimensionless hourly patterns of daily water consumption and they vary within a range from zero to one and the sum of 24 h value should be one, respectively. In Equations (1) and (2), and are fixed daily value and is also a fixed value; therefore, , and are variables out of design space while is a variable that varies within the range from zero to one. In addition, unit cost of electricity also varies with time and season. Therefore, the water consumption designed by the and the energy cost designed by the unit price of electricity were used as the bi-objective Pareto front objective function. By Equations (1) and (2), the objective function for optimization can be defined as Equation (3):
where is the water consumption at time step , and is the unit price of electricity at time step . The energy cost optimization should also consider the stability of water consumption by securing the necessary water pressure; therefore, there must be two constraints. In the optimization model, we tried to find the lowest objective function value as the energy cost for the water supply through designing a variable. However, some of chromosomes that are produced through GA can lead to unexpected or infeasible values. Previous studies on GA recommend defining a penalty for them to guide algorithms to avoid infeasible values through defining penalty functions [38,39]. Therefore, the first constraint applies a penalty function throughout the WDNs at junctions, and the other constraint defines the pressure range constraint at specified junctions. Therefore, the penalty function is defined as Equation (4):
where is the pressure at all junctions within total WDNs, and is a coefficient to determine relativeness among OF and PF. The value of is zero when the pressure at the junction is in the range of specified minimum and maximum pressure by user specification. Thus, the OF can be revised within the consideration of PF as Equation (5):
3.2. Study Area
In this study, the study area is chosen in the effluence area of Bupyeong’s second water supply reservoir since there are several different types of storage facilities and different types of land use (e.g., residential, commercial, public, and an apartment complex). In addition, data about WDNs, electricity, and hydraulic data (flow rate and pressure) could be secured. Figure 2a shows the boundary and land use data of the study area, and Figure 2b shows the pipeline on the block.
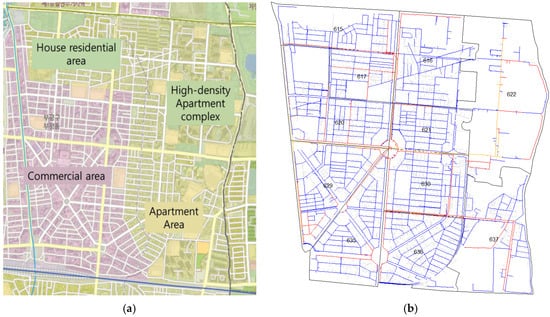
Figure 2.
Maps of study area: (a) land use map; and (b) pipeline map.
In the study area, the daily maximum water supply is 46,000 m3/day, and the water supply is generally coming from Bupyeong’s second water supply reservoir, which has 20,000 m3 of capacity, 59.5 m at the high-water level, and 55 m at the low-water level. The maximum water use pattern occurs between 6:00 p.m. and 7:00 p.m., and the water use pattern for the high energy cost time frame (peak hours) and the intermediate high cost time frame (mid hours) is high while the pattern for the low energy cost time frame (low hours) is low. Thus, it is possible to lower energy costs by redistributing the water use pattern. The water use pattern is shown in Figure 3.
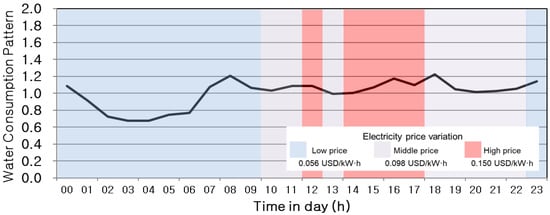
Figure 3.
Water demand pattern of the study area.
In Figure 3, the water demand pattern is high during peak cost and intermediate cost hours, while the pattern is low during low energy cost hours. In this study, we assumed that the high water demand pattern can be moved to the low energy cost hours by using the water storage facilities (which are not actively used), and the use of facility can be determined by the optimization process.
The study area has 122 storage facilities and 11,321 m3 of capacity in total storage facilities. The total capacity of the storage facilities is approximately 24% of the daily maximum water supply (46,000 m3/day). Seven storage facilities have greater than 500 m3 of capacity, and they represent about half the total capacity of all the storage facilities, as shown in Table 3.
Table 3.
Number of storage facilities and their water demand in study area.
The official GIS provided from Incheon city authorities was used as the major input for EPANET modeling, and the water use pattern data was included in the model for an extended period simulation. The completed set of EPANET data was validated by test simulation and added as a variable of Matlab GA optimization. Table 4 shows the summarized parameters for GA optimization.
Table 4.
Main parameters for genetic algorithm optimization.
The parameters were determined through several test implementations. Moreover, the main variable for optimization was the WDN’s pipe network problem, which was also quite complicated to solve. The length of chromosome was set as 24 since there were 24 real number coding for each hour pattern (24/day). The population was set as 50 after several practice runs. The linear ranking was selected as 1.7 for higher selective pressure. In addition, random selection for crossover and a 0.1 mutation ratio were selected.
The model simulation consisted of five different cases for each season. The first case shows the current state of operation without any application of energy saving strategies. The second, third, and fourth cases depict the redistribution of water demand to the low energy cost hours at 60%, 80%, and 100% of water use, respectively. The last case applies the GA optimization. Table 5 shows detailed descriptions of the simulation cases.
Table 5.
The classification of cases.
4. Results and Discussion
4.1. Model Sensitivity and Convergence
To choose the value of , a coefficient to determine relativeness among objective function and penalty function as described in Equation (4), the sensitivity of was examined. The result is shown in Figure 4.
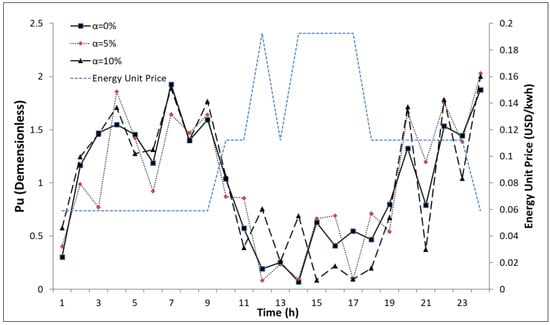
Figure 4.
Demand pattern change by the penalty function coefficient.
The pattern of (the dimensionless pattern of water consumption for the indirect water supply, which is controllable, at time step ) in Figure 4 is similar to all cases since the GA is calculated based on the rank of the generated population, and the extreme values in the population are excluded due to their low rank. However, the higher value of distributes homogeneous pressure, which could provide less fluctuation since the penalty function reflects the pressure in the pipe network. In addition, the simulation time, from start to convergence, with the value of higher was shorter than lower or the zero value of . To summarize, the penalty function affected the convergence in determining the optimized value of the objective function; however, the sensitivity itself was not high. The value of was determined as 10% by the analysis. The convergence of the objective function with the value of as 10% is shown in Figure 5.
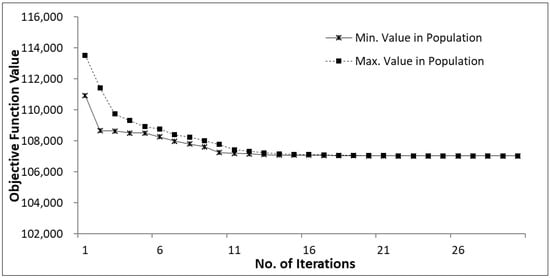
Figure 5.
Convergence of objective function value with summer season data.
The convergence was tested with the result of the objective function value in the summer season. The convergence was completed at the 22nd generation. Fast convergence can show the lack of diversity; however, this fast convergence could be made by the effect of the penalty function, which can provide a strong exploration capacity for the model. The total number of pipe networks with iterations was 1100 times, and the convergence made a slow improvement, which can be appropriate for optimization. In addition, the convergence patterns in the other seasons were similar to the example of the summer season.
To optimize the energy cost, we examined cases by uniform distribution and optimization in different seasons; however, the spring and autumn seasons were treated as the same case since the energy cost in the spring and autumn are the same. The classification of cases is shown in Table 5.
4.2. Summer Season
In the summer season, the flow rate between 10:00 a.m. and 11:00 p.m. (peak and mid hours) is high, while water consumption for the low energy cost hours is comparably low, as shown in Figure 6.
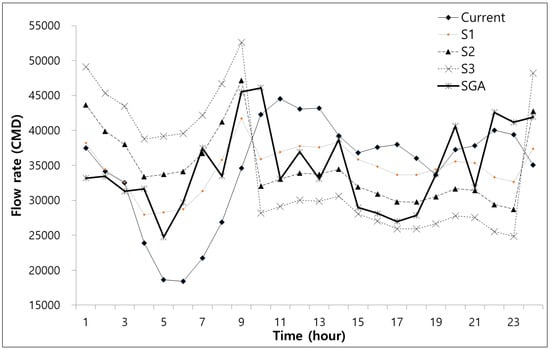
Figure 6.
Resulting comparison for the summer season.
In Case S1, water consumption from the storage facilities was increased during the low energy cost hours, while it decreased during peak and mid hours. Bigger variations occurred in Case S2 and S3, with an almost reversed pattern from the current state. In addition, the results of S1, S2, and S3 showed different scales of variations by the different proportions of storage usage but showed similar variation patterns since the distribution method was almost the same. In the case with GA optimization (SGA), the pattern was between the patterns of S1 and S2 during the low energy cost hours, while the pattern was similar to the S3 pattern during peak hours. It is clear that the water demand during peak hours and mid hours was transferred and distributed for low cost hours, as shown in Table 6.
Table 6.
Hourly variation of flow rate patterns for the summer season.
As shown in Table 6, the transferred water from intermediate hours to low hours is higher in cases S1, S2, and S3 than for SGA, while the transferred water from peak hours to low hours is higher in the SGA case than in the rest of the cases. Therefore, in the cases for the summer season, the SGA case shows higher efficiency for energy savings. Figure 7 shows the transferred water demand from the peak and mid hours to the low hours.
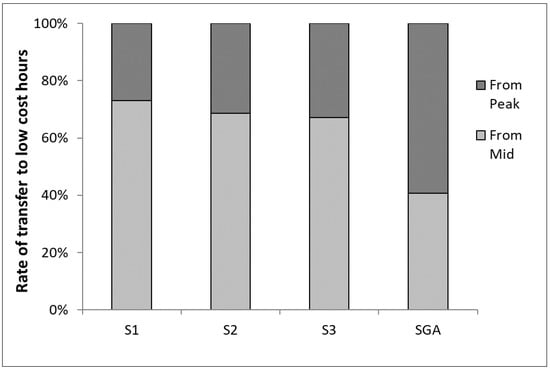
Figure 7.
Flow rate transferred to low cost hours by summer season simulation.
In Figure 7, the water demand transferred from peak hours to low hours in cases S1, S2, and S3 was approximately 27–33%, while it was approximately 60% in the SGA case, as the GA tries to give priority for water demand during peak hours. The saving effect in case S1 and SGA was approximately 33.3%.
4.3. Winter Season
In the winter season, unlike the summer, the flow rate is very high in the evening time, especially between 6:00 p.m. and 9:00 p.m. and 10:00 p.m. and 11:00 p.m., as shown in Figure 8.
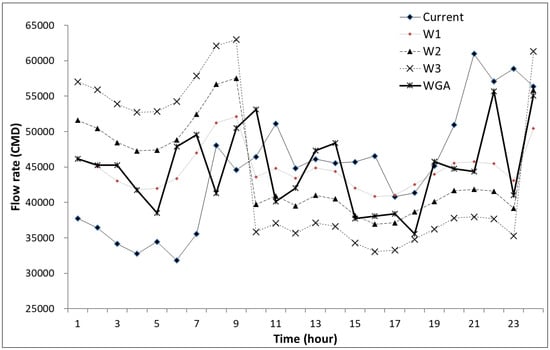
Figure 8.
Result comparison for the winter season.
In cases W1, W2, and W3, the variations of water demand pattern from the current state were similar to the cases for the summer season. In addition, the pattern revised by case W1 was similar to the WGA case. W1, W2, and W3 at 11:00 p.m. were close to one another, with the highest variations in the day. Demand pattern changes in the W1, W2, and W3 cases were similar to the results of the summer season in S1, S2, and S3, respectively, with the reversed demand, while the WGA case showed very low demand between 5:00 p.m. and 6:00 p.m. and at 11:00 p.m. It is clear that the water demand during the peak and mid hours was transferred and distributed to the low hours, as shown in Table 7.
Table 7.
Hourly variation of flow rate pattern for the winter season.
As shown in Table 7, the transferred water from mid hours to low hours is higher in the W1, W2, and W3 cases than the WGA, while the transferred water from peak hours to low hours is higher in the WGA case than in the rest of the cases, which was similar to the case for the summer season. Therefore, in the cases for the winter season, the WGA case shows higher efficiency for energy savings. Figure 9 shows the transferred water demand from the peak and mid hours to the low hours.
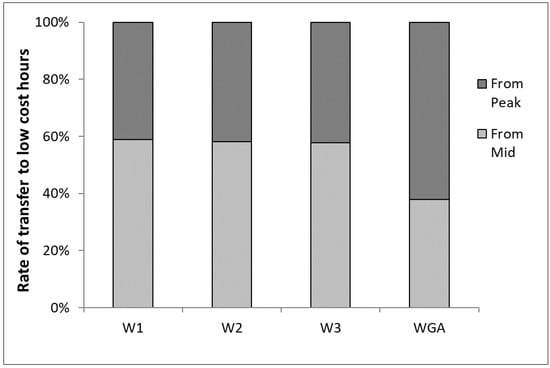
Figure 9.
Flow rate transferred to low cost hours by the winter season simulation.
In Figure 9, the water demand transferred from the peak hours to the low hours in cases W1, W2, and W3 was approximately 40%, while it was approximately 60% in the WGA case, as the GA tries to give priority for water demand during peak hours. The saving effect by cases W(1, 2, and 3) and WGA was approximately 33.3%.
4.4. Spring and Autumn Seasons
In the spring and autumn seasons, unlike the summer or winter seasons, the flow rate was high during the daytime and continuous in the evening, as shown in Figure 10.
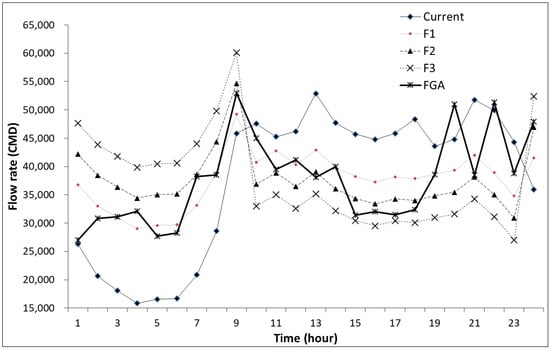
Figure 10.
Result comparison for the spring-autumn season.
In the spring and autumn seasons, the shapes of the curves in Figure 10 are very different between the current state and the simulation cases. In the current case, no significant variation is observed between 9:00 a.m. and 9:00 p.m., while the simulation cases show an hourly varying curve as high demand during the morning and evening. F1, F2, and F3 show a similar variation as the S1, S2, and S3, respectively. However, the F1 and F2 cases do not show the reversed demand pattern in the morning and evening, while F3 shows a reversed pattern from the morning to evening. In terms of the FGA case with GA optimization, the curve is quite close to the SGA since the hourly energy cost in spring, summer, and autumn is constant. The differences between the current state and SGA are comparably small because of a fairly constant demand pattern in the current state. A comparison of energy costs is summarized in Table 8.
Table 8.
Hourly variations of the flow rate pattern for the spring–autumn season.
As shown in Table 8, the transferred water from the mid hours to the low hours is higher in cases F1, F2, and F3 than in FGA, while the transferred water from the peak hours to the low hours is higher in the FGA case than in the rest of the cases, similar to the case for the summer season. Therefore, in the cases for the winter season, the FGA case shows higher efficiency for energy savings. Figure 11 shows the transferred water demand from the peak and mid hours to the low hours.
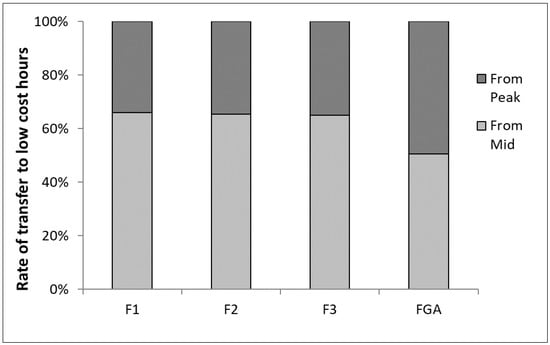
Figure 11.
Flow rate transferred to the low cost hours in the spring–autumn season simulation.
In Figure 11, the water demand transferred from the peak hours to the low hours in cases F1, F2, and F3 were approximately 35%, while it was approximately 50% in the FGA case, as the GA tries to give priority for water demand during peak hours. The saving effect in cases W(1, 2, and 3) and FGA was approximately 30%.
4.5. Energy Cost Savings
As discussed in the previous chapter, only 37.6% of the storage facilities are being used in the current state. Therefore, the realistic, available capacity to be used for energy cost optimization is approximately 60% of total storage facilities, and only the S1, W1, and F1 cases could be considered close to the real world scenario. The current seasonal simulations (S1, W1, and F1) and optimization cases (SGA, WGA, and FGA) compared in this chapter are summarized in Table 9.
Table 9.
Comparison of energy cost by current state (base) and simulation cases for each season.
In terms of the energy cost in the summer season, the cost reductions would be 4.22% for S1, 6.33% for SGA, 4.06% for W1, and 4.69% for WGA from the 3.92 USD/m3 cost at the current state. For spring and autumn, F1 and FGA can be reduced by 4.71% and 5.51%, respectively. It means that the energy efficiency reduction is best in the summer season, while the winter season does not show significant differences.
In this study, only WDNs were applied to reduce the energy cost in a water supply system; however, the cost reduction ratio could be applied to the whole process in the water supply system, including the water supply pump from the WTP to the reservoir, the intake pump, and the boost pump from the intake to the WTP. The monthly reduction ratio is determined as the reducing ratio of energy cost from SGA, WGA, and FGA, and the estimated reductions are summarized in Table 10.
Table 10.
Estimated reduction of energy cost.
5. Conclusions
In a water distribution system, the proportion of energy costs from using pumps at the WDN is high for the total cost. Energy cost (electricity) varies according to the season of year and the hours of a day. The water demand pattern is similar to the hourly energy cost curve, so high water demand occurs during high energy cost hours. In this study, under the assumption that energy cost reduction is possible through redistributing the demand pattern, a numerical analysis was conducted on transferring the water demand at peak energy cost hours to low energy cost hours by the storage facilities. This study was applied to a real facility, the Bupyeong 2 reservoir catchment, and produced the following conclusions.
The demand pattern was optimized using several methods, and the optimization was applied for the summer, winter, and spring–autumn seasons. The maximum energy cost savings from the optimization was 6.33% for the summer season. Only 37.6% of the total capacity of the storage facilities was being used, and 60% of storage capacity was still available for this study. This study confirms that it is possible to reduce energy costs by using electricity during the low-cost hours to fill storage facilities to be used during peak hours. In this study, the real capacity of the storage facilities in the study area was applied to redistribute the water demand from the peak hours to the low hours. The result of the energy cost reduction could be generalized throughout the water supply system and applied to the major procedures involved, such as pumping the water supply from the water treatment plant to the reservoir, using the water intake pump, and powering the boost pump to move water from the intake to the water treatment plant. In total, approximately 5.36% of energy cost could be reduced.
This study applied water demand patterns, pipe networks, storage facilities, and hourly varying electricity prices in a study area without special characteristics. An energy cost changes over time in many regions of the world and there are many water storage facilities that are not actively being used. Therefore, it is possible to apply this research to the other regions as a worldwide application for studies on energy savings, improvement of the water billing system or smart water grids. In addition, we studied energy costs and water demand among the water supply costs and, in further study, water tariffs can be an additional variable for energy savings since the low price of water tariffs can trigger over use of water.
Acknowledgments
This research was supported by the National Strategic Project-Carbon Upcycling of the National Research Foundation of Korea (NRF) funded by the Ministry of Science and ICT (MSIT), the Ministry of Environment (ME) and the Ministry of Trade, Industry and Energy (MOTIE) (2017M3D8A2090376).
Author Contributions
Yungyu Chang led the work performance and Yungyu Chang and Seongjoon Byeon wrote the manuscript; Gyewoon Choi and Juhwan Kim coordinated the research and contributed to writing the article; Seongjoon Byeon collected data and Yungyu Chang generated the result. All authors read and approved the final manuscript.
Conflicts of Interest
The authors declare no conflict of interest.
References
- OECD/IEA. Energy Policies of IEA Countries—The Republic of Korea 2012 Review; International Energy Agency: Paris, France, 2012. [Google Scholar]
- Fan, L.; Wang, F.; Liu, G.; Yang, X.; Qin, W. Public Perception of Water Consumption and Its Effects on Water Conservation Behavior. Water 2014, 6, 1771–1784. [Google Scholar] [CrossRef]
- K-Water. Development of Domestic Estimation Model for Rational Prediction of Water Use (1st Year); K-Water: Daejeon, Korea, 2007. [Google Scholar]
- Byeon, S.; Choi, G.; Maeng, S.; Gourbesville, P. Sustainable Water Distribution Strategy with Smart Water Grid. Sustainability 2015, 7, 4240–4259. [Google Scholar] [CrossRef]
- Woo, D.; Kim, S.; Shin, S.; Kim, J.; Jung, J. Water treatment process settings according to blending alternative resources in Smart Water Grid Research in Korea. In Proceedings of the Smart Water Grid International Conference, Incheon, Korea, 12–14 November 2013. [Google Scholar]
- Gonçalves, F.V.; Ramos, H.M.; Reis, L.F.R. Hybrid energy system evaluation in water supply system energy production: Neural network approach. Int. J. Energy Environ. 2010, 1, 10. [Google Scholar]
- Gorev, N.B.; Kodzhespirova, I.F. Noniterative Implementation of Pressure-Dependent Demands Using the Hydraulic Analysis Engine of EPANET 2. Water Resour. Manag. 2013, 27, 3623–3630. [Google Scholar] [CrossRef]
- Kim, J.; Kim, H.; Lee, D.; Kim, G. Analysis of water use characteristics by household demand monitoring. J. KSEE 2007, 29, 864–869. [Google Scholar]
- Kanakoudis, V.; Tsitsifli, S. Using the bimonthly water balance of a non-fully monitored water distribution network with seasonal water demand peaks to define its actual NRW level: The case of Kos town, Greece. Urban Water J. 2013, 11, 348–360. [Google Scholar] [CrossRef]
- Myoung, S.; Lee, D.; Kim, H.; Jo, J. A comparison of statistical prediction models in household water end-uses. Korean J. Appl. Stat. 2011, 24, 567–573. [Google Scholar] [CrossRef]
- Kim, J.; Lee, D.; Choi, D.; Bae, C.; Park, S. Leakage monitoring model by demand pattern analysis in water distribution systems. In Proceedings of the 2012 Korea Water Resources Association Annual Conference, Taebaek-si, Gangwon, Korea, 17–18 May 2012; pp. 479–483. [Google Scholar]
- Kanakoudis, V.; Gonelas, K. Analysis and calculation of the short and long run economic leakage level in a water distribution system. Water Util. J. 2016, 12, 57–66. [Google Scholar]
- Kanakoudis, V.; Gonelas, K. The joint effect of water price changes and pressure management, at the economic annual real losses level, on the system input volume of a water distribution system. Water Sci. Technol. Water Supply 2015, 15, 1069–1078. [Google Scholar] [CrossRef]
- Seo, J.S.; Lee, D.R.; Choi, S.J.; Kang, S.K. Change of water consumption results from water demand management. In Proceedings of the 2011 Annual Conference of Korea Water Resources Association, Daegu, Korea, 19–20 May 2011. [Google Scholar]
- Hwang, J.W.; Lee, H.D.; Choi, J.H.; Bae, C.H. Assessment of hydraulic behavior and water quality variation characteristics in underground reservoir of building. In Proceedings of the 2005 Annual Conference of Korean Society of Water and Wastewater, Gwangju, Korea, 10–11 November 2005; pp. 401–404. [Google Scholar]
- Kwak, P.J.; Hwang, J.W.; Kim, S.K.; Lee, H.D. Hydraulic behavior and water quality variation characteristics in underground reservoir. In Proceedings of the 2005 Annual Conference of Korean Society of Civil Engineers, Jeju, Korea, 20–21 October 2005; pp. 364–367. [Google Scholar]
- Kanakoudis, V.; Tolikas, D. The Role of Leaks and Breaks in Water Networks—Technical and Economical Solutions. J. Water Supply Res. Technol. 2001, 50, 301–311. [Google Scholar]
- Kanakoudis, V.; Tolikas, D. Assessing the Performance Level of a Water System. Water Air Soil Pollut. Focus 2004, 4, 307–318. [Google Scholar] [CrossRef]
- Kanakoudis, V.; Tsitsifli, S. Potable water security assessment—A review on monitoring, modelling and optimization techniques, applied to water distribution networks. Desalin. Water Treat. 2017, 99, 18–26. [Google Scholar] [CrossRef]
- Kanakoudis, V.; Gonelas, K. Developing a Methodology towards Full Water Cost Recovery in Urban Water Pipe Networks, based on the “User-pays” Principle. Procedia Eng. 2014, 70, 907–916. [Google Scholar] [CrossRef]
- Kanakoudis, V.; Gonelas, K.; Tolikas, D. Basic principles for urban water value assessment and price setting towards its full cost recovery—Pinpointing the role of the water losses. J. Water Supply Res. Technol. 2011, 60, 27–39. [Google Scholar] [CrossRef]
- Moon, S.I. The smart grid, future of electricity. Sci. Technol. 2009, 42, 56–59. [Google Scholar]
- Kanakoudis, V. Vulnerability based management of water resources systems. J. Hydroinform. 2004, 6, 133–156. [Google Scholar]
- Jeon, S. Problem and Measures to Improve Pricing System of Electricity; Korean National Assembly Budget Office: Seoul, Korea, 2013. [Google Scholar]
- Patelis, M.; Kanakoudis, V.; Gonelas, K. Combining pressure management and energy recovery benefits in a water distribution system installing PATs. J. Water Supply Res. Technol. 2017, 66, 520–527. [Google Scholar] [CrossRef]
- Eusuff, M.M.; Lansey, K.E. Optimization of water distribution network design using the shuffled frog leaping algorithm. J. Water Resour. Plan. Manag. 2003, 129, 210–225. [Google Scholar] [CrossRef]
- Patelis, M.; Kanakoudis, V.; Gonelas, K. Pressure management and energy recovery capabilities using PATs. Procedia Eng. 2016, 162, 503–510. [Google Scholar] [CrossRef]
- Savic, D.A.; Walters, G.A. Genetic Algorithms for the least-cost design of water distribution networks. J. Water Resour. Plan. Manag. 1997, 123, 67–77. [Google Scholar] [CrossRef]
- Rossman, L.A. Epanet 2 Users Manual; EPA/600/R-00/057; U.S. Environmental Protection Agency: Washington, DC, USA, 2000.
- Eliades, D.G.; Kyriakou, M.; Vrachimis, S.; Polycarpou, M.M. EPANET-MATLAB toolkit: An open-source software for interfacing EPANET with MATLAB. Zenodo 2017. [Google Scholar] [CrossRef]
- Korkana, P.; Kanakoudis, V.; Makrysopoulos, A.; Patelis, M.; Gonelas, K. Developing an optimization algorithm to form district metered areas in a water distribution system. Procedia Eng. 2016, 162, 530–536. [Google Scholar] [CrossRef][Green Version]
- Korkana, P.; Kanakoudis, V.; Patelis, M.; Gonelas, K. Forming District Metered Areas in a Water Distribution Network Using Genetic Algorithms. Procedia Eng. 2016, 162, 511–520. [Google Scholar] [CrossRef]
- Chondronasios, A.; Gonelas, K.; Kanakoudis, V.; Patelis, M.; Korkana, P. Optimizing DMAs’ formation in a water pipe network: The water aging and the operating pressure factors. J. Hydroinform. 2017, 19, 890–899. [Google Scholar] [CrossRef]
- Prasad, M.; Bajpai, R.; Shashidhara, L.S. Regulation of wingless and vestigial expression in wing and haltere discs of drosophila. Development 2003, 130, 1537–1547. [Google Scholar] [CrossRef] [PubMed]
- Prasad, T.D.; Park, N.S. Objective Genetic Algorithms for design of water distribution networks. J. Water Resour. Plan. Manag. 2004, 130, 73–82. [Google Scholar] [CrossRef]
- Deb, K.; Jain, H. An evolutionary many-objective optimization algorithm using reference-point-based nondominated sorting approach, part I: Solving problems with box constraints. IEEE Trans. Evolut. Comput. 2014, 18, 577–601. [Google Scholar] [CrossRef]
- Gutierrez-Antonio, C.; Briones-Ramirez, A. Pareto front of ideal petlyuk sequences using a multiobjective genetic algorithm with constraints. Comput. Chem. Eng. 2009, 33, 454–464. [Google Scholar] [CrossRef]
- Coello, A.C. Theoretical and Numerical Constraint-Handling Techniques Used with Evolutionary Algorithms: A Survey of the State of the Art. Comput. Methods Appl. Mech. Eng. 2002, 191, 1245–1287. [Google Scholar] [CrossRef]
- Jakob, W.; Blume, C. Pareto Optimization or Cascaded Weighted Sum: A Comparison of Concepts. Algorithms 2014, 7, 166–185. [Google Scholar] [CrossRef]


© 2018 by the authors. Licensee MDPI, Basel, Switzerland. This article is an open access article distributed under the terms and conditions of the Creative Commons Attribution (CC BY) license (http://creativecommons.org/licenses/by/4.0/).